Immigrants from Bulgaria vs Bulgarian Disability Age 35 to 64
COMPARE
Immigrants from Bulgaria
Bulgarian
Disability Age 35 to 64
Disability Age 35 to 64 Comparison
Immigrants from Bulgaria
Bulgarians
9.8%
DISABILITY AGE 35 TO 64
99.8/ 100
METRIC RATING
52nd/ 347
METRIC RANK
9.7%
DISABILITY AGE 35 TO 64
99.9/ 100
METRIC RATING
35th/ 347
METRIC RANK
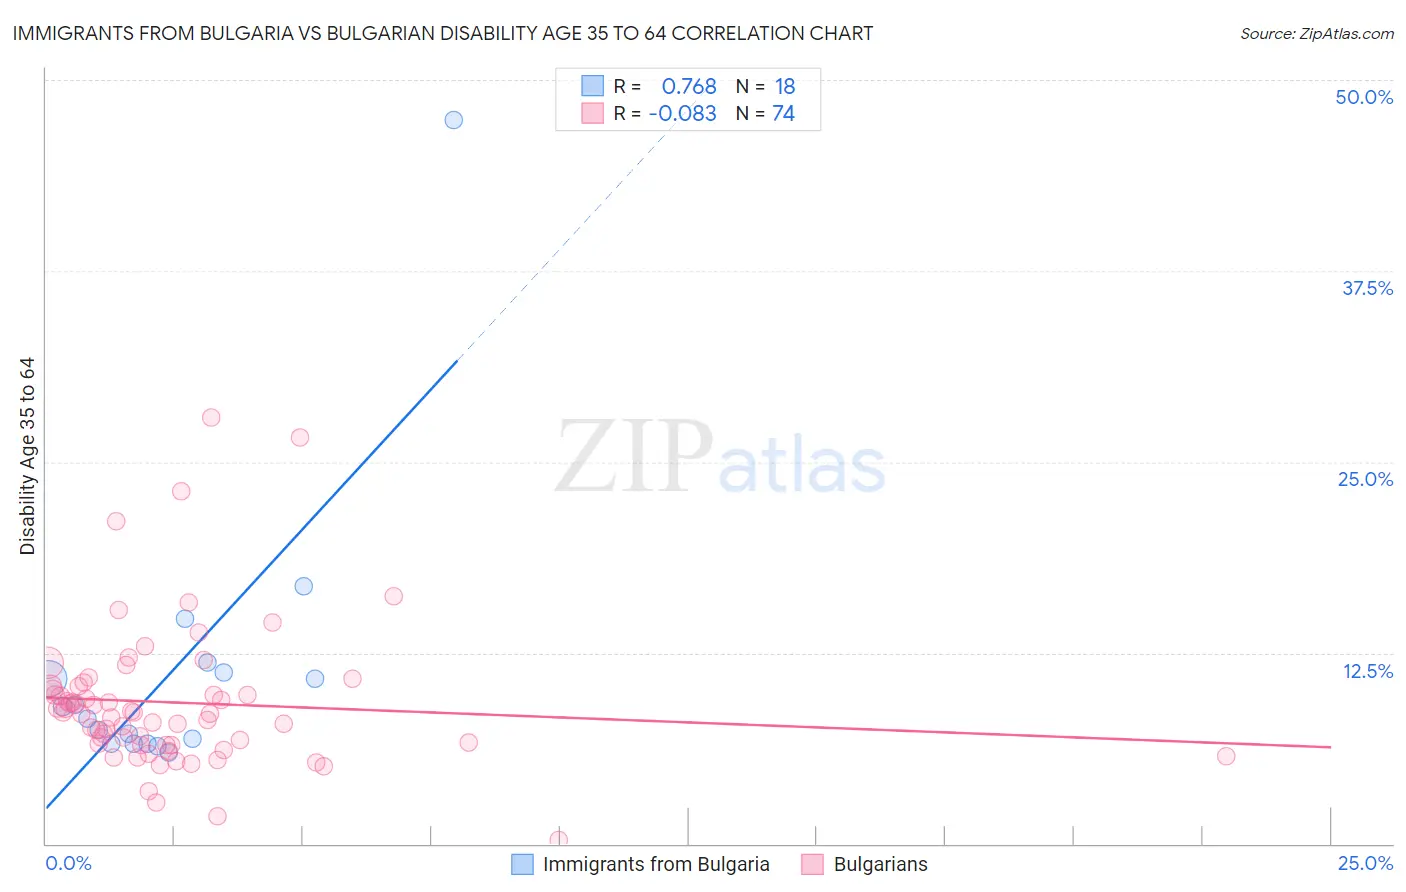
Immigrants from Bulgaria vs Bulgarian Disability Age 35 to 64 Correlation Chart
The statistical analysis conducted on geographies consisting of 172,533,865 people shows a strong positive correlation between the proportion of Immigrants from Bulgaria and percentage of population with a disability between the ages 34 and 64 in the United States with a correlation coefficient (R) of 0.768 and weighted average of 9.8%. Similarly, the statistical analysis conducted on geographies consisting of 205,563,326 people shows a slight negative correlation between the proportion of Bulgarians and percentage of population with a disability between the ages 34 and 64 in the United States with a correlation coefficient (R) of -0.083 and weighted average of 9.7%, a difference of 1.7%.
Disability Age 35 to 64 Correlation Summary
| Measurement | Immigrants from Bulgaria | Bulgarian |
| Minimum | 5.9% | 0.21% |
| Maximum | 47.4% | 27.9% |
| Range | 41.4% | 27.7% |
| Mean | 11.3% | 9.2% |
| Median | 8.6% | 8.6% |
| Interquartile 25% (IQ1) | 6.5% | 6.5% |
| Interquartile 75% (IQ3) | 11.2% | 10.3% |
| Interquartile Range (IQR) | 4.7% | 3.8% |
| Standard Deviation (Sample) | 9.5% | 4.8% |
| Standard Deviation (Population) | 9.2% | 4.8% |
Demographics Similar to Immigrants from Bulgaria and Bulgarians by Disability Age 35 to 64
In terms of disability age 35 to 64, the demographic groups most similar to Immigrants from Bulgaria are Bhutanese (9.8%, a difference of 0.010%), Taiwanese (9.8%, a difference of 0.060%), Paraguayan (9.8%, a difference of 0.10%), Immigrants from Greece (9.8%, a difference of 0.17%), and Immigrants from Serbia (9.8%, a difference of 0.21%). Similarly, the demographic groups most similar to Bulgarians are Immigrants from Cuba (9.7%, a difference of 0.040%), Immigrants from Australia (9.7%, a difference of 0.10%), Immigrants from Turkey (9.7%, a difference of 0.11%), Immigrants from Indonesia (9.7%, a difference of 0.17%), and Egyptian (9.7%, a difference of 0.18%).
| Demographics | Rating | Rank | Disability Age 35 to 64 |
| Immigrants | Indonesia | 99.9 /100 | #33 | Exceptional 9.7% |
| Immigrants | Australia | 99.9 /100 | #34 | Exceptional 9.7% |
| Bulgarians | 99.9 /100 | #35 | Exceptional 9.7% |
| Immigrants | Cuba | 99.9 /100 | #36 | Exceptional 9.7% |
| Immigrants | Turkey | 99.9 /100 | #37 | Exceptional 9.7% |
| Egyptians | 99.9 /100 | #38 | Exceptional 9.7% |
| Immigrants | Belarus | 99.9 /100 | #39 | Exceptional 9.7% |
| Immigrants | Armenia | 99.9 /100 | #40 | Exceptional 9.7% |
| Israelis | 99.9 /100 | #41 | Exceptional 9.7% |
| Immigrants | Malaysia | 99.9 /100 | #42 | Exceptional 9.7% |
| Immigrants | Colombia | 99.9 /100 | #43 | Exceptional 9.8% |
| Immigrants | Egypt | 99.9 /100 | #44 | Exceptional 9.8% |
| Immigrants | Peru | 99.9 /100 | #45 | Exceptional 9.8% |
| Cambodians | 99.8 /100 | #46 | Exceptional 9.8% |
| Immigrants | Belgium | 99.8 /100 | #47 | Exceptional 9.8% |
| Immigrants | Serbia | 99.8 /100 | #48 | Exceptional 9.8% |
| Immigrants | Greece | 99.8 /100 | #49 | Exceptional 9.8% |
| Paraguayans | 99.8 /100 | #50 | Exceptional 9.8% |
| Bhutanese | 99.8 /100 | #51 | Exceptional 9.8% |
| Immigrants | Bulgaria | 99.8 /100 | #52 | Exceptional 9.8% |
| Taiwanese | 99.8 /100 | #53 | Exceptional 9.8% |