Immigrants from Belize vs Immigrants from Eastern Asia Female Disability

COMPARE

Immigrants from Belize
Race
Ancestry
AfghanAfricanAlaska NativeAlaskan AthabascanAlbanianAleutAlsatianAmericanApacheArabArapahoArgentineanArmenianAssyrian/Chaldean/SyriacAustralianAustrianBahamianBangladeshiBarbadianBasqueBelgianBelizeanBermudanBhutaneseBlackfeetBolivianBrazilianBritishBritish West IndianBulgarianBurmeseCajunCambodianCanadianCape VerdeanCarpatho RusynCelticCentral AmericanCentral American IndianCherokeeCheyenneChickasawChileanChineseChippewaChoctawColombianColvilleComancheCosta RicanCreeCreekCroatianCrowCubanCypriotCzechCzechoslovakianDanishDelawareDominicanDutchDutch West IndianEastern EuropeanEcuadorianEgyptianEnglishEstonianEthiopianEuropeanFijianFilipinoFinnishFrenchFrench American IndianFrench CanadianGermanGerman RussianGhanaianGreekGuamanian/ChamorroGuatemalanGuyaneseHaitianHmongHonduranHopiHoumaHungarianIcelanderIndian (Asian)IndonesianInupiatIranianIraqiIrishIroquoisIsraeliItalianJamaicanJapaneseJordanianKenyanKiowaKoreanLaotianLatvianLebaneseLiberianLithuanianLumbeeLuxembourgerMacedonianMalaysianMalteseMarshalleseMenomineeMexicanMexican American IndianMongolianMoroccanNative HawaiianNavajoNepaleseNew ZealanderNicaraguanNigerianNorthern EuropeanNorwegianOkinawanOsageOttawaPaiutePakistaniPalestinianPanamanianParaguayanPennsylvania GermanPeruvianPimaPolishPortuguesePotawatomiPuebloPuerto RicanPuget Sound SalishRomanianRussianSalvadoranSamoanScandinavianScotch-IrishScottishSeminoleSenegaleseSerbianShoshoneSierra LeoneanSiouxSlavicSlovakSloveneSomaliSouth AfricanSouth AmericanSouth American IndianSoviet UnionSpaniardSpanishSpanish AmericanSpanish American IndianSri LankanSubsaharan AfricanSudaneseSwedishSwissSyrianTaiwaneseThaiTlingit-HaidaTohono O'OdhamTonganTrinidadian and TobagonianTsimshianTurkishU.S. Virgin IslanderUgandanUkrainianUruguayanUteVenezuelanVietnameseWelshWest IndianYakamaYaquiYugoslavianYumanYup'ikZimbabwean
Immigration
NonimmigrantsImmigrantsAfghanistanAfricaAlbaniaArgentinaArmeniaAsiaAustraliaAustriaBahamasBangladeshBarbadosBelarusBelgiumBelizeBoliviaBosnia and HerzegovinaBrazilBulgariaBurma/MyanmarCabo VerdeCambodiaCameroonCanadaCaribbeanCentral AmericaChileChinaColombiaCongoCosta RicaCroatiaCubaCzechoslovakiaDenmarkDominicaDominican RepublicEastern AfricaEastern EuropeEcuadorEgyptEl SalvadorEnglandEritreaEthiopiaEuropeFijiFranceGermanyGhanaGreeceGrenadaGuatemalaGuyanaHaitiHondurasHong KongHungaryIndiaIndonesiaIranIraqIrelandIsraelItalyJamaicaJapanJordanKazakhstanKenyaKoreaKuwaitLaosLatin AmericaLatviaLebanonLiberiaLithuaniaMalaysiaMexicoMicronesiaMiddle AfricaMoldovaMoroccoNepalNetherlandsNicaraguaNigeriaNorth AmericaNorth MacedoniaNorthern AfricaNorthern EuropeNorwayOceaniaPakistanPanamaPeruPhilippinesPolandPortugalRomaniaRussiaSaudi ArabiaScotlandSenegalSerbiaSierra LeoneSingaporeSomaliaSouth AfricaSouth AmericaSouth Central AsiaSouth Eastern AsiaSouthern EuropeSpainSri LankaSt. Vincent and the GrenadinesSudanSwedenSwitzerlandSyriaTaiwanThailandTrinidad and TobagoTurkeyUgandaUkraineUruguayUzbekistanVenezuelaVietnamWest IndiesWestern AfricaWestern AsiaWestern EuropeYemenZaireZimbabweAzores
Immigrants from Eastern Asia
Race
Ancestry
AfghanAfricanAlaska NativeAlaskan AthabascanAlbanianAleutAlsatianAmericanApacheArabArapahoArgentineanArmenianAssyrian/Chaldean/SyriacAustralianAustrianBahamianBangladeshiBarbadianBasqueBelgianBelizeanBermudanBhutaneseBlackfeetBolivianBrazilianBritishBritish West IndianBulgarianBurmeseCajunCambodianCanadianCape VerdeanCarpatho RusynCelticCentral AmericanCentral American IndianCherokeeCheyenneChickasawChileanChineseChippewaChoctawColombianColvilleComancheCosta RicanCreeCreekCroatianCrowCubanCypriotCzechCzechoslovakianDanishDelawareDominicanDutchDutch West IndianEastern EuropeanEcuadorianEgyptianEnglishEstonianEthiopianEuropeanFijianFilipinoFinnishFrenchFrench American IndianFrench CanadianGermanGerman RussianGhanaianGreekGuamanian/ChamorroGuatemalanGuyaneseHaitianHmongHonduranHopiHoumaHungarianIcelanderIndian (Asian)IndonesianInupiatIranianIraqiIrishIroquoisIsraeliItalianJamaicanJapaneseJordanianKenyanKiowaKoreanLaotianLatvianLebaneseLiberianLithuanianLumbeeLuxembourgerMacedonianMalaysianMalteseMarshalleseMenomineeMexicanMexican American IndianMongolianMoroccanNative HawaiianNavajoNepaleseNew ZealanderNicaraguanNigerianNorthern EuropeanNorwegianOkinawanOsageOttawaPaiutePakistaniPalestinianPanamanianParaguayanPennsylvania GermanPeruvianPimaPolishPortuguesePotawatomiPuebloPuerto RicanPuget Sound SalishRomanianRussianSalvadoranSamoanScandinavianScotch-IrishScottishSeminoleSenegaleseSerbianShoshoneSierra LeoneanSiouxSlavicSlovakSloveneSomaliSouth AfricanSouth AmericanSouth American IndianSoviet UnionSpaniardSpanishSpanish AmericanSpanish American IndianSri LankanSubsaharan AfricanSudaneseSwedishSwissSyrianTaiwaneseThaiTlingit-HaidaTohono O'OdhamTonganTrinidadian and TobagonianTsimshianTurkishU.S. Virgin IslanderUgandanUkrainianUruguayanUteVenezuelanVietnameseWelshWest IndianYakamaYaquiYugoslavianYumanYup'ikZimbabwean
Immigration
NonimmigrantsImmigrantsAfghanistanAfricaAlbaniaArgentinaArmeniaAsiaAustraliaAustriaBahamasBangladeshBarbadosBelarusBelgiumBoliviaBosnia and HerzegovinaBrazilBulgariaBurma/MyanmarCabo VerdeCambodiaCameroonCanadaCaribbeanCentral AmericaChileChinaColombiaCongoCosta RicaCroatiaCubaCzechoslovakiaDenmarkDominicaDominican RepublicEastern AfricaEastern AsiaEastern EuropeEcuadorEgyptEl SalvadorEnglandEritreaEthiopiaEuropeFijiFranceGermanyGhanaGreeceGrenadaGuatemalaGuyanaHaitiHondurasHong KongHungaryIndiaIndonesiaIranIraqIrelandIsraelItalyJamaicaJapanJordanKazakhstanKenyaKoreaKuwaitLaosLatin AmericaLatviaLebanonLiberiaLithuaniaMalaysiaMexicoMicronesiaMiddle AfricaMoldovaMoroccoNepalNetherlandsNicaraguaNigeriaNorth AmericaNorth MacedoniaNorthern AfricaNorthern EuropeNorwayOceaniaPakistanPanamaPeruPhilippinesPolandPortugalRomaniaRussiaSaudi ArabiaScotlandSenegalSerbiaSierra LeoneSingaporeSomaliaSouth AfricaSouth AmericaSouth Central AsiaSouth Eastern AsiaSouthern EuropeSpainSri LankaSt. Vincent and the GrenadinesSudanSwedenSwitzerlandSyriaTaiwanThailandTrinidad and TobagoTurkeyUgandaUkraineUruguayUzbekistanVenezuelaVietnamWest IndiesWestern AfricaWestern AsiaWestern EuropeYemenZaireZimbabweAzores
Female Disability
Income
Poverty
Unemployment
Labor Participation
Family Structure
Vehicle Availability
Education Level
Disability

Female Disability Comparison

Immigrants from Belize

Immigrants from Eastern Asia

Tragic
Exceptional
12.5%
FEMALE DISABILITY
7.0/ 100
METRIC RATING
230th/ 347
METRIC RANK
10.7%
FEMALE DISABILITY
100.0/ 100
METRIC RATING
13th/ 347
METRIC RANK

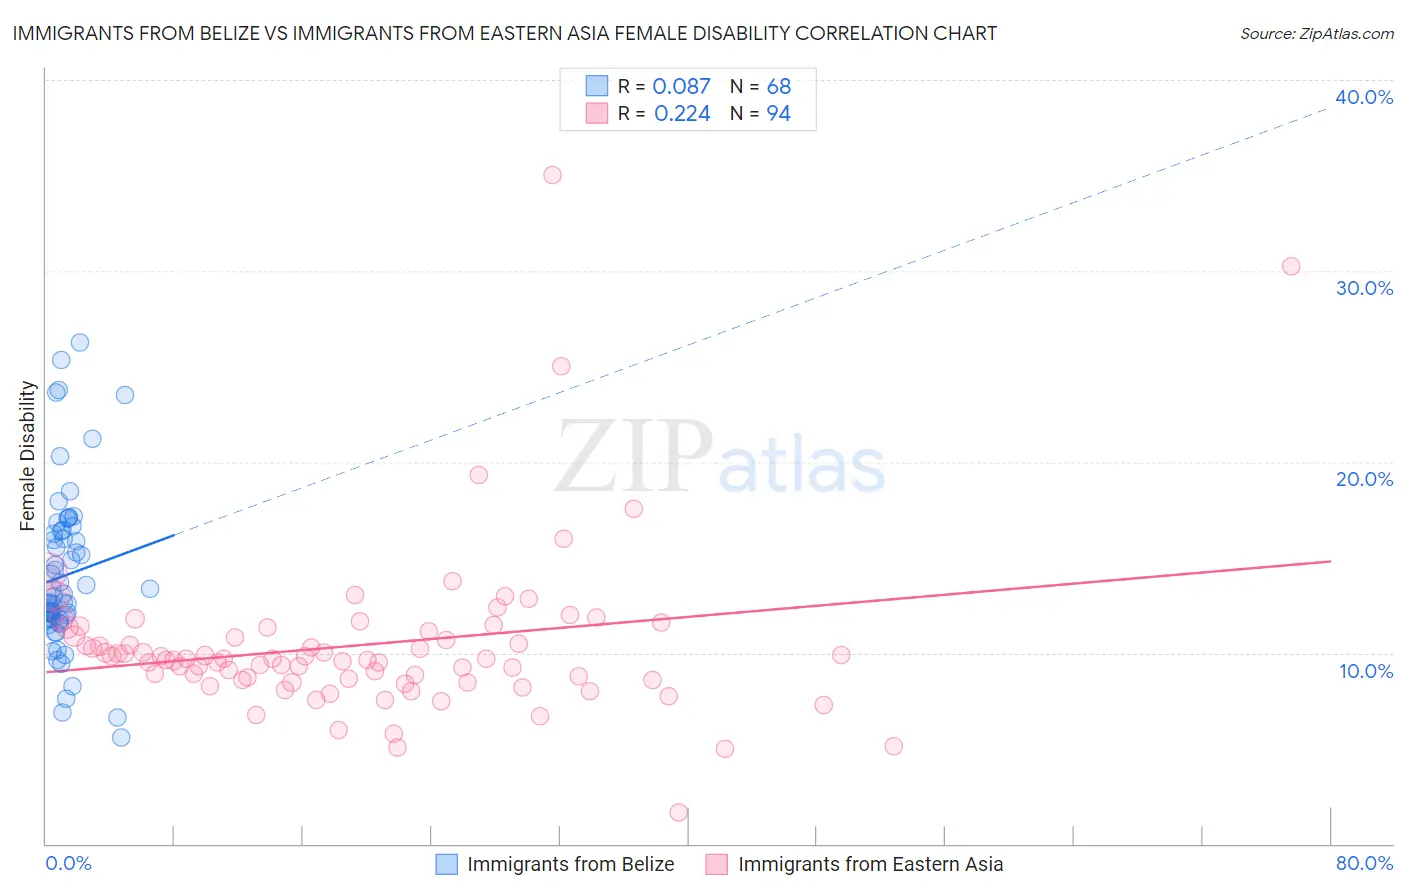
Immigrants from Belize vs Immigrants from Eastern Asia Female Disability Correlation Chart

The statistical analysis conducted on geographies consisting of 130,293,394 people shows a slight positive correlation between the proportion of Immigrants from Belize and percentage of females with a disability in the United States with a correlation coefficient (R) of 0.087 and weighted average of 12.5%. Similarly, the statistical analysis conducted on geographies consisting of 499,845,203 people shows a weak positive correlation between the proportion of Immigrants from Eastern Asia and percentage of females with a disability in the United States with a correlation coefficient (R) of 0.224 and weighted average of 10.7%, a difference of 16.9%.
Immigrants from Belize vs Immigrants from Eastern Asia Female Disability

Female Disability Correlation Summary

MeasurementImmigrants from BelizeImmigrants from Eastern Asia
Minimum5.5%1.6%
Maximum26.2%35.0%
Range20.7%33.4%
Mean14.0%10.4%
Median12.8%9.7%
Interquartile 25% (IQ1)11.8%8.6%
Interquartile 75% (IQ3)16.3%11.2%
Interquartile Range (IQR)4.5%2.6%
Standard Deviation (Sample)4.3%4.4%
Standard Deviation (Population)4.2%4.4%

Similar Demographics by Female Disability

Demographics Similar to Immigrants from Belize by Female Disability

In terms of female disability, the demographic groups most similar to Immigrants from Belize are Hungarian (12.5%, a difference of 0.030%), Belgian (12.5%, a difference of 0.070%), Immigrants from Cambodia (12.5%, a difference of 0.11%), Assyrian/Chaldean/Syriac (12.5%, a difference of 0.13%), and Hispanic or Latino (12.5%, a difference of 0.14%).
DemographicsRating | RankFemale Disability
Guamanians/Chamorros
9.5
/100
|
#223
Tragic
12.5%
Belizeans
9.3
/100
|
#224
Tragic
12.5%
Poles
8.4
/100
|
#225
Tragic
12.5%
Hispanics or Latinos
8.0
/100
|
#226
Tragic
12.5%
Assyrians/Chaldeans/Syriacs
8.0
/100
|
#227
Tragic
12.5%
Immigrants | Cambodia
7.8
/100
|
#228
Tragic
12.5%
Hungarians
7.2
/100
|
#229
Tragic
12.5%
Immigrants | Belize
7.0
/100
|
#230
Tragic
12.5%
Belgians
6.5
/100
|
#231
Tragic
12.5%
Immigrants | Somalia
5.9
/100
|
#232
Tragic
12.5%
Immigrants | Iraq
5.3
/100
|
#233
Tragic
12.5%
Scandinavians
5.3
/100
|
#234
Tragic
12.5%
Malaysians
5.0
/100
|
#235
Tragic
12.5%
Immigrants | West Indies
4.4
/100
|
#236
Tragic
12.6%
Slavs
3.8
/100
|
#237
Tragic
12.6%

Demographics Similar to Immigrants from Eastern Asia by Female Disability

In terms of female disability, the demographic groups most similar to Immigrants from Eastern Asia are Immigrants from China (10.7%, a difference of 0.040%), Immigrants from Israel (10.7%, a difference of 0.070%), Immigrants from Korea (10.6%, a difference of 0.49%), Burmese (10.7%, a difference of 0.54%), and Okinawan (10.8%, a difference of 0.61%).
DemographicsRating | RankFemale Disability
Bolivians
100.0
/100
|
#6
Exceptional
10.4%
Immigrants | Singapore
100.0
/100
|
#7
Exceptional
10.4%
Immigrants | South Central Asia
100.0
/100
|
#8
Exceptional
10.5%
Iranians
100.0
/100
|
#9
Exceptional
10.6%
Immigrants | Hong Kong
100.0
/100
|
#10
Exceptional
10.6%
Immigrants | Korea
100.0
/100
|
#11
Exceptional
10.6%
Immigrants | Israel
100.0
/100
|
#12
Exceptional
10.7%
Immigrants | Eastern Asia
100.0
/100
|
#13
Exceptional
10.7%
Immigrants | China
100.0
/100
|
#14
Exceptional
10.7%
Burmese
100.0
/100
|
#15
Exceptional
10.7%
Okinawans
100.0
/100
|
#16
Exceptional
10.8%
Indians (Asian)
100.0
/100
|
#17
Exceptional
10.8%
Immigrants | Iran
100.0
/100
|
#18
Exceptional
10.8%
Immigrants | Venezuela
100.0
/100
|
#19
Exceptional
10.9%
Immigrants | Pakistan
100.0
/100
|
#20
Exceptional
10.9%