Immigrants from Belgium vs Czechoslovakian Male Disability
COMPARE
Immigrants from Belgium
Czechoslovakian
Male Disability
Male Disability Comparison
Immigrants from Belgium
Czechoslovakians
10.8%
MALE DISABILITY
94.2/ 100
METRIC RATING
108th/ 347
METRIC RANK
12.3%
MALE DISABILITY
0.1/ 100
METRIC RATING
269th/ 347
METRIC RANK
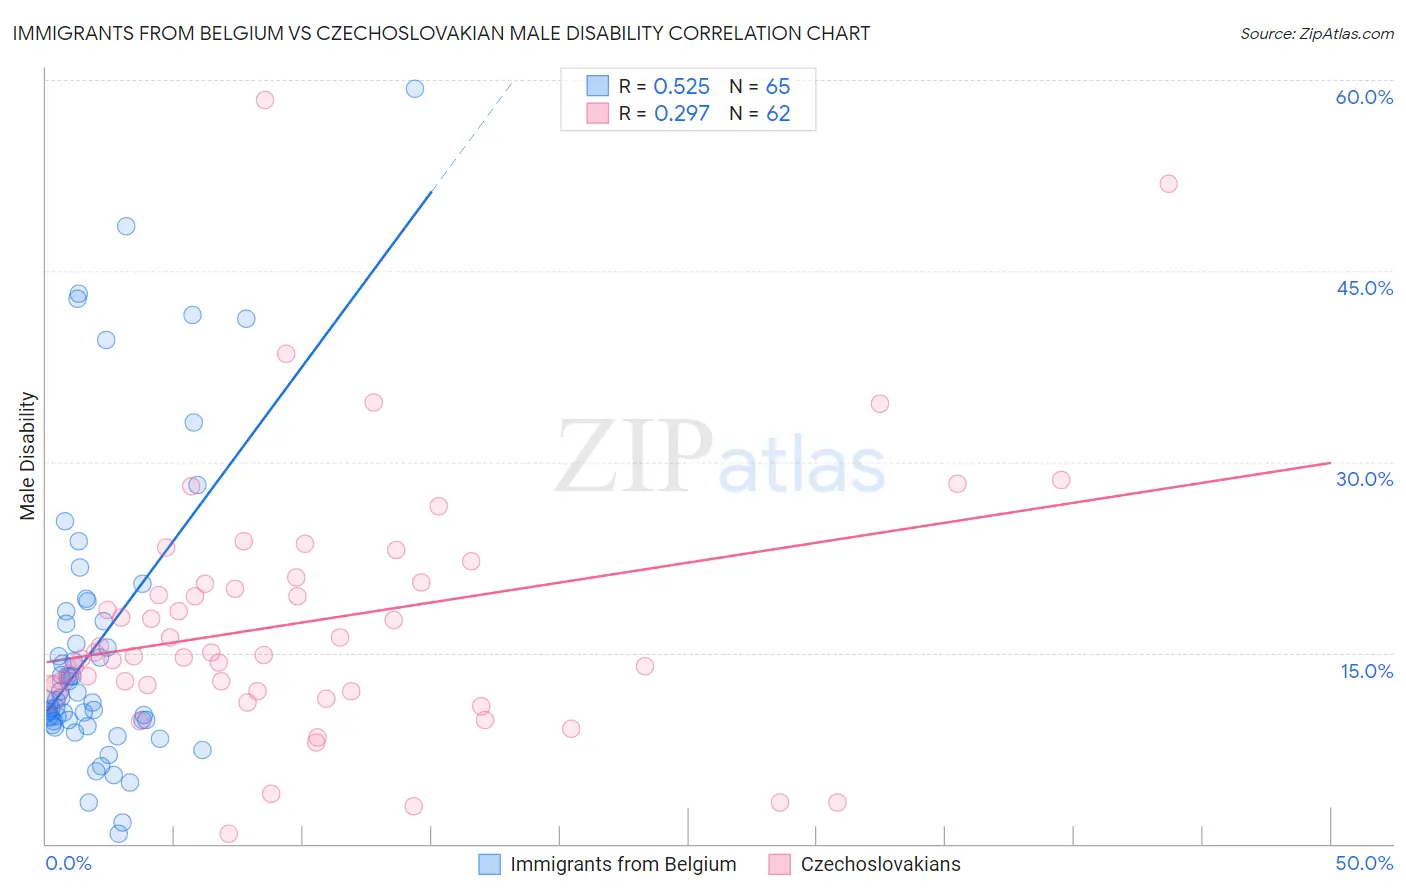
Immigrants from Belgium vs Czechoslovakian Male Disability Correlation Chart
The statistical analysis conducted on geographies consisting of 146,717,814 people shows a substantial positive correlation between the proportion of Immigrants from Belgium and percentage of males with a disability in the United States with a correlation coefficient (R) of 0.525 and weighted average of 10.8%. Similarly, the statistical analysis conducted on geographies consisting of 368,653,122 people shows a weak positive correlation between the proportion of Czechoslovakians and percentage of males with a disability in the United States with a correlation coefficient (R) of 0.297 and weighted average of 12.3%, a difference of 13.9%.
Male Disability Correlation Summary
| Measurement | Immigrants from Belgium | Czechoslovakian |
| Minimum | 0.83% | 0.83% |
| Maximum | 59.3% | 58.5% |
| Range | 58.5% | 57.6% |
| Mean | 15.9% | 17.5% |
| Median | 11.3% | 14.9% |
| Interquartile 25% (IQ1) | 9.7% | 12.0% |
| Interquartile 75% (IQ3) | 17.9% | 20.6% |
| Interquartile Range (IQR) | 8.2% | 8.5% |
| Standard Deviation (Sample) | 11.9% | 10.3% |
| Standard Deviation (Population) | 11.8% | 10.2% |
Similar Demographics by Male Disability
Demographics Similar to Immigrants from Belgium by Male Disability
In terms of male disability, the demographic groups most similar to Immigrants from Belgium are Immigrants from Eastern Africa (10.8%, a difference of 0.020%), Immigrants from Uganda (10.8%, a difference of 0.050%), Immigrants (10.8%, a difference of 0.080%), Immigrants from Uruguay (10.8%, a difference of 0.11%), and Immigrants from Syria (10.8%, a difference of 0.19%).
| Demographics | Rating | Rank | Male Disability |
| Immigrants | Greece | 95.6 /100 | #101 | Exceptional 10.7% |
| Immigrants | Eastern Europe | 95.3 /100 | #102 | Exceptional 10.7% |
| Uruguayans | 95.3 /100 | #103 | Exceptional 10.7% |
| Immigrants | Nigeria | 95.1 /100 | #104 | Exceptional 10.8% |
| Immigrants | Brazil | 95.0 /100 | #105 | Exceptional 10.8% |
| Immigrants | Syria | 94.9 /100 | #106 | Exceptional 10.8% |
| Immigrants | Eastern Africa | 94.3 /100 | #107 | Exceptional 10.8% |
| Immigrants | Belgium | 94.2 /100 | #108 | Exceptional 10.8% |
| Immigrants | Uganda | 94.0 /100 | #109 | Exceptional 10.8% |
| Immigrants | Immigrants | 93.9 /100 | #110 | Exceptional 10.8% |
| Immigrants | Uruguay | 93.8 /100 | #111 | Exceptional 10.8% |
| Ghanaians | 93.4 /100 | #112 | Exceptional 10.8% |
| Immigrants | Zimbabwe | 93.0 /100 | #113 | Exceptional 10.8% |
| Central Americans | 92.7 /100 | #114 | Exceptional 10.8% |
| Immigrants | Barbados | 92.2 /100 | #115 | Exceptional 10.8% |
Demographics Similar to Czechoslovakians by Male Disability
In terms of male disability, the demographic groups most similar to Czechoslovakians are Portuguese (12.3%, a difference of 0.0%), Spaniard (12.3%, a difference of 0.080%), Immigrants from Germany (12.3%, a difference of 0.13%), Hawaiian (12.3%, a difference of 0.18%), and Immigrants from Portugal (12.3%, a difference of 0.19%).
| Demographics | Rating | Rank | Male Disability |
| Norwegians | 0.2 /100 | #262 | Tragic 12.2% |
| Canadians | 0.2 /100 | #263 | Tragic 12.2% |
| Nepalese | 0.2 /100 | #264 | Tragic 12.2% |
| Immigrants | Portugal | 0.1 /100 | #265 | Tragic 12.3% |
| Hawaiians | 0.1 /100 | #266 | Tragic 12.3% |
| Immigrants | Germany | 0.1 /100 | #267 | Tragic 12.3% |
| Portuguese | 0.1 /100 | #268 | Tragic 12.3% |
| Czechoslovakians | 0.1 /100 | #269 | Tragic 12.3% |
| Spaniards | 0.1 /100 | #270 | Tragic 12.3% |
| Scandinavians | 0.1 /100 | #271 | Tragic 12.3% |
| Hmong | 0.0 /100 | #272 | Tragic 12.5% |
| Native Hawaiians | 0.0 /100 | #273 | Tragic 12.5% |
| Hopi | 0.0 /100 | #274 | Tragic 12.5% |
| Fijians | 0.0 /100 | #275 | Tragic 12.6% |
| Africans | 0.0 /100 | #276 | Tragic 12.6% |