Immigrants from Belarus vs Finnish Disability Age 18 to 34
COMPARE
Immigrants from Belarus
Finnish
Disability Age 18 to 34
Disability Age 18 to 34 Comparison
Immigrants from Belarus
Finns
5.9%
DISABILITY AGE 18 TO 34
99.8/ 100
METRIC RATING
49th/ 347
METRIC RANK
7.8%
DISABILITY AGE 18 TO 34
0.0/ 100
METRIC RATING
310th/ 347
METRIC RANK
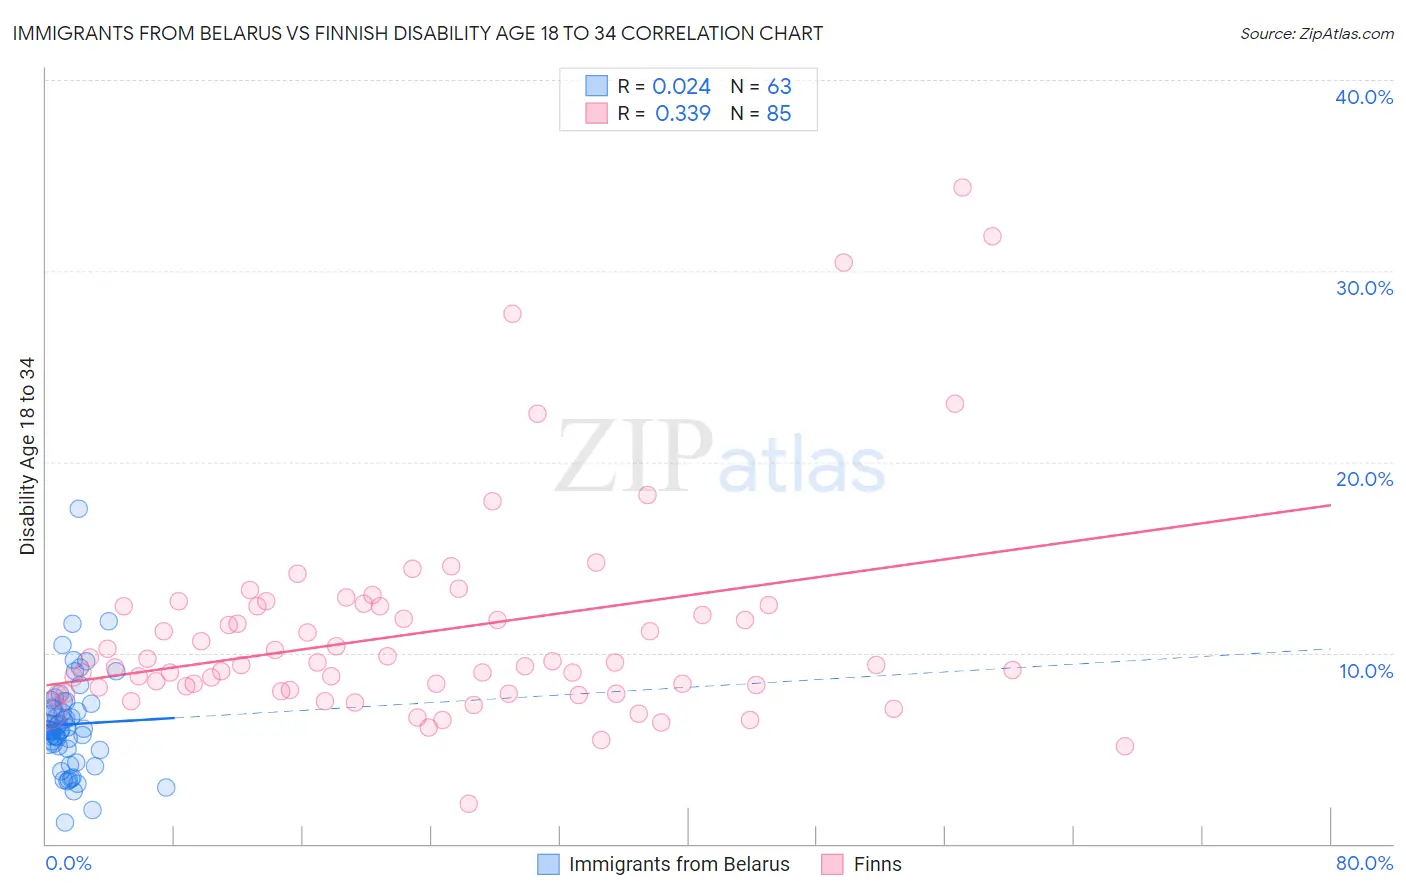
Immigrants from Belarus vs Finnish Disability Age 18 to 34 Correlation Chart
The statistical analysis conducted on geographies consisting of 150,056,630 people shows no correlation between the proportion of Immigrants from Belarus and percentage of population with a disability between the ages 18 and 35 in the United States with a correlation coefficient (R) of 0.024 and weighted average of 5.9%. Similarly, the statistical analysis conducted on geographies consisting of 403,137,976 people shows a mild positive correlation between the proportion of Finns and percentage of population with a disability between the ages 18 and 35 in the United States with a correlation coefficient (R) of 0.339 and weighted average of 7.8%, a difference of 32.3%.
Disability Age 18 to 34 Correlation Summary
| Measurement | Immigrants from Belarus | Finnish |
| Minimum | 1.1% | 2.1% |
| Maximum | 17.5% | 34.4% |
| Range | 16.4% | 32.3% |
| Mean | 6.3% | 11.1% |
| Median | 6.0% | 9.4% |
| Interquartile 25% (IQ1) | 4.9% | 8.0% |
| Interquartile 75% (IQ3) | 7.3% | 12.4% |
| Interquartile Range (IQR) | 2.4% | 4.4% |
| Standard Deviation (Sample) | 2.6% | 5.6% |
| Standard Deviation (Population) | 2.6% | 5.6% |
Similar Demographics by Disability Age 18 to 34
Demographics Similar to Immigrants from Belarus by Disability Age 18 to 34
In terms of disability age 18 to 34, the demographic groups most similar to Immigrants from Belarus are Immigrants from El Salvador (5.9%, a difference of 0.040%), Egyptian (5.9%, a difference of 0.040%), Immigrants from Trinidad and Tobago (5.9%, a difference of 0.10%), Okinawan (5.9%, a difference of 0.18%), and Immigrants from Indonesia (5.9%, a difference of 0.32%).
| Demographics | Rating | Rank | Disability Age 18 to 34 |
| Colombians | 99.8 /100 | #42 | Exceptional 5.9% |
| South Americans | 99.8 /100 | #43 | Exceptional 5.9% |
| Immigrants | Asia | 99.8 /100 | #44 | Exceptional 5.9% |
| Immigrants | Peru | 99.8 /100 | #45 | Exceptional 5.9% |
| Immigrants | Korea | 99.8 /100 | #46 | Exceptional 5.9% |
| Immigrants | Egypt | 99.8 /100 | #47 | Exceptional 5.9% |
| Immigrants | Trinidad and Tobago | 99.8 /100 | #48 | Exceptional 5.9% |
| Immigrants | Belarus | 99.8 /100 | #49 | Exceptional 5.9% |
| Immigrants | El Salvador | 99.8 /100 | #50 | Exceptional 5.9% |
| Egyptians | 99.8 /100 | #51 | Exceptional 5.9% |
| Okinawans | 99.7 /100 | #52 | Exceptional 5.9% |
| Immigrants | Indonesia | 99.7 /100 | #53 | Exceptional 5.9% |
| Immigrants | Malaysia | 99.7 /100 | #54 | Exceptional 5.9% |
| Immigrants | Spain | 99.7 /100 | #55 | Exceptional 5.9% |
| Paraguayans | 99.7 /100 | #56 | Exceptional 5.9% |
Demographics Similar to Finns by Disability Age 18 to 34
In terms of disability age 18 to 34, the demographic groups most similar to Finns are Alaska Native (7.8%, a difference of 0.060%), Pennsylvania German (7.8%, a difference of 0.070%), Scotch-Irish (7.8%, a difference of 0.10%), English (7.8%, a difference of 0.35%), and Menominee (7.8%, a difference of 0.44%).
| Demographics | Rating | Rank | Disability Age 18 to 34 |
| Cheyenne | 0.0 /100 | #303 | Tragic 7.7% |
| Shoshone | 0.0 /100 | #304 | Tragic 7.8% |
| Menominee | 0.0 /100 | #305 | Tragic 7.8% |
| English | 0.0 /100 | #306 | Tragic 7.8% |
| Scotch-Irish | 0.0 /100 | #307 | Tragic 7.8% |
| Pennsylvania Germans | 0.0 /100 | #308 | Tragic 7.8% |
| Alaska Natives | 0.0 /100 | #309 | Tragic 7.8% |
| Finns | 0.0 /100 | #310 | Tragic 7.8% |
| French | 0.0 /100 | #311 | Tragic 7.9% |
| Spanish Americans | 0.0 /100 | #312 | Tragic 7.9% |
| Iroquois | 0.0 /100 | #313 | Tragic 7.9% |
| Colville | 0.0 /100 | #314 | Tragic 7.9% |
| Americans | 0.0 /100 | #315 | Tragic 8.0% |
| Puerto Ricans | 0.0 /100 | #316 | Tragic 8.0% |
| Hmong | 0.0 /100 | #317 | Tragic 8.1% |