Immigrants from Asia vs Native Hawaiian Disability Age 18 to 34
COMPARE
Immigrants from Asia
Native Hawaiian
Disability Age 18 to 34
Disability Age 18 to 34 Comparison
Immigrants from Asia
Native Hawaiians
5.9%
DISABILITY AGE 18 TO 34
99.8/ 100
METRIC RATING
44th/ 347
METRIC RANK
6.6%
DISABILITY AGE 18 TO 34
50.0/ 100
METRIC RATING
174th/ 347
METRIC RANK
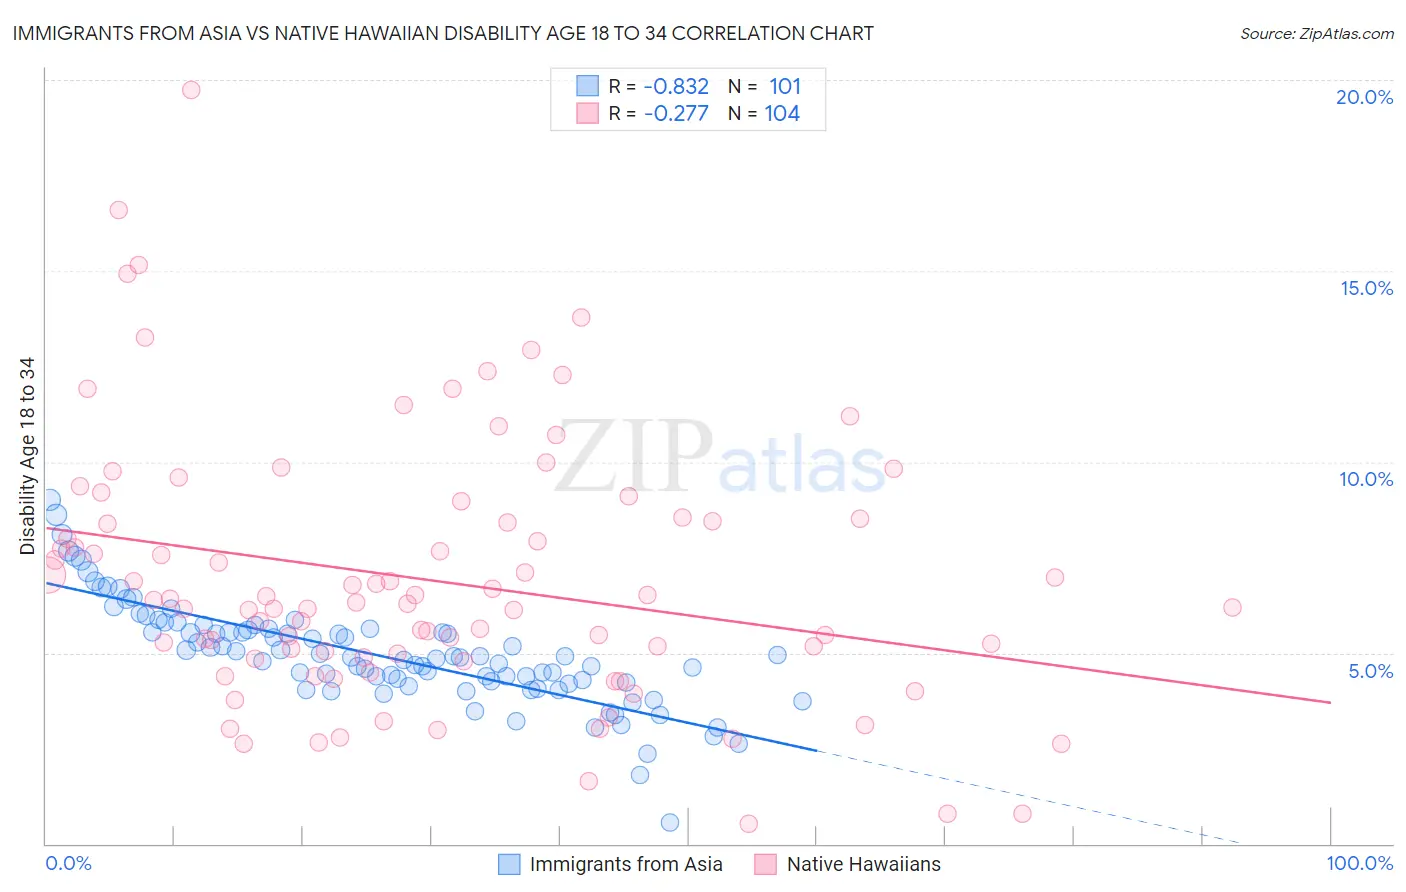
Immigrants from Asia vs Native Hawaiian Disability Age 18 to 34 Correlation Chart
The statistical analysis conducted on geographies consisting of 545,692,301 people shows a very strong negative correlation between the proportion of Immigrants from Asia and percentage of population with a disability between the ages 18 and 35 in the United States with a correlation coefficient (R) of -0.832 and weighted average of 5.9%. Similarly, the statistical analysis conducted on geographies consisting of 331,479,390 people shows a weak negative correlation between the proportion of Native Hawaiians and percentage of population with a disability between the ages 18 and 35 in the United States with a correlation coefficient (R) of -0.277 and weighted average of 6.6%, a difference of 12.6%.
Disability Age 18 to 34 Correlation Summary
| Measurement | Immigrants from Asia | Native Hawaiian |
| Minimum | 0.56% | 0.54% |
| Maximum | 9.0% | 19.7% |
| Range | 8.4% | 19.2% |
| Mean | 4.9% | 6.9% |
| Median | 4.9% | 6.3% |
| Interquartile 25% (IQ1) | 4.2% | 4.8% |
| Interquartile 75% (IQ3) | 5.6% | 8.5% |
| Interquartile Range (IQR) | 1.4% | 3.6% |
| Standard Deviation (Sample) | 1.4% | 3.4% |
| Standard Deviation (Population) | 1.3% | 3.4% |
Similar Demographics by Disability Age 18 to 34
Demographics Similar to Immigrants from Asia by Disability Age 18 to 34
In terms of disability age 18 to 34, the demographic groups most similar to Immigrants from Asia are South American (5.9%, a difference of 0.020%), Colombian (5.9%, a difference of 0.040%), Immigrants from Peru (5.9%, a difference of 0.13%), Nicaraguan (5.8%, a difference of 0.25%), and Immigrants from Korea (5.9%, a difference of 0.26%).
| Demographics | Rating | Rank | Disability Age 18 to 34 |
| Armenians | 99.9 /100 | #37 | Exceptional 5.8% |
| Immigrants | South America | 99.9 /100 | #38 | Exceptional 5.8% |
| Asians | 99.9 /100 | #39 | Exceptional 5.8% |
| Bolivians | 99.9 /100 | #40 | Exceptional 5.8% |
| Nicaraguans | 99.9 /100 | #41 | Exceptional 5.8% |
| Colombians | 99.8 /100 | #42 | Exceptional 5.9% |
| South Americans | 99.8 /100 | #43 | Exceptional 5.9% |
| Immigrants | Asia | 99.8 /100 | #44 | Exceptional 5.9% |
| Immigrants | Peru | 99.8 /100 | #45 | Exceptional 5.9% |
| Immigrants | Korea | 99.8 /100 | #46 | Exceptional 5.9% |
| Immigrants | Egypt | 99.8 /100 | #47 | Exceptional 5.9% |
| Immigrants | Trinidad and Tobago | 99.8 /100 | #48 | Exceptional 5.9% |
| Immigrants | Belarus | 99.8 /100 | #49 | Exceptional 5.9% |
| Immigrants | El Salvador | 99.8 /100 | #50 | Exceptional 5.9% |
| Egyptians | 99.8 /100 | #51 | Exceptional 5.9% |
Demographics Similar to Native Hawaiians by Disability Age 18 to 34
In terms of disability age 18 to 34, the demographic groups most similar to Native Hawaiians are Immigrants from Cambodia (6.6%, a difference of 0.24%), Immigrants from Mexico (6.6%, a difference of 0.29%), Immigrants from Africa (6.6%, a difference of 0.29%), Ghanaian (6.6%, a difference of 0.33%), and Bahamian (6.6%, a difference of 0.38%).
| Demographics | Rating | Rank | Disability Age 18 to 34 |
| Immigrants | Northern Europe | 64.1 /100 | #167 | Good 6.5% |
| Immigrants | Moldova | 63.1 /100 | #168 | Good 6.5% |
| Russians | 60.2 /100 | #169 | Good 6.5% |
| Immigrants | Bahamas | 57.9 /100 | #170 | Average 6.6% |
| Bahamians | 55.5 /100 | #171 | Average 6.6% |
| Ghanaians | 54.7 /100 | #172 | Average 6.6% |
| Immigrants | Mexico | 54.1 /100 | #173 | Average 6.6% |
| Native Hawaiians | 50.0 /100 | #174 | Average 6.6% |
| Immigrants | Cambodia | 46.5 /100 | #175 | Average 6.6% |
| Immigrants | Africa | 45.9 /100 | #176 | Average 6.6% |
| Syrians | 44.3 /100 | #177 | Average 6.6% |
| Nigerians | 43.7 /100 | #178 | Average 6.6% |
| Immigrants | Ghana | 42.1 /100 | #179 | Average 6.6% |
| Immigrants | Austria | 39.6 /100 | #180 | Fair 6.6% |
| Romanians | 39.5 /100 | #181 | Fair 6.6% |