Hawaiian vs Native Hawaiian Cognitive Disability
COMPARE
Hawaiian
Native Hawaiian
Cognitive Disability
Cognitive Disability Comparison
Hawaiians
Native Hawaiians
17.6%
COGNITIVE DISABILITY
7.2/ 100
METRIC RATING
213th/ 347
METRIC RANK
16.7%
COGNITIVE DISABILITY
99.0/ 100
METRIC RATING
87th/ 347
METRIC RANK
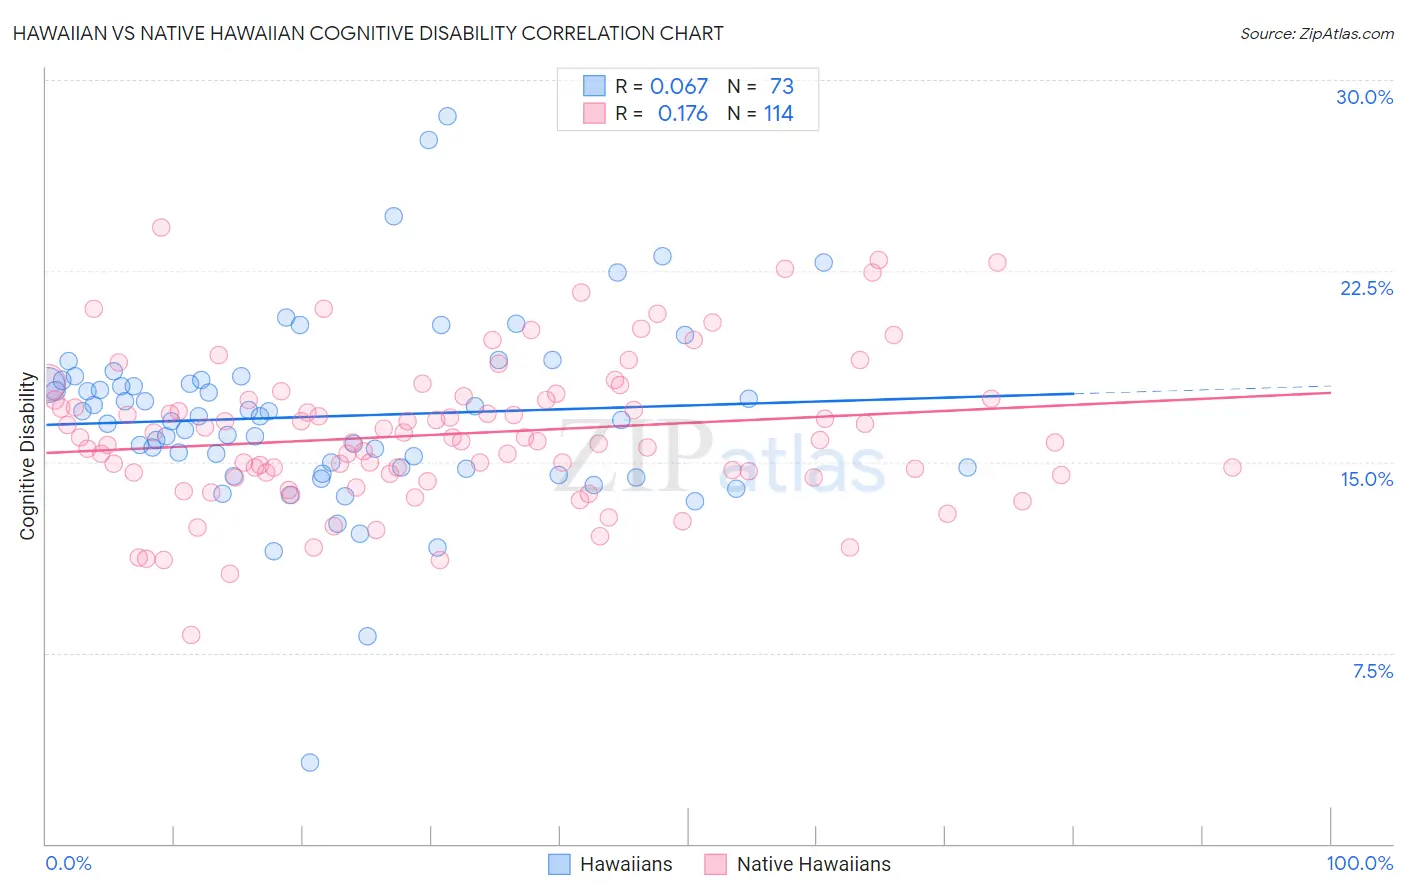
Hawaiian vs Native Hawaiian Cognitive Disability Correlation Chart
The statistical analysis conducted on geographies consisting of 327,505,207 people shows a slight positive correlation between the proportion of Hawaiians and percentage of population with cognitive disability in the United States with a correlation coefficient (R) of 0.067 and weighted average of 17.6%. Similarly, the statistical analysis conducted on geographies consisting of 332,041,393 people shows a poor positive correlation between the proportion of Native Hawaiians and percentage of population with cognitive disability in the United States with a correlation coefficient (R) of 0.176 and weighted average of 16.7%, a difference of 5.3%.
Cognitive Disability Correlation Summary
| Measurement | Hawaiian | Native Hawaiian |
| Minimum | 3.2% | 8.2% |
| Maximum | 28.6% | 24.2% |
| Range | 25.4% | 16.0% |
| Mean | 16.8% | 16.1% |
| Median | 16.8% | 15.8% |
| Interquartile 25% (IQ1) | 14.7% | 14.5% |
| Interquartile 75% (IQ3) | 18.2% | 17.5% |
| Interquartile Range (IQR) | 3.5% | 2.9% |
| Standard Deviation (Sample) | 3.7% | 2.9% |
| Standard Deviation (Population) | 3.7% | 2.9% |
Similar Demographics by Cognitive Disability
Demographics Similar to Hawaiians by Cognitive Disability
In terms of cognitive disability, the demographic groups most similar to Hawaiians are Immigrants from Oceania (17.6%, a difference of 0.010%), Immigrants from El Salvador (17.6%, a difference of 0.020%), Alaskan Athabascan (17.6%, a difference of 0.030%), Okinawan (17.6%, a difference of 0.040%), and Taiwanese (17.6%, a difference of 0.050%).
| Demographics | Rating | Rank | Cognitive Disability |
| Alaska Natives | 10.4 /100 | #206 | Poor 17.5% |
| Immigrants | Latin America | 9.7 /100 | #207 | Tragic 17.6% |
| Immigrants | Cameroon | 9.3 /100 | #208 | Tragic 17.6% |
| Immigrants | Trinidad and Tobago | 8.7 /100 | #209 | Tragic 17.6% |
| Immigrants | Jamaica | 8.5 /100 | #210 | Tragic 17.6% |
| Taiwanese | 7.7 /100 | #211 | Tragic 17.6% |
| Immigrants | Oceania | 7.3 /100 | #212 | Tragic 17.6% |
| Hawaiians | 7.2 /100 | #213 | Tragic 17.6% |
| Immigrants | El Salvador | 7.0 /100 | #214 | Tragic 17.6% |
| Alaskan Athabascans | 6.9 /100 | #215 | Tragic 17.6% |
| Okinawans | 6.8 /100 | #216 | Tragic 17.6% |
| Salvadorans | 6.7 /100 | #217 | Tragic 17.6% |
| Icelanders | 6.4 /100 | #218 | Tragic 17.6% |
| Immigrants | Sierra Leone | 6.3 /100 | #219 | Tragic 17.6% |
| Zimbabweans | 6.1 /100 | #220 | Tragic 17.6% |
Demographics Similar to Native Hawaiians by Cognitive Disability
In terms of cognitive disability, the demographic groups most similar to Native Hawaiians are Immigrants from South Africa (16.7%, a difference of 0.010%), Immigrants from Moldova (16.7%, a difference of 0.050%), Belgian (16.7%, a difference of 0.060%), Immigrants from Philippines (16.7%, a difference of 0.060%), and Serbian (16.7%, a difference of 0.080%).
| Demographics | Rating | Rank | Cognitive Disability |
| Egyptians | 99.2 /100 | #80 | Exceptional 16.7% |
| Immigrants | Netherlands | 99.2 /100 | #81 | Exceptional 16.7% |
| Swiss | 99.2 /100 | #82 | Exceptional 16.7% |
| Serbians | 99.1 /100 | #83 | Exceptional 16.7% |
| Belgians | 99.1 /100 | #84 | Exceptional 16.7% |
| Immigrants | Moldova | 99.1 /100 | #85 | Exceptional 16.7% |
| Immigrants | South Africa | 99.0 /100 | #86 | Exceptional 16.7% |
| Native Hawaiians | 99.0 /100 | #87 | Exceptional 16.7% |
| Immigrants | Philippines | 99.0 /100 | #88 | Exceptional 16.7% |
| Immigrants | Egypt | 98.8 /100 | #89 | Exceptional 16.7% |
| South Americans | 98.8 /100 | #90 | Exceptional 16.7% |
| Danes | 98.8 /100 | #91 | Exceptional 16.7% |
| Immigrants | South America | 98.8 /100 | #92 | Exceptional 16.7% |
| Immigrants | Southern Europe | 98.7 /100 | #93 | Exceptional 16.7% |
| Asians | 98.7 /100 | #94 | Exceptional 16.7% |