Dominican vs Native/Alaskan Female Disability
COMPARE
Dominican
Native/Alaskan
Female Disability
Female Disability Comparison
Dominicans
Natives/Alaskans
13.5%
FEMALE DISABILITY
0.0/ 100
METRIC RATING
305th/ 347
METRIC RANK
14.1%
FEMALE DISABILITY
0.0/ 100
METRIC RATING
324th/ 347
METRIC RANK
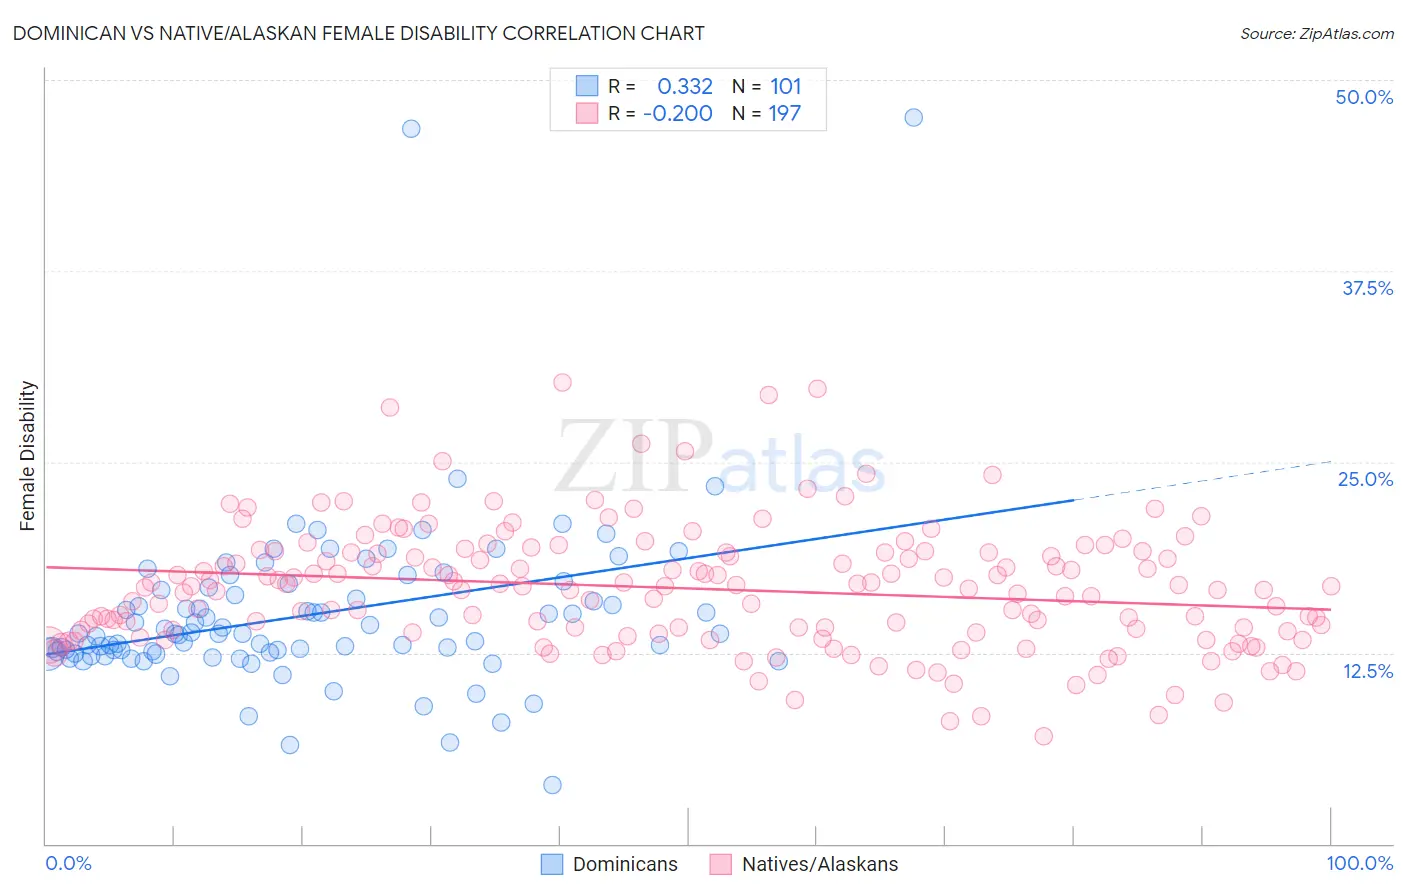
Dominican vs Native/Alaskan Female Disability Correlation Chart
The statistical analysis conducted on geographies consisting of 355,036,976 people shows a mild positive correlation between the proportion of Dominicans and percentage of females with a disability in the United States with a correlation coefficient (R) of 0.332 and weighted average of 13.5%. Similarly, the statistical analysis conducted on geographies consisting of 512,836,768 people shows a weak negative correlation between the proportion of Natives/Alaskans and percentage of females with a disability in the United States with a correlation coefficient (R) of -0.200 and weighted average of 14.1%, a difference of 4.8%.
Female Disability Correlation Summary
| Measurement | Dominican | Native/Alaskan |
| Minimum | 3.9% | 7.0% |
| Maximum | 47.5% | 30.2% |
| Range | 43.7% | 23.2% |
| Mean | 15.0% | 16.7% |
| Median | 13.8% | 16.8% |
| Interquartile 25% (IQ1) | 12.5% | 13.9% |
| Interquartile 75% (IQ3) | 16.7% | 19.1% |
| Interquartile Range (IQR) | 4.2% | 5.2% |
| Standard Deviation (Sample) | 5.8% | 4.0% |
| Standard Deviation (Population) | 5.7% | 4.0% |
Demographics Similar to Dominicans and Natives/Alaskans by Female Disability
In terms of female disability, the demographic groups most similar to Dominicans are Immigrants from Micronesia (13.5%, a difference of 0.31%), French Canadian (13.6%, a difference of 0.63%), Central American Indian (13.6%, a difference of 0.92%), Cree (13.7%, a difference of 1.4%), and French American Indian (13.7%, a difference of 1.4%). Similarly, the demographic groups most similar to Natives/Alaskans are Black/African American (14.1%, a difference of 0.020%), Pueblo (14.1%, a difference of 0.18%), Potawatomi (14.1%, a difference of 0.20%), American (14.1%, a difference of 0.33%), and Iroquois (14.0%, a difference of 0.67%).
| Demographics | Rating | Rank | Female Disability |
| Immigrants | Micronesia | 0.0 /100 | #304 | Tragic 13.5% |
| Dominicans | 0.0 /100 | #305 | Tragic 13.5% |
| French Canadians | 0.0 /100 | #306 | Tragic 13.6% |
| Central American Indians | 0.0 /100 | #307 | Tragic 13.6% |
| Cree | 0.0 /100 | #308 | Tragic 13.7% |
| French American Indians | 0.0 /100 | #309 | Tragic 13.7% |
| Apache | 0.0 /100 | #310 | Tragic 13.7% |
| Hopi | 0.0 /100 | #311 | Tragic 13.7% |
| Delaware | 0.0 /100 | #312 | Tragic 13.8% |
| Blackfeet | 0.0 /100 | #313 | Tragic 13.8% |
| Puget Sound Salish | 0.0 /100 | #314 | Tragic 13.8% |
| Alaskan Athabascans | 0.0 /100 | #315 | Tragic 13.9% |
| Spanish Americans | 0.0 /100 | #316 | Tragic 14.0% |
| Chippewa | 0.0 /100 | #317 | Tragic 14.0% |
| Paiute | 0.0 /100 | #318 | Tragic 14.0% |
| Iroquois | 0.0 /100 | #319 | Tragic 14.0% |
| Americans | 0.0 /100 | #320 | Tragic 14.1% |
| Potawatomi | 0.0 /100 | #321 | Tragic 14.1% |
| Pueblo | 0.0 /100 | #322 | Tragic 14.1% |
| Blacks/African Americans | 0.0 /100 | #323 | Tragic 14.1% |
| Natives/Alaskans | 0.0 /100 | #324 | Tragic 14.1% |