Delaware vs Ethiopian Male Disability
COMPARE
Delaware
Ethiopian
Male Disability
Male Disability Comparison
Delaware
Ethiopians
13.5%
MALE DISABILITY
0.0/ 100
METRIC RATING
311th/ 347
METRIC RANK
10.2%
MALE DISABILITY
99.8/ 100
METRIC RATING
36th/ 347
METRIC RANK
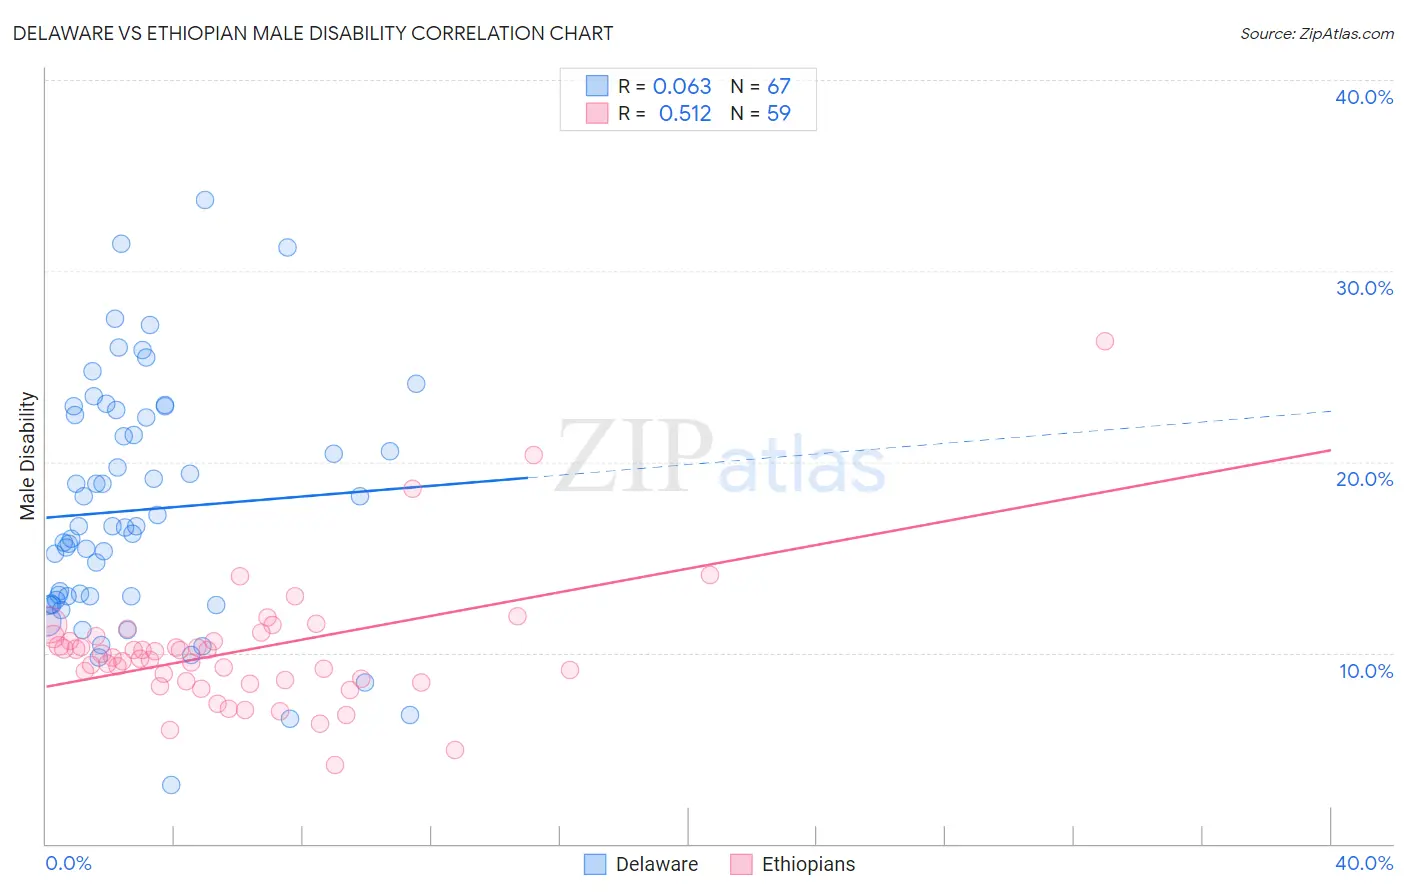
Delaware vs Ethiopian Male Disability Correlation Chart
The statistical analysis conducted on geographies consisting of 96,239,516 people shows a slight positive correlation between the proportion of Delaware and percentage of males with a disability in the United States with a correlation coefficient (R) of 0.063 and weighted average of 13.5%. Similarly, the statistical analysis conducted on geographies consisting of 223,232,754 people shows a substantial positive correlation between the proportion of Ethiopians and percentage of males with a disability in the United States with a correlation coefficient (R) of 0.512 and weighted average of 10.2%, a difference of 31.9%.
Male Disability Correlation Summary
| Measurement | Delaware | Ethiopian |
| Minimum | 3.1% | 4.2% |
| Maximum | 33.7% | 26.3% |
| Range | 30.6% | 22.2% |
| Mean | 17.5% | 10.1% |
| Median | 16.6% | 9.8% |
| Interquartile 25% (IQ1) | 12.7% | 8.5% |
| Interquartile 75% (IQ3) | 22.4% | 10.8% |
| Interquartile Range (IQR) | 9.7% | 2.3% |
| Standard Deviation (Sample) | 6.3% | 3.4% |
| Standard Deviation (Population) | 6.2% | 3.4% |
Similar Demographics by Male Disability
Demographics Similar to Delaware by Male Disability
In terms of male disability, the demographic groups most similar to Delaware are Immigrants from the Azores (13.4%, a difference of 0.19%), Blackfeet (13.4%, a difference of 0.33%), Yakama (13.5%, a difference of 0.55%), Puget Sound Salish (13.5%, a difference of 0.57%), and Aleut (13.5%, a difference of 0.63%).
| Demographics | Rating | Rank | Male Disability |
| Blacks/African Americans | 0.0 /100 | #304 | Tragic 13.2% |
| French Canadians | 0.0 /100 | #305 | Tragic 13.3% |
| Spanish Americans | 0.0 /100 | #306 | Tragic 13.3% |
| Arapaho | 0.0 /100 | #307 | Tragic 13.3% |
| French American Indians | 0.0 /100 | #308 | Tragic 13.4% |
| Blackfeet | 0.0 /100 | #309 | Tragic 13.4% |
| Immigrants | Azores | 0.0 /100 | #310 | Tragic 13.4% |
| Delaware | 0.0 /100 | #311 | Tragic 13.5% |
| Yakama | 0.0 /100 | #312 | Tragic 13.5% |
| Puget Sound Salish | 0.0 /100 | #313 | Tragic 13.5% |
| Aleuts | 0.0 /100 | #314 | Tragic 13.5% |
| Iroquois | 0.0 /100 | #315 | Tragic 13.6% |
| Alaska Natives | 0.0 /100 | #316 | Tragic 13.6% |
| Paiute | 0.0 /100 | #317 | Tragic 13.7% |
| Cree | 0.0 /100 | #318 | Tragic 13.7% |
Demographics Similar to Ethiopians by Male Disability
In terms of male disability, the demographic groups most similar to Ethiopians are Immigrants from Argentina (10.2%, a difference of 0.050%), Immigrants from Indonesia (10.2%, a difference of 0.070%), Immigrants from Turkey (10.2%, a difference of 0.16%), Immigrants from Ethiopia (10.2%, a difference of 0.22%), and Immigrants from Kuwait (10.2%, a difference of 0.24%).
| Demographics | Rating | Rank | Male Disability |
| Venezuelans | 99.9 /100 | #29 | Exceptional 10.1% |
| Immigrants | Egypt | 99.9 /100 | #30 | Exceptional 10.1% |
| Soviet Union | 99.9 /100 | #31 | Exceptional 10.1% |
| Argentineans | 99.9 /100 | #32 | Exceptional 10.1% |
| Immigrants | Ethiopia | 99.9 /100 | #33 | Exceptional 10.2% |
| Immigrants | Turkey | 99.9 /100 | #34 | Exceptional 10.2% |
| Immigrants | Argentina | 99.9 /100 | #35 | Exceptional 10.2% |
| Ethiopians | 99.8 /100 | #36 | Exceptional 10.2% |
| Immigrants | Indonesia | 99.8 /100 | #37 | Exceptional 10.2% |
| Immigrants | Kuwait | 99.8 /100 | #38 | Exceptional 10.2% |
| Afghans | 99.8 /100 | #39 | Exceptional 10.2% |
| Immigrants | Nepal | 99.8 /100 | #40 | Exceptional 10.3% |
| Taiwanese | 99.8 /100 | #41 | Exceptional 10.3% |
| Mongolians | 99.7 /100 | #42 | Exceptional 10.3% |
| Immigrants | Bangladesh | 99.7 /100 | #43 | Exceptional 10.3% |