Chippewa vs Pennsylvania German Ambulatory Disability
COMPARE
Chippewa
Pennsylvania German
Ambulatory Disability
Ambulatory Disability Comparison
Chippewa
Pennsylvania Germans
7.1%
AMBULATORY DISABILITY
0.0/ 100
METRIC RATING
308th/ 347
METRIC RANK
6.8%
AMBULATORY DISABILITY
0.0/ 100
METRIC RATING
280th/ 347
METRIC RANK
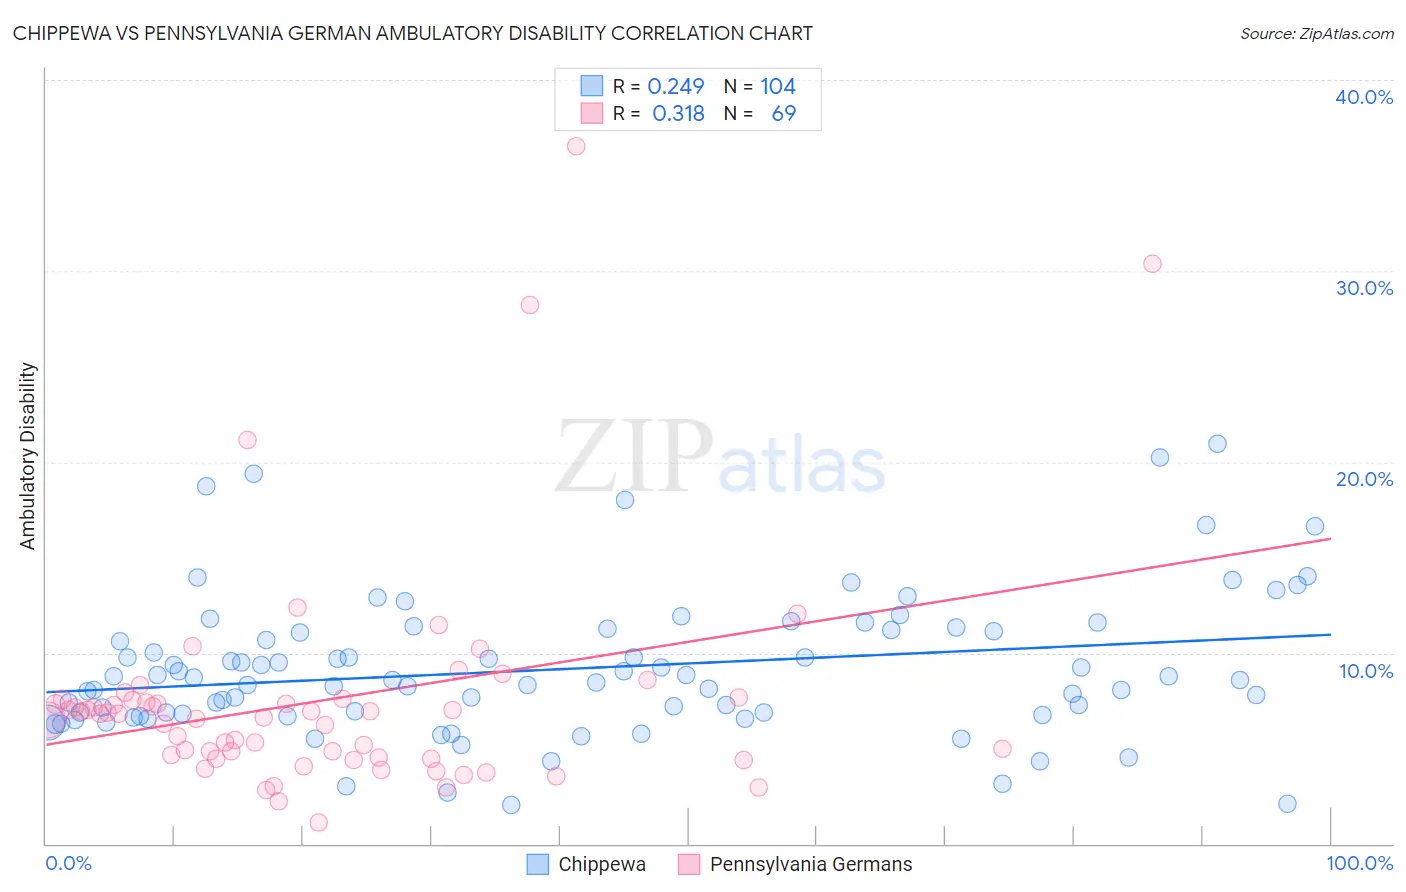
Chippewa vs Pennsylvania German Ambulatory Disability Correlation Chart
The statistical analysis conducted on geographies consisting of 215,009,829 people shows a weak positive correlation between the proportion of Chippewa and percentage of population with ambulatory disability in the United States with a correlation coefficient (R) of 0.249 and weighted average of 7.1%. Similarly, the statistical analysis conducted on geographies consisting of 234,073,505 people shows a mild positive correlation between the proportion of Pennsylvania Germans and percentage of population with ambulatory disability in the United States with a correlation coefficient (R) of 0.318 and weighted average of 6.8%, a difference of 4.7%.
Ambulatory Disability Correlation Summary
| Measurement | Chippewa | Pennsylvania German |
| Minimum | 2.0% | 1.1% |
| Maximum | 20.9% | 36.5% |
| Range | 18.9% | 35.4% |
| Mean | 9.1% | 7.5% |
| Median | 8.6% | 6.8% |
| Interquartile 25% (IQ1) | 6.8% | 4.5% |
| Interquartile 75% (IQ3) | 11.2% | 7.5% |
| Interquartile Range (IQR) | 4.4% | 3.1% |
| Standard Deviation (Sample) | 3.7% | 6.0% |
| Standard Deviation (Population) | 3.7% | 5.9% |
Similar Demographics by Ambulatory Disability
Demographics Similar to Chippewa by Ambulatory Disability
In terms of ambulatory disability, the demographic groups most similar to Chippewa are Spanish American (7.1%, a difference of 0.0%), Immigrants from the Azores (7.1%, a difference of 0.17%), Iroquois (7.1%, a difference of 0.27%), Arapaho (7.1%, a difference of 0.45%), and Cree (7.1%, a difference of 0.46%).
| Demographics | Rating | Rank | Ambulatory Disability |
| British West Indians | 0.0 /100 | #301 | Tragic 7.0% |
| Immigrants | Armenia | 0.0 /100 | #302 | Tragic 7.0% |
| Africans | 0.0 /100 | #303 | Tragic 7.0% |
| Immigrants | Cabo Verde | 0.0 /100 | #304 | Tragic 7.0% |
| Immigrants | Micronesia | 0.0 /100 | #305 | Tragic 7.0% |
| Iroquois | 0.0 /100 | #306 | Tragic 7.1% |
| Spanish Americans | 0.0 /100 | #307 | Tragic 7.1% |
| Chippewa | 0.0 /100 | #308 | Tragic 7.1% |
| Immigrants | Azores | 0.0 /100 | #309 | Tragic 7.1% |
| Arapaho | 0.0 /100 | #310 | Tragic 7.1% |
| Cree | 0.0 /100 | #311 | Tragic 7.1% |
| Delaware | 0.0 /100 | #312 | Tragic 7.1% |
| Immigrants | Yemen | 0.0 /100 | #313 | Tragic 7.1% |
| Blackfeet | 0.0 /100 | #314 | Tragic 7.1% |
| Shoshone | 0.0 /100 | #315 | Tragic 7.1% |
Demographics Similar to Pennsylvania Germans by Ambulatory Disability
In terms of ambulatory disability, the demographic groups most similar to Pennsylvania Germans are Yaqui (6.8%, a difference of 0.070%), Immigrants from Caribbean (6.7%, a difference of 0.10%), Barbadian (6.8%, a difference of 0.20%), Immigrants from Barbados (6.8%, a difference of 0.36%), and Immigrants from West Indies (6.7%, a difference of 0.41%).
| Demographics | Rating | Rank | Ambulatory Disability |
| Whites/Caucasians | 0.1 /100 | #273 | Tragic 6.7% |
| Sioux | 0.1 /100 | #274 | Tragic 6.7% |
| Immigrants | Guyana | 0.1 /100 | #275 | Tragic 6.7% |
| Celtics | 0.1 /100 | #276 | Tragic 6.7% |
| Jamaicans | 0.1 /100 | #277 | Tragic 6.7% |
| Immigrants | West Indies | 0.1 /100 | #278 | Tragic 6.7% |
| Immigrants | Caribbean | 0.0 /100 | #279 | Tragic 6.7% |
| Pennsylvania Germans | 0.0 /100 | #280 | Tragic 6.8% |
| Yaqui | 0.0 /100 | #281 | Tragic 6.8% |
| Barbadians | 0.0 /100 | #282 | Tragic 6.8% |
| Immigrants | Barbados | 0.0 /100 | #283 | Tragic 6.8% |
| Immigrants | Jamaica | 0.0 /100 | #284 | Tragic 6.8% |
| Fijians | 0.0 /100 | #285 | Tragic 6.8% |
| Yakama | 0.0 /100 | #286 | Tragic 6.8% |
| U.S. Virgin Islanders | 0.0 /100 | #287 | Tragic 6.8% |