Chinese vs Belizean Disability Age 18 to 34
COMPARE
Chinese
Belizean
Disability Age 18 to 34
Disability Age 18 to 34 Comparison
Chinese
Belizeans
6.3%
DISABILITY AGE 18 TO 34
91.9/ 100
METRIC RATING
128th/ 347
METRIC RANK
6.4%
DISABILITY AGE 18 TO 34
84.9/ 100
METRIC RATING
146th/ 347
METRIC RANK
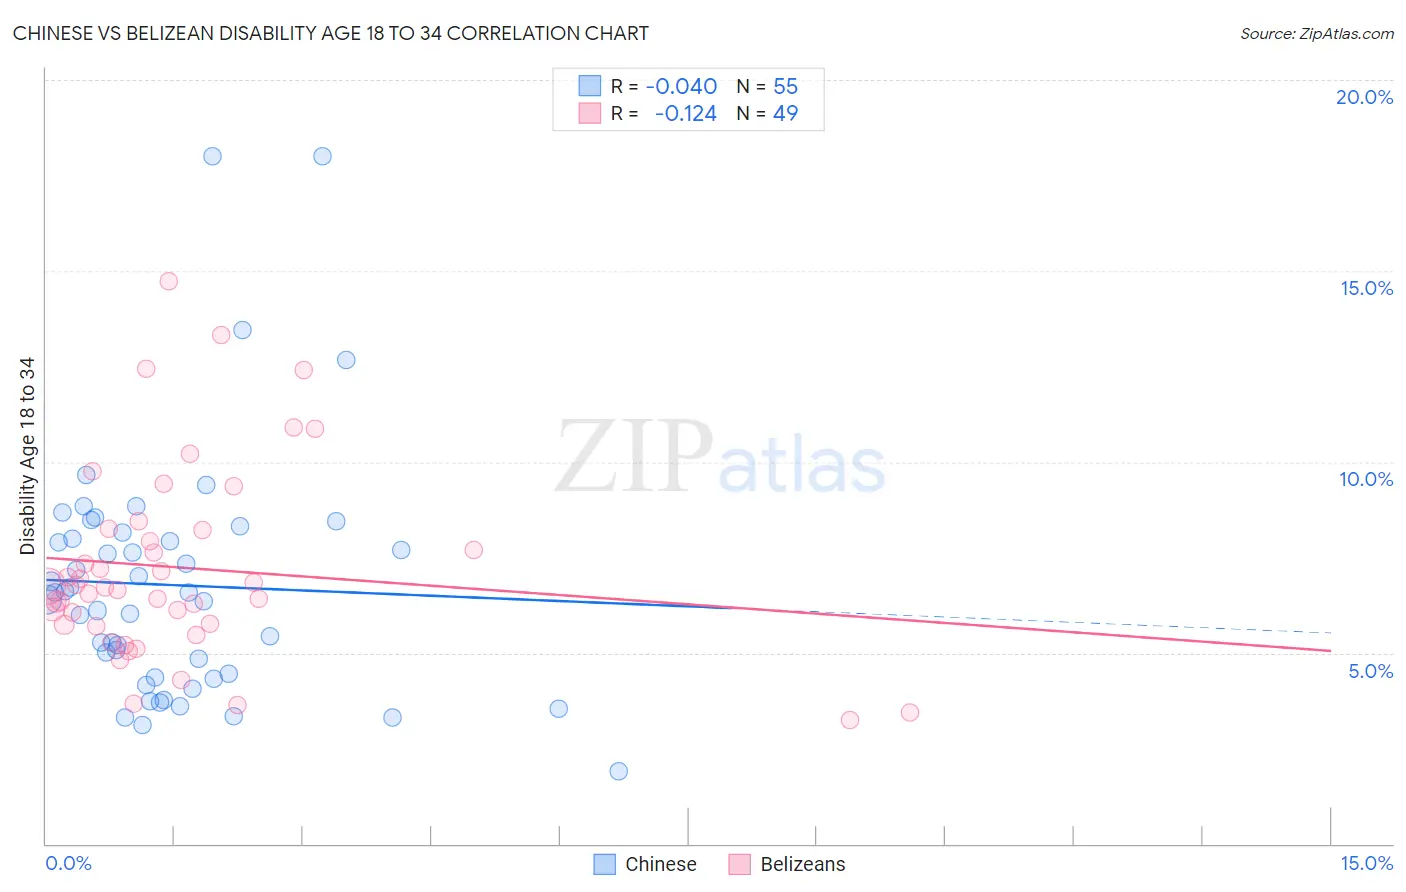
Chinese vs Belizean Disability Age 18 to 34 Correlation Chart
The statistical analysis conducted on geographies consisting of 64,771,320 people shows no correlation between the proportion of Chinese and percentage of population with a disability between the ages 18 and 35 in the United States with a correlation coefficient (R) of -0.040 and weighted average of 6.3%. Similarly, the statistical analysis conducted on geographies consisting of 144,092,857 people shows a poor negative correlation between the proportion of Belizeans and percentage of population with a disability between the ages 18 and 35 in the United States with a correlation coefficient (R) of -0.124 and weighted average of 6.4%, a difference of 1.3%.
Disability Age 18 to 34 Correlation Summary
| Measurement | Chinese | Belizean |
| Minimum | 1.9% | 3.2% |
| Maximum | 18.0% | 14.7% |
| Range | 16.1% | 11.5% |
| Mean | 6.8% | 7.2% |
| Median | 6.6% | 6.7% |
| Interquartile 25% (IQ1) | 4.4% | 5.7% |
| Interquartile 75% (IQ3) | 8.1% | 8.2% |
| Interquartile Range (IQR) | 3.8% | 2.5% |
| Standard Deviation (Sample) | 3.2% | 2.5% |
| Standard Deviation (Population) | 3.2% | 2.5% |
Demographics Similar to Chinese and Belizeans by Disability Age 18 to 34
In terms of disability age 18 to 34, the demographic groups most similar to Chinese are West Indian (6.3%, a difference of 0.010%), Immigrants from Italy (6.3%, a difference of 0.31%), Immigrants from Dominica (6.3%, a difference of 0.32%), Immigrants from Saudi Arabia (6.3%, a difference of 0.33%), and Guatemalan (6.4%, a difference of 0.50%). Similarly, the demographic groups most similar to Belizeans are Moroccan (6.4%, a difference of 0.050%), Albanian (6.4%, a difference of 0.060%), Immigrants from South Africa (6.4%, a difference of 0.16%), Immigrants from Latvia (6.4%, a difference of 0.23%), and South American Indian (6.4%, a difference of 0.25%).
| Demographics | Rating | Rank | Disability Age 18 to 34 |
| West Indians | 92.0 /100 | #127 | Exceptional 6.3% |
| Chinese | 91.9 /100 | #128 | Exceptional 6.3% |
| Immigrants | Italy | 90.5 /100 | #129 | Exceptional 6.3% |
| Immigrants | Dominica | 90.5 /100 | #130 | Exceptional 6.3% |
| Immigrants | Saudi Arabia | 90.4 /100 | #131 | Exceptional 6.3% |
| Guatemalans | 89.6 /100 | #132 | Excellent 6.4% |
| Brazilians | 89.0 /100 | #133 | Excellent 6.4% |
| Immigrants | Europe | 88.8 /100 | #134 | Excellent 6.4% |
| Palestinians | 88.5 /100 | #135 | Excellent 6.4% |
| Immigrants | Sweden | 88.5 /100 | #136 | Excellent 6.4% |
| Immigrants | Honduras | 87.7 /100 | #137 | Excellent 6.4% |
| Spanish American Indians | 87.7 /100 | #138 | Excellent 6.4% |
| Immigrants | Belize | 87.4 /100 | #139 | Excellent 6.4% |
| Immigrants | Fiji | 87.3 /100 | #140 | Excellent 6.4% |
| Jamaicans | 86.8 /100 | #141 | Excellent 6.4% |
| South American Indians | 86.5 /100 | #142 | Excellent 6.4% |
| Immigrants | Latvia | 86.4 /100 | #143 | Excellent 6.4% |
| Albanians | 85.3 /100 | #144 | Excellent 6.4% |
| Moroccans | 85.2 /100 | #145 | Excellent 6.4% |
| Belizeans | 84.9 /100 | #146 | Excellent 6.4% |
| Immigrants | South Africa | 83.7 /100 | #147 | Excellent 6.4% |