Central American vs Pueblo Disability Age 65 to 74
COMPARE
Central American
Pueblo
Disability Age 65 to 74
Disability Age 65 to 74 Comparison
Central Americans
Pueblo
25.1%
DISABILITY AGE 65 TO 74
0.5/ 100
METRIC RATING
255th/ 347
METRIC RANK
33.1%
DISABILITY AGE 65 TO 74
0.0/ 100
METRIC RATING
342nd/ 347
METRIC RANK
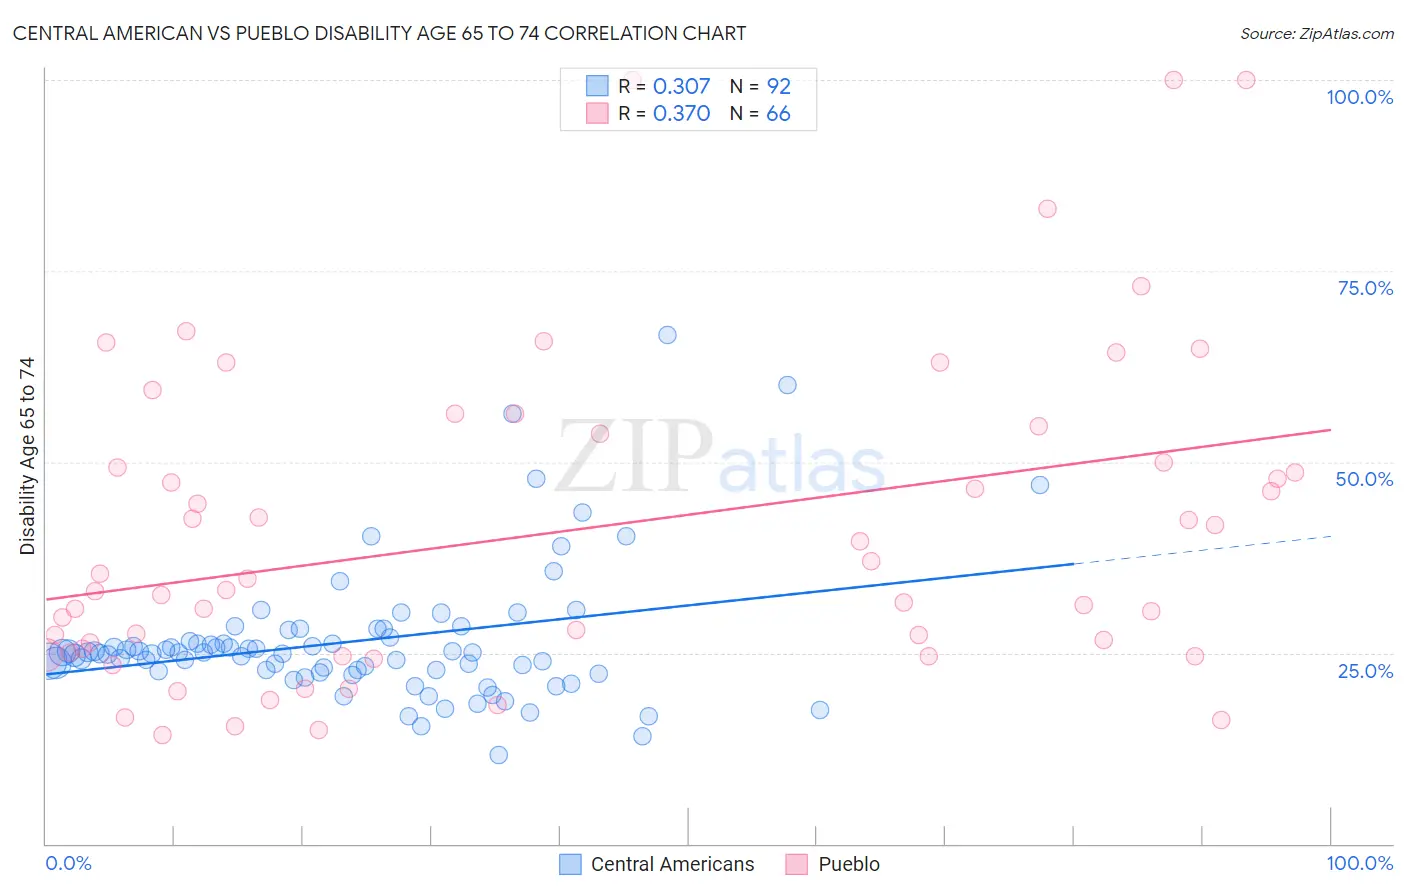
Central American vs Pueblo Disability Age 65 to 74 Correlation Chart
The statistical analysis conducted on geographies consisting of 503,060,028 people shows a mild positive correlation between the proportion of Central Americans and percentage of population with a disability between the ages 65 and 75 in the United States with a correlation coefficient (R) of 0.307 and weighted average of 25.1%. Similarly, the statistical analysis conducted on geographies consisting of 120,013,709 people shows a mild positive correlation between the proportion of Pueblo and percentage of population with a disability between the ages 65 and 75 in the United States with a correlation coefficient (R) of 0.370 and weighted average of 33.1%, a difference of 31.7%.
Disability Age 65 to 74 Correlation Summary
| Measurement | Central American | Pueblo |
| Minimum | 11.6% | 14.3% |
| Maximum | 66.7% | 100.0% |
| Range | 55.1% | 85.7% |
| Mean | 26.5% | 41.0% |
| Median | 25.0% | 34.0% |
| Interquartile 25% (IQ1) | 22.7% | 25.1% |
| Interquartile 75% (IQ3) | 26.8% | 53.7% |
| Interquartile Range (IQR) | 4.1% | 28.6% |
| Standard Deviation (Sample) | 8.9% | 21.0% |
| Standard Deviation (Population) | 8.9% | 20.8% |
Similar Demographics by Disability Age 65 to 74
Demographics Similar to Central Americans by Disability Age 65 to 74
In terms of disability age 65 to 74, the demographic groups most similar to Central Americans are Somali (25.1%, a difference of 0.16%), Subsaharan African (25.1%, a difference of 0.23%), Immigrants from El Salvador (25.1%, a difference of 0.27%), Immigrants from Somalia (25.2%, a difference of 0.41%), and Nonimmigrants (25.0%, a difference of 0.46%).
| Demographics | Rating | Rank | Disability Age 65 to 74 |
| Senegalese | 0.9 /100 | #248 | Tragic 24.9% |
| Immigrants | Fiji | 0.8 /100 | #249 | Tragic 25.0% |
| Salvadorans | 0.8 /100 | #250 | Tragic 25.0% |
| Immigrants | Nonimmigrants | 0.7 /100 | #251 | Tragic 25.0% |
| Immigrants | El Salvador | 0.6 /100 | #252 | Tragic 25.1% |
| Sub-Saharan Africans | 0.6 /100 | #253 | Tragic 25.1% |
| Somalis | 0.6 /100 | #254 | Tragic 25.1% |
| Central Americans | 0.5 /100 | #255 | Tragic 25.1% |
| Immigrants | Somalia | 0.4 /100 | #256 | Tragic 25.2% |
| Guamanians/Chamorros | 0.3 /100 | #257 | Tragic 25.3% |
| Marshallese | 0.3 /100 | #258 | Tragic 25.3% |
| Immigrants | Cambodia | 0.3 /100 | #259 | Tragic 25.3% |
| Malaysians | 0.2 /100 | #260 | Tragic 25.4% |
| Cape Verdeans | 0.2 /100 | #261 | Tragic 25.4% |
| Samoans | 0.2 /100 | #262 | Tragic 25.4% |
Demographics Similar to Pueblo by Disability Age 65 to 74
In terms of disability age 65 to 74, the demographic groups most similar to Pueblo are Tsimshian (32.9%, a difference of 0.60%), Navajo (33.3%, a difference of 0.72%), Lumbee (32.7%, a difference of 1.1%), Kiowa (32.6%, a difference of 1.7%), and Alaskan Athabascan (32.4%, a difference of 2.3%).
| Demographics | Rating | Rank | Disability Age 65 to 74 |
| Colville | 0.0 /100 | #333 | Tragic 30.5% |
| Alaska Natives | 0.0 /100 | #334 | Tragic 30.6% |
| Cheyenne | 0.0 /100 | #335 | Tragic 31.1% |
| Yuman | 0.0 /100 | #336 | Tragic 31.5% |
| Houma | 0.0 /100 | #337 | Tragic 32.3% |
| Alaskan Athabascans | 0.0 /100 | #338 | Tragic 32.4% |
| Kiowa | 0.0 /100 | #339 | Tragic 32.6% |
| Lumbee | 0.0 /100 | #340 | Tragic 32.7% |
| Tsimshian | 0.0 /100 | #341 | Tragic 32.9% |
| Pueblo | 0.0 /100 | #342 | Tragic 33.1% |
| Navajo | 0.0 /100 | #343 | Tragic 33.3% |
| Inupiat | 0.0 /100 | #344 | Tragic 34.5% |
| Tohono O'odham | 0.0 /100 | #345 | Tragic 36.0% |
| Yup'ik | 0.0 /100 | #346 | Tragic 37.8% |
| Pima | 0.0 /100 | #347 | Tragic 38.6% |