Brazilian vs Immigrants from China Disability Age 18 to 34

COMPARE

Brazilian
Race
Ancestry
AfghanAfricanAlaska NativeAlaskan AthabascanAlbanianAleutAlsatianAmericanApacheArabArapahoArgentineanArmenianAssyrian/Chaldean/SyriacAustralianAustrianBahamianBangladeshiBarbadianBasqueBelgianBelizeanBermudanBhutaneseBlackfeetBolivianBrazilianBritishBritish West IndianBulgarianBurmeseCajunCambodianCanadianCape VerdeanCarpatho RusynCelticCentral AmericanCentral American IndianCherokeeCheyenneChickasawChileanChineseChippewaChoctawColombianColvilleComancheCosta RicanCreeCreekCroatianCrowCubanCypriotCzechCzechoslovakianDanishDelawareDominicanDutchDutch West IndianEastern EuropeanEcuadorianEgyptianEnglishEstonianEthiopianEuropeanFijianFilipinoFinnishFrenchFrench American IndianFrench CanadianGermanGerman RussianGhanaianGreekGuamanian/ChamorroGuatemalanGuyaneseHaitianHmongHonduranHopiHoumaHungarianIcelanderIndian (Asian)IndonesianInupiatIranianIraqiIrishIroquoisIsraeliItalianJamaicanJapaneseJordanianKenyanKiowaKoreanLaotianLatvianLebaneseLiberianLithuanianLumbeeLuxembourgerMacedonianMalaysianMalteseMarshalleseMenomineeMexicanMexican American IndianMongolianMoroccanNative HawaiianNavajoNepaleseNew ZealanderNicaraguanNigerianNorthern EuropeanNorwegianOkinawanOsageOttawaPaiutePakistaniPalestinianPanamanianParaguayanPennsylvania GermanPeruvianPimaPolishPortuguesePotawatomiPuebloPuerto RicanPuget Sound SalishRomanianRussianSalvadoranSamoanScandinavianScotch-IrishScottishSeminoleSenegaleseSerbianShoshoneSierra LeoneanSiouxSlavicSlovakSloveneSomaliSouth AfricanSouth AmericanSouth American IndianSoviet UnionSpaniardSpanishSpanish AmericanSpanish American IndianSri LankanSubsaharan AfricanSudaneseSwedishSwissSyrianTaiwaneseThaiTlingit-HaidaTohono O'OdhamTonganTrinidadian and TobagonianTsimshianTurkishU.S. Virgin IslanderUgandanUkrainianUruguayanUteVenezuelanVietnameseWelshWest IndianYakamaYaquiYugoslavianYumanYup'ikZimbabwean
Immigration
NonimmigrantsImmigrantsAfghanistanAfricaAlbaniaArgentinaArmeniaAsiaAustraliaAustriaBahamasBangladeshBarbadosBelarusBelgiumBelizeBoliviaBosnia and HerzegovinaBrazilBulgariaBurma/MyanmarCabo VerdeCambodiaCameroonCanadaCaribbeanCentral AmericaChileColombiaCongoCosta RicaCroatiaCubaCzechoslovakiaDenmarkDominicaDominican RepublicEastern AfricaEastern AsiaEastern EuropeEcuadorEgyptEl SalvadorEnglandEritreaEthiopiaEuropeFijiFranceGermanyGhanaGreeceGrenadaGuatemalaGuyanaHaitiHondurasHong KongHungaryIndiaIndonesiaIranIraqIrelandIsraelItalyJamaicaJapanJordanKazakhstanKenyaKoreaKuwaitLaosLatin AmericaLatviaLebanonLiberiaLithuaniaMalaysiaMexicoMicronesiaMiddle AfricaMoldovaMoroccoNepalNetherlandsNicaraguaNigeriaNorth AmericaNorth MacedoniaNorthern AfricaNorthern EuropeNorwayOceaniaPakistanPanamaPeruPhilippinesPolandPortugalRomaniaRussiaSaudi ArabiaScotlandSenegalSerbiaSierra LeoneSingaporeSomaliaSouth AfricaSouth AmericaSouth Central AsiaSouth Eastern AsiaSouthern EuropeSpainSri LankaSt. Vincent and the GrenadinesSudanSwedenSwitzerlandSyriaTaiwanThailandTrinidad and TobagoTurkeyUgandaUkraineUruguayUzbekistanVenezuelaVietnamWest IndiesWestern AfricaWestern AsiaWestern EuropeYemenZaireZimbabweAzores
Immigrants from China
Race
Ancestry
AfghanAfricanAlaska NativeAlaskan AthabascanAlbanianAleutAlsatianAmericanApacheArabArapahoArgentineanArmenianAssyrian/Chaldean/SyriacAustralianAustrianBahamianBangladeshiBarbadianBasqueBelgianBelizeanBermudanBhutaneseBlackfeetBolivianBritishBritish West IndianBulgarianBurmeseCajunCambodianCanadianCape VerdeanCarpatho RusynCelticCentral AmericanCentral American IndianCherokeeCheyenneChickasawChileanChineseChippewaChoctawColombianColvilleComancheCosta RicanCreeCreekCroatianCrowCubanCypriotCzechCzechoslovakianDanishDelawareDominicanDutchDutch West IndianEastern EuropeanEcuadorianEgyptianEnglishEstonianEthiopianEuropeanFijianFilipinoFinnishFrenchFrench American IndianFrench CanadianGermanGerman RussianGhanaianGreekGuamanian/ChamorroGuatemalanGuyaneseHaitianHmongHonduranHopiHoumaHungarianIcelanderIndian (Asian)IndonesianInupiatIranianIraqiIrishIroquoisIsraeliItalianJamaicanJapaneseJordanianKenyanKiowaKoreanLaotianLatvianLebaneseLiberianLithuanianLumbeeLuxembourgerMacedonianMalaysianMalteseMarshalleseMenomineeMexicanMexican American IndianMongolianMoroccanNative HawaiianNavajoNepaleseNew ZealanderNicaraguanNigerianNorthern EuropeanNorwegianOkinawanOsageOttawaPaiutePakistaniPalestinianPanamanianParaguayanPennsylvania GermanPeruvianPimaPolishPortuguesePotawatomiPuebloPuerto RicanPuget Sound SalishRomanianRussianSalvadoranSamoanScandinavianScotch-IrishScottishSeminoleSenegaleseSerbianShoshoneSierra LeoneanSiouxSlavicSlovakSloveneSomaliSouth AfricanSouth AmericanSouth American IndianSoviet UnionSpaniardSpanishSpanish AmericanSpanish American IndianSri LankanSubsaharan AfricanSudaneseSwedishSwissSyrianTaiwaneseThaiTlingit-HaidaTohono O'OdhamTonganTrinidadian and TobagonianTsimshianTurkishU.S. Virgin IslanderUgandanUkrainianUruguayanUteVenezuelanVietnameseWelshWest IndianYakamaYaquiYugoslavianYumanYup'ikZimbabwean
Immigration
NonimmigrantsImmigrantsAfghanistanAfricaAlbaniaArgentinaArmeniaAsiaAustraliaAustriaBahamasBangladeshBarbadosBelarusBelgiumBelizeBoliviaBosnia and HerzegovinaBrazilBulgariaBurma/MyanmarCabo VerdeCambodiaCameroonCanadaCaribbeanCentral AmericaChileChinaColombiaCongoCosta RicaCroatiaCubaCzechoslovakiaDenmarkDominicaDominican RepublicEastern AfricaEastern AsiaEastern EuropeEcuadorEgyptEl SalvadorEnglandEritreaEthiopiaEuropeFijiFranceGermanyGhanaGreeceGrenadaGuatemalaGuyanaHaitiHondurasHong KongHungaryIndiaIndonesiaIranIraqIrelandIsraelItalyJamaicaJapanJordanKazakhstanKenyaKoreaKuwaitLaosLatin AmericaLatviaLebanonLiberiaLithuaniaMalaysiaMexicoMicronesiaMiddle AfricaMoldovaMoroccoNepalNetherlandsNicaraguaNigeriaNorth AmericaNorth MacedoniaNorthern AfricaNorthern EuropeNorwayOceaniaPakistanPanamaPeruPhilippinesPolandPortugalRomaniaRussiaSaudi ArabiaScotlandSenegalSerbiaSierra LeoneSingaporeSomaliaSouth AfricaSouth AmericaSouth Central AsiaSouth Eastern AsiaSouthern EuropeSpainSri LankaSt. Vincent and the GrenadinesSudanSwedenSwitzerlandSyriaTaiwanThailandTrinidad and TobagoTurkeyUgandaUkraineUruguayUzbekistanVenezuelaVietnamWest IndiesWestern AfricaWestern AsiaWestern EuropeYemenZaireZimbabweAzores
Disability Age 18 to 34
Income
Poverty
Unemployment
Labor Participation
Family Structure
Vehicle Availability
Education Level
Disability

Disability Age 18 to 34 Comparison

Brazilians

Immigrants from China

Excellent
Exceptional
6.4%
DISABILITY AGE 18 TO 34
89.0/ 100
METRIC RATING
133rd/ 347
METRIC RANK
5.4%
DISABILITY AGE 18 TO 34
100.0/ 100
METRIC RATING
7th/ 347
METRIC RANK

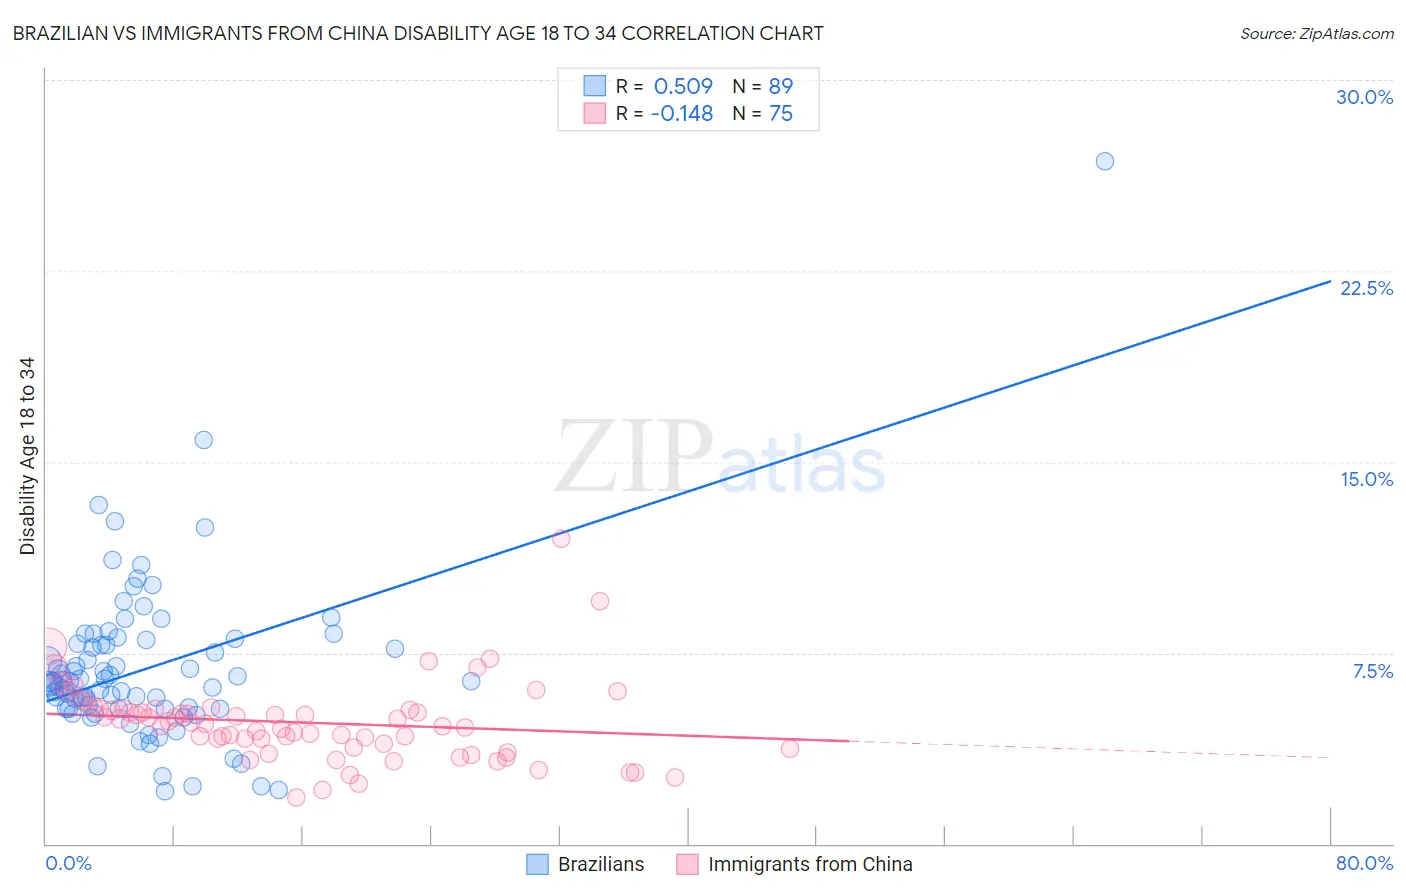
Brazilian vs Immigrants from China Disability Age 18 to 34 Correlation Chart

The statistical analysis conducted on geographies consisting of 323,485,694 people shows a substantial positive correlation between the proportion of Brazilians and percentage of population with a disability between the ages 18 and 35 in the United States with a correlation coefficient (R) of 0.509 and weighted average of 6.4%. Similarly, the statistical analysis conducted on geographies consisting of 455,773,705 people shows a poor negative correlation between the proportion of Immigrants from China and percentage of population with a disability between the ages 18 and 35 in the United States with a correlation coefficient (R) of -0.148 and weighted average of 5.4%, a difference of 16.7%.
Brazilian vs Immigrants from China Disability Age 18 to 34

Disability Age 18 to 34 Correlation Summary

MeasurementBrazilianImmigrants from China
Minimum2.1%1.8%
Maximum26.8%12.0%
Range24.8%10.2%
Mean6.9%4.8%
Median6.4%4.7%
Interquartile 25% (IQ1)5.3%3.8%
Interquartile 75% (IQ3)7.9%5.3%
Interquartile Range (IQR)2.6%1.5%
Standard Deviation (Sample)3.3%1.6%
Standard Deviation (Population)3.2%1.6%

Similar Demographics by Disability Age 18 to 34

Demographics Similar to Brazilians by Disability Age 18 to 34

In terms of disability age 18 to 34, the demographic groups most similar to Brazilians are Immigrants from Europe (6.4%, a difference of 0.030%), Palestinian (6.4%, a difference of 0.080%), Immigrants from Sweden (6.4%, a difference of 0.090%), Guatemalan (6.4%, a difference of 0.12%), and Immigrants from Honduras (6.4%, a difference of 0.22%).
DemographicsRating | RankDisability Age 18 to 34
Immigrants | Switzerland
92.5
/100
|
#126
Exceptional
6.3%
West Indians
92.0
/100
|
#127
Exceptional
6.3%
Chinese
91.9
/100
|
#128
Exceptional
6.3%
Immigrants | Italy
90.5
/100
|
#129
Exceptional
6.3%
Immigrants | Dominica
90.5
/100
|
#130
Exceptional
6.3%
Immigrants | Saudi Arabia
90.4
/100
|
#131
Exceptional
6.3%
Guatemalans
89.6
/100
|
#132
Excellent
6.4%
Brazilians
89.0
/100
|
#133
Excellent
6.4%
Immigrants | Europe
88.8
/100
|
#134
Excellent
6.4%
Palestinians
88.5
/100
|
#135
Excellent
6.4%
Immigrants | Sweden
88.5
/100
|
#136
Excellent
6.4%
Immigrants | Honduras
87.7
/100
|
#137
Excellent
6.4%
Spanish American Indians
87.7
/100
|
#138
Excellent
6.4%
Immigrants | Belize
87.4
/100
|
#139
Excellent
6.4%
Immigrants | Fiji
87.3
/100
|
#140
Excellent
6.4%

Demographics Similar to Immigrants from China by Disability Age 18 to 34

In terms of disability age 18 to 34, the demographic groups most similar to Immigrants from China are Filipino (5.4%, a difference of 0.070%), Immigrants from Guyana (5.5%, a difference of 0.56%), Guyanese (5.5%, a difference of 1.1%), Immigrants from Uzbekistan (5.5%, a difference of 1.2%), and Vietnamese (5.5%, a difference of 1.3%).
DemographicsRating | RankDisability Age 18 to 34
Immigrants | Armenia
100.0
/100
|
#1
Exceptional
5.0%
Immigrants | Hong Kong
100.0
/100
|
#2
Exceptional
5.2%
Immigrants | Grenada
100.0
/100
|
#3
Exceptional
5.3%
Immigrants | Cuba
100.0
/100
|
#4
Exceptional
5.4%
Immigrants | Taiwan
100.0
/100
|
#5
Exceptional
5.4%
Filipinos
100.0
/100
|
#6
Exceptional
5.4%
Immigrants | China
100.0
/100
|
#7
Exceptional
5.4%
Immigrants | Guyana
100.0
/100
|
#8
Exceptional
5.5%
Guyanese
100.0
/100
|
#9
Exceptional
5.5%
Immigrants | Uzbekistan
100.0
/100
|
#10
Exceptional
5.5%
Vietnamese
100.0
/100
|
#11
Exceptional
5.5%
Immigrants | St. Vincent and the Grenadines
100.0
/100
|
#12
Exceptional
5.5%
Immigrants | Iran
100.0
/100
|
#13
Exceptional
5.5%
Indians (Asian)
100.0
/100
|
#14
Exceptional
5.5%
Immigrants | India
100.0
/100
|
#15
Exceptional
5.6%