Basque vs Comanche Cognitive Disability
COMPARE
Basque
Comanche
Cognitive Disability
Cognitive Disability Comparison
Basques
Comanche
17.1%
COGNITIVE DISABILITY
85.5/ 100
METRIC RATING
150th/ 347
METRIC RANK
18.6%
COGNITIVE DISABILITY
0.0/ 100
METRIC RATING
319th/ 347
METRIC RANK
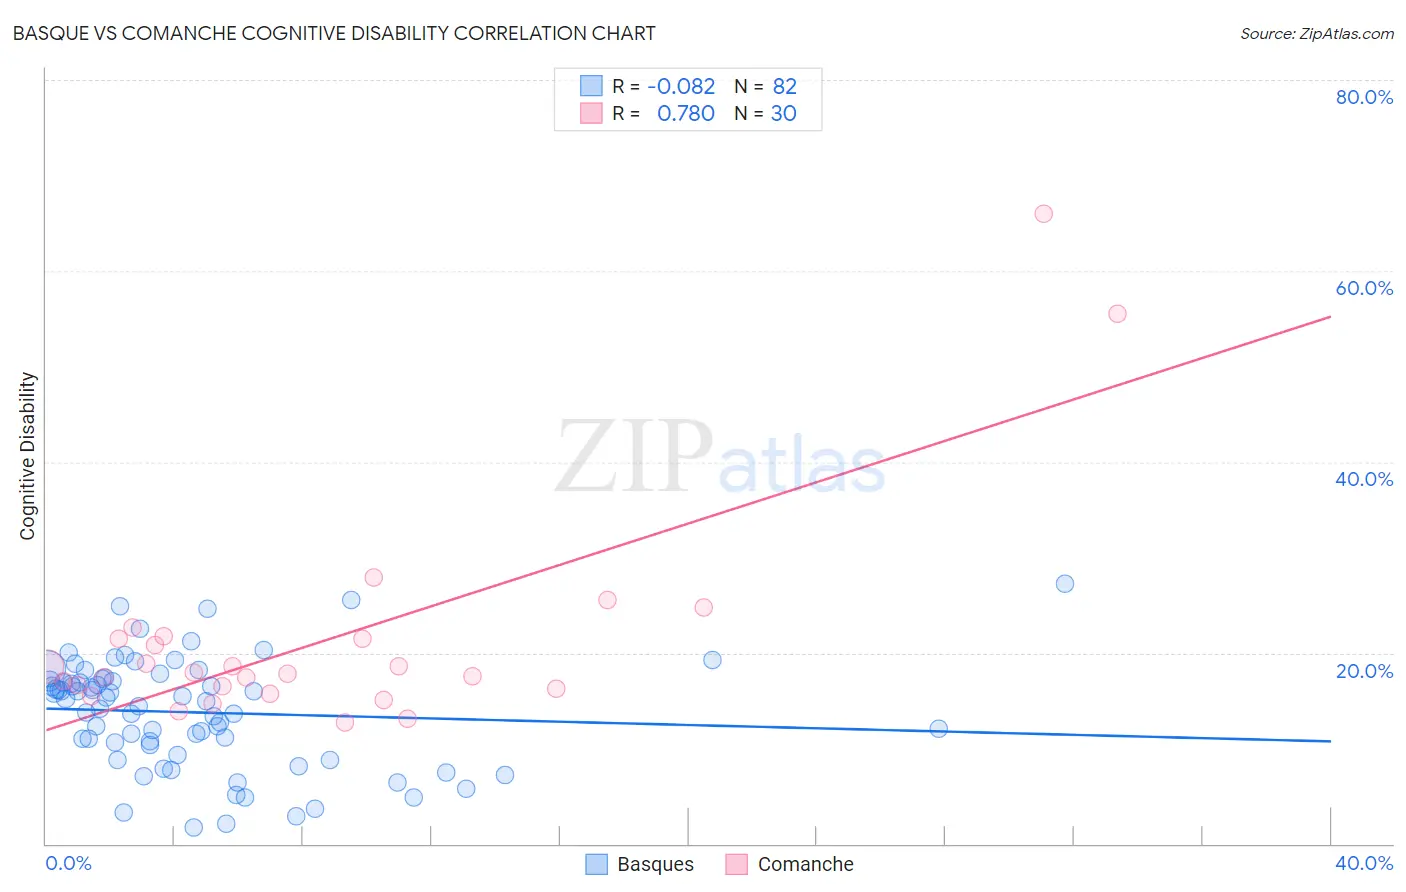
Basque vs Comanche Cognitive Disability Correlation Chart
The statistical analysis conducted on geographies consisting of 165,778,299 people shows a slight negative correlation between the proportion of Basques and percentage of population with cognitive disability in the United States with a correlation coefficient (R) of -0.082 and weighted average of 17.1%. Similarly, the statistical analysis conducted on geographies consisting of 109,776,806 people shows a strong positive correlation between the proportion of Comanche and percentage of population with cognitive disability in the United States with a correlation coefficient (R) of 0.780 and weighted average of 18.6%, a difference of 9.1%.
Cognitive Disability Correlation Summary
| Measurement | Basque | Comanche |
| Minimum | 1.7% | 12.7% |
| Maximum | 27.3% | 66.0% |
| Range | 25.6% | 53.3% |
| Mean | 13.8% | 21.3% |
| Median | 15.1% | 17.9% |
| Interquartile 25% (IQ1) | 10.4% | 16.2% |
| Interquartile 75% (IQ3) | 17.1% | 21.5% |
| Interquartile Range (IQR) | 6.7% | 5.3% |
| Standard Deviation (Sample) | 5.7% | 11.4% |
| Standard Deviation (Population) | 5.6% | 11.2% |
Similar Demographics by Cognitive Disability
Demographics Similar to Basques by Cognitive Disability
In terms of cognitive disability, the demographic groups most similar to Basques are French Canadian (17.1%, a difference of 0.010%), Cypriot (17.1%, a difference of 0.010%), Scotch-Irish (17.1%, a difference of 0.030%), Syrian (17.1%, a difference of 0.13%), and Immigrants from Indonesia (17.1%, a difference of 0.15%).
| Demographics | Rating | Rank | Cognitive Disability |
| British | 89.3 /100 | #143 | Excellent 17.0% |
| Immigrants | Brazil | 89.3 /100 | #144 | Excellent 17.0% |
| Immigrants | South Eastern Asia | 88.7 /100 | #145 | Excellent 17.0% |
| Costa Ricans | 88.0 /100 | #146 | Excellent 17.0% |
| Scotch-Irish | 85.9 /100 | #147 | Excellent 17.1% |
| French Canadians | 85.7 /100 | #148 | Excellent 17.1% |
| Cypriots | 85.7 /100 | #149 | Excellent 17.1% |
| Basques | 85.5 /100 | #150 | Excellent 17.1% |
| Syrians | 83.0 /100 | #151 | Excellent 17.1% |
| Immigrants | Indonesia | 82.7 /100 | #152 | Excellent 17.1% |
| Immigrants | Kazakhstan | 80.5 /100 | #153 | Excellent 17.1% |
| Immigrants | Malaysia | 79.3 /100 | #154 | Good 17.1% |
| Brazilians | 78.9 /100 | #155 | Good 17.1% |
| Sri Lankans | 78.9 /100 | #156 | Good 17.1% |
| Immigrants | Australia | 76.0 /100 | #157 | Good 17.1% |
Demographics Similar to Comanche by Cognitive Disability
In terms of cognitive disability, the demographic groups most similar to Comanche are Bangladeshi (18.6%, a difference of 0.040%), Apache (18.6%, a difference of 0.040%), African (18.6%, a difference of 0.13%), Liberian (18.6%, a difference of 0.16%), and Immigrants from Liberia (18.7%, a difference of 0.19%).
| Demographics | Rating | Rank | Cognitive Disability |
| Chickasaw | 0.0 /100 | #312 | Tragic 18.5% |
| Yaqui | 0.0 /100 | #313 | Tragic 18.5% |
| Sub-Saharan Africans | 0.0 /100 | #314 | Tragic 18.5% |
| Immigrants | Dominica | 0.0 /100 | #315 | Tragic 18.6% |
| Immigrants | Middle Africa | 0.0 /100 | #316 | Tragic 18.6% |
| Liberians | 0.0 /100 | #317 | Tragic 18.6% |
| Bangladeshis | 0.0 /100 | #318 | Tragic 18.6% |
| Comanche | 0.0 /100 | #319 | Tragic 18.6% |
| Apache | 0.0 /100 | #320 | Tragic 18.6% |
| Africans | 0.0 /100 | #321 | Tragic 18.6% |
| Immigrants | Liberia | 0.0 /100 | #322 | Tragic 18.7% |
| Pueblo | 0.0 /100 | #323 | Tragic 18.7% |
| Dominicans | 0.0 /100 | #324 | Tragic 18.7% |
| Indonesians | 0.0 /100 | #325 | Tragic 18.7% |
| Immigrants | Senegal | 0.0 /100 | #326 | Tragic 18.7% |