Australian vs Immigrants from Belize Female Disability

COMPARE

Australian
Race
Ancestry
AfghanAfricanAlaska NativeAlaskan AthabascanAlbanianAleutAlsatianAmericanApacheArabArapahoArgentineanArmenianAssyrian/Chaldean/SyriacAustralianAustrianBahamianBangladeshiBarbadianBasqueBelgianBelizeanBermudanBhutaneseBlackfeetBolivianBrazilianBritishBritish West IndianBulgarianBurmeseCajunCambodianCanadianCape VerdeanCarpatho RusynCelticCentral AmericanCentral American IndianCherokeeCheyenneChickasawChileanChineseChippewaChoctawColombianColvilleComancheCosta RicanCreeCreekCroatianCrowCubanCypriotCzechCzechoslovakianDanishDelawareDominicanDutchDutch West IndianEastern EuropeanEcuadorianEgyptianEnglishEstonianEthiopianEuropeanFijianFilipinoFinnishFrenchFrench American IndianFrench CanadianGermanGerman RussianGhanaianGreekGuamanian/ChamorroGuatemalanGuyaneseHaitianHmongHonduranHopiHoumaHungarianIcelanderIndian (Asian)IndonesianInupiatIranianIraqiIrishIroquoisIsraeliItalianJamaicanJapaneseJordanianKenyanKiowaKoreanLaotianLatvianLebaneseLiberianLithuanianLumbeeLuxembourgerMacedonianMalaysianMalteseMarshalleseMenomineeMexicanMexican American IndianMongolianMoroccanNative HawaiianNavajoNepaleseNew ZealanderNicaraguanNigerianNorthern EuropeanNorwegianOkinawanOsageOttawaPaiutePakistaniPalestinianPanamanianParaguayanPennsylvania GermanPeruvianPimaPolishPortuguesePotawatomiPuebloPuerto RicanPuget Sound SalishRomanianRussianSalvadoranSamoanScandinavianScotch-IrishScottishSeminoleSenegaleseSerbianShoshoneSierra LeoneanSiouxSlavicSlovakSloveneSomaliSouth AfricanSouth AmericanSouth American IndianSoviet UnionSpaniardSpanishSpanish AmericanSpanish American IndianSri LankanSubsaharan AfricanSudaneseSwedishSwissSyrianTaiwaneseThaiTlingit-HaidaTohono O'OdhamTonganTrinidadian and TobagonianTsimshianTurkishU.S. Virgin IslanderUgandanUkrainianUruguayanUteVenezuelanVietnameseWelshWest IndianYakamaYaquiYugoslavianYumanYup'ikZimbabwean
Immigration
NonimmigrantsImmigrantsAfghanistanAfricaAlbaniaArgentinaArmeniaAsiaAustraliaAustriaBahamasBangladeshBarbadosBelarusBelgiumBoliviaBosnia and HerzegovinaBrazilBulgariaBurma/MyanmarCabo VerdeCambodiaCameroonCanadaCaribbeanCentral AmericaChileChinaColombiaCongoCosta RicaCroatiaCubaCzechoslovakiaDenmarkDominicaDominican RepublicEastern AfricaEastern AsiaEastern EuropeEcuadorEgyptEl SalvadorEnglandEritreaEthiopiaEuropeFijiFranceGermanyGhanaGreeceGrenadaGuatemalaGuyanaHaitiHondurasHong KongHungaryIndiaIndonesiaIranIraqIrelandIsraelItalyJamaicaJapanJordanKazakhstanKenyaKoreaKuwaitLaosLatin AmericaLatviaLebanonLiberiaLithuaniaMalaysiaMexicoMicronesiaMiddle AfricaMoldovaMoroccoNepalNetherlandsNicaraguaNigeriaNorth AmericaNorth MacedoniaNorthern AfricaNorthern EuropeNorwayOceaniaPakistanPanamaPeruPhilippinesPolandPortugalRomaniaRussiaSaudi ArabiaScotlandSenegalSerbiaSierra LeoneSingaporeSomaliaSouth AfricaSouth AmericaSouth Central AsiaSouth Eastern AsiaSouthern EuropeSpainSri LankaSt. Vincent and the GrenadinesSudanSwedenSwitzerlandSyriaTaiwanThailandTrinidad and TobagoTurkeyUgandaUkraineUruguayUzbekistanVenezuelaVietnamWest IndiesWestern AfricaWestern AsiaWestern EuropeYemenZaireZimbabweAzores
Immigrants from Belize
Race
Ancestry
AfghanAfricanAlaska NativeAlaskan AthabascanAlbanianAleutAlsatianAmericanApacheArabArapahoArgentineanArmenianAssyrian/Chaldean/SyriacAustrianBahamianBangladeshiBarbadianBasqueBelgianBelizeanBermudanBhutaneseBlackfeetBolivianBrazilianBritishBritish West IndianBulgarianBurmeseCajunCambodianCanadianCape VerdeanCarpatho RusynCelticCentral AmericanCentral American IndianCherokeeCheyenneChickasawChileanChineseChippewaChoctawColombianColvilleComancheCosta RicanCreeCreekCroatianCrowCubanCypriotCzechCzechoslovakianDanishDelawareDominicanDutchDutch West IndianEastern EuropeanEcuadorianEgyptianEnglishEstonianEthiopianEuropeanFijianFilipinoFinnishFrenchFrench American IndianFrench CanadianGermanGerman RussianGhanaianGreekGuamanian/ChamorroGuatemalanGuyaneseHaitianHmongHonduranHopiHoumaHungarianIcelanderIndian (Asian)IndonesianInupiatIranianIraqiIrishIroquoisIsraeliItalianJamaicanJapaneseJordanianKenyanKiowaKoreanLaotianLatvianLebaneseLiberianLithuanianLumbeeLuxembourgerMacedonianMalaysianMalteseMarshalleseMenomineeMexicanMexican American IndianMongolianMoroccanNative HawaiianNavajoNepaleseNew ZealanderNicaraguanNigerianNorthern EuropeanNorwegianOkinawanOsageOttawaPaiutePakistaniPalestinianPanamanianParaguayanPennsylvania GermanPeruvianPimaPolishPortuguesePotawatomiPuebloPuerto RicanPuget Sound SalishRomanianRussianSalvadoranSamoanScandinavianScotch-IrishScottishSeminoleSenegaleseSerbianShoshoneSierra LeoneanSiouxSlavicSlovakSloveneSomaliSouth AfricanSouth AmericanSouth American IndianSoviet UnionSpaniardSpanishSpanish AmericanSpanish American IndianSri LankanSubsaharan AfricanSudaneseSwedishSwissSyrianTaiwaneseThaiTlingit-HaidaTohono O'OdhamTonganTrinidadian and TobagonianTsimshianTurkishU.S. Virgin IslanderUgandanUkrainianUruguayanUteVenezuelanVietnameseWelshWest IndianYakamaYaquiYugoslavianYumanYup'ikZimbabwean
Immigration
NonimmigrantsImmigrantsAfghanistanAfricaAlbaniaArgentinaArmeniaAsiaAustraliaAustriaBahamasBangladeshBarbadosBelarusBelgiumBelizeBoliviaBosnia and HerzegovinaBrazilBulgariaBurma/MyanmarCabo VerdeCambodiaCameroonCanadaCaribbeanCentral AmericaChileChinaColombiaCongoCosta RicaCroatiaCubaCzechoslovakiaDenmarkDominicaDominican RepublicEastern AfricaEastern AsiaEastern EuropeEcuadorEgyptEl SalvadorEnglandEritreaEthiopiaEuropeFijiFranceGermanyGhanaGreeceGrenadaGuatemalaGuyanaHaitiHondurasHong KongHungaryIndiaIndonesiaIranIraqIrelandIsraelItalyJamaicaJapanJordanKazakhstanKenyaKoreaKuwaitLaosLatin AmericaLatviaLebanonLiberiaLithuaniaMalaysiaMexicoMicronesiaMiddle AfricaMoldovaMoroccoNepalNetherlandsNicaraguaNigeriaNorth AmericaNorth MacedoniaNorthern AfricaNorthern EuropeNorwayOceaniaPakistanPanamaPeruPhilippinesPolandPortugalRomaniaRussiaSaudi ArabiaScotlandSenegalSerbiaSierra LeoneSingaporeSomaliaSouth AfricaSouth AmericaSouth Central AsiaSouth Eastern AsiaSouthern EuropeSpainSri LankaSt. Vincent and the GrenadinesSudanSwedenSwitzerlandSyriaTaiwanThailandTrinidad and TobagoTurkeyUgandaUkraineUruguayUzbekistanVenezuelaVietnamWest IndiesWestern AfricaWestern AsiaWestern EuropeYemenZaireZimbabweAzores
Female Disability
Income
Poverty
Unemployment
Labor Participation
Family Structure
Vehicle Availability
Education Level
Disability

Female Disability Comparison

Australians

Immigrants from Belize

Exceptional
Tragic
11.7%
FEMALE DISABILITY
98.3/ 100
METRIC RATING
105th/ 347
METRIC RANK
12.5%
FEMALE DISABILITY
7.0/ 100
METRIC RATING
230th/ 347
METRIC RANK

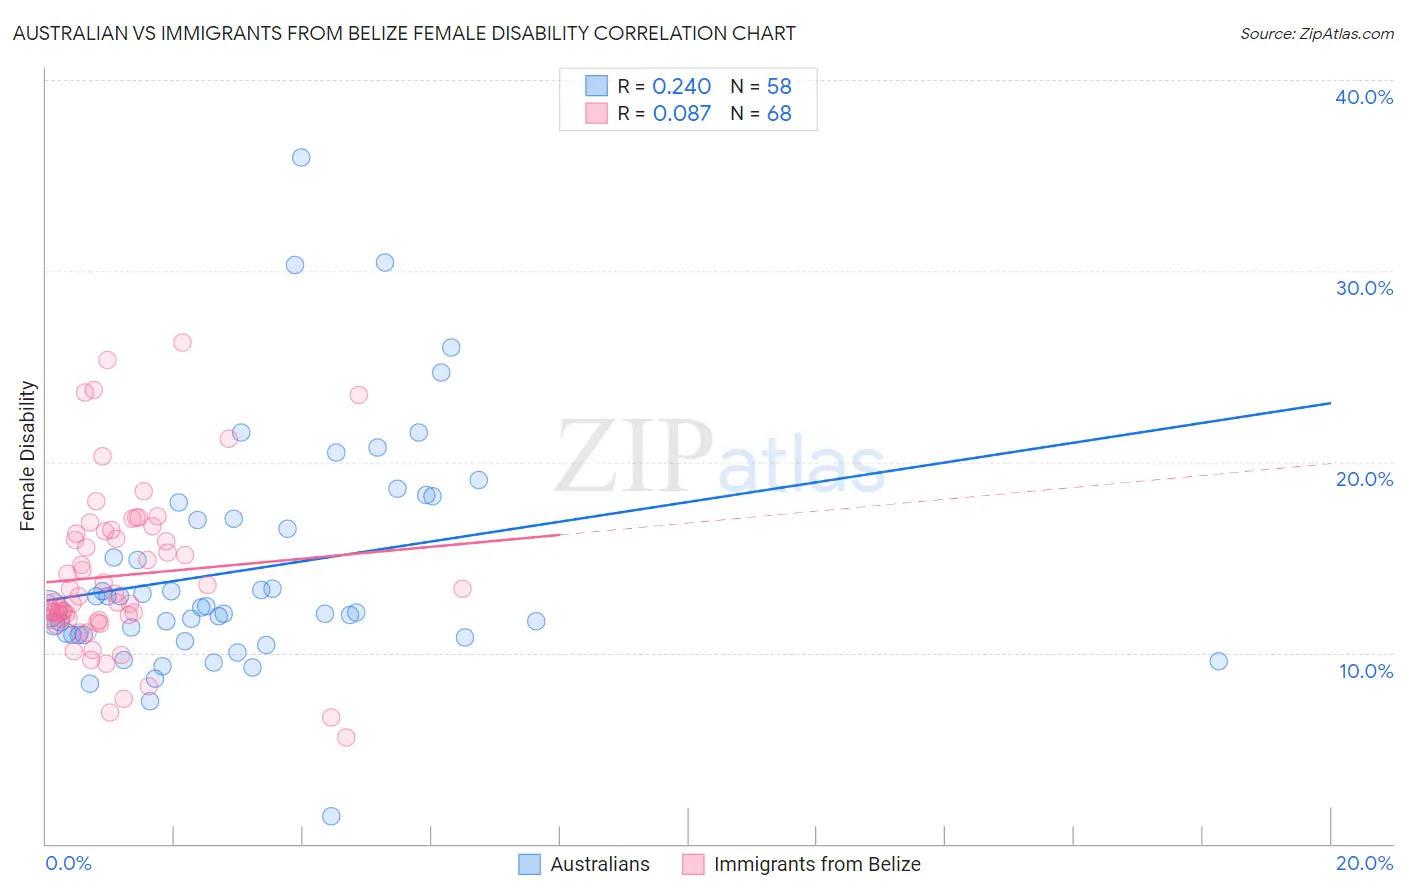
Australian vs Immigrants from Belize Female Disability Correlation Chart

The statistical analysis conducted on geographies consisting of 224,135,349 people shows a weak positive correlation between the proportion of Australians and percentage of females with a disability in the United States with a correlation coefficient (R) of 0.240 and weighted average of 11.7%. Similarly, the statistical analysis conducted on geographies consisting of 130,293,394 people shows a slight positive correlation between the proportion of Immigrants from Belize and percentage of females with a disability in the United States with a correlation coefficient (R) of 0.087 and weighted average of 12.5%, a difference of 6.5%.
Australian vs Immigrants from Belize Female Disability

Female Disability Correlation Summary

MeasurementAustralianImmigrants from Belize
Minimum1.4%5.5%
Maximum36.0%26.2%
Range34.5%20.7%
Mean14.4%14.0%
Median12.3%12.8%
Interquartile 25% (IQ1)11.0%11.8%
Interquartile 75% (IQ3)17.0%16.3%
Interquartile Range (IQR)6.1%4.5%
Standard Deviation (Sample)6.1%4.3%
Standard Deviation (Population)6.0%4.2%

Similar Demographics by Female Disability

Demographics Similar to Australians by Female Disability

In terms of female disability, the demographic groups most similar to Australians are Immigrants from Eastern Africa (11.7%, a difference of 0.020%), Immigrants from Western Asia (11.7%, a difference of 0.020%), Immigrants from Greece (11.7%, a difference of 0.030%), Latvian (11.7%, a difference of 0.050%), and New Zealander (11.7%, a difference of 0.080%).
DemographicsRating | RankFemale Disability
Uruguayans
98.8
/100
|
#98
Exceptional
11.7%
Immigrants | Philippines
98.6
/100
|
#99
Exceptional
11.7%
Immigrants | Uruguay
98.5
/100
|
#100
Exceptional
11.7%
Immigrants | Costa Rica
98.4
/100
|
#101
Exceptional
11.7%
Immigrants | South Eastern Asia
98.4
/100
|
#102
Exceptional
11.7%
Immigrants | Eastern Africa
98.3
/100
|
#103
Exceptional
11.7%
Immigrants | Western Asia
98.3
/100
|
#104
Exceptional
11.7%
Australians
98.3
/100
|
#105
Exceptional
11.7%
Immigrants | Greece
98.2
/100
|
#106
Exceptional
11.7%
Latvians
98.2
/100
|
#107
Exceptional
11.7%
New Zealanders
98.1
/100
|
#108
Exceptional
11.7%
Immigrants | Immigrants
98.1
/100
|
#109
Exceptional
11.7%
Soviet Union
98.1
/100
|
#110
Exceptional
11.7%
Costa Ricans
98.1
/100
|
#111
Exceptional
11.7%
Immigrants | Bangladesh
97.8
/100
|
#112
Exceptional
11.8%

Demographics Similar to Immigrants from Belize by Female Disability

In terms of female disability, the demographic groups most similar to Immigrants from Belize are Hungarian (12.5%, a difference of 0.030%), Belgian (12.5%, a difference of 0.070%), Immigrants from Cambodia (12.5%, a difference of 0.11%), Assyrian/Chaldean/Syriac (12.5%, a difference of 0.13%), and Hispanic or Latino (12.5%, a difference of 0.14%).
DemographicsRating | RankFemale Disability
Guamanians/Chamorros
9.5
/100
|
#223
Tragic
12.5%
Belizeans
9.3
/100
|
#224
Tragic
12.5%
Poles
8.4
/100
|
#225
Tragic
12.5%
Hispanics or Latinos
8.0
/100
|
#226
Tragic
12.5%
Assyrians/Chaldeans/Syriacs
8.0
/100
|
#227
Tragic
12.5%
Immigrants | Cambodia
7.8
/100
|
#228
Tragic
12.5%
Hungarians
7.2
/100
|
#229
Tragic
12.5%
Immigrants | Belize
7.0
/100
|
#230
Tragic
12.5%
Belgians
6.5
/100
|
#231
Tragic
12.5%
Immigrants | Somalia
5.9
/100
|
#232
Tragic
12.5%
Immigrants | Iraq
5.3
/100
|
#233
Tragic
12.5%
Scandinavians
5.3
/100
|
#234
Tragic
12.5%
Malaysians
5.0
/100
|
#235
Tragic
12.5%
Immigrants | West Indies
4.4
/100
|
#236
Tragic
12.6%
Slavs
3.8
/100
|
#237
Tragic
12.6%