Assyrian/Chaldean/Syriac vs Immigrants from Belgium Male Disability
COMPARE
Assyrian/Chaldean/Syriac
Immigrants from Belgium
Male Disability
Male Disability Comparison
Assyrians/Chaldeans/Syriacs
Immigrants from Belgium
11.4%
MALE DISABILITY
23.2/ 100
METRIC RATING
192nd/ 347
METRIC RANK
10.8%
MALE DISABILITY
94.2/ 100
METRIC RATING
108th/ 347
METRIC RANK
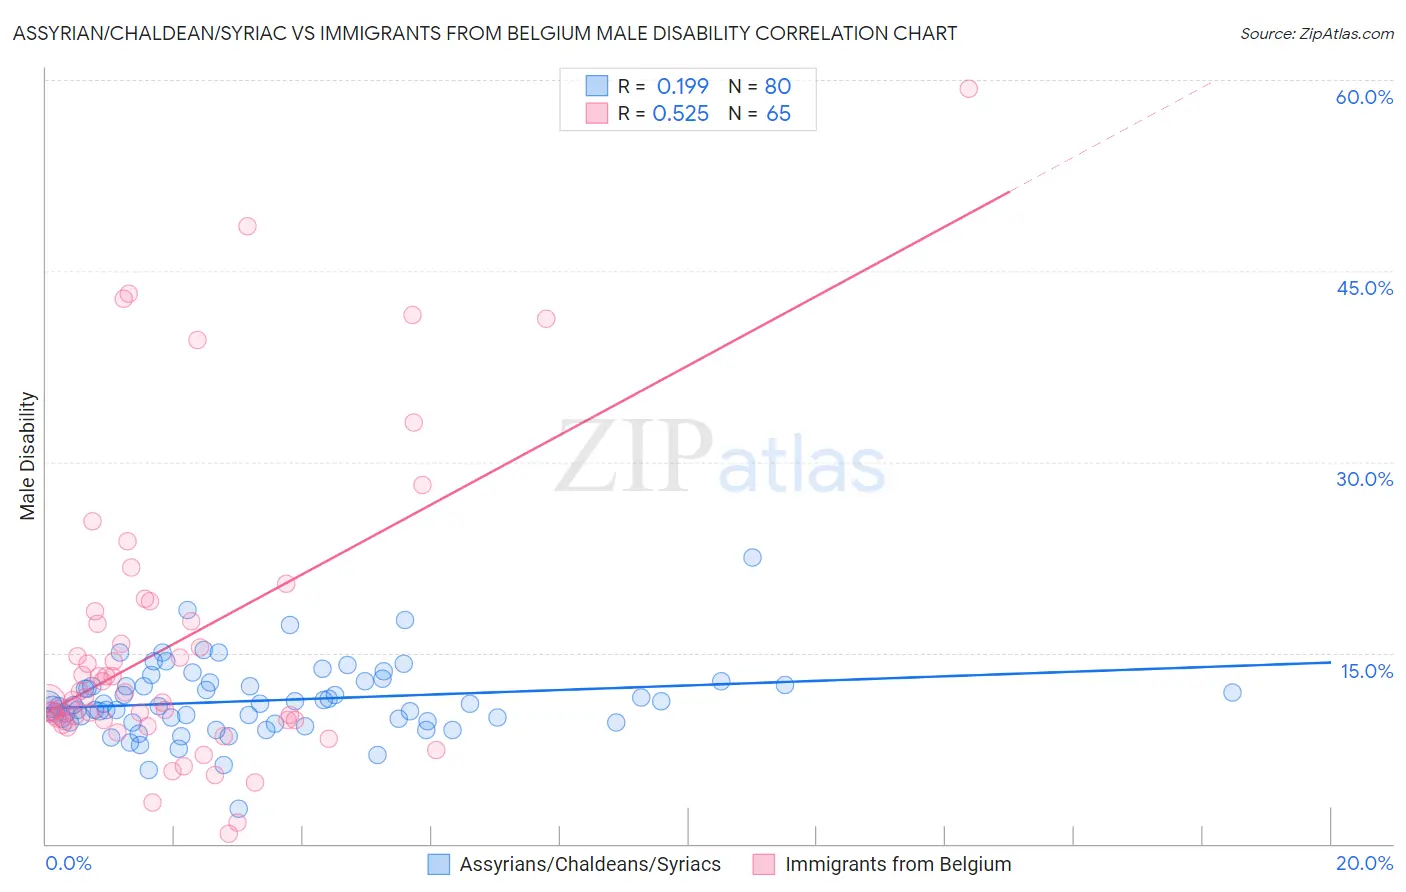
Assyrian/Chaldean/Syriac vs Immigrants from Belgium Male Disability Correlation Chart
The statistical analysis conducted on geographies consisting of 110,312,508 people shows a poor positive correlation between the proportion of Assyrians/Chaldeans/Syriacs and percentage of males with a disability in the United States with a correlation coefficient (R) of 0.199 and weighted average of 11.4%. Similarly, the statistical analysis conducted on geographies consisting of 146,717,814 people shows a substantial positive correlation between the proportion of Immigrants from Belgium and percentage of males with a disability in the United States with a correlation coefficient (R) of 0.525 and weighted average of 10.8%, a difference of 5.7%.
Male Disability Correlation Summary
| Measurement | Assyrian/Chaldean/Syriac | Immigrants from Belgium |
| Minimum | 2.8% | 0.83% |
| Maximum | 22.5% | 59.3% |
| Range | 19.7% | 58.5% |
| Mean | 11.3% | 15.9% |
| Median | 10.9% | 11.3% |
| Interquartile 25% (IQ1) | 9.6% | 9.7% |
| Interquartile 75% (IQ3) | 12.6% | 17.9% |
| Interquartile Range (IQR) | 3.0% | 8.2% |
| Standard Deviation (Sample) | 2.9% | 11.9% |
| Standard Deviation (Population) | 2.9% | 11.8% |
Similar Demographics by Male Disability
Demographics Similar to Assyrians/Chaldeans/Syriacs by Male Disability
In terms of male disability, the demographic groups most similar to Assyrians/Chaldeans/Syriacs are Senegalese (11.4%, a difference of 0.0%), Greek (11.4%, a difference of 0.070%), Belizean (11.4%, a difference of 0.15%), Immigrants from Bosnia and Herzegovina (11.4%, a difference of 0.16%), and Immigrants from Oceania (11.4%, a difference of 0.18%).
| Demographics | Rating | Rank | Male Disability |
| Pakistanis | 30.3 /100 | #185 | Fair 11.3% |
| Immigrants | Zaire | 27.6 /100 | #186 | Fair 11.4% |
| Immigrants | Austria | 27.3 /100 | #187 | Fair 11.4% |
| Estonians | 26.8 /100 | #188 | Fair 11.4% |
| Immigrants | Netherlands | 25.9 /100 | #189 | Fair 11.4% |
| Immigrants | Bosnia and Herzegovina | 25.4 /100 | #190 | Fair 11.4% |
| Senegalese | 23.2 /100 | #191 | Fair 11.4% |
| Assyrians/Chaldeans/Syriacs | 23.2 /100 | #192 | Fair 11.4% |
| Greeks | 22.2 /100 | #193 | Fair 11.4% |
| Belizeans | 21.2 /100 | #194 | Fair 11.4% |
| Immigrants | Oceania | 20.9 /100 | #195 | Fair 11.4% |
| West Indians | 18.4 /100 | #196 | Poor 11.4% |
| Somalis | 18.2 /100 | #197 | Poor 11.4% |
| Immigrants | Jamaica | 16.3 /100 | #198 | Poor 11.5% |
| Lebanese | 15.4 /100 | #199 | Poor 11.5% |
Demographics Similar to Immigrants from Belgium by Male Disability
In terms of male disability, the demographic groups most similar to Immigrants from Belgium are Immigrants from Eastern Africa (10.8%, a difference of 0.020%), Immigrants from Uganda (10.8%, a difference of 0.050%), Immigrants (10.8%, a difference of 0.080%), Immigrants from Uruguay (10.8%, a difference of 0.11%), and Immigrants from Syria (10.8%, a difference of 0.19%).
| Demographics | Rating | Rank | Male Disability |
| Immigrants | Greece | 95.6 /100 | #101 | Exceptional 10.7% |
| Immigrants | Eastern Europe | 95.3 /100 | #102 | Exceptional 10.7% |
| Uruguayans | 95.3 /100 | #103 | Exceptional 10.7% |
| Immigrants | Nigeria | 95.1 /100 | #104 | Exceptional 10.8% |
| Immigrants | Brazil | 95.0 /100 | #105 | Exceptional 10.8% |
| Immigrants | Syria | 94.9 /100 | #106 | Exceptional 10.8% |
| Immigrants | Eastern Africa | 94.3 /100 | #107 | Exceptional 10.8% |
| Immigrants | Belgium | 94.2 /100 | #108 | Exceptional 10.8% |
| Immigrants | Uganda | 94.0 /100 | #109 | Exceptional 10.8% |
| Immigrants | Immigrants | 93.9 /100 | #110 | Exceptional 10.8% |
| Immigrants | Uruguay | 93.8 /100 | #111 | Exceptional 10.8% |
| Ghanaians | 93.4 /100 | #112 | Exceptional 10.8% |
| Immigrants | Zimbabwe | 93.0 /100 | #113 | Exceptional 10.8% |
| Central Americans | 92.7 /100 | #114 | Exceptional 10.8% |
| Immigrants | Barbados | 92.2 /100 | #115 | Exceptional 10.8% |