Aleut vs German Cognitive Disability
COMPARE
Aleut
German
Cognitive Disability
Cognitive Disability Comparison
Aleuts
Germans
17.0%
COGNITIVE DISABILITY
89.9/ 100
METRIC RATING
141st/ 347
METRIC RANK
16.7%
COGNITIVE DISABILITY
99.3/ 100
METRIC RATING
72nd/ 347
METRIC RANK
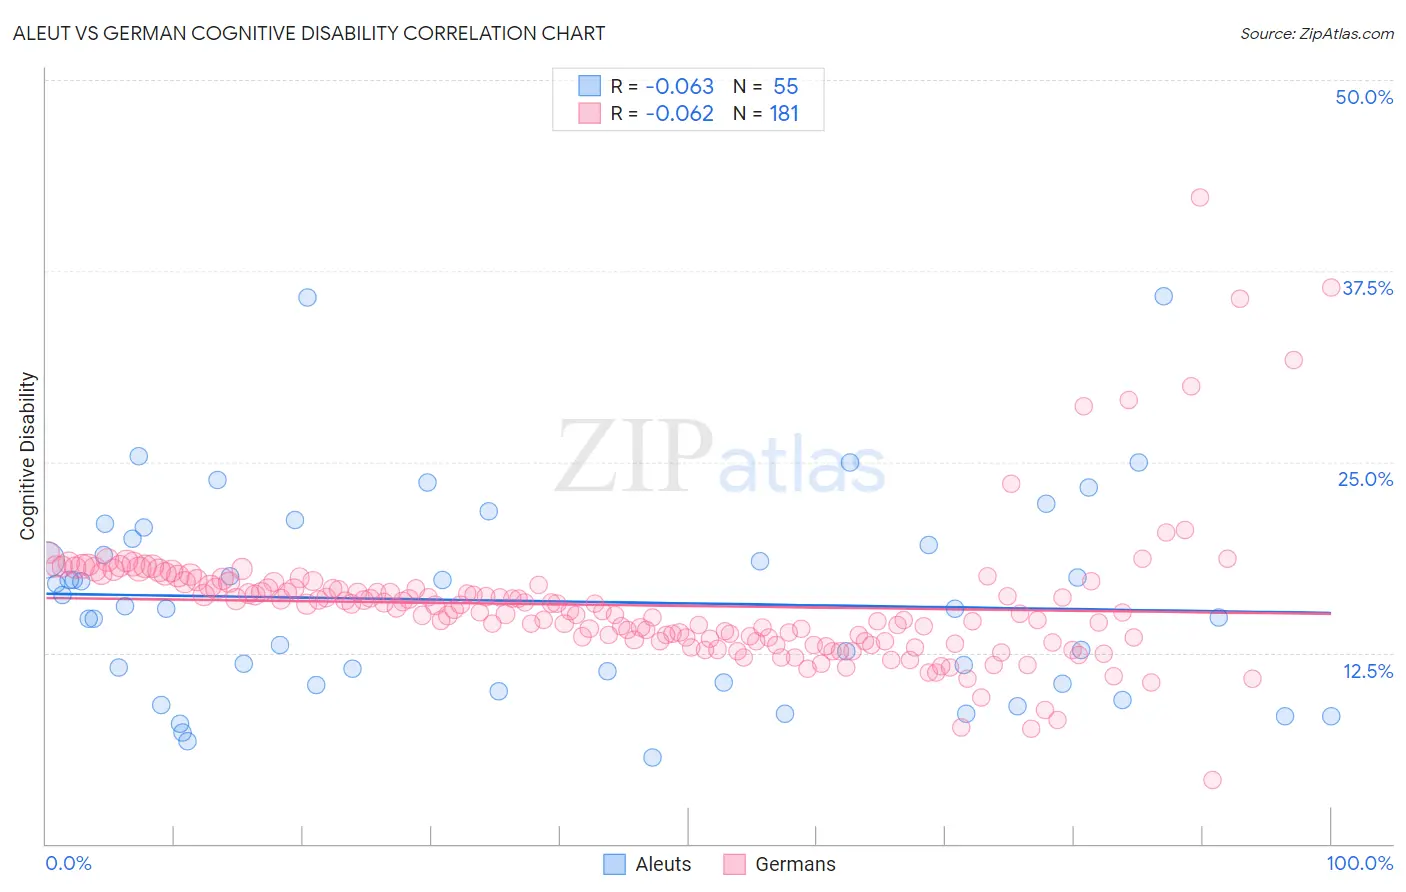
Aleut vs German Cognitive Disability Correlation Chart
The statistical analysis conducted on geographies consisting of 61,782,027 people shows a slight negative correlation between the proportion of Aleuts and percentage of population with cognitive disability in the United States with a correlation coefficient (R) of -0.063 and weighted average of 17.0%. Similarly, the statistical analysis conducted on geographies consisting of 580,999,229 people shows a slight negative correlation between the proportion of Germans and percentage of population with cognitive disability in the United States with a correlation coefficient (R) of -0.062 and weighted average of 16.7%, a difference of 2.1%.
Cognitive Disability Correlation Summary
| Measurement | Aleut | German |
| Minimum | 5.7% | 4.2% |
| Maximum | 35.8% | 42.3% |
| Range | 30.2% | 38.1% |
| Mean | 15.9% | 15.6% |
| Median | 15.4% | 15.2% |
| Interquartile 25% (IQ1) | 10.5% | 13.3% |
| Interquartile 75% (IQ3) | 20.0% | 16.9% |
| Interquartile Range (IQR) | 9.5% | 3.7% |
| Standard Deviation (Sample) | 6.6% | 4.5% |
| Standard Deviation (Population) | 6.6% | 4.5% |
Similar Demographics by Cognitive Disability
Demographics Similar to Aleuts by Cognitive Disability
In terms of cognitive disability, the demographic groups most similar to Aleuts are French (17.0%, a difference of 0.0%), Chilean (17.0%, a difference of 0.0%), Carpatho Rusyn (17.0%, a difference of 0.020%), British (17.0%, a difference of 0.050%), and Immigrants from Brazil (17.0%, a difference of 0.050%).
| Demographics | Rating | Rank | Cognitive Disability |
| Immigrants | Chile | 91.7 /100 | #134 | Exceptional 17.0% |
| Lebanese | 91.3 /100 | #135 | Exceptional 17.0% |
| Israelis | 91.0 /100 | #136 | Exceptional 17.0% |
| Immigrants | Norway | 90.9 /100 | #137 | Exceptional 17.0% |
| Welsh | 90.8 /100 | #138 | Exceptional 17.0% |
| French | 90.0 /100 | #139 | Excellent 17.0% |
| Chileans | 89.9 /100 | #140 | Excellent 17.0% |
| Aleuts | 89.9 /100 | #141 | Excellent 17.0% |
| Carpatho Rusyns | 89.6 /100 | #142 | Excellent 17.0% |
| British | 89.3 /100 | #143 | Excellent 17.0% |
| Immigrants | Brazil | 89.3 /100 | #144 | Excellent 17.0% |
| Immigrants | South Eastern Asia | 88.7 /100 | #145 | Excellent 17.0% |
| Costa Ricans | 88.0 /100 | #146 | Excellent 17.0% |
| Scotch-Irish | 85.9 /100 | #147 | Excellent 17.1% |
| French Canadians | 85.7 /100 | #148 | Excellent 17.1% |
Demographics Similar to Germans by Cognitive Disability
In terms of cognitive disability, the demographic groups most similar to Germans are Burmese (16.7%, a difference of 0.010%), Slavic (16.7%, a difference of 0.010%), Immigrants from Sweden (16.7%, a difference of 0.020%), Immigrants from Belgium (16.7%, a difference of 0.020%), and Estonian (16.7%, a difference of 0.020%).
| Demographics | Rating | Rank | Cognitive Disability |
| Colombians | 99.6 /100 | #65 | Exceptional 16.6% |
| Immigrants | Ukraine | 99.5 /100 | #66 | Exceptional 16.6% |
| Latvians | 99.5 /100 | #67 | Exceptional 16.6% |
| Ukrainians | 99.4 /100 | #68 | Exceptional 16.6% |
| Immigrants | Uzbekistan | 99.4 /100 | #69 | Exceptional 16.7% |
| Immigrants | Sweden | 99.4 /100 | #70 | Exceptional 16.7% |
| Immigrants | Belgium | 99.3 /100 | #71 | Exceptional 16.7% |
| Germans | 99.3 /100 | #72 | Exceptional 16.7% |
| Burmese | 99.3 /100 | #73 | Exceptional 16.7% |
| Slavs | 99.3 /100 | #74 | Exceptional 16.7% |
| Estonians | 99.3 /100 | #75 | Exceptional 16.7% |
| Immigrants | Serbia | 99.3 /100 | #76 | Exceptional 16.7% |
| Immigrants | Hungary | 99.3 /100 | #77 | Exceptional 16.7% |
| Peruvians | 99.3 /100 | #78 | Exceptional 16.7% |
| Immigrants | Bulgaria | 99.3 /100 | #79 | Exceptional 16.7% |