Zip Codes with the Highest Percentage of Population with a Degree in Liberal Arts and History in Hartford, CT
RELATED REPORTS & OPTIONS
Liberal Arts and History
Hartford
Compare Zip Codes
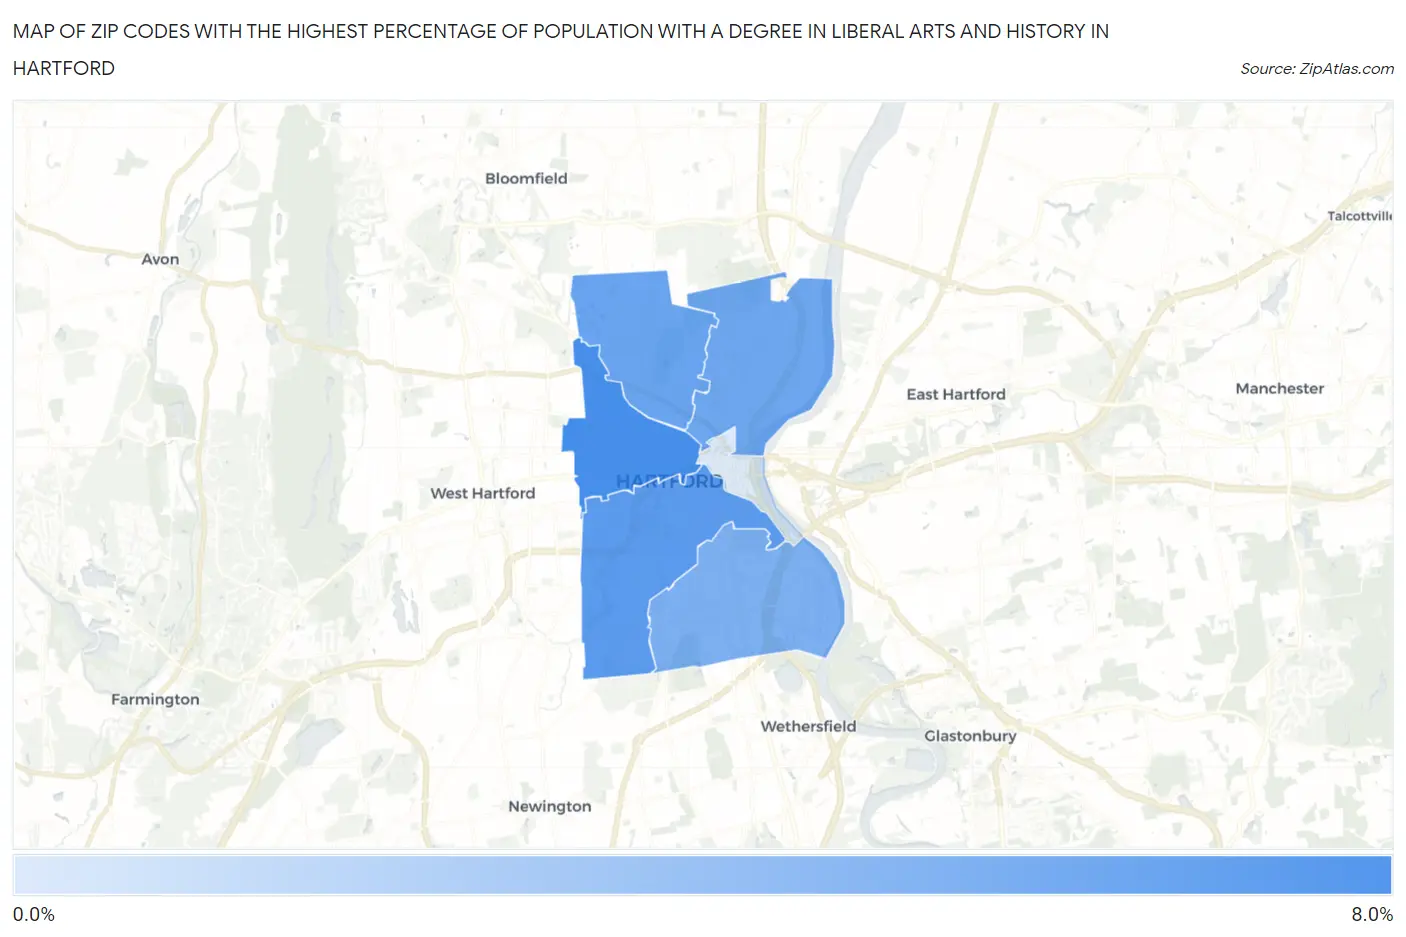
Map of Zip Codes with the Highest Percentage of Population with a Degree in Liberal Arts and History in Hartford
0.0%
8.0%
Zip Codes with the Highest Percentage of Population with a Degree in Liberal Arts and History in Hartford, CT
| Zip Code | % Graduates | vs State | vs National | |
| 1. | 06105 | 7.6% | 5.5%(+2.09)#45 | 4.9%(+2.71)#5,473 |
| 2. | 06106 | 6.8% | 5.5%(+1.27)#62 | 4.9%(+1.88)#6,818 |
| 3. | 06112 | 6.0% | 5.5%(+0.535)#104 | 4.9%(+1.15)#8,467 |
| 4. | 06120 | 5.8% | 5.5%(+0.284)#114 | 4.9%(+0.899)#9,115 |
| 5. | 06114 | 5.2% | 5.5%(-0.316)#139 | 4.9%(+0.300)#10,813 |
| 6. | 06103 | 1.0% | 5.5%(-4.47)#253 | 4.9%(-3.86)#23,360 |
1
Common Questions
What are the Top 5 Zip Codes with the Highest Percentage of Population with a Degree in Liberal Arts and History in Hartford, CT?
Top 5 Zip Codes with the Highest Percentage of Population with a Degree in Liberal Arts and History in Hartford, CT are:
What zip code has the Highest Percentage of Population with a Degree in Liberal Arts and History in Hartford, CT?
06105 has the Highest Percentage of Population with a Degree in Liberal Arts and History in Hartford, CT with 7.6%.
What is the Percentage of Population with a Degree in Liberal Arts and History in Hartford, CT?
Percentage of Population with a Degree in Liberal Arts and History in Hartford is 6.2%.
What is the Percentage of Population with a Degree in Liberal Arts and History in Connecticut?
Percentage of Population with a Degree in Liberal Arts and History in Connecticut is 5.5%.
What is the Percentage of Population with a Degree in Liberal Arts and History in the United States?
Percentage of Population with a Degree in Liberal Arts and History in the United States is 4.9%.