Zip Codes with the Highest Percentage of Population Employed in Security & Protection in Hartford, CT
RELATED REPORTS & OPTIONS
Security & Protection
Hartford
Compare Zip Codes
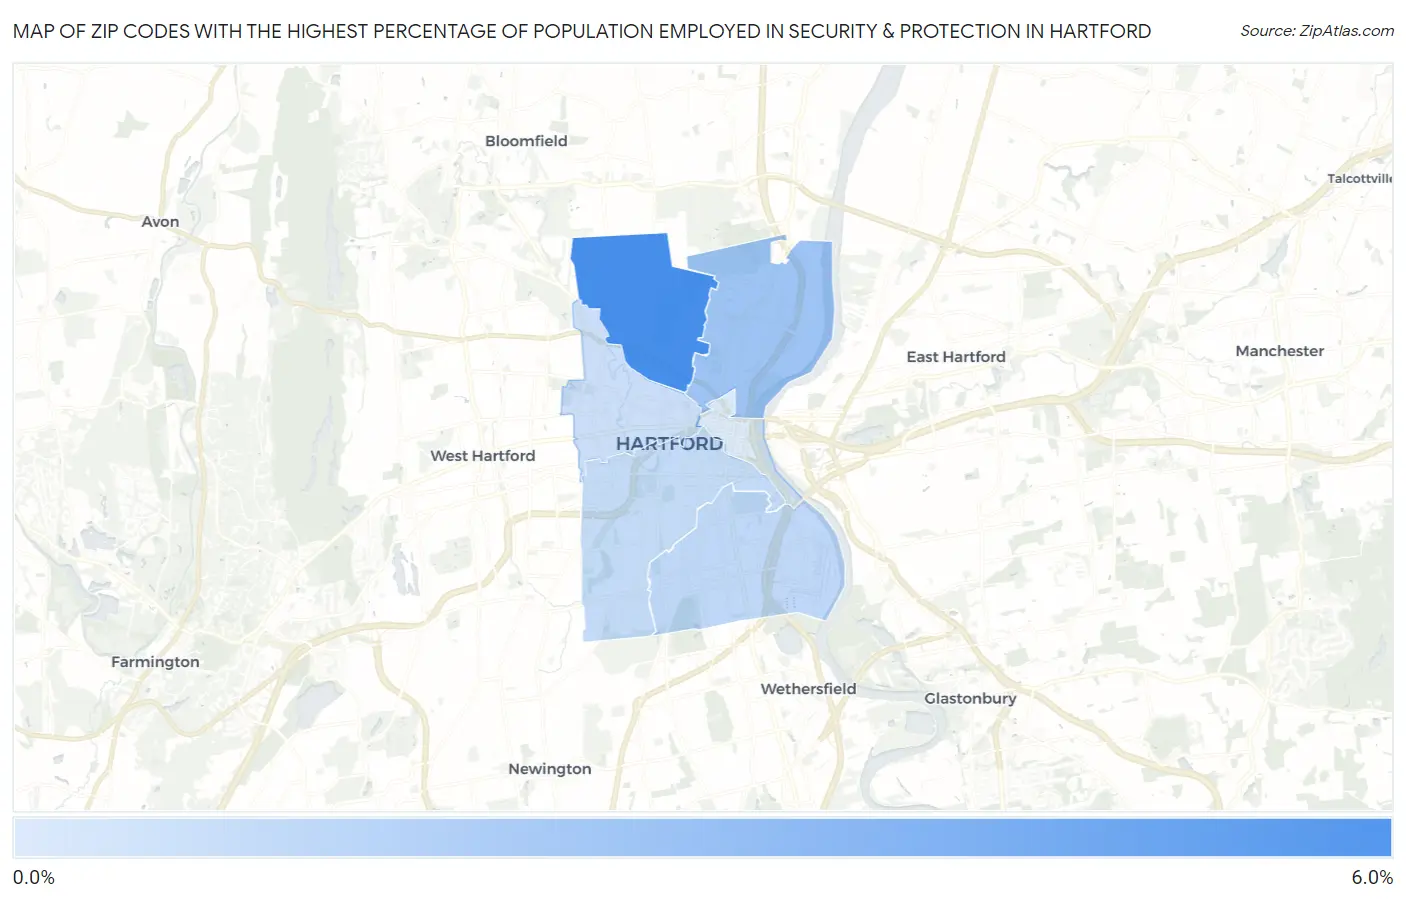
Map of Zip Codes with the Highest Percentage of Population Employed in Security & Protection in Hartford
0.0%
6.0%
Zip Codes with the Highest Percentage of Population Employed in Security & Protection in Hartford, CT
| Zip Code | % Employed | vs State | vs National | |
| 1. | 06112 | 5.6% | 1.8%(+3.77)#7 | 2.1%(+3.43)#2,389 |
| 2. | 06120 | 2.9% | 1.8%(+1.09)#43 | 2.1%(+0.750)#7,641 |
| 3. | 06114 | 1.9% | 1.8%(+0.133)#104 | 2.1%(-0.203)#12,917 |
| 4. | 06106 | 1.8% | 1.8%(+0.012)#116 | 2.1%(-0.324)#13,751 |
| 5. | 06105 | 1.6% | 1.8%(-0.228)#134 | 2.1%(-0.564)#15,536 |
| 6. | 06103 | 1.1% | 1.8%(-0.740)#176 | 2.1%(-1.08)#19,487 |
1
Common Questions
What are the Top 5 Zip Codes with the Highest Percentage of Population Employed in Security & Protection in Hartford, CT?
Top 5 Zip Codes with the Highest Percentage of Population Employed in Security & Protection in Hartford, CT are:
What zip code has the Highest Percentage of Population Employed in Security & Protection in Hartford, CT?
06112 has the Highest Percentage of Population Employed in Security & Protection in Hartford, CT with 5.6%.
What is the Percentage of Population Employed in Security & Protection in Hartford, CT?
Percentage of Population Employed in Security & Protection in Hartford is 2.5%.
What is the Percentage of Population Employed in Security & Protection in Connecticut?
Percentage of Population Employed in Security & Protection in Connecticut is 1.8%.
What is the Percentage of Population Employed in Security & Protection in the United States?
Percentage of Population Employed in Security & Protection in the United States is 2.1%.