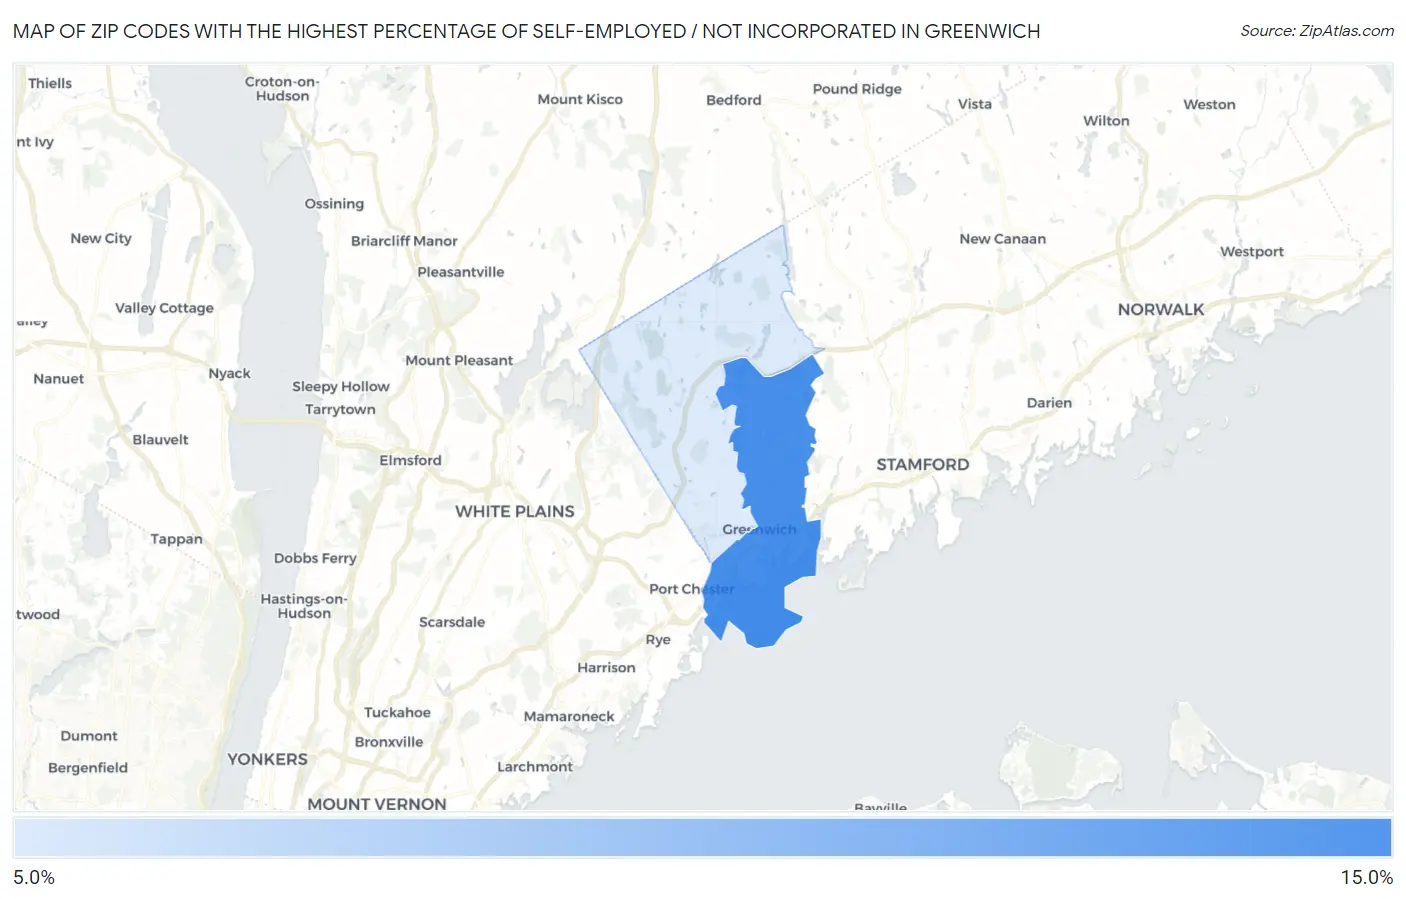
Zip Codes with the Highest Percentage of Self-Employed / Not Incorporated in Greenwich, CT
RELATED REPORTS & OPTIONS
Self-Employed / Not Incorporated
Greenwich
Compare Zip Codes
Map of Zip Codes with the Highest Percentage of Self-Employed / Not Incorporated in Greenwich
0.0%
15.0%
Zip Codes with the Highest Percentage of Self-Employed / Not Incorporated in Greenwich, CT
| Zip Code | % Self-Employed / Not Incorporated | vs State | vs National | |
| 1. | 06830 | 10.9% | 6.1%(+4.79)#37 | 5.8%(+5.04)#6,349 |
| 2. | 06831 | 7.6% | 6.1%(+1.57)#88 | 5.8%(+1.81)#11,477 |
1
Common Questions
What are the Top Zip Codes with the Highest Percentage of Self-Employed / Not Incorporated in Greenwich, CT?
Top Zip Codes with the Highest Percentage of Self-Employed / Not Incorporated in Greenwich, CT are:
What zip code has the Highest Percentage of Self-Employed / Not Incorporated in Greenwich, CT?
06830 has the Highest Percentage of Self-Employed / Not Incorporated in Greenwich, CT with 10.9%.
What is the Percentage of Self-Employed / Not Incorporated in Greenwich, CT?
Percentage of Self-Employed / Not Incorporated in Greenwich is 11.0%.
What is the Percentage of Self-Employed / Not Incorporated in Connecticut?
Percentage of Self-Employed / Not Incorporated in Connecticut is 6.1%.
What is the Percentage of Self-Employed / Not Incorporated in the United States?
Percentage of Self-Employed / Not Incorporated in the United States is 5.8%.