Zip Codes with the Highest Percentage of Population Employed in Office & Administration in Colorado Springs, CO
RELATED REPORTS & OPTIONS
Office & Administration
Colorado Springs
Compare Zip Codes
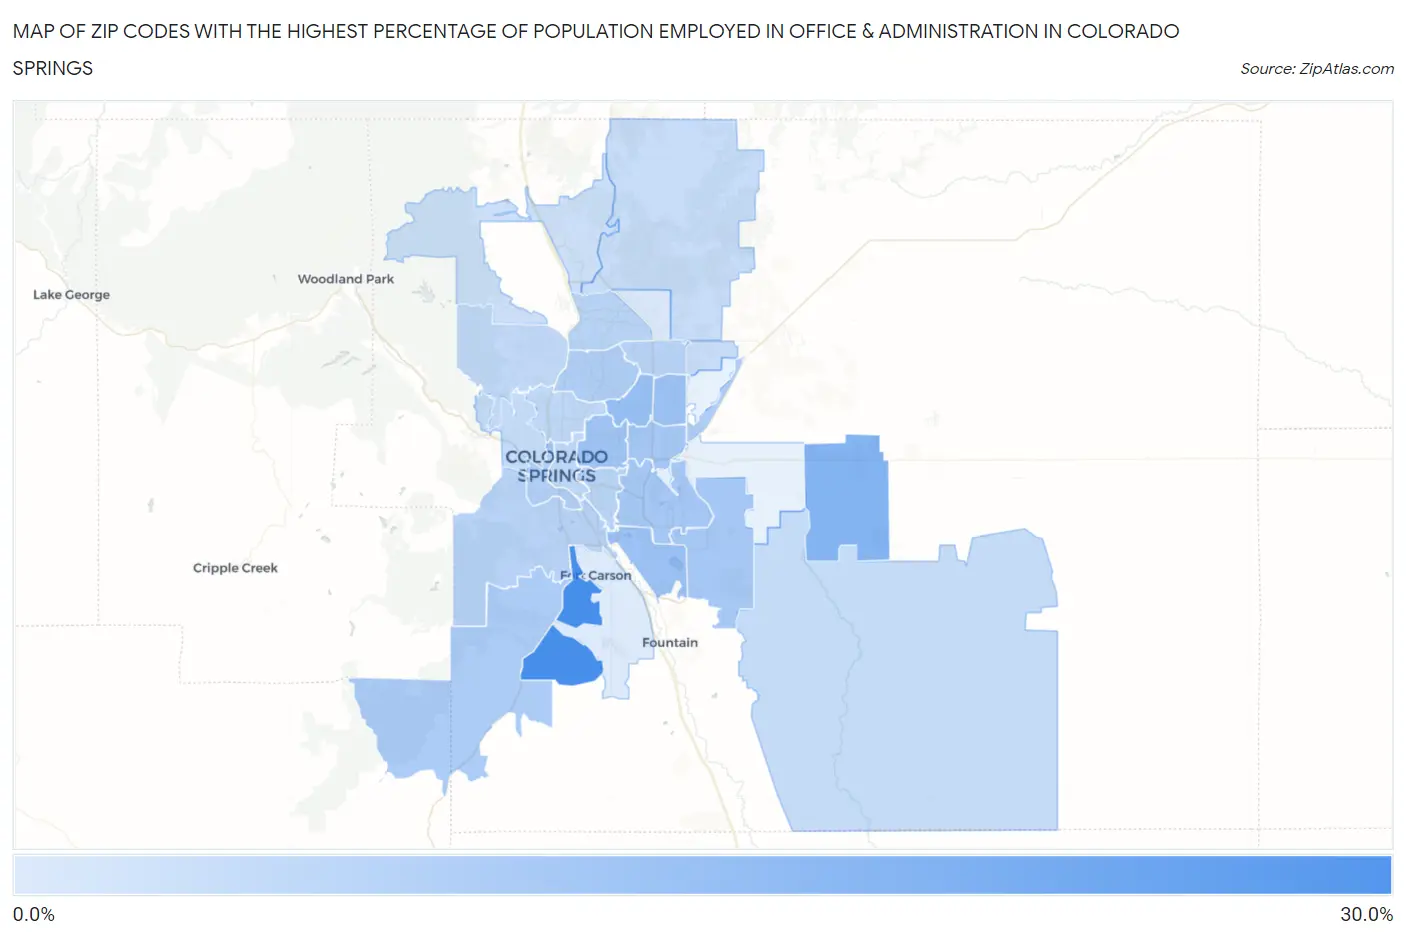
Map of Zip Codes with the Highest Percentage of Population Employed in Office & Administration in Colorado Springs
0.0%
30.0%
Zip Codes with the Highest Percentage of Population Employed in Office & Administration in Colorado Springs, CO
| Zip Code | % Employed | vs State | vs National | |
| 1. | 80902 | 26.1% | 10.1%(+15.9)#10 | 10.9%(+15.2)#828 |
| 2. | 80930 | 17.4% | 10.1%(+7.25)#44 | 10.9%(+6.52)#2,656 |
| 3. | 80917 | 14.6% | 10.1%(+4.44)#68 | 10.9%(+3.71)#5,166 |
| 4. | 80922 | 14.2% | 10.1%(+4.07)#73 | 10.9%(+3.35)#5,697 |
| 5. | 80911 | 14.0% | 10.1%(+3.91)#79 | 10.9%(+3.18)#5,951 |
| 6. | 80909 | 13.5% | 10.1%(+3.39)#87 | 10.9%(+2.66)#6,872 |
| 7. | 80916 | 12.9% | 10.1%(+2.77)#108 | 10.9%(+2.04)#8,306 |
| 8. | 80925 | 12.7% | 10.1%(+2.55)#112 | 10.9%(+1.82)#8,844 |
| 9. | 80915 | 12.7% | 10.1%(+2.55)#113 | 10.9%(+1.82)#8,849 |
| 10. | 80926 | 11.8% | 10.1%(+1.70)#139 | 10.9%(+0.974)#11,249 |
| 11. | 80951 | 11.6% | 10.1%(+1.48)#143 | 10.9%(+0.755)#11,909 |
| 12. | 80918 | 11.6% | 10.1%(+1.43)#147 | 10.9%(+0.708)#12,060 |
| 13. | 80905 | 11.3% | 10.1%(+1.14)#159 | 10.9%(+0.413)#12,983 |
| 14. | 80923 | 10.4% | 10.1%(+0.313)#197 | 10.9%(-0.412)#15,684 |
| 15. | 80906 | 10.4% | 10.1%(+0.289)#199 | 10.9%(-0.437)#15,758 |
| 16. | 80910 | 10.1% | 10.1%(-0.003)#218 | 10.9%(-0.729)#16,707 |
| 17. | 80920 | 9.9% | 10.1%(-0.190)#225 | 10.9%(-0.916)#17,310 |
| 18. | 80903 | 9.4% | 10.1%(-0.707)#251 | 10.9%(-1.43)#18,993 |
| 19. | 80907 | 9.4% | 10.1%(-0.751)#253 | 10.9%(-1.48)#19,147 |
| 20. | 80919 | 9.2% | 10.1%(-0.927)#258 | 10.9%(-1.65)#19,667 |
| 21. | 80928 | 8.6% | 10.1%(-1.57)#290 | 10.9%(-2.29)#21,527 |
| 22. | 80904 | 8.5% | 10.1%(-1.64)#294 | 10.9%(-2.37)#21,737 |
| 23. | 80908 | 8.3% | 10.1%(-1.81)#305 | 10.9%(-2.53)#22,168 |
| 24. | 80927 | 8.2% | 10.1%(-1.93)#312 | 10.9%(-2.66)#22,525 |
| 25. | 80921 | 7.6% | 10.1%(-2.49)#336 | 10.9%(-3.21)#23,832 |
| 26. | 80924 | 6.0% | 10.1%(-4.15)#397 | 10.9%(-4.88)#26,873 |
| 27. | 80913 | 5.7% | 10.1%(-4.47)#406 | 10.9%(-5.20)#27,319 |
1
Common Questions
What are the Top 10 Zip Codes with the Highest Percentage of Population Employed in Office & Administration in Colorado Springs, CO?
Top 10 Zip Codes with the Highest Percentage of Population Employed in Office & Administration in Colorado Springs, CO are:
What zip code has the Highest Percentage of Population Employed in Office & Administration in Colorado Springs, CO?
80902 has the Highest Percentage of Population Employed in Office & Administration in Colorado Springs, CO with 26.1%.
What is the Percentage of Population Employed in Office & Administration in Colorado Springs, CO?
Percentage of Population Employed in Office & Administration in Colorado Springs is 10.9%.
What is the Percentage of Population Employed in Office & Administration in Colorado?
Percentage of Population Employed in Office & Administration in Colorado is 10.1%.
What is the Percentage of Population Employed in Office & Administration in the United States?
Percentage of Population Employed in Office & Administration in the United States is 10.9%.