Norfork, AR
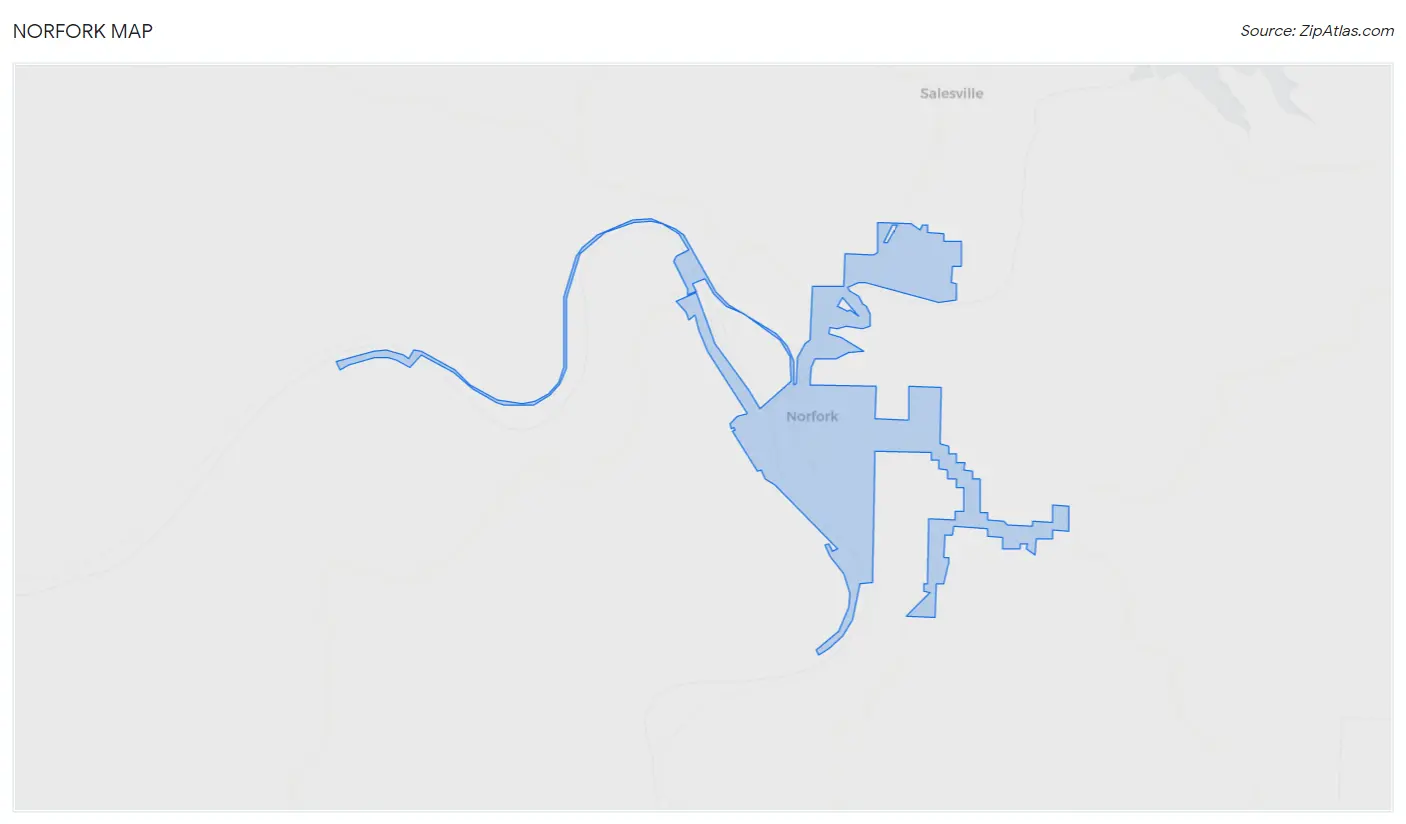
Norfork Map
Norfork Overview
554
TOTAL POPULATION
275
MALE POPULATION
279
FEMALE POPULATION
98.57
MALES / 100 FEMALES
101.45
FEMALES / 100 MALES
36.0
MEDIAN AGE
3.4
AVG FAMILY SIZE
2.7
AVG HOUSEHOLD SIZE
$15,744
PER CAPITA INCOME
$28,819
AVG FAMILY INCOME
$34,444
AVG HOUSEHOLD INCOME
66.4%
WAGE / INCOME GAP [ % ]
33.6¢/ $1
WAGE / INCOME GAP [ $ ]
$13,421
FAMILY INCOME DEFICIT
0.41
INEQUALITY / GINI INDEX
145
LABOR FORCE [ PEOPLE ]
39.2%
PERCENT IN LABOR FORCE
1.4%
UNEMPLOYMENT RATE
Norfork Zip Codes
Norfork Area Codes
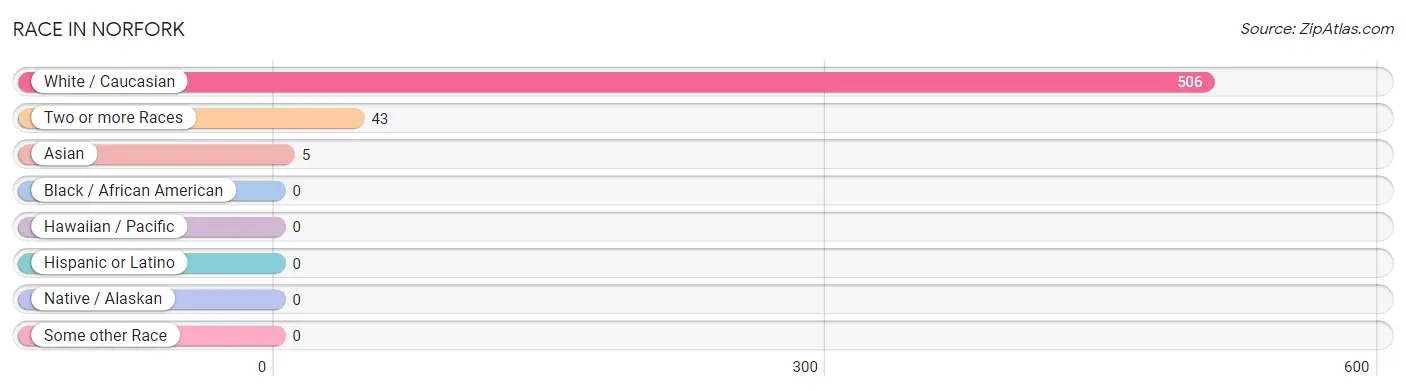
Race in Norfork
The most populous races in Norfork are White / Caucasian (506 | 91.3%), Two or more Races (43 | 7.8%), and Asian (5 | 0.9%).
| Race | # Population | % Population |
| Asian | 5 | 0.9% |
| Black / African American | 0 | 0.0% |
| Hawaiian / Pacific | 0 | 0.0% |
| Hispanic or Latino | 0 | 0.0% |
| Native / Alaskan | 0 | 0.0% |
| White / Caucasian | 506 | 91.3% |
| Two or more Races | 43 | 7.8% |
| Some other Race | 0 | 0.0% |
| Total | 554 | 100.0% |
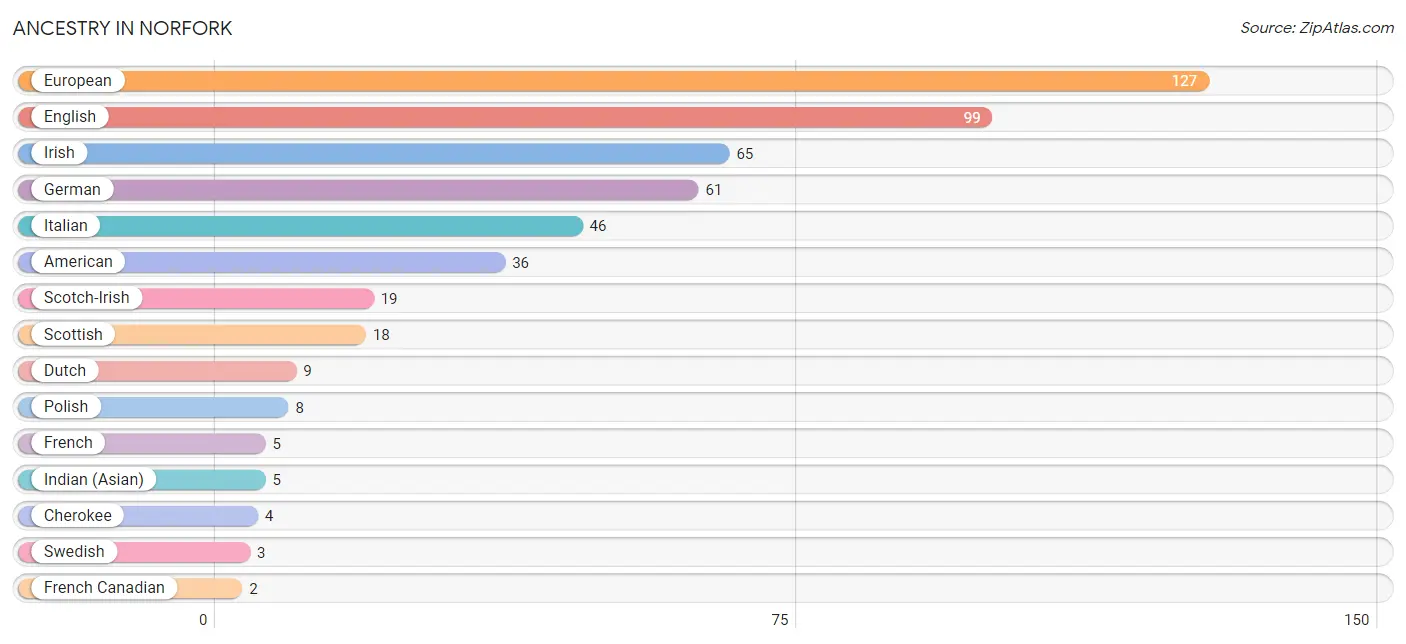
Ancestry in Norfork
The most populous ancestries reported in Norfork are European (127 | 22.9%), English (99 | 17.9%), Irish (65 | 11.7%), German (61 | 11.0%), and Italian (46 | 8.3%), together accounting for 71.8% of all Norfork residents.
| Ancestry | # Population | % Population |
| American | 36 | 6.5% |
| Cherokee | 4 | 0.7% |
| Choctaw | 1 | 0.2% |
| Dutch | 9 | 1.6% |
| English | 99 | 17.9% |
| European | 127 | 22.9% |
| French | 5 | 0.9% |
| French Canadian | 2 | 0.4% |
| German | 61 | 11.0% |
| Indian (Asian) | 5 | 0.9% |
| Irish | 65 | 11.7% |
| Italian | 46 | 8.3% |
| Pennsylvania German | 2 | 0.4% |
| Polish | 8 | 1.4% |
| Scotch-Irish | 19 | 3.4% |
| Scottish | 18 | 3.3% |
| Swedish | 3 | 0.5% | View All 17 Rows |
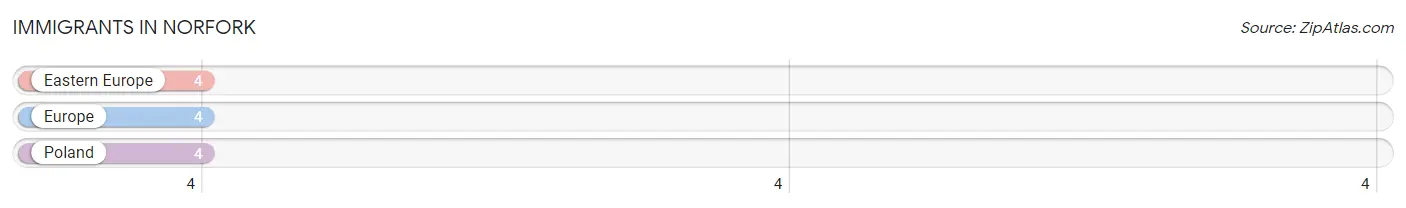
Immigrants in Norfork
The most numerous immigrant groups reported in Norfork came from Eastern Europe (4 | 0.7%), Europe (4 | 0.7%), and Poland (4 | 0.7%), together accounting for 2.2% of all Norfork residents.
| Immigration Origin | # Population | % Population |
| Eastern Europe | 4 | 0.7% |
| Europe | 4 | 0.7% |
| Poland | 4 | 0.7% | View All 3 Rows |
Sex and Age in Norfork
Sex and Age in Norfork
The most populous age groups in Norfork are Under 5 Years (52 | 18.9%) for men and 40 to 44 Years (44 | 15.8%) for women.
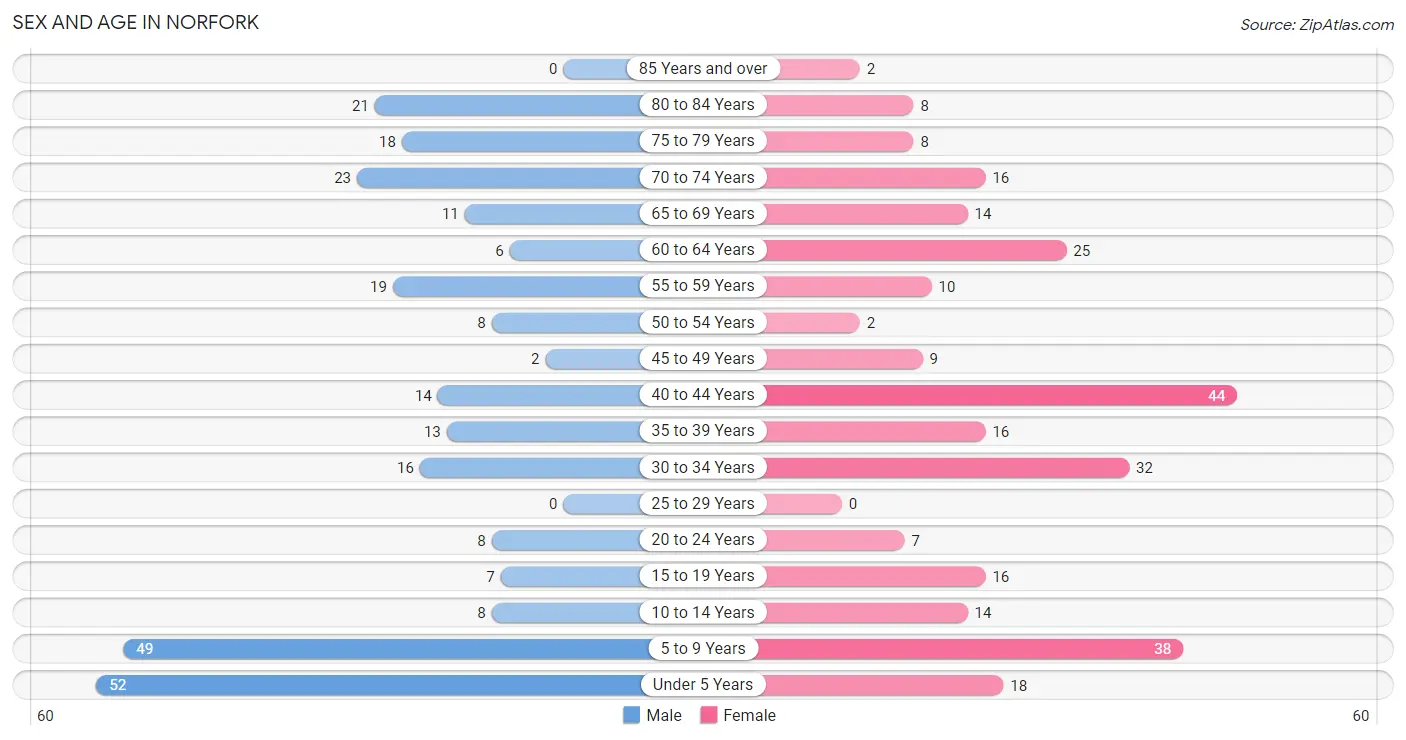
| Age Bracket | Male | Female |
| Under 5 Years | 52 (18.9%) | 18 (6.5%) |
| 5 to 9 Years | 49 (17.8%) | 38 (13.6%) |
| 10 to 14 Years | 8 (2.9%) | 14 (5.0%) |
| 15 to 19 Years | 7 (2.5%) | 16 (5.7%) |
| 20 to 24 Years | 8 (2.9%) | 7 (2.5%) |
| 25 to 29 Years | 0 (0.0%) | 0 (0.0%) |
| 30 to 34 Years | 16 (5.8%) | 32 (11.5%) |
| 35 to 39 Years | 13 (4.7%) | 16 (5.7%) |
| 40 to 44 Years | 14 (5.1%) | 44 (15.8%) |
| 45 to 49 Years | 2 (0.7%) | 9 (3.2%) |
| 50 to 54 Years | 8 (2.9%) | 2 (0.7%) |
| 55 to 59 Years | 19 (6.9%) | 10 (3.6%) |
| 60 to 64 Years | 6 (2.2%) | 25 (9.0%) |
| 65 to 69 Years | 11 (4.0%) | 14 (5.0%) |
| 70 to 74 Years | 23 (8.4%) | 16 (5.7%) |
| 75 to 79 Years | 18 (6.6%) | 8 (2.9%) |
| 80 to 84 Years | 21 (7.6%) | 8 (2.9%) |
| 85 Years and over | 0 (0.0%) | 2 (0.7%) |
| Total | 275 (100.0%) | 279 (100.0%) |
Families and Households in Norfork
Median Family Size in Norfork
The median family size in Norfork is 3.44 persons per family, with single female/mother families (52 | 40.9%) accounting for the largest median family size of 4.06 persons per family. On the other hand, married-couple families (71 | 55.9%) represent the smallest median family size with 2.99 persons per family.
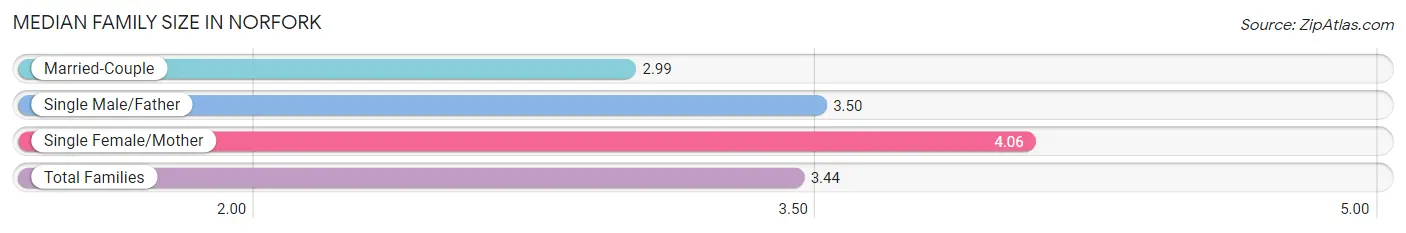
| Family Type | # Families | Family Size |
| Married-Couple | 71 (55.9%) | 2.99 |
| Single Male/Father | 4 (3.2%) | 3.50 |
| Single Female/Mother | 52 (40.9%) | 4.06 |
| Total Families | 127 (100.0%) | 3.44 |
Median Household Size in Norfork
The median household size in Norfork is 2.69 persons per household, with single male/father households (4 | 1.9%) accounting for the largest median household size of 5.25 persons per household. non-family households (79 | 38.4%) represent the smallest median household size with 1.19 persons per household.
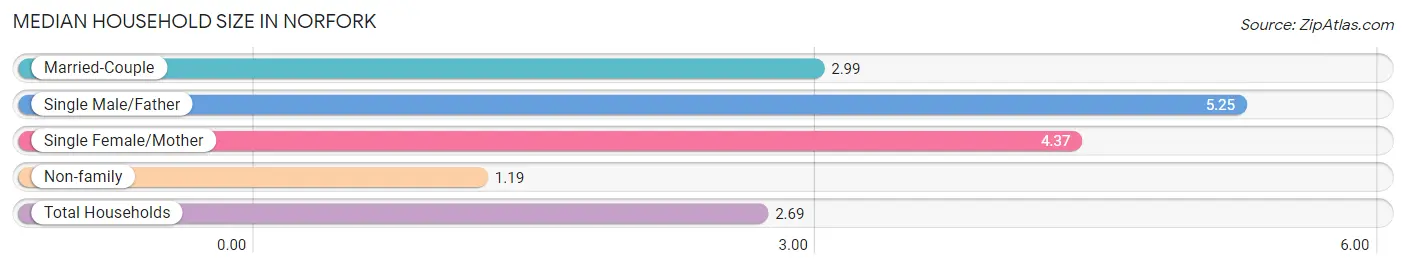
| Household Type | # Households | Household Size |
| Married-Couple | 71 (34.5%) | 2.99 |
| Single Male/Father | 4 (1.9%) | 5.25 |
| Single Female/Mother | 52 (25.2%) | 4.37 |
| Non-family | 79 (38.4%) | 1.19 |
| Total Households | 206 (100.0%) | 2.69 |
Household Size by Marriage Status in Norfork
Out of a total of 206 households in Norfork, 127 (61.7%) are family households, while 79 (38.4%) are nonfamily households. The most numerous type of family households are 4-person households, comprising 42, and the most common type of nonfamily households are 1-person households, comprising 68.
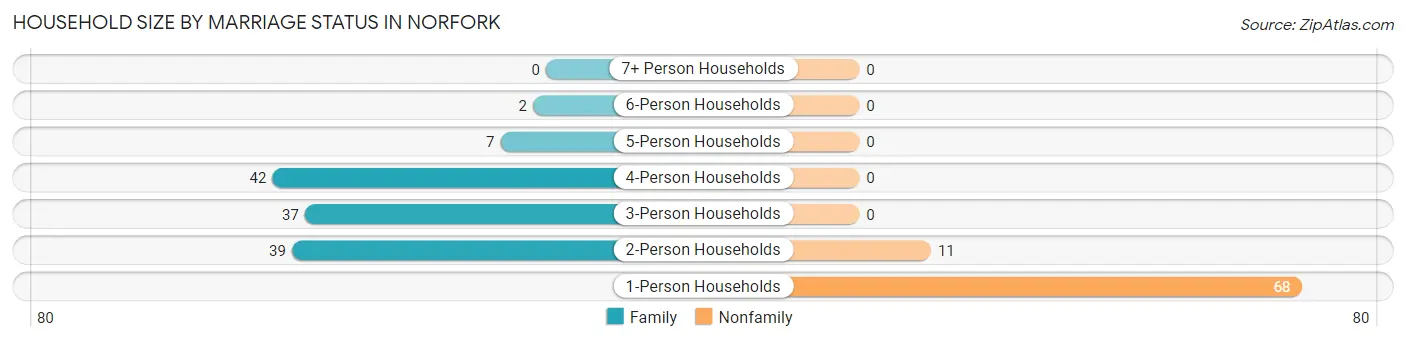
| Household Size | Family Households | Nonfamily Households |
| 1-Person Households | - | 68 (33.0%) |
| 2-Person Households | 39 (18.9%) | 11 (5.3%) |
| 3-Person Households | 37 (18.0%) | 0 (0.0%) |
| 4-Person Households | 42 (20.4%) | 0 (0.0%) |
| 5-Person Households | 7 (3.4%) | 0 (0.0%) |
| 6-Person Households | 2 (1.0%) | 0 (0.0%) |
| 7+ Person Households | 0 (0.0%) | 0 (0.0%) |
| Total | 127 (61.7%) | 79 (38.4%) |
Female Fertility in Norfork
Fertility by Age in Norfork
Average fertility rate in Norfork is 56.0 births per 1,000 women. Women in the age bracket of 20 to 34 years have the highest fertility rate with 103.0 births per 1,000 women. Women in the age bracket of 20 to 34 years acount for 57.1% of all women with births.
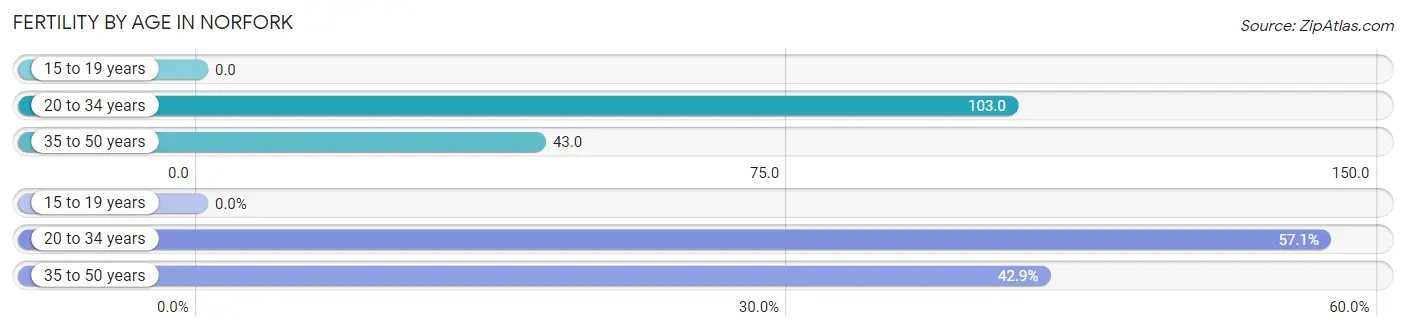
| Age Bracket | Women with Births | Births / 1,000 Women |
| 15 to 19 years | 0 (0.0%) | 0.0 |
| 20 to 34 years | 4 (57.1%) | 103.0 |
| 35 to 50 years | 3 (42.9%) | 43.0 |
| Total | 7 (100.0%) | 56.0 |
Fertility by Age by Marriage Status in Norfork
57.1% of women with births (7) in Norfork are married. The highest percentage of unmarried women with births falls into 35 to 50 years age bracket with 100.0% of them unmarried at the time of birth, while the lowest percentage of unmarried women with births belong to 20 to 34 years age bracket with 0.0% of them unmarried.
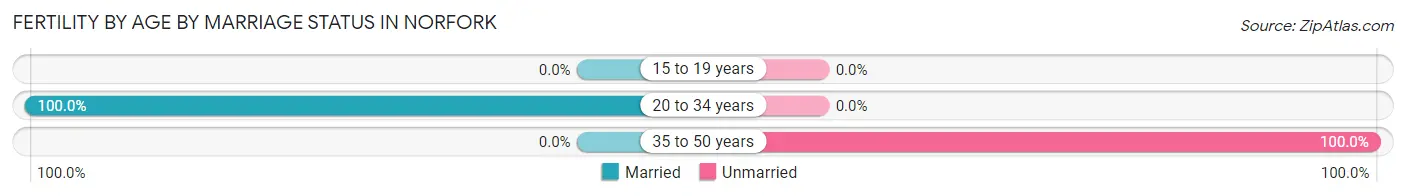
| Age Bracket | Married | Unmarried |
| 15 to 19 years | 0 (0.0%) | 0 (0.0%) |
| 20 to 34 years | 4 (100.0%) | 0 (0.0%) |
| 35 to 50 years | 0 (0.0%) | 3 (100.0%) |
| Total | 4 (57.1%) | 3 (42.9%) |
Fertility by Education in Norfork
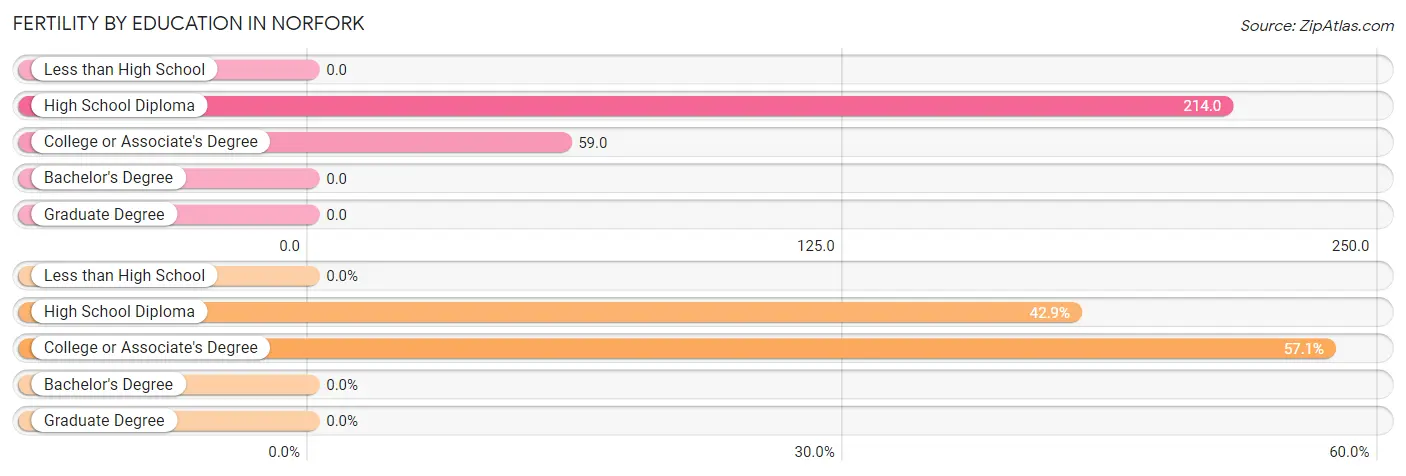
| Educational Attainment | Women with Births | Births / 1,000 Women |
| Less than High School | 0 (0.0%) | 0.0 |
| High School Diploma | 3 (42.9%) | 214.0 |
| College or Associate's Degree | 4 (57.1%) | 59.0 |
| Bachelor's Degree | 0 (0.0%) | 0.0 |
| Graduate Degree | 0 (0.0%) | 0.0 |
| Total | 7 (100.0%) | 56.0 |
Fertility by Education by Marriage Status in Norfork
42.9% of women with births in Norfork are unmarried. Women with the educational attainment of college or associate's degree are most likely to be married with 100.0% of them married at childbirth, while women with the educational attainment of high school diploma are least likely to be married with 100.0% of them unmarried at childbirth.
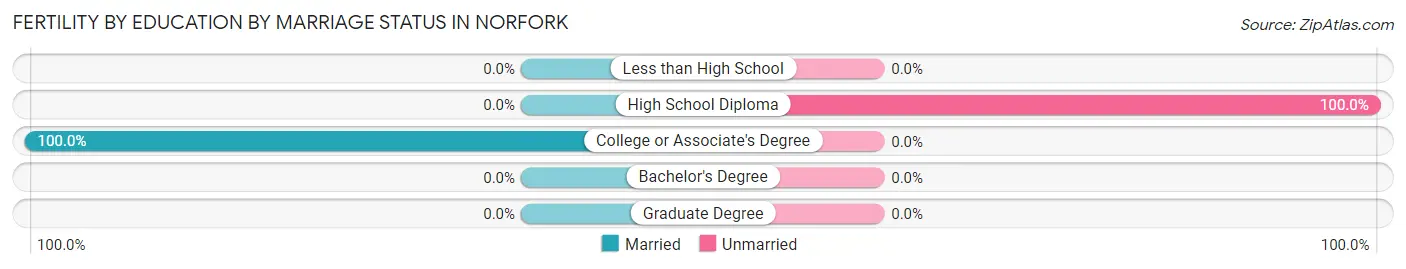
| Educational Attainment | Married | Unmarried |
| Less than High School | 0 (0.0%) | 0 (0.0%) |
| High School Diploma | 0 (0.0%) | 3 (100.0%) |
| College or Associate's Degree | 4 (100.0%) | 0 (0.0%) |
| Bachelor's Degree | 0 (0.0%) | 0 (0.0%) |
| Graduate Degree | 0 (0.0%) | 0 (0.0%) |
| Total | 4 (57.1%) | 3 (42.9%) |
Income in Norfork
Income Overview in Norfork
Per Capita Income in Norfork is $15,744, while median incomes of families and households are $28,819 and $34,444 respectively.
| Characteristic | Number | Measure |
| Per Capita Income | 554 | $15,744 |
| Median Family Income | 127 | $28,819 |
| Mean Family Income | 127 | $36,670 |
| Median Household Income | 206 | $34,444 |
| Mean Household Income | 206 | $41,675 |
| Income Deficit | 127 | $13,421 |
| Wage / Income Gap (%) | 554 | 66.44% |
| Wage / Income Gap ($) | 554 | 33.56¢ per $1 |
| Gini / Inequality Index | 554 | 0.41 |
Earnings by Sex in Norfork
Average Earnings in Norfork are $17,794, $26,071 for men and $8,750 for women, a difference of 66.4%.
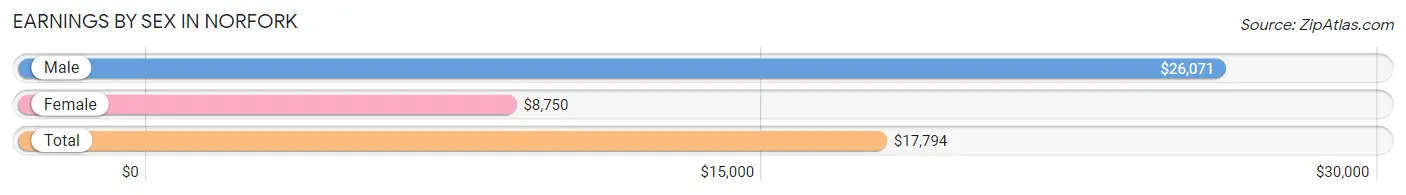
| Sex | Number | Average Earnings |
| Male | 52 (34.7%) | $26,071 |
| Female | 98 (65.3%) | $8,750 |
| Total | 150 (100.0%) | $17,794 |
Earnings by Sex by Income Bracket in Norfork
The most common earnings brackets in Norfork are $20,000 to $22,499 for men (9 | 17.3%) and $5,000 to $7,499 for women (30 | 30.6%).
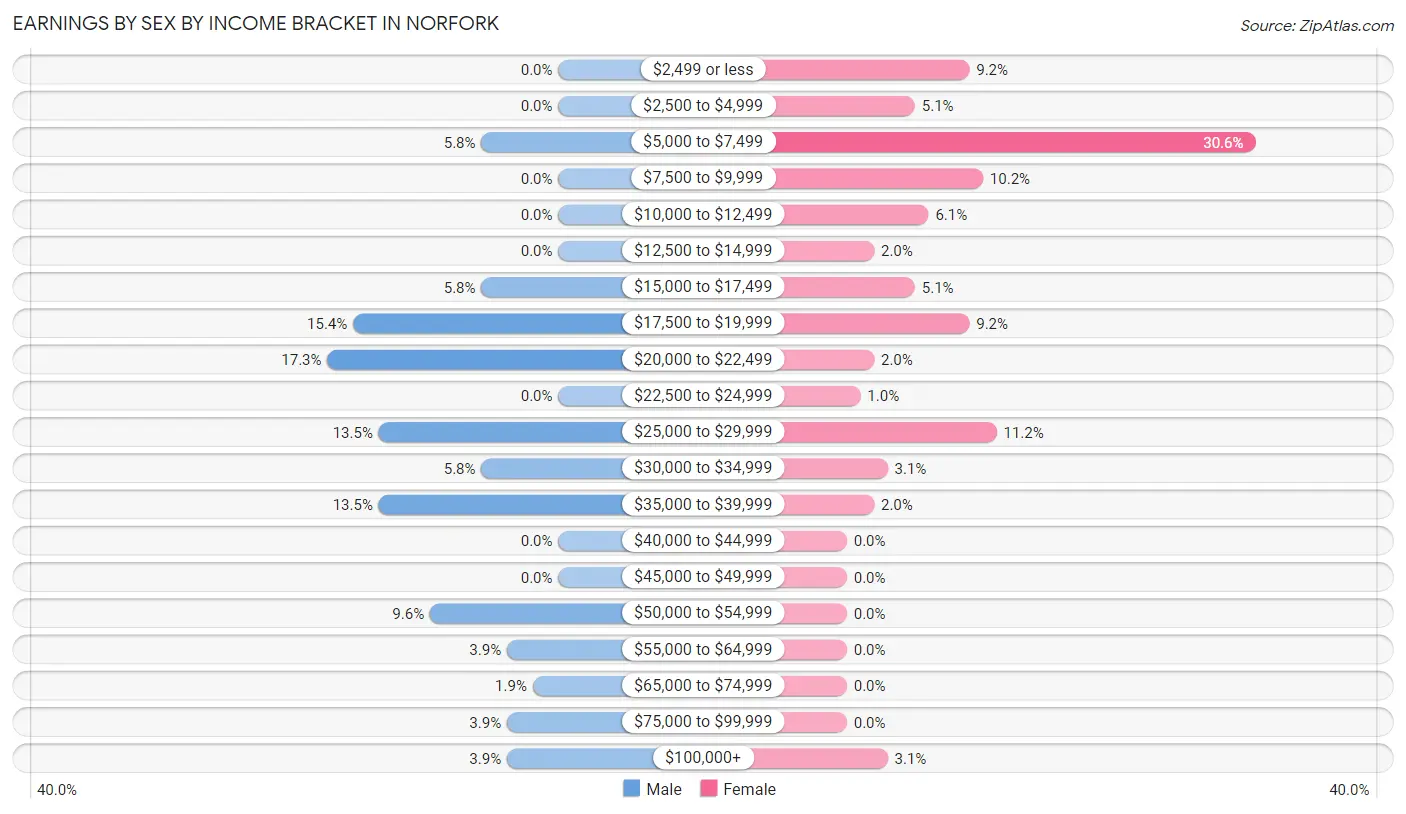
| Income | Male | Female |
| $2,499 or less | 0 (0.0%) | 9 (9.2%) |
| $2,500 to $4,999 | 0 (0.0%) | 5 (5.1%) |
| $5,000 to $7,499 | 3 (5.8%) | 30 (30.6%) |
| $7,500 to $9,999 | 0 (0.0%) | 10 (10.2%) |
| $10,000 to $12,499 | 0 (0.0%) | 6 (6.1%) |
| $12,500 to $14,999 | 0 (0.0%) | 2 (2.0%) |
| $15,000 to $17,499 | 3 (5.8%) | 5 (5.1%) |
| $17,500 to $19,999 | 8 (15.4%) | 9 (9.2%) |
| $20,000 to $22,499 | 9 (17.3%) | 2 (2.0%) |
| $22,500 to $24,999 | 0 (0.0%) | 1 (1.0%) |
| $25,000 to $29,999 | 7 (13.5%) | 11 (11.2%) |
| $30,000 to $34,999 | 3 (5.8%) | 3 (3.1%) |
| $35,000 to $39,999 | 7 (13.5%) | 2 (2.0%) |
| $40,000 to $44,999 | 0 (0.0%) | 0 (0.0%) |
| $45,000 to $49,999 | 0 (0.0%) | 0 (0.0%) |
| $50,000 to $54,999 | 5 (9.6%) | 0 (0.0%) |
| $55,000 to $64,999 | 2 (3.8%) | 0 (0.0%) |
| $65,000 to $74,999 | 1 (1.9%) | 0 (0.0%) |
| $75,000 to $99,999 | 2 (3.8%) | 0 (0.0%) |
| $100,000+ | 2 (3.8%) | 3 (3.1%) |
| Total | 52 (100.0%) | 98 (100.0%) |
Earnings by Sex by Educational Attainment in Norfork
Average earnings in Norfork are $25,357 for men and $10,000 for women, a difference of 60.6%. Men with an educational attainment of high school diploma enjoy the highest average annual earnings of $39,500, while those with college or associate's degree education earn the least with $22,500. Women with an educational attainment of high school diploma earn the most with the average annual earnings of $13,750, while those with less than high school education have the smallest earnings of $12,500.
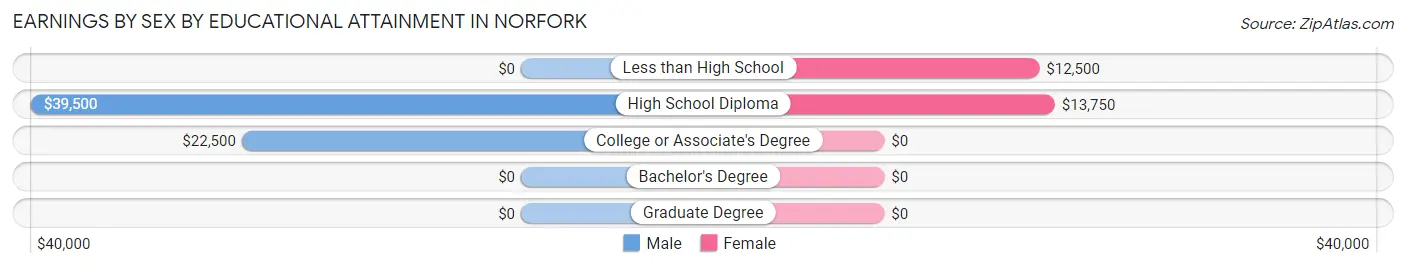
| Educational Attainment | Male Income | Female Income |
| Less than High School | - | - |
| High School Diploma | $39,500 | $13,750 |
| College or Associate's Degree | $22,500 | $0 |
| Bachelor's Degree | - | - |
| Graduate Degree | - | - |
| Total | $25,357 | $10,000 |
Family Income in Norfork
Family Income Brackets in Norfork
According to the Norfork family income data, there are 40 families falling into the $25,000 to $34,999 income range, which is the most common income bracket and makes up 31.5% of all families.
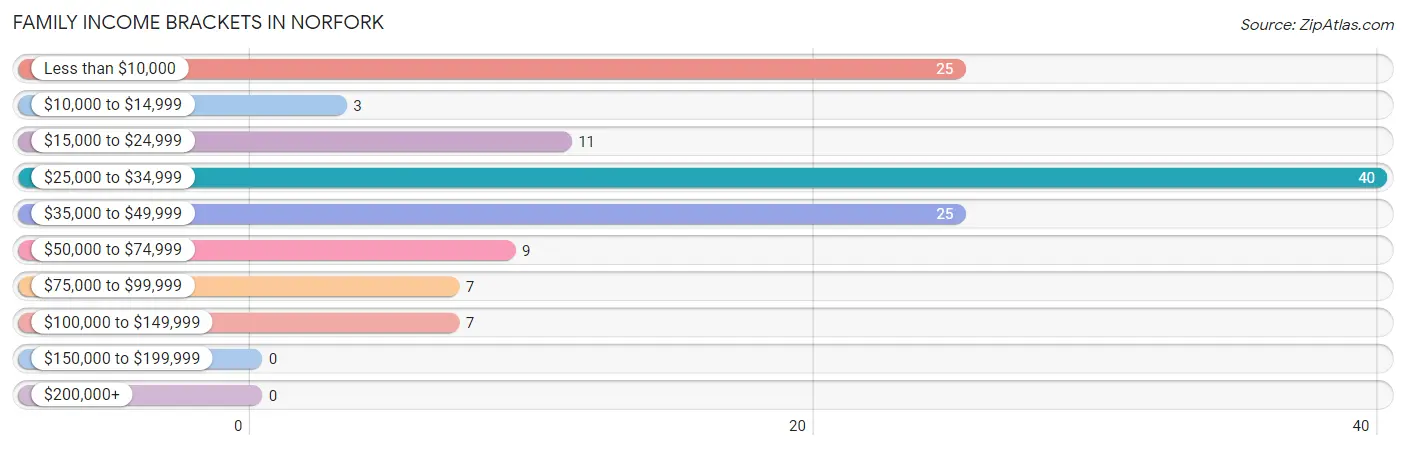
| Income Bracket | # Families | % Families |
| Less than $10,000 | 25 | 19.7% |
| $10,000 to $14,999 | 3 | 2.4% |
| $15,000 to $24,999 | 11 | 8.7% |
| $25,000 to $34,999 | 40 | 31.5% |
| $35,000 to $49,999 | 25 | 19.7% |
| $50,000 to $74,999 | 9 | 7.1% |
| $75,000 to $99,999 | 7 | 5.5% |
| $100,000 to $149,999 | 7 | 5.5% |
| $150,000 to $199,999 | 0 | 0.0% |
| $200,000+ | 0 | 0.0% |
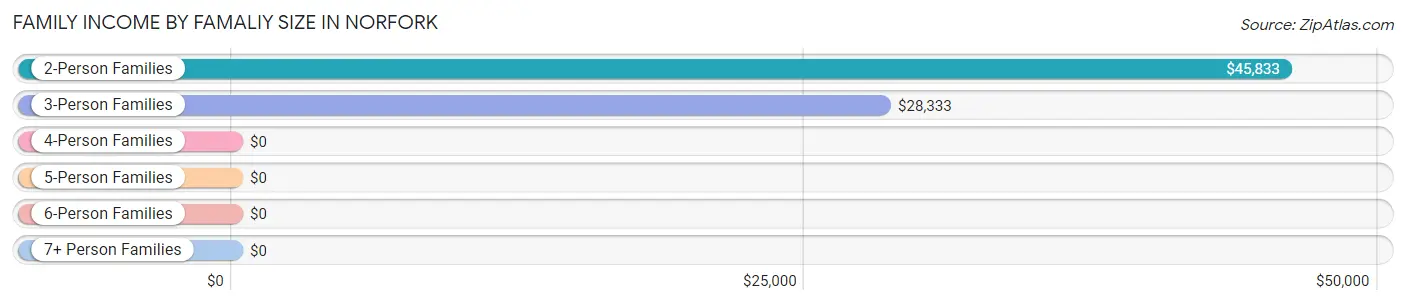
Family Income by Famaliy Size in Norfork
2-person families (42 | 33.1%) account for the highest median family income in Norfork with $45,833 per family, while 2-person families (42 | 33.1%) have the highest median income of $22,916 per family member.
| Income Bracket | # Families | Median Income |
| 2-Person Families | 42 (33.1%) | $45,833 |
| 3-Person Families | 52 (40.9%) | $28,333 |
| 4-Person Families | 24 (18.9%) | $0 |
| 5-Person Families | 7 (5.5%) | $0 |
| 6-Person Families | 2 (1.6%) | $0 |
| 7+ Person Families | 0 (0.0%) | $0 |
| Total | 127 (100.0%) | $28,819 |
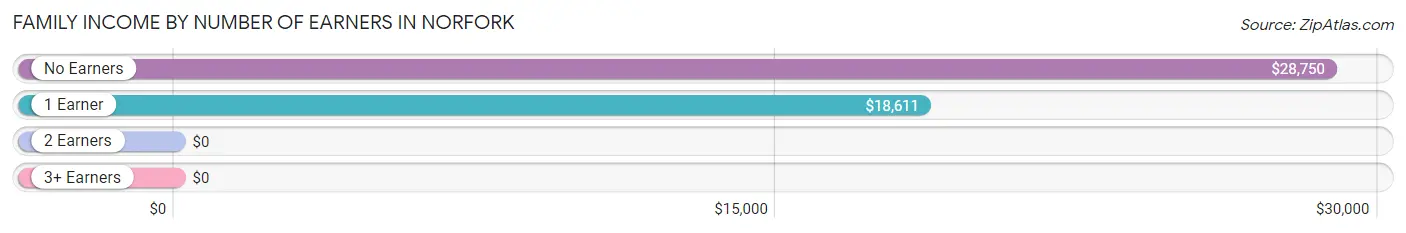
Family Income by Number of Earners in Norfork
| Number of Earners | # Families | Median Income |
| No Earners | 43 (33.9%) | $28,750 |
| 1 Earner | 56 (44.1%) | $18,611 |
| 2 Earners | 22 (17.3%) | $0 |
| 3+ Earners | 6 (4.7%) | $0 |
| Total | 127 (100.0%) | $28,819 |
Household Income in Norfork
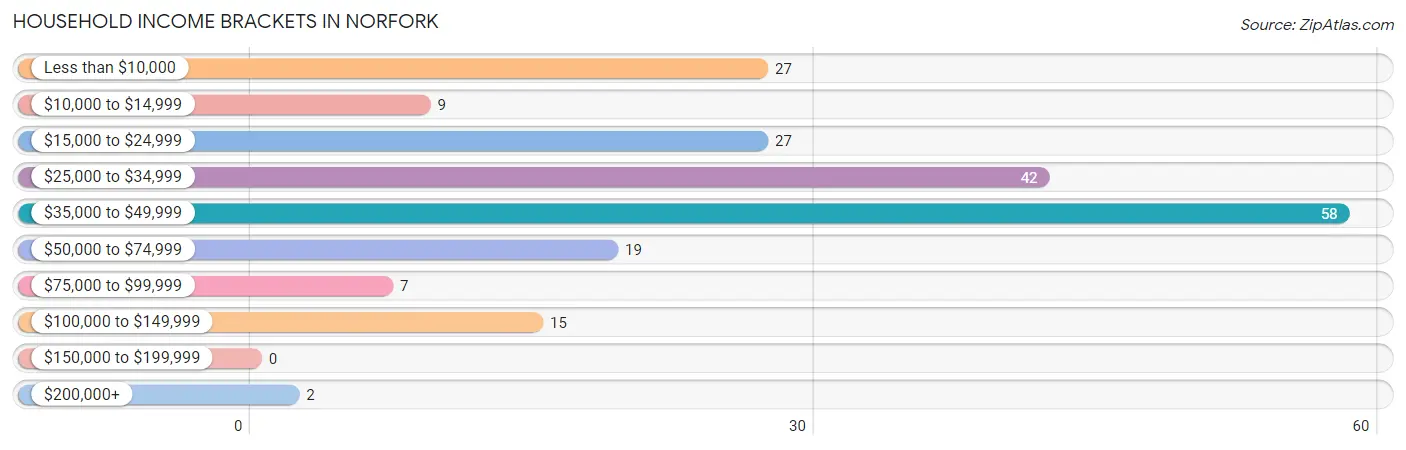
Household Income Brackets in Norfork
With 58 households falling in the category, the $35,000 to $49,999 income range is the most frequent in Norfork, accounting for 28.2% of all households.
| Income Bracket | # Households | % Households |
| Less than $10,000 | 27 | 13.1% |
| $10,000 to $14,999 | 9 | 4.4% |
| $15,000 to $24,999 | 27 | 13.1% |
| $25,000 to $34,999 | 42 | 20.4% |
| $35,000 to $49,999 | 58 | 28.2% |
| $50,000 to $74,999 | 19 | 9.2% |
| $75,000 to $99,999 | 7 | 3.4% |
| $100,000 to $149,999 | 15 | 7.3% |
| $150,000 to $199,999 | 0 | 0.0% |
| $200,000+ | 2 | 1.0% |
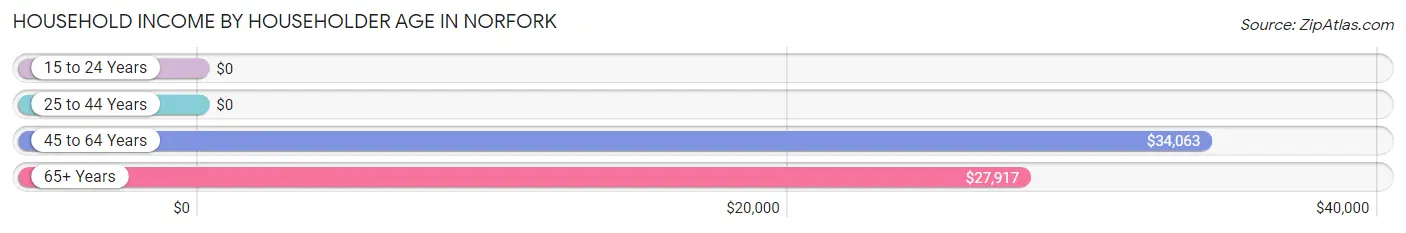
Household Income by Householder Age in Norfork
The median household income in Norfork is $34,444, with the highest median household income of $34,063 found in the 45 to 64 years age bracket for the primary householder. A total of 57 households (27.7%) fall into this category. Meanwhile, the 15 to 24 years age bracket for the primary householder has the lowest median household income of $0, with 11 households (5.3%) in this group.
| Income Bracket | # Households | Median Income |
| 15 to 24 Years | 11 (5.3%) | $0 |
| 25 to 44 Years | 59 (28.6%) | $0 |
| 45 to 64 Years | 57 (27.7%) | $34,063 |
| 65+ Years | 79 (38.4%) | $27,917 |
| Total | 206 (100.0%) | $34,444 |
Poverty in Norfork
Income Below Poverty by Sex and Age in Norfork
With 39.6% poverty level for males and 31.2% for females among the residents of Norfork, 6 to 11 year old males and 25 to 34 year old females are the most vulnerable to poverty, with 40 males (90.9%) and 27 females (84.4%) in their respective age groups living below the poverty level.
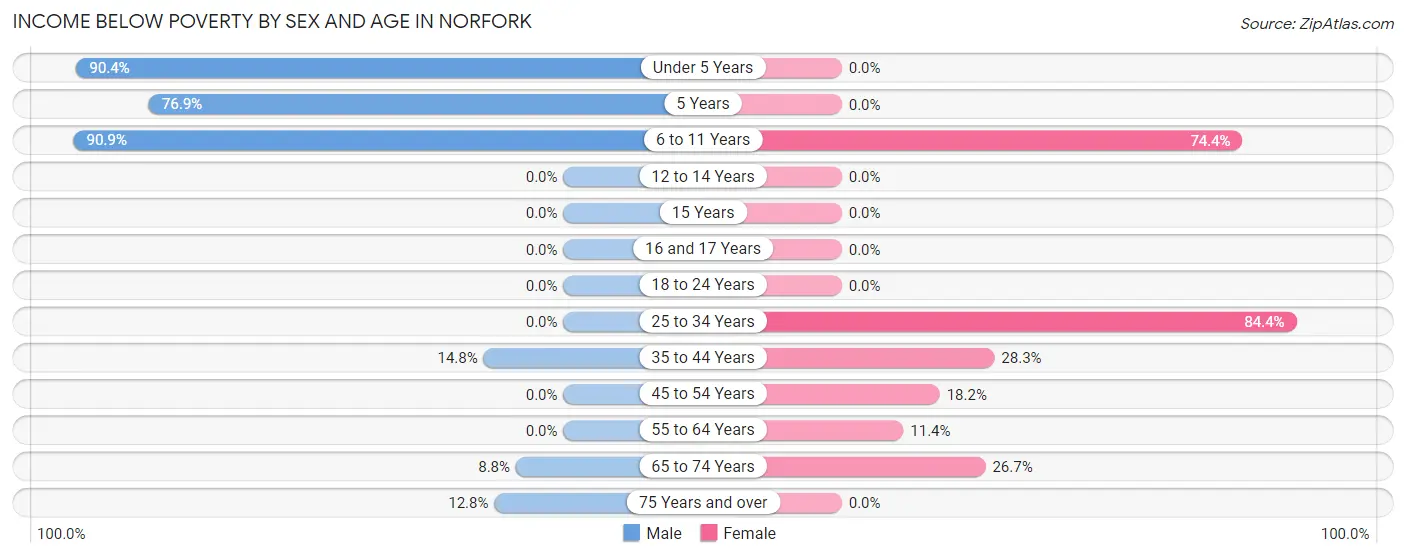
| Age Bracket | Male | Female |
| Under 5 Years | 47 (90.4%) | 0 (0.0%) |
| 5 Years | 10 (76.9%) | 0 (0.0%) |
| 6 to 11 Years | 40 (90.9%) | 29 (74.4%) |
| 12 to 14 Years | 0 (0.0%) | 0 (0.0%) |
| 15 Years | 0 (0.0%) | 0 (0.0%) |
| 16 and 17 Years | 0 (0.0%) | 0 (0.0%) |
| 18 to 24 Years | 0 (0.0%) | 0 (0.0%) |
| 25 to 34 Years | 0 (0.0%) | 27 (84.4%) |
| 35 to 44 Years | 4 (14.8%) | 17 (28.3%) |
| 45 to 54 Years | 0 (0.0%) | 2 (18.2%) |
| 55 to 64 Years | 0 (0.0%) | 4 (11.4%) |
| 65 to 74 Years | 3 (8.8%) | 8 (26.7%) |
| 75 Years and over | 5 (12.8%) | 0 (0.0%) |
| Total | 109 (39.6%) | 87 (31.2%) |
Income Above Poverty by Sex and Age in Norfork
According to the poverty statistics in Norfork, males aged 16 and 17 years and females aged under 5 years are the age groups that are most secure financially, with 100.0% of males and 100.0% of females in these age groups living above the poverty line.
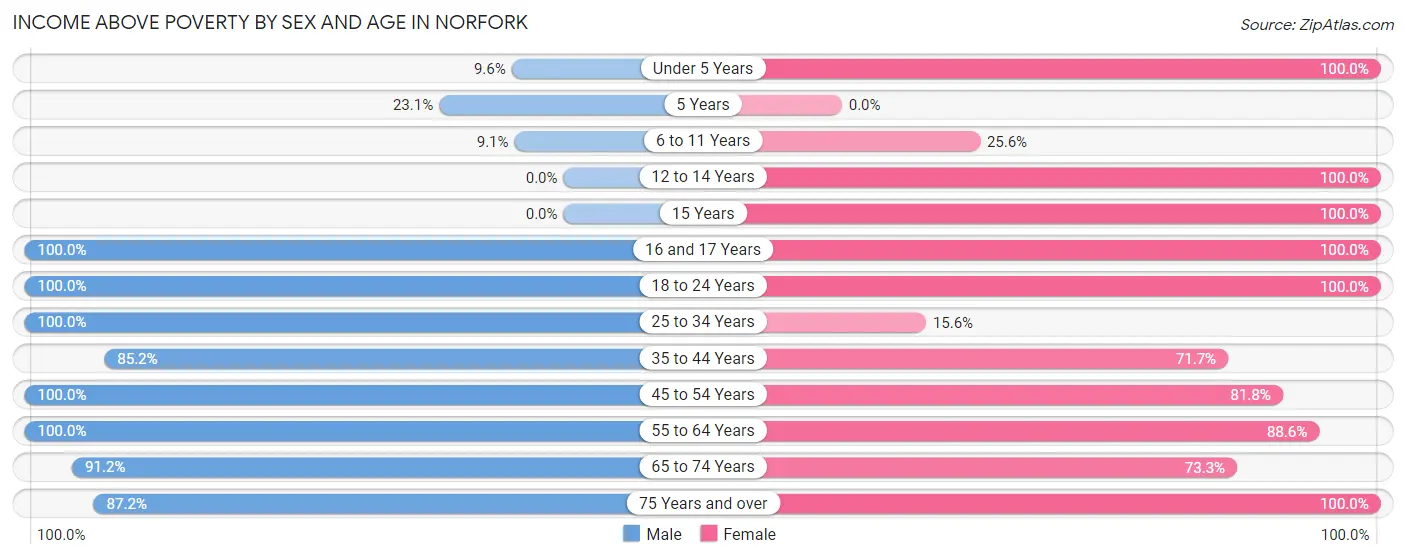
| Age Bracket | Male | Female |
| Under 5 Years | 5 (9.6%) | 18 (100.0%) |
| 5 Years | 3 (23.1%) | 0 (0.0%) |
| 6 to 11 Years | 4 (9.1%) | 10 (25.6%) |
| 12 to 14 Years | 0 (0.0%) | 13 (100.0%) |
| 15 Years | 0 (0.0%) | 5 (100.0%) |
| 16 and 17 Years | 7 (100.0%) | 8 (100.0%) |
| 18 to 24 Years | 8 (100.0%) | 10 (100.0%) |
| 25 to 34 Years | 16 (100.0%) | 5 (15.6%) |
| 35 to 44 Years | 23 (85.2%) | 43 (71.7%) |
| 45 to 54 Years | 10 (100.0%) | 9 (81.8%) |
| 55 to 64 Years | 25 (100.0%) | 31 (88.6%) |
| 65 to 74 Years | 31 (91.2%) | 22 (73.3%) |
| 75 Years and over | 34 (87.2%) | 18 (100.0%) |
| Total | 166 (60.4%) | 192 (68.8%) |
Income Below Poverty Among Married-Couple Families in Norfork
The poverty statistics for married-couple families in Norfork show that 8.5% or 6 of the total 71 families live below the poverty line. Families with no children have the highest poverty rate of 12.2%, comprising of 6 families. On the other hand, families with 1 or 2 children have the lowest poverty rate of 0.0%, which includes 0 families.
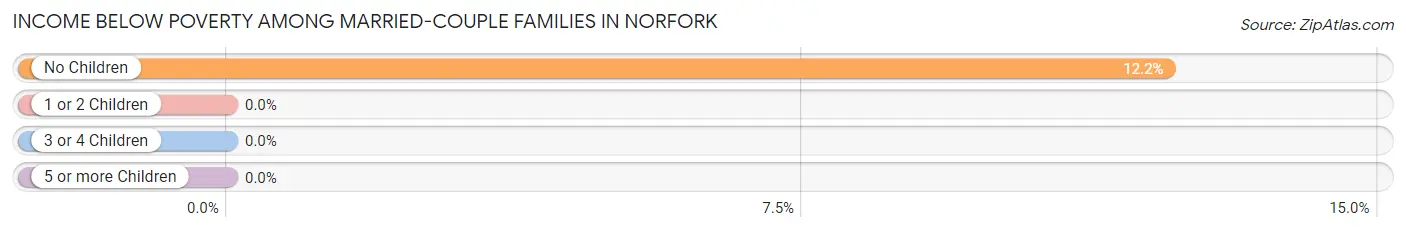
| Children | Above Poverty | Below Poverty |
| No Children | 43 (87.8%) | 6 (12.2%) |
| 1 or 2 Children | 13 (100.0%) | 0 (0.0%) |
| 3 or 4 Children | 9 (100.0%) | 0 (0.0%) |
| 5 or more Children | 0 (0.0%) | 0 (0.0%) |
| Total | 65 (91.5%) | 6 (8.5%) |
Income Below Poverty Among Single-Parent Households in Norfork
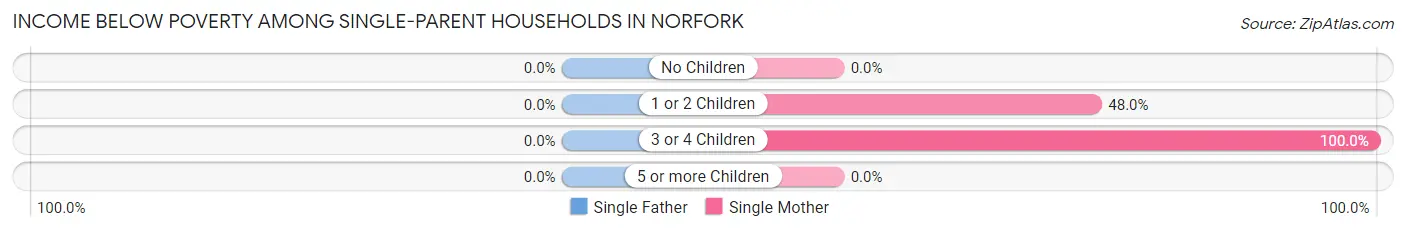
| Children | Single Father | Single Mother |
| No Children | 0 (0.0%) | 0 (0.0%) |
| 1 or 2 Children | 0 (0.0%) | 12 (48.0%) |
| 3 or 4 Children | 0 (0.0%) | 21 (100.0%) |
| 5 or more Children | 0 (0.0%) | 0 (0.0%) |
| Total | 0 (0.0%) | 33 (63.5%) |
Income Below Poverty Among Married-Couple vs Single-Parent Households in Norfork
The poverty data for Norfork shows that 6 of the married-couple family households (8.5%) and 33 of the single-parent households (58.9%) are living below the poverty level. Within the married-couple family households, those with no children have the highest poverty rate, with 6 households (12.2%) falling below the poverty line. Among the single-parent households, those with 3 or 4 children have the highest poverty rate, with 21 household (100.0%) living below poverty.
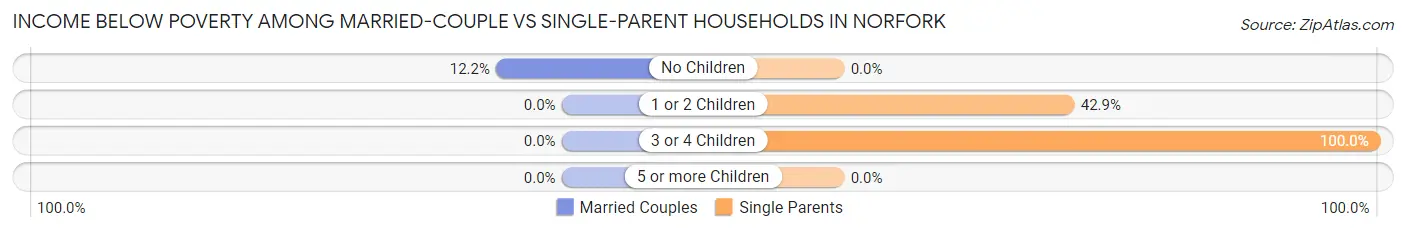
| Children | Married-Couple Families | Single-Parent Households |
| No Children | 6 (12.2%) | 0 (0.0%) |
| 1 or 2 Children | 0 (0.0%) | 12 (42.9%) |
| 3 or 4 Children | 0 (0.0%) | 21 (100.0%) |
| 5 or more Children | 0 (0.0%) | 0 (0.0%) |
| Total | 6 (8.5%) | 33 (58.9%) |
Employment Characteristics in Norfork
Employment by Class of Employer in Norfork
Among the 143 employed individuals in Norfork, private company employees (98 | 68.5%), self-employed (incorporated) (28 | 19.6%), and self-employed (not incorporated) (5 | 3.5%) make up the most common classes of employment.
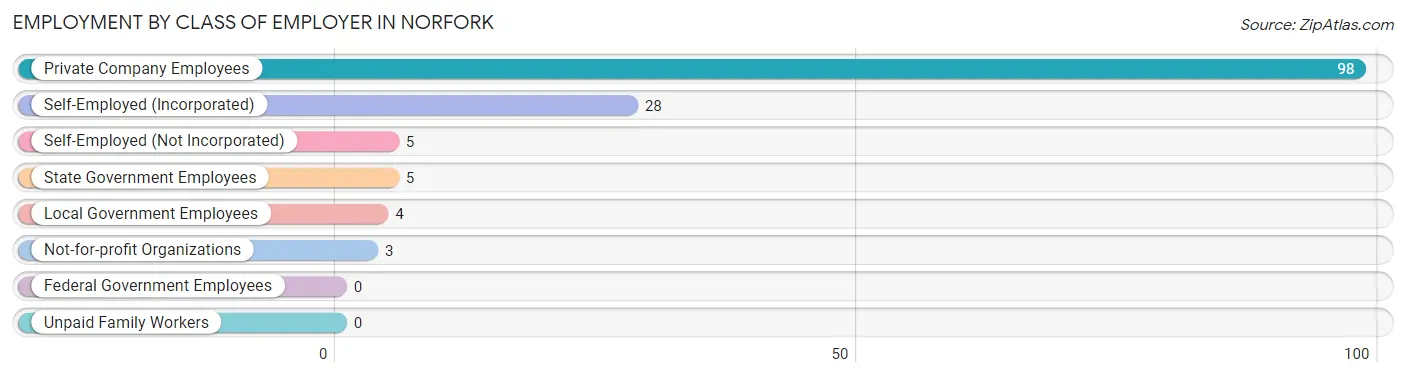
| Employer Class | # Employees | % Employees |
| Private Company Employees | 98 | 68.5% |
| Self-Employed (Incorporated) | 28 | 19.6% |
| Self-Employed (Not Incorporated) | 5 | 3.5% |
| Not-for-profit Organizations | 3 | 2.1% |
| Local Government Employees | 4 | 2.8% |
| State Government Employees | 5 | 3.5% |
| Federal Government Employees | 0 | 0.0% |
| Unpaid Family Workers | 0 | 0.0% |
| Total | 143 | 100.0% |
Employment Status by Age in Norfork
According to the labor force statistics for Norfork, out of the total population over 16 years of age (370), 39.2% or 145 individuals are in the labor force, with 1.4% or 2 of them unemployed. The age group with the highest labor force participation rate is 20 to 24 years, with 100.0% or 15 individuals in the labor force. Within the labor force, the 55 to 59 years age range has the highest percentage of unemployed individuals, with 20.0% or 2 of them being unemployed.
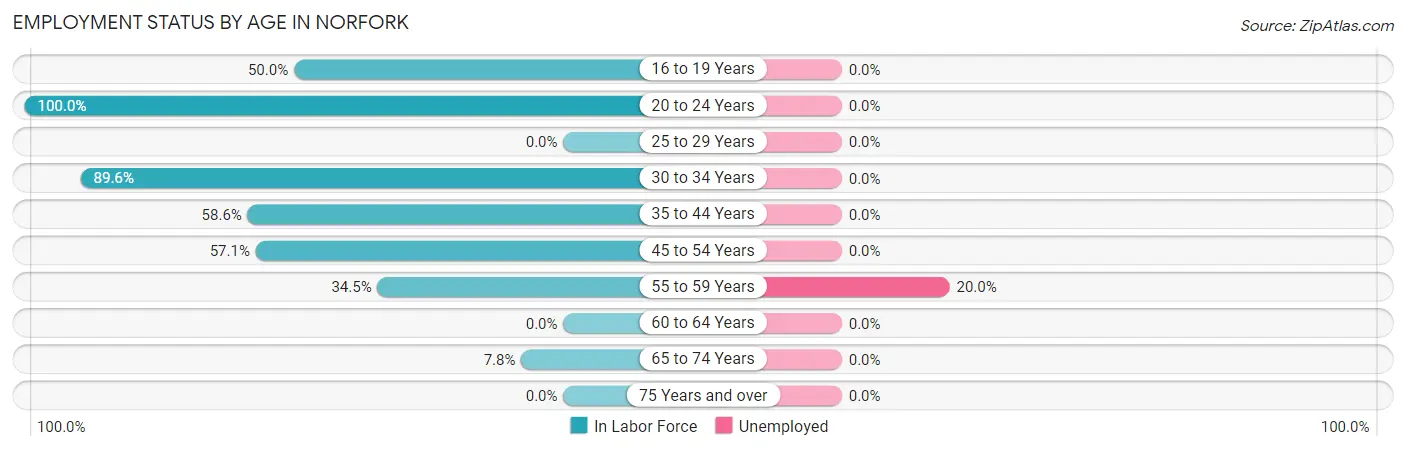
| Age Bracket | In Labor Force | Unemployed |
| 16 to 19 Years | 9 (50.0%) | 0 (0.0%) |
| 20 to 24 Years | 15 (100.0%) | 0 (0.0%) |
| 25 to 29 Years | 0 (0.0%) | 0 (0.0%) |
| 30 to 34 Years | 43 (89.6%) | 0 (0.0%) |
| 35 to 44 Years | 51 (58.6%) | 0 (0.0%) |
| 45 to 54 Years | 12 (57.1%) | 0 (0.0%) |
| 55 to 59 Years | 10 (34.5%) | 2 (20.0%) |
| 60 to 64 Years | 0 (0.0%) | 0 (0.0%) |
| 65 to 74 Years | 5 (7.8%) | 0 (0.0%) |
| 75 Years and over | 0 (0.0%) | 0 (0.0%) |
| Total | 145 (39.2%) | 2 (1.4%) |
Employment Status by Educational Attainment in Norfork
According to labor force statistics for Norfork, 53.7% of individuals (116) out of the total population between 25 and 64 years of age (216) are in the labor force, with 1.7% or 2 of them being unemployed. The group with the highest labor force participation rate are those with the educational attainment of college / associate degree, with 78.1% or 75 individuals in the labor force. Within the labor force, individuals with high school diploma education have the highest percentage of unemployment, with 10.0% or 2 of them being unemployed.
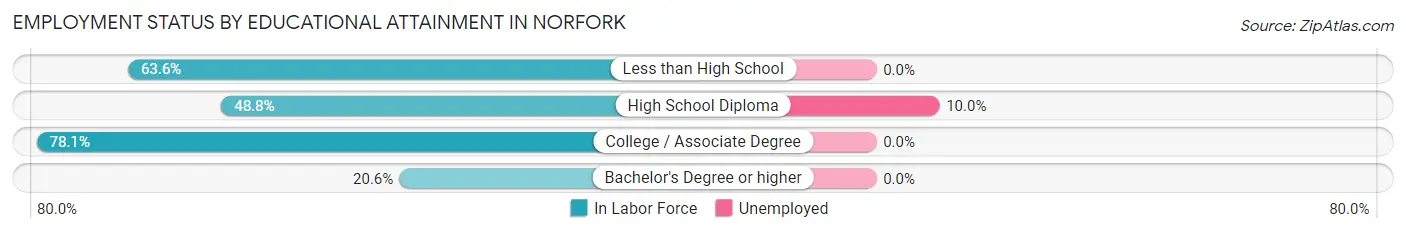
| Educational Attainment | In Labor Force | Unemployed |
| Less than High School | 7 (63.6%) | 0 (0.0%) |
| High School Diploma | 20 (48.8%) | 4 (10.0%) |
| College / Associate Degree | 75 (78.1%) | 0 (0.0%) |
| Bachelor's Degree or higher | 14 (20.6%) | 0 (0.0%) |
| Total | 116 (53.7%) | 4 (1.7%) |
Employment Occupations by Sex in Norfork
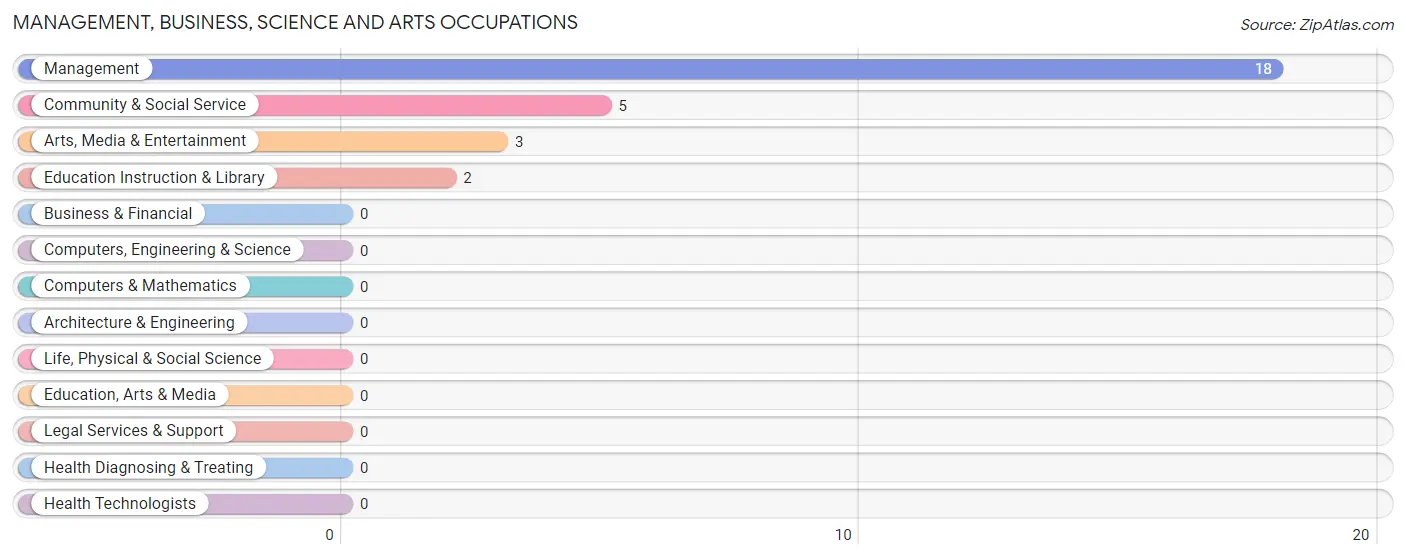
Management, Business, Science and Arts Occupations
The most common Management, Business, Science and Arts occupations in Norfork are Management (18 | 12.6%), Community & Social Service (5 | 3.5%), Arts, Media & Entertainment (3 | 2.1%), and Education Instruction & Library (2 | 1.4%).
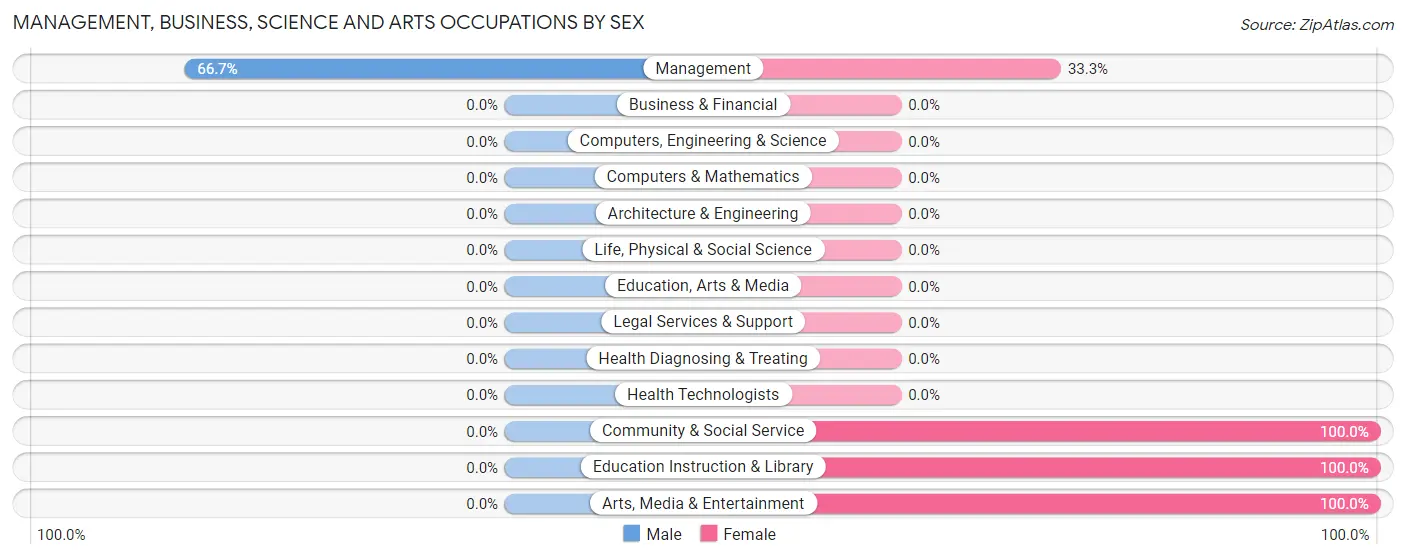
Management, Business, Science and Arts Occupations by Sex
| Occupation | Male | Female |
| Management | 12 (66.7%) | 6 (33.3%) |
| Business & Financial | 0 (0.0%) | 0 (0.0%) |
| Computers, Engineering & Science | 0 (0.0%) | 0 (0.0%) |
| Computers & Mathematics | 0 (0.0%) | 0 (0.0%) |
| Architecture & Engineering | 0 (0.0%) | 0 (0.0%) |
| Life, Physical & Social Science | 0 (0.0%) | 0 (0.0%) |
| Community & Social Service | 0 (0.0%) | 5 (100.0%) |
| Education, Arts & Media | 0 (0.0%) | 0 (0.0%) |
| Legal Services & Support | 0 (0.0%) | 0 (0.0%) |
| Education Instruction & Library | 0 (0.0%) | 2 (100.0%) |
| Arts, Media & Entertainment | 0 (0.0%) | 3 (100.0%) |
| Health Diagnosing & Treating | 0 (0.0%) | 0 (0.0%) |
| Health Technologists | 0 (0.0%) | 0 (0.0%) |
| Total (Category) | 12 (52.2%) | 11 (47.8%) |
| Total (Overall) | 52 (36.4%) | 91 (63.6%) |
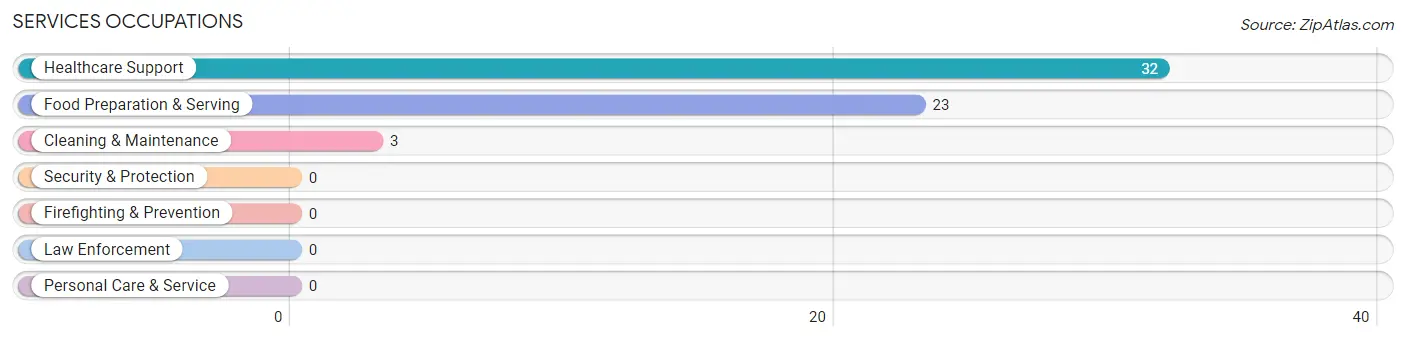
Services Occupations
The most common Services occupations in Norfork are Healthcare Support (32 | 22.4%), Food Preparation & Serving (23 | 16.1%), and Cleaning & Maintenance (3 | 2.1%).
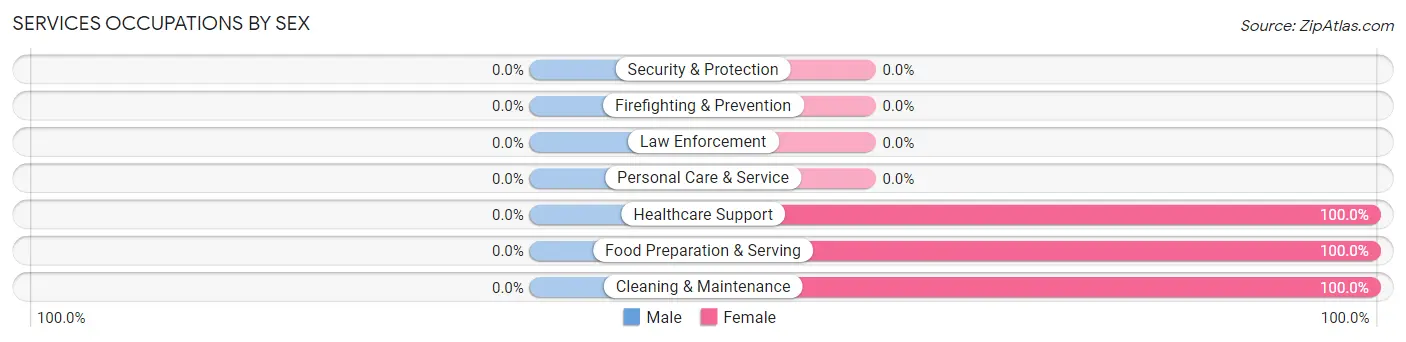
Services Occupations by Sex
| Occupation | Male | Female |
| Healthcare Support | 0 (0.0%) | 32 (100.0%) |
| Security & Protection | 0 (0.0%) | 0 (0.0%) |
| Firefighting & Prevention | 0 (0.0%) | 0 (0.0%) |
| Law Enforcement | 0 (0.0%) | 0 (0.0%) |
| Food Preparation & Serving | 0 (0.0%) | 23 (100.0%) |
| Cleaning & Maintenance | 0 (0.0%) | 3 (100.0%) |
| Personal Care & Service | 0 (0.0%) | 0 (0.0%) |
| Total (Category) | 0 (0.0%) | 58 (100.0%) |
| Total (Overall) | 52 (36.4%) | 91 (63.6%) |
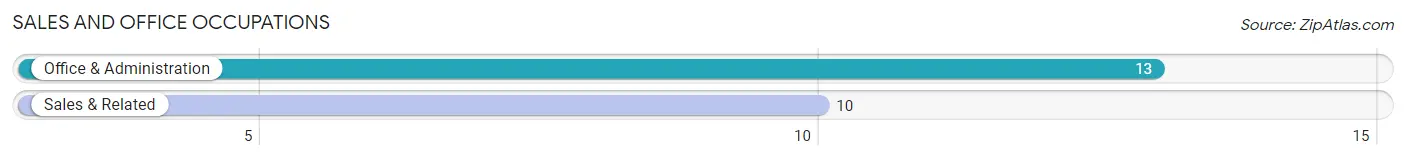
Sales and Office Occupations
The most common Sales and Office occupations in Norfork are Office & Administration (13 | 9.1%), and Sales & Related (10 | 7.0%).
Sales and Office Occupations by Sex
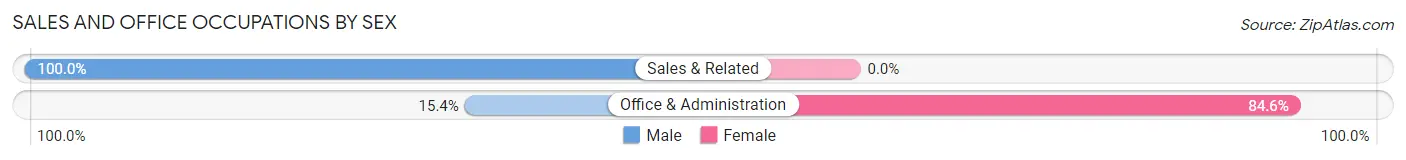
| Occupation | Male | Female |
| Sales & Related | 10 (100.0%) | 0 (0.0%) |
| Office & Administration | 2 (15.4%) | 11 (84.6%) |
| Total (Category) | 12 (52.2%) | 11 (47.8%) |
| Total (Overall) | 52 (36.4%) | 91 (63.6%) |
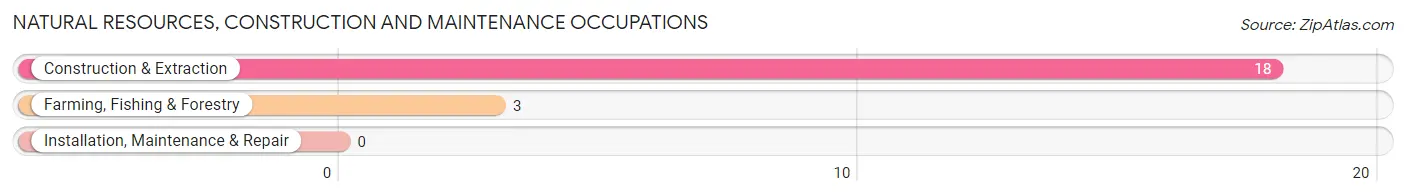
Natural Resources, Construction and Maintenance Occupations
The most common Natural Resources, Construction and Maintenance occupations in Norfork are Construction & Extraction (18 | 12.6%), and Farming, Fishing & Forestry (3 | 2.1%).
Natural Resources, Construction and Maintenance Occupations by Sex
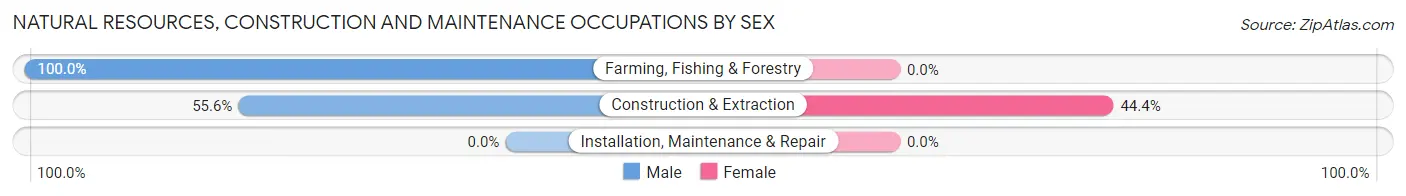
| Occupation | Male | Female |
| Farming, Fishing & Forestry | 3 (100.0%) | 0 (0.0%) |
| Construction & Extraction | 10 (55.6%) | 8 (44.4%) |
| Installation, Maintenance & Repair | 0 (0.0%) | 0 (0.0%) |
| Total (Category) | 13 (61.9%) | 8 (38.1%) |
| Total (Overall) | 52 (36.4%) | 91 (63.6%) |
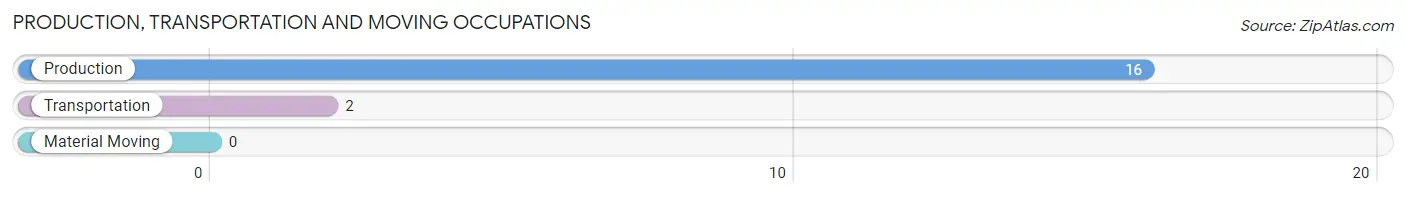
Production, Transportation and Moving Occupations
The most common Production, Transportation and Moving occupations in Norfork are Production (16 | 11.2%), and Transportation (2 | 1.4%).
Production, Transportation and Moving Occupations by Sex
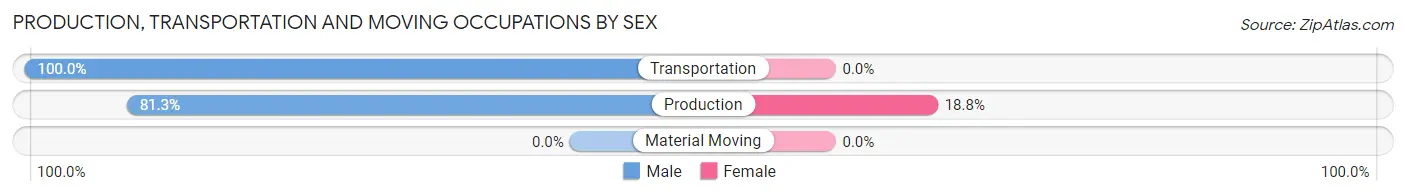
| Occupation | Male | Female |
| Production | 13 (81.2%) | 3 (18.8%) |
| Transportation | 2 (100.0%) | 0 (0.0%) |
| Material Moving | 0 (0.0%) | 0 (0.0%) |
| Total (Category) | 15 (83.3%) | 3 (16.7%) |
| Total (Overall) | 52 (36.4%) | 91 (63.6%) |
Employment Industries by Sex in Norfork
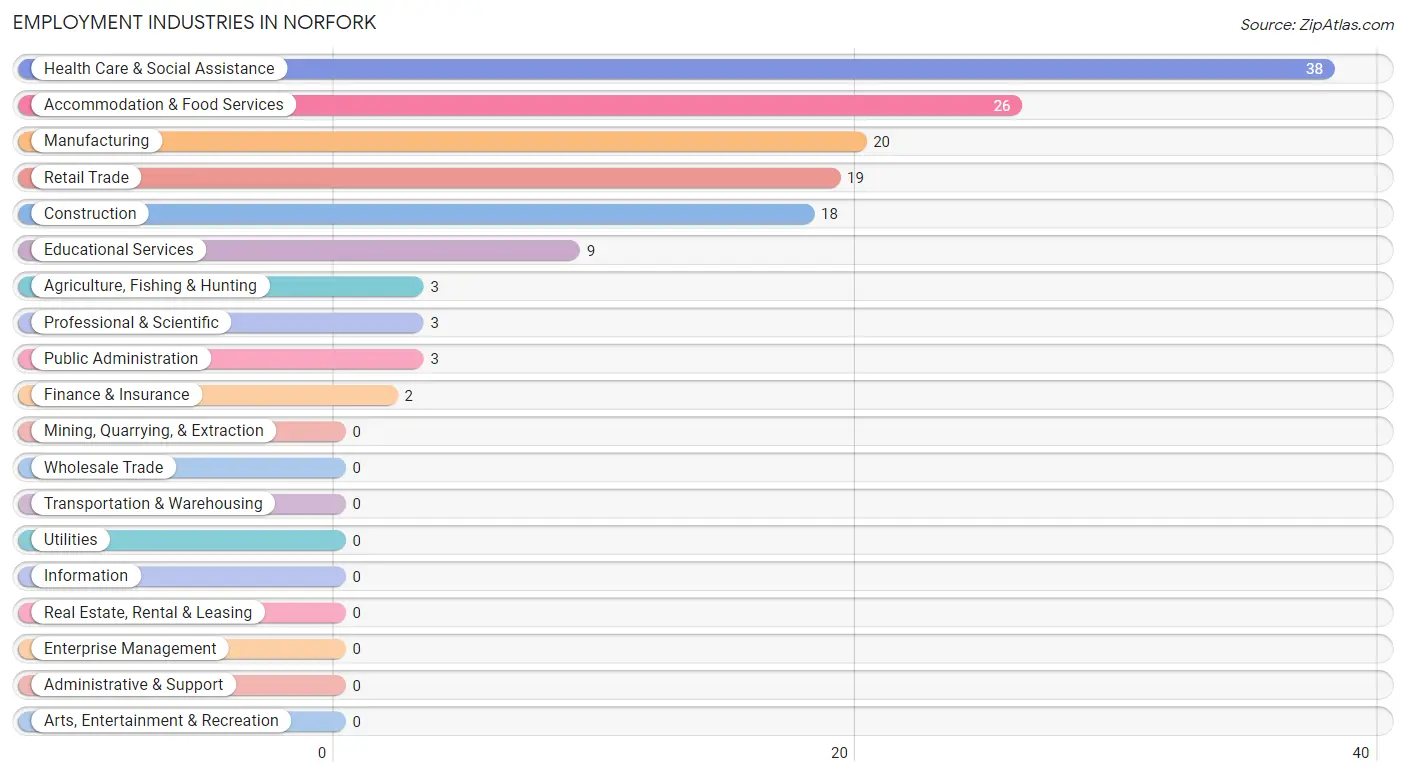
Employment Industries in Norfork
The major employment industries in Norfork include Health Care & Social Assistance (38 | 26.6%), Accommodation & Food Services (26 | 18.2%), Manufacturing (20 | 14.0%), Retail Trade (19 | 13.3%), and Construction (18 | 12.6%).
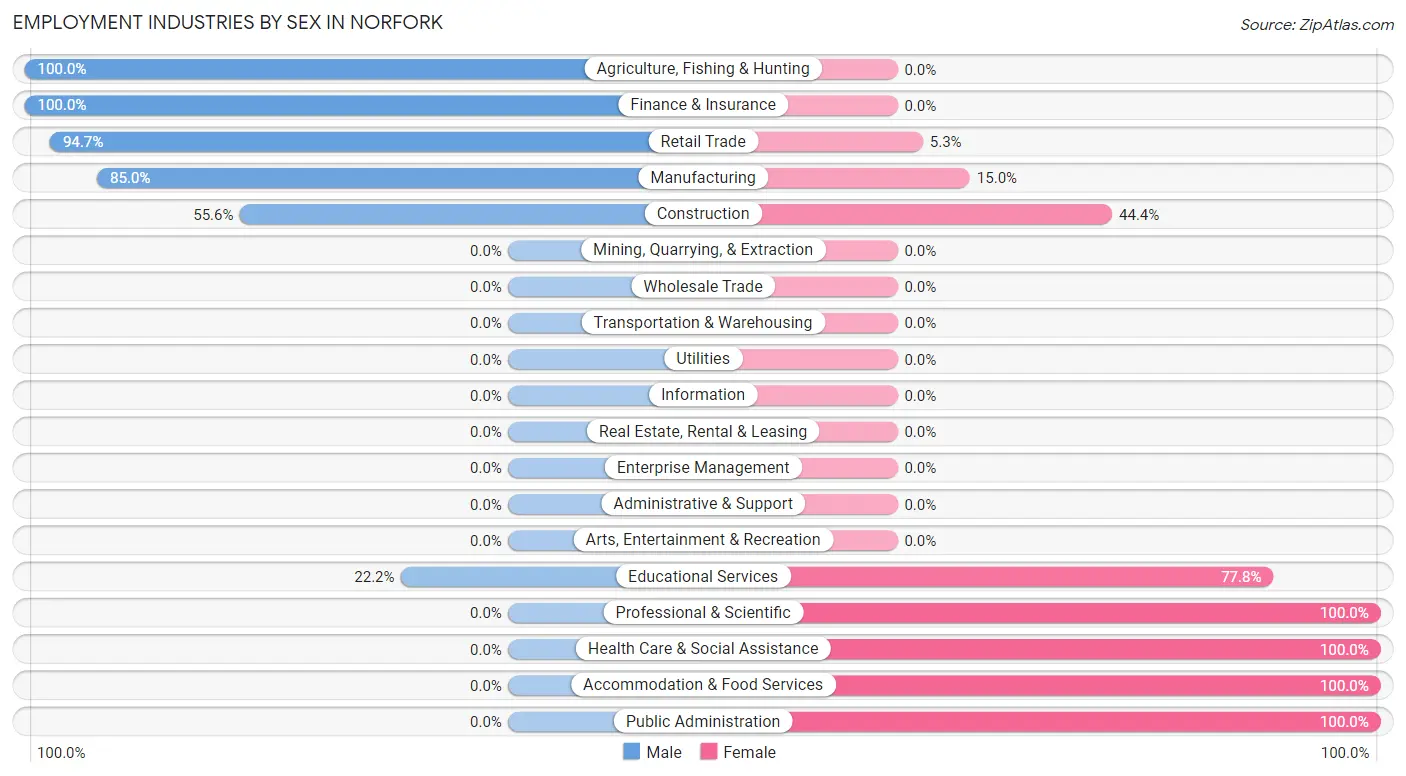
Employment Industries by Sex in Norfork
The Norfork industries that see more men than women are Agriculture, Fishing & Hunting (100.0%), Finance & Insurance (100.0%), and Retail Trade (94.7%), whereas the industries that tend to have a higher number of women are Professional & Scientific (100.0%), Health Care & Social Assistance (100.0%), and Accommodation & Food Services (100.0%).
| Industry | Male | Female |
| Agriculture, Fishing & Hunting | 3 (100.0%) | 0 (0.0%) |
| Mining, Quarrying, & Extraction | 0 (0.0%) | 0 (0.0%) |
| Construction | 10 (55.6%) | 8 (44.4%) |
| Manufacturing | 17 (85.0%) | 3 (15.0%) |
| Wholesale Trade | 0 (0.0%) | 0 (0.0%) |
| Retail Trade | 18 (94.7%) | 1 (5.3%) |
| Transportation & Warehousing | 0 (0.0%) | 0 (0.0%) |
| Utilities | 0 (0.0%) | 0 (0.0%) |
| Information | 0 (0.0%) | 0 (0.0%) |
| Finance & Insurance | 2 (100.0%) | 0 (0.0%) |
| Real Estate, Rental & Leasing | 0 (0.0%) | 0 (0.0%) |
| Professional & Scientific | 0 (0.0%) | 3 (100.0%) |
| Enterprise Management | 0 (0.0%) | 0 (0.0%) |
| Administrative & Support | 0 (0.0%) | 0 (0.0%) |
| Educational Services | 2 (22.2%) | 7 (77.8%) |
| Health Care & Social Assistance | 0 (0.0%) | 38 (100.0%) |
| Arts, Entertainment & Recreation | 0 (0.0%) | 0 (0.0%) |
| Accommodation & Food Services | 0 (0.0%) | 26 (100.0%) |
| Public Administration | 0 (0.0%) | 3 (100.0%) |
| Total | 52 (36.4%) | 91 (63.6%) |
Education in Norfork
School Enrollment in Norfork
The most common levels of schooling among the 136 students in Norfork are elementary school (45 | 33.1%), kindergarten (36 | 26.5%), and high school (23 | 16.9%).
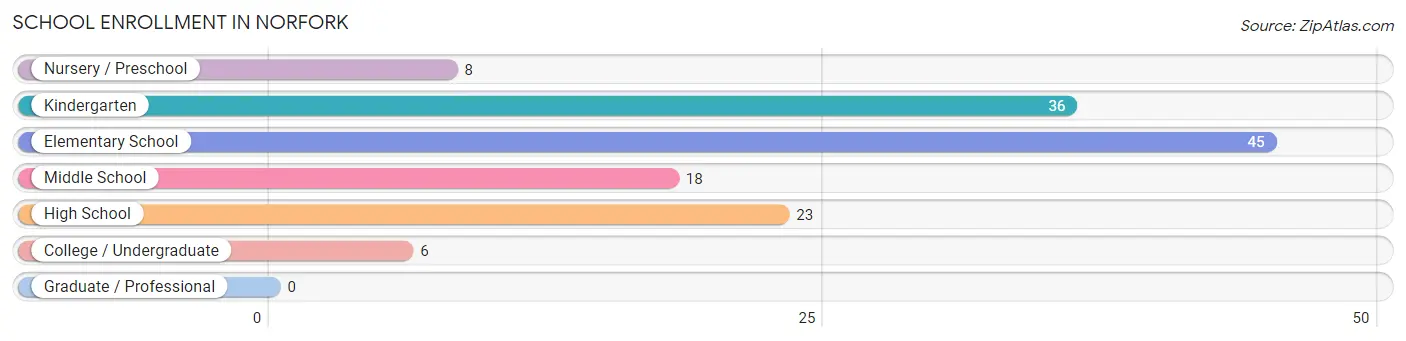
| School Level | # Students | % Students |
| Nursery / Preschool | 8 | 5.9% |
| Kindergarten | 36 | 26.5% |
| Elementary School | 45 | 33.1% |
| Middle School | 18 | 13.2% |
| High School | 23 | 16.9% |
| College / Undergraduate | 6 | 4.4% |
| Graduate / Professional | 0 | 0.0% |
| Total | 136 | 100.0% |
School Enrollment by Age by Funding Source in Norfork
Out of a total of 136 students who are enrolled in schools in Norfork, 5 (3.7%) attend a private institution, while the remaining 131 (96.3%) are enrolled in public schools. The age group of 35 years and over has the highest likelihood of being enrolled in private schools, with 1 (100.0% in the age bracket) enrolled. Conversely, the age group of 5 to 9 year old has the lowest likelihood of being enrolled in a private school, with 85 (100.0% in the age bracket) attending a public institution.
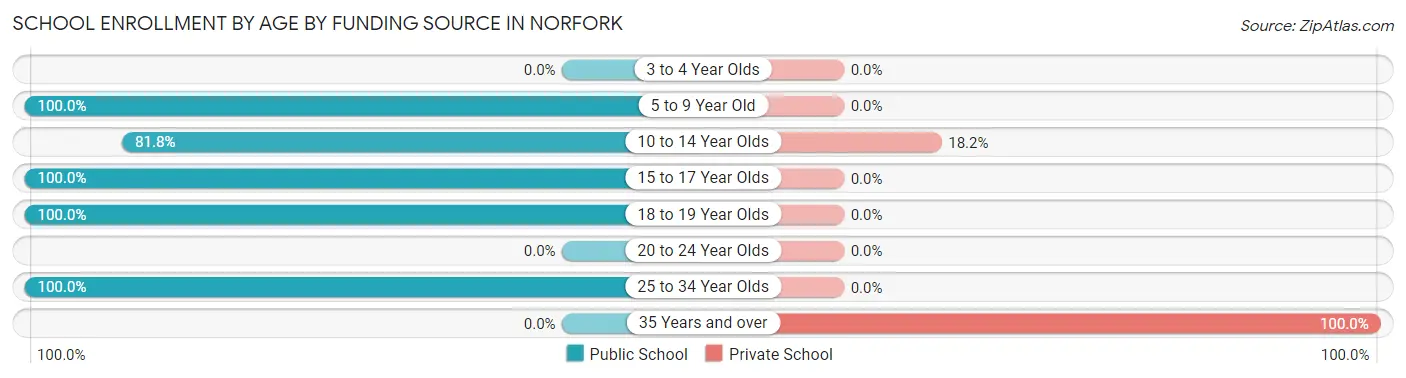
| Age Bracket | Public School | Private School |
| 3 to 4 Year Olds | 0 (0.0%) | 0 (0.0%) |
| 5 to 9 Year Old | 85 (100.0%) | 0 (0.0%) |
| 10 to 14 Year Olds | 18 (81.8%) | 4 (18.2%) |
| 15 to 17 Year Olds | 20 (100.0%) | 0 (0.0%) |
| 18 to 19 Year Olds | 3 (100.0%) | 0 (0.0%) |
| 20 to 24 Year Olds | 0 (0.0%) | 0 (0.0%) |
| 25 to 34 Year Olds | 5 (100.0%) | 0 (0.0%) |
| 35 Years and over | 0 (0.0%) | 1 (100.0%) |
| Total | 131 (96.3%) | 5 (3.7%) |
Educational Attainment by Field of Study in Norfork
Physical & health sciences (27 | 28.1%), bio, nature & agricultural (26 | 27.1%), literature & languages (10 | 10.4%), education (8 | 8.3%), and arts & humanities (7 | 7.3%) are the most common fields of study among 96 individuals in Norfork who have obtained a bachelor's degree or higher.
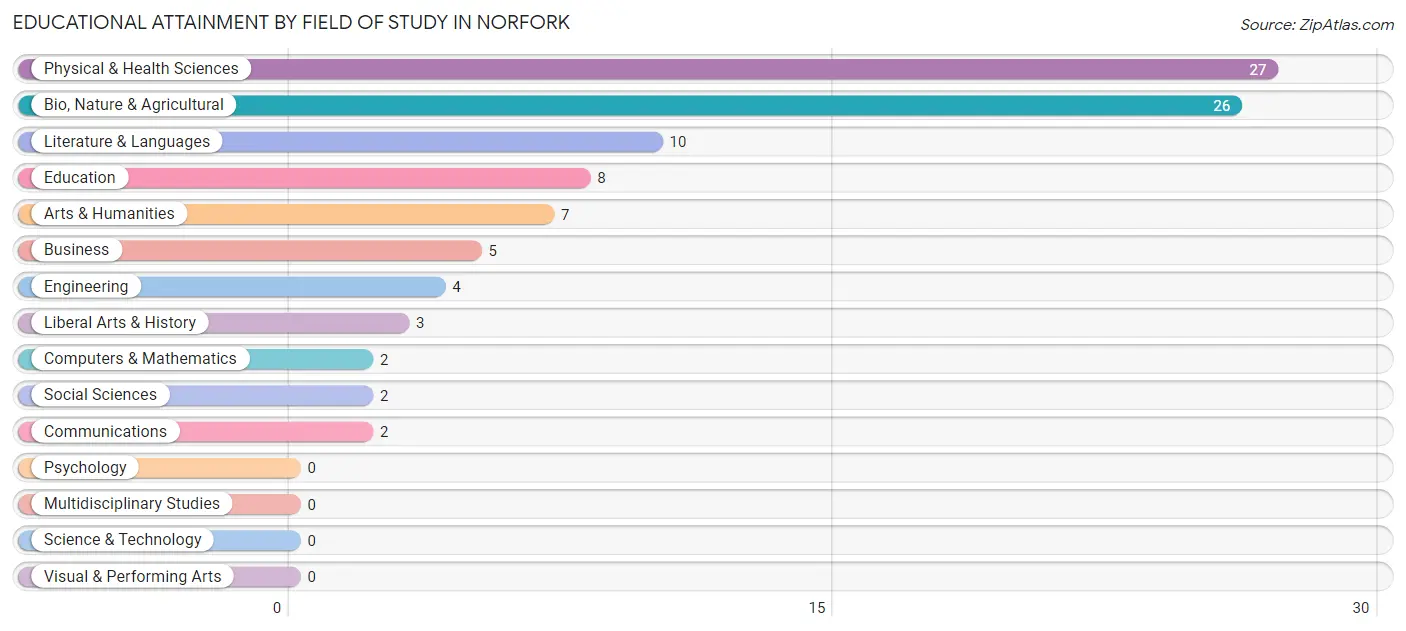
| Field of Study | # Graduates | % Graduates |
| Computers & Mathematics | 2 | 2.1% |
| Bio, Nature & Agricultural | 26 | 27.1% |
| Physical & Health Sciences | 27 | 28.1% |
| Psychology | 0 | 0.0% |
| Social Sciences | 2 | 2.1% |
| Engineering | 4 | 4.2% |
| Multidisciplinary Studies | 0 | 0.0% |
| Science & Technology | 0 | 0.0% |
| Business | 5 | 5.2% |
| Education | 8 | 8.3% |
| Literature & Languages | 10 | 10.4% |
| Liberal Arts & History | 3 | 3.1% |
| Visual & Performing Arts | 0 | 0.0% |
| Communications | 2 | 2.1% |
| Arts & Humanities | 7 | 7.3% |
| Total | 96 | 100.0% |
Transportation & Commute in Norfork
Vehicle Availability by Sex in Norfork
The most prevalent vehicle ownership categories in Norfork are males with 2 vehicles (27, accounting for 51.9%) and females with 2 vehicles (24, making up 29.7%).
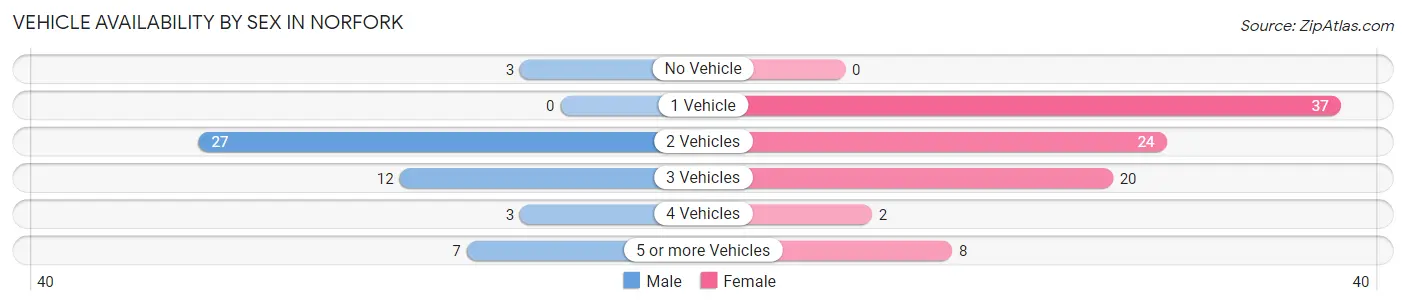
| Vehicles Available | Male | Female |
| No Vehicle | 3 (5.8%) | 0 (0.0%) |
| 1 Vehicle | 0 (0.0%) | 37 (40.7%) |
| 2 Vehicles | 27 (51.9%) | 24 (26.4%) |
| 3 Vehicles | 12 (23.1%) | 20 (22.0%) |
| 4 Vehicles | 3 (5.8%) | 2 (2.2%) |
| 5 or more Vehicles | 7 (13.5%) | 8 (8.8%) |
| Total | 52 (100.0%) | 91 (100.0%) |
Commute Time in Norfork
The most frequently occuring commute durations in Norfork are 20 to 24 minutes (27 commuters, 19.3%), less than 5 minutes (24 commuters, 17.1%), and 30 to 34 minutes (23 commuters, 16.4%).
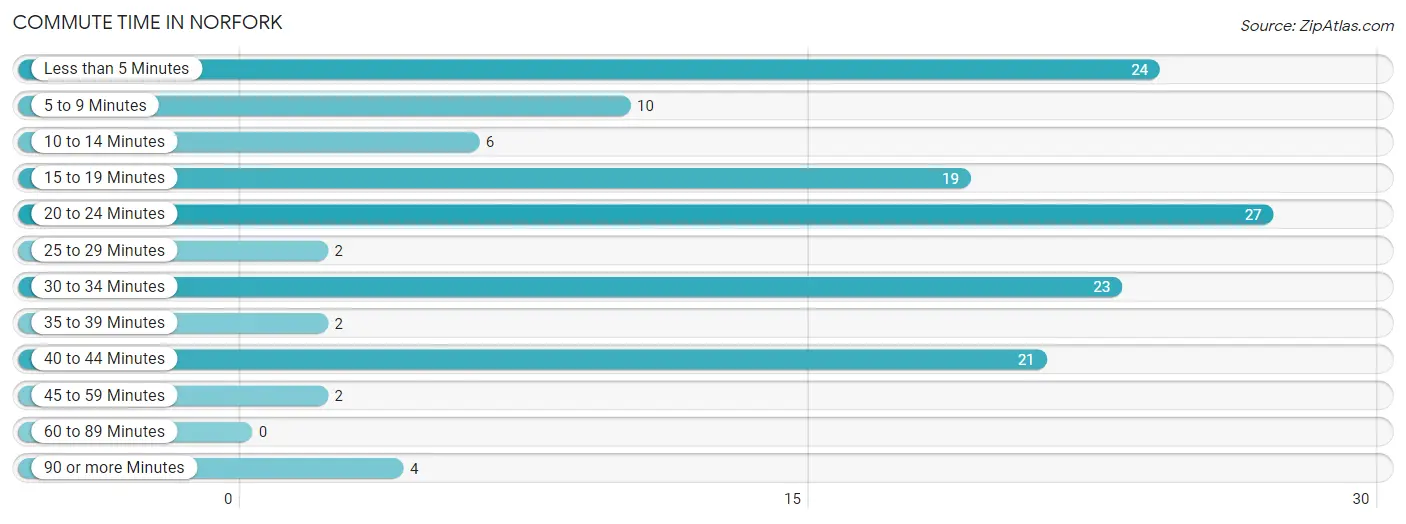
| Commute Time | # Commuters | % Commuters |
| Less than 5 Minutes | 24 | 17.1% |
| 5 to 9 Minutes | 10 | 7.1% |
| 10 to 14 Minutes | 6 | 4.3% |
| 15 to 19 Minutes | 19 | 13.6% |
| 20 to 24 Minutes | 27 | 19.3% |
| 25 to 29 Minutes | 2 | 1.4% |
| 30 to 34 Minutes | 23 | 16.4% |
| 35 to 39 Minutes | 2 | 1.4% |
| 40 to 44 Minutes | 21 | 15.0% |
| 45 to 59 Minutes | 2 | 1.4% |
| 60 to 89 Minutes | 0 | 0.0% |
| 90 or more Minutes | 4 | 2.9% |
Commute Time by Sex in Norfork
The most common commute times in Norfork are 20 to 24 minutes (18 commuters, 34.6%) for males and less than 5 minutes (21 commuters, 23.9%) for females.
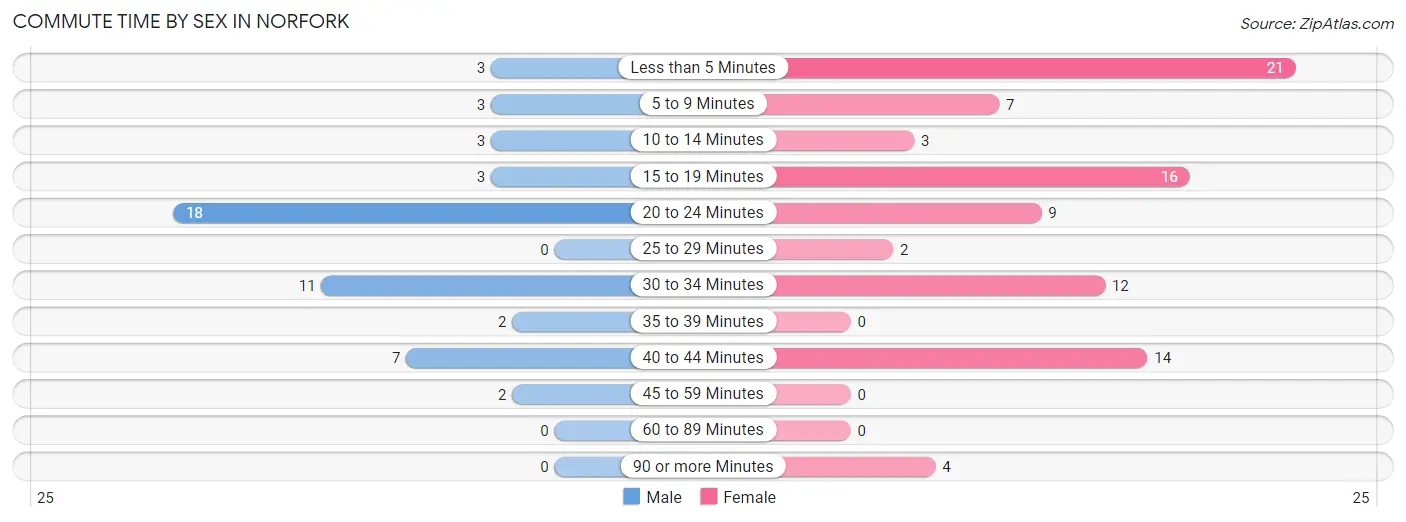
| Commute Time | Male | Female |
| Less than 5 Minutes | 3 (5.8%) | 21 (23.9%) |
| 5 to 9 Minutes | 3 (5.8%) | 7 (8.0%) |
| 10 to 14 Minutes | 3 (5.8%) | 3 (3.4%) |
| 15 to 19 Minutes | 3 (5.8%) | 16 (18.2%) |
| 20 to 24 Minutes | 18 (34.6%) | 9 (10.2%) |
| 25 to 29 Minutes | 0 (0.0%) | 2 (2.3%) |
| 30 to 34 Minutes | 11 (21.1%) | 12 (13.6%) |
| 35 to 39 Minutes | 2 (3.8%) | 0 (0.0%) |
| 40 to 44 Minutes | 7 (13.5%) | 14 (15.9%) |
| 45 to 59 Minutes | 2 (3.8%) | 0 (0.0%) |
| 60 to 89 Minutes | 0 (0.0%) | 0 (0.0%) |
| 90 or more Minutes | 0 (0.0%) | 4 (4.5%) |
Time of Departure to Work by Sex in Norfork
The most frequent times of departure to work in Norfork are 9:00 AM to 9:59 AM (15, 28.8%) for males and 10:00 AM to 10:59 AM (22, 25.0%) for females.
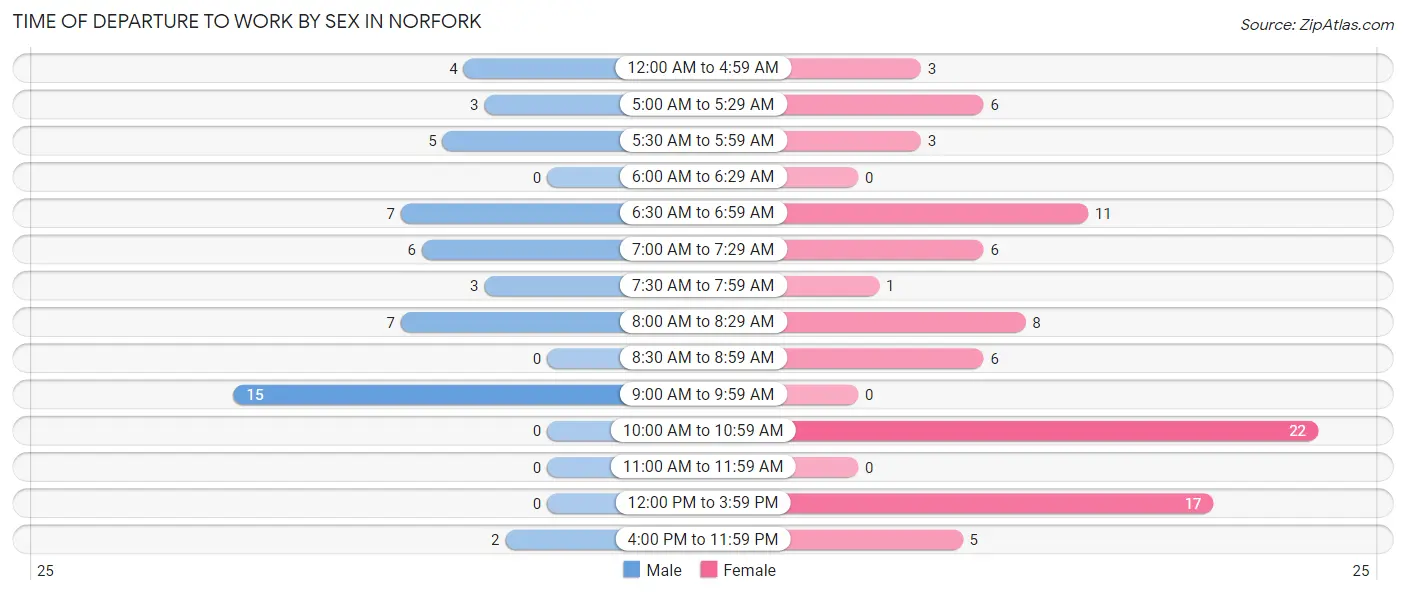
| Time of Departure | Male | Female |
| 12:00 AM to 4:59 AM | 4 (7.7%) | 3 (3.4%) |
| 5:00 AM to 5:29 AM | 3 (5.8%) | 6 (6.8%) |
| 5:30 AM to 5:59 AM | 5 (9.6%) | 3 (3.4%) |
| 6:00 AM to 6:29 AM | 0 (0.0%) | 0 (0.0%) |
| 6:30 AM to 6:59 AM | 7 (13.5%) | 11 (12.5%) |
| 7:00 AM to 7:29 AM | 6 (11.5%) | 6 (6.8%) |
| 7:30 AM to 7:59 AM | 3 (5.8%) | 1 (1.1%) |
| 8:00 AM to 8:29 AM | 7 (13.5%) | 8 (9.1%) |
| 8:30 AM to 8:59 AM | 0 (0.0%) | 6 (6.8%) |
| 9:00 AM to 9:59 AM | 15 (28.8%) | 0 (0.0%) |
| 10:00 AM to 10:59 AM | 0 (0.0%) | 22 (25.0%) |
| 11:00 AM to 11:59 AM | 0 (0.0%) | 0 (0.0%) |
| 12:00 PM to 3:59 PM | 0 (0.0%) | 17 (19.3%) |
| 4:00 PM to 11:59 PM | 2 (3.8%) | 5 (5.7%) |
| Total | 52 (100.0%) | 88 (100.0%) |
Housing Occupancy in Norfork
Occupancy by Ownership in Norfork
Of the total 206 dwellings in Norfork, owner-occupied units account for 133 (64.6%), while renter-occupied units make up 73 (35.4%).
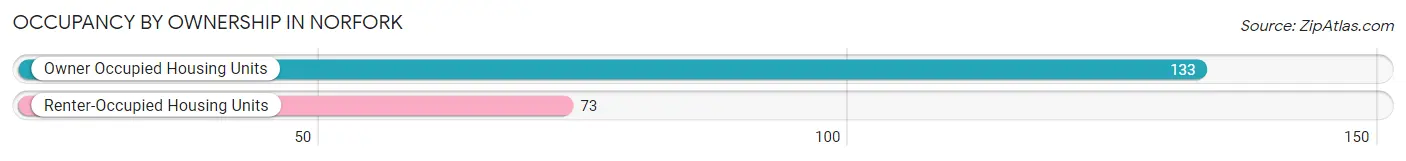
| Occupancy | # Housing Units | % Housing Units |
| Owner Occupied Housing Units | 133 | 64.6% |
| Renter-Occupied Housing Units | 73 | 35.4% |
| Total Occupied Housing Units | 206 | 100.0% |
Occupancy by Household Size in Norfork
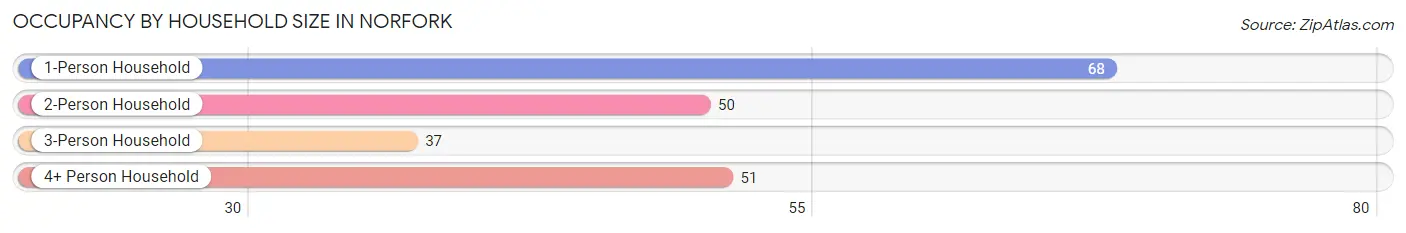
| Household Size | # Housing Units | % Housing Units |
| 1-Person Household | 68 | 33.0% |
| 2-Person Household | 50 | 24.3% |
| 3-Person Household | 37 | 18.0% |
| 4+ Person Household | 51 | 24.8% |
| Total Housing Units | 206 | 100.0% |
Occupancy by Ownership by Household Size in Norfork
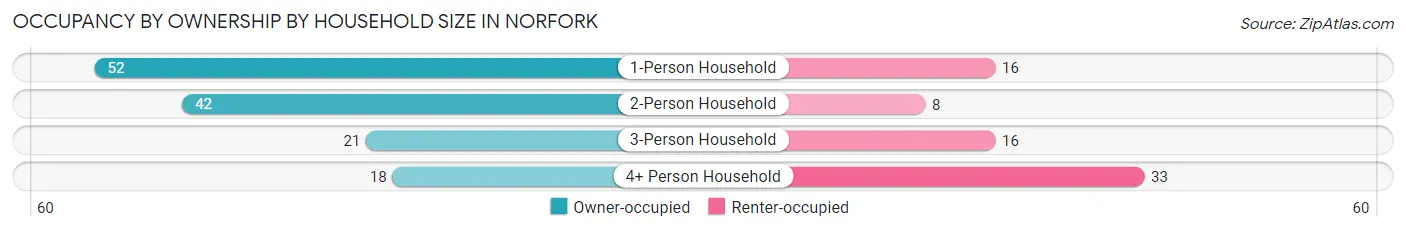
| Household Size | Owner-occupied | Renter-occupied |
| 1-Person Household | 52 (76.5%) | 16 (23.5%) |
| 2-Person Household | 42 (84.0%) | 8 (16.0%) |
| 3-Person Household | 21 (56.8%) | 16 (43.2%) |
| 4+ Person Household | 18 (35.3%) | 33 (64.7%) |
| Total Housing Units | 133 (64.6%) | 73 (35.4%) |
Occupancy by Educational Attainment in Norfork
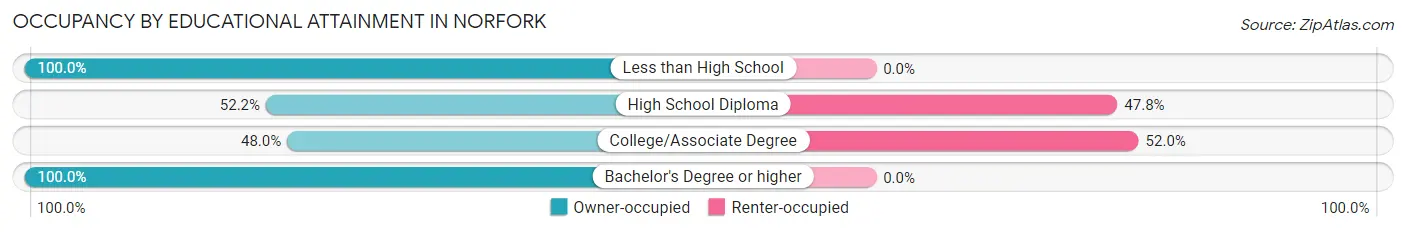
| Household Size | Owner-occupied | Renter-occupied |
| Less than High School | 17 (100.0%) | 0 (0.0%) |
| High School Diploma | 24 (52.2%) | 22 (47.8%) |
| College/Associate Degree | 47 (48.0%) | 51 (52.0%) |
| Bachelor's Degree or higher | 45 (100.0%) | 0 (0.0%) |
Occupancy by Age of Householder in Norfork
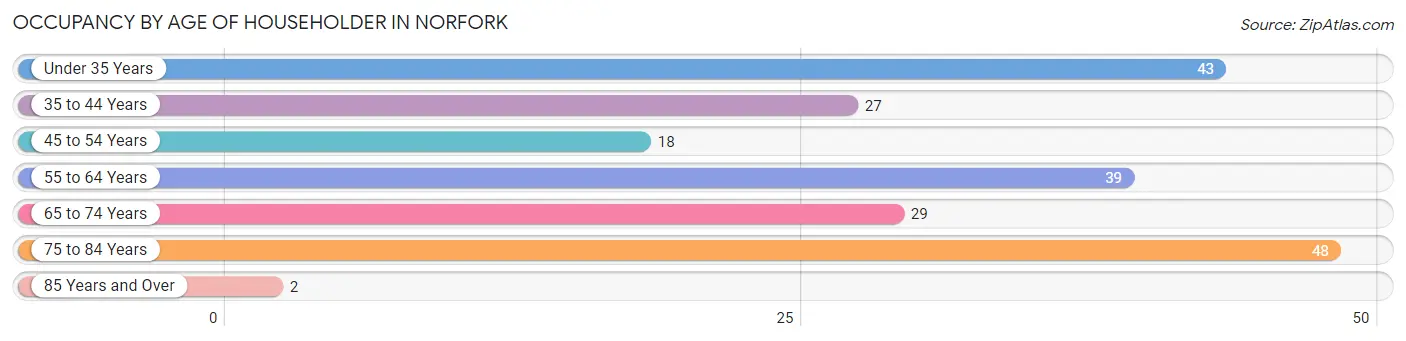
| Age Bracket | # Households | % Households |
| Under 35 Years | 43 | 20.9% |
| 35 to 44 Years | 27 | 13.1% |
| 45 to 54 Years | 18 | 8.7% |
| 55 to 64 Years | 39 | 18.9% |
| 65 to 74 Years | 29 | 14.1% |
| 75 to 84 Years | 48 | 23.3% |
| 85 Years and Over | 2 | 1.0% |
| Total | 206 | 100.0% |
Housing Finances in Norfork
Median Income by Occupancy in Norfork
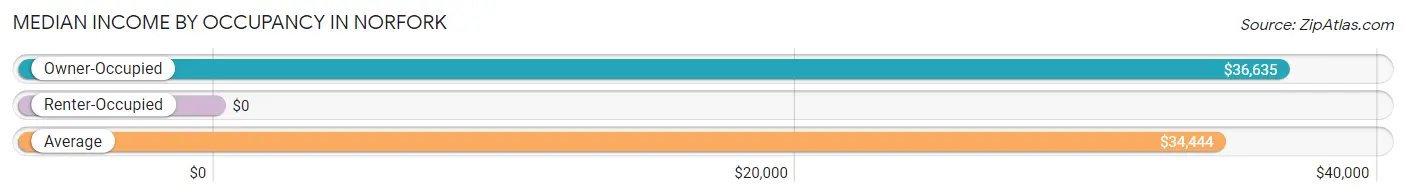
| Occupancy Type | # Households | Median Income |
| Owner-Occupied | 133 (64.6%) | $36,635 |
| Renter-Occupied | 73 (35.4%) | $0 |
| Average | 206 (100.0%) | $34,444 |
Occupancy by Householder Income Bracket in Norfork
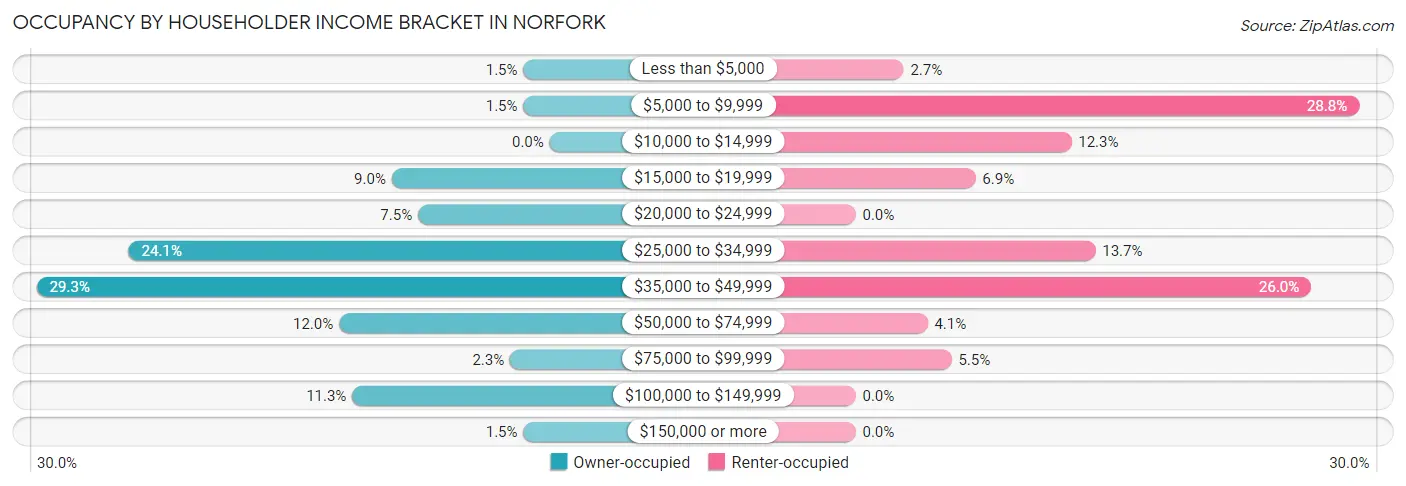
| Income Bracket | Owner-occupied | Renter-occupied |
| Less than $5,000 | 2 (1.5%) | 2 (2.7%) |
| $5,000 to $9,999 | 2 (1.5%) | 21 (28.8%) |
| $10,000 to $14,999 | 0 (0.0%) | 9 (12.3%) |
| $15,000 to $19,999 | 12 (9.0%) | 5 (6.9%) |
| $20,000 to $24,999 | 10 (7.5%) | 0 (0.0%) |
| $25,000 to $34,999 | 32 (24.1%) | 10 (13.7%) |
| $35,000 to $49,999 | 39 (29.3%) | 19 (26.0%) |
| $50,000 to $74,999 | 16 (12.0%) | 3 (4.1%) |
| $75,000 to $99,999 | 3 (2.3%) | 4 (5.5%) |
| $100,000 to $149,999 | 15 (11.3%) | 0 (0.0%) |
| $150,000 or more | 2 (1.5%) | 0 (0.0%) |
| Total | 133 (100.0%) | 73 (100.0%) |
Monthly Housing Cost Tiers in Norfork
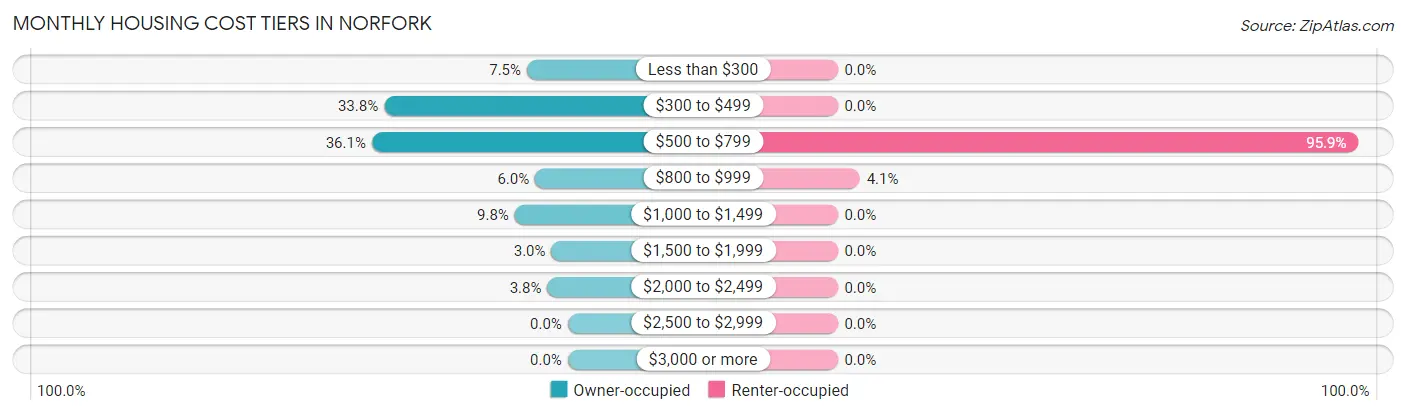
| Monthly Cost | Owner-occupied | Renter-occupied |
| Less than $300 | 10 (7.5%) | 0 (0.0%) |
| $300 to $499 | 45 (33.8%) | 0 (0.0%) |
| $500 to $799 | 48 (36.1%) | 70 (95.9%) |
| $800 to $999 | 8 (6.0%) | 3 (4.1%) |
| $1,000 to $1,499 | 13 (9.8%) | 0 (0.0%) |
| $1,500 to $1,999 | 4 (3.0%) | 0 (0.0%) |
| $2,000 to $2,499 | 5 (3.8%) | 0 (0.0%) |
| $2,500 to $2,999 | 0 (0.0%) | 0 (0.0%) |
| $3,000 or more | 0 (0.0%) | 0 (0.0%) |
| Total | 133 (100.0%) | 73 (100.0%) |
Physical Housing Characteristics in Norfork
Housing Structures in Norfork
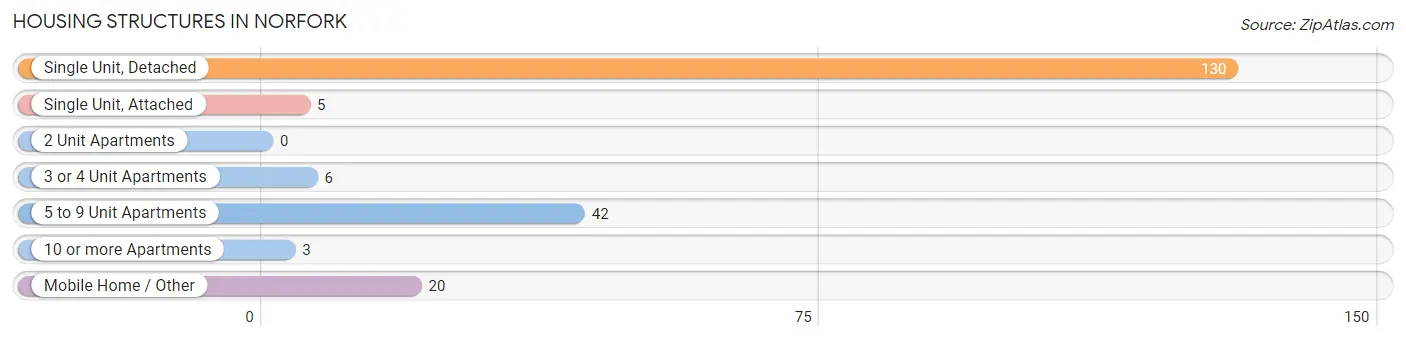
| Structure Type | # Housing Units | % Housing Units |
| Single Unit, Detached | 130 | 63.1% |
| Single Unit, Attached | 5 | 2.4% |
| 2 Unit Apartments | 0 | 0.0% |
| 3 or 4 Unit Apartments | 6 | 2.9% |
| 5 to 9 Unit Apartments | 42 | 20.4% |
| 10 or more Apartments | 3 | 1.5% |
| Mobile Home / Other | 20 | 9.7% |
| Total | 206 | 100.0% |
Housing Structures by Occupancy in Norfork
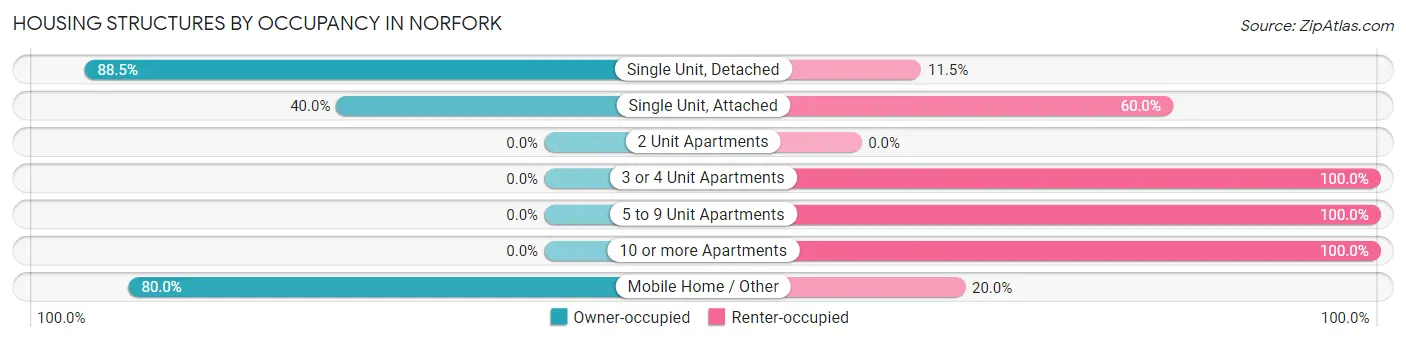
| Structure Type | Owner-occupied | Renter-occupied |
| Single Unit, Detached | 115 (88.5%) | 15 (11.5%) |
| Single Unit, Attached | 2 (40.0%) | 3 (60.0%) |
| 2 Unit Apartments | 0 (0.0%) | 0 (0.0%) |
| 3 or 4 Unit Apartments | 0 (0.0%) | 6 (100.0%) |
| 5 to 9 Unit Apartments | 0 (0.0%) | 42 (100.0%) |
| 10 or more Apartments | 0 (0.0%) | 3 (100.0%) |
| Mobile Home / Other | 16 (80.0%) | 4 (20.0%) |
| Total | 133 (64.6%) | 73 (35.4%) |
Housing Structures by Number of Rooms in Norfork
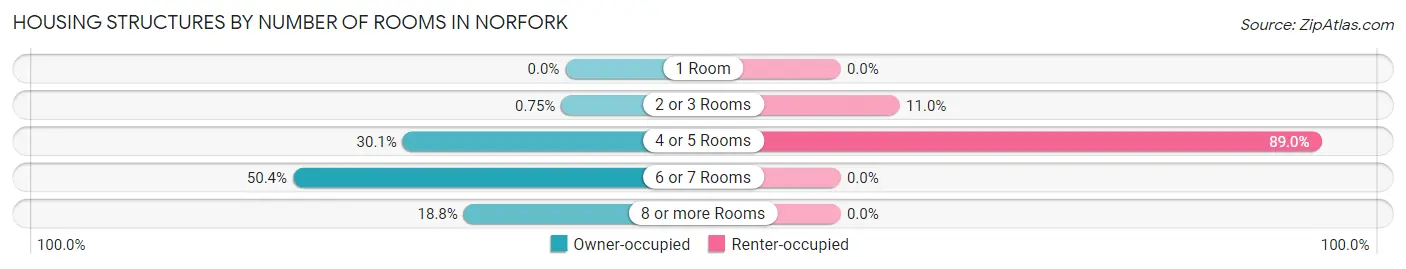
| Number of Rooms | Owner-occupied | Renter-occupied |
| 1 Room | 0 (0.0%) | 0 (0.0%) |
| 2 or 3 Rooms | 1 (0.7%) | 8 (11.0%) |
| 4 or 5 Rooms | 40 (30.1%) | 65 (89.0%) |
| 6 or 7 Rooms | 67 (50.4%) | 0 (0.0%) |
| 8 or more Rooms | 25 (18.8%) | 0 (0.0%) |
| Total | 133 (100.0%) | 73 (100.0%) |
Housing Structure by Heating Type in Norfork
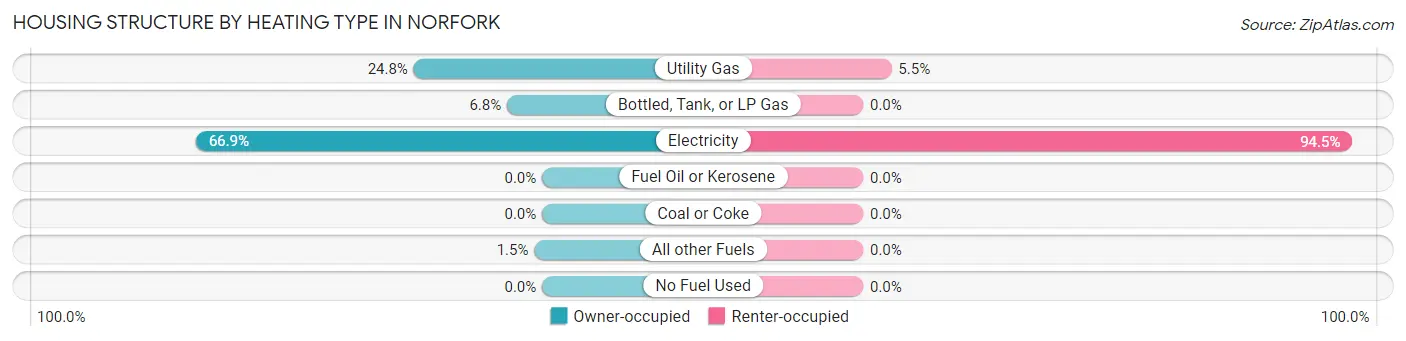
| Heating Type | Owner-occupied | Renter-occupied |
| Utility Gas | 33 (24.8%) | 4 (5.5%) |
| Bottled, Tank, or LP Gas | 9 (6.8%) | 0 (0.0%) |
| Electricity | 89 (66.9%) | 69 (94.5%) |
| Fuel Oil or Kerosene | 0 (0.0%) | 0 (0.0%) |
| Coal or Coke | 0 (0.0%) | 0 (0.0%) |
| All other Fuels | 2 (1.5%) | 0 (0.0%) |
| No Fuel Used | 0 (0.0%) | 0 (0.0%) |
| Total | 133 (100.0%) | 73 (100.0%) |
Household Vehicle Usage in Norfork
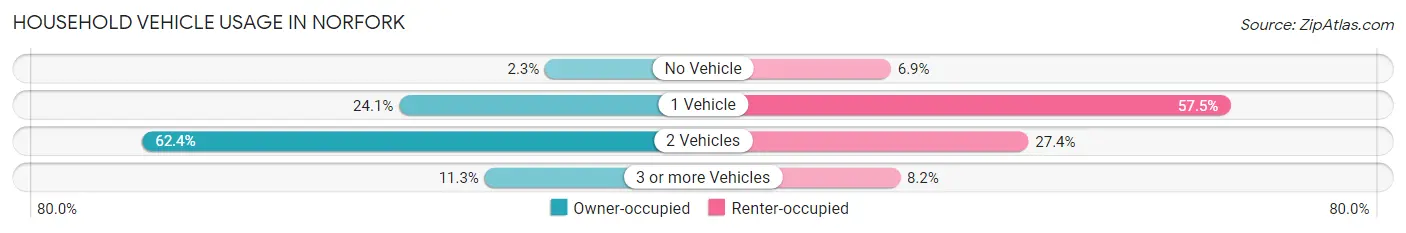
| Vehicles per Household | Owner-occupied | Renter-occupied |
| No Vehicle | 3 (2.3%) | 5 (6.9%) |
| 1 Vehicle | 32 (24.1%) | 42 (57.5%) |
| 2 Vehicles | 83 (62.4%) | 20 (27.4%) |
| 3 or more Vehicles | 15 (11.3%) | 6 (8.2%) |
| Total | 133 (100.0%) | 73 (100.0%) |
Real Estate & Mortgages in Norfork
Real Estate and Mortgage Overview in Norfork
| Characteristic | Without Mortgage | With Mortgage |
| Housing Units | 100 | 33 |
| Median Property Value | $207,100 | $0 |
| Median Household Income | $35,909 | $0 |
| Monthly Housing Costs | $471 | $0 |
| Real Estate Taxes | $1,458 | $3 |
Property Value by Mortgage Status in Norfork
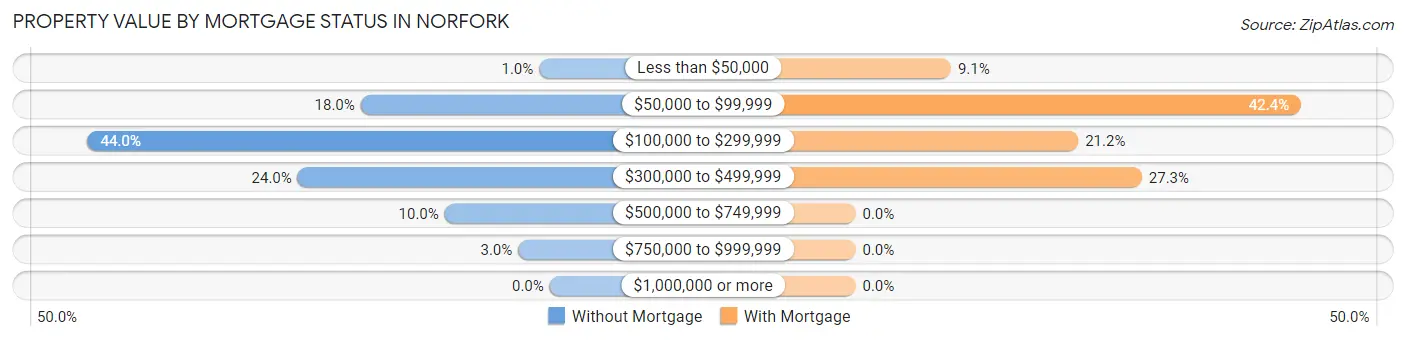
| Property Value | Without Mortgage | With Mortgage |
| Less than $50,000 | 1 (1.0%) | 3 (9.1%) |
| $50,000 to $99,999 | 18 (18.0%) | 14 (42.4%) |
| $100,000 to $299,999 | 44 (44.0%) | 7 (21.2%) |
| $300,000 to $499,999 | 24 (24.0%) | 9 (27.3%) |
| $500,000 to $749,999 | 10 (10.0%) | 0 (0.0%) |
| $750,000 to $999,999 | 3 (3.0%) | 0 (0.0%) |
| $1,000,000 or more | 0 (0.0%) | 0 (0.0%) |
| Total | 100 (100.0%) | 33 (100.0%) |
Household Income by Mortgage Status in Norfork
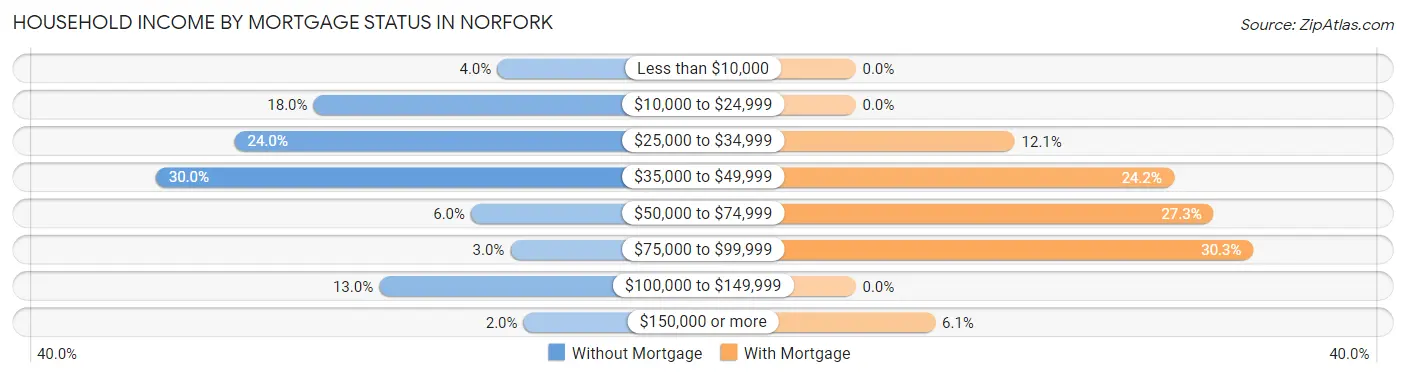
| Household Income | Without Mortgage | With Mortgage |
| Less than $10,000 | 4 (4.0%) | 0 (0.0%) |
| $10,000 to $24,999 | 18 (18.0%) | 0 (0.0%) |
| $25,000 to $34,999 | 24 (24.0%) | 4 (12.1%) |
| $35,000 to $49,999 | 30 (30.0%) | 8 (24.2%) |
| $50,000 to $74,999 | 6 (6.0%) | 9 (27.3%) |
| $75,000 to $99,999 | 3 (3.0%) | 10 (30.3%) |
| $100,000 to $149,999 | 13 (13.0%) | 0 (0.0%) |
| $150,000 or more | 2 (2.0%) | 2 (6.1%) |
| Total | 100 (100.0%) | 33 (100.0%) |
Property Value to Household Income Ratio in Norfork
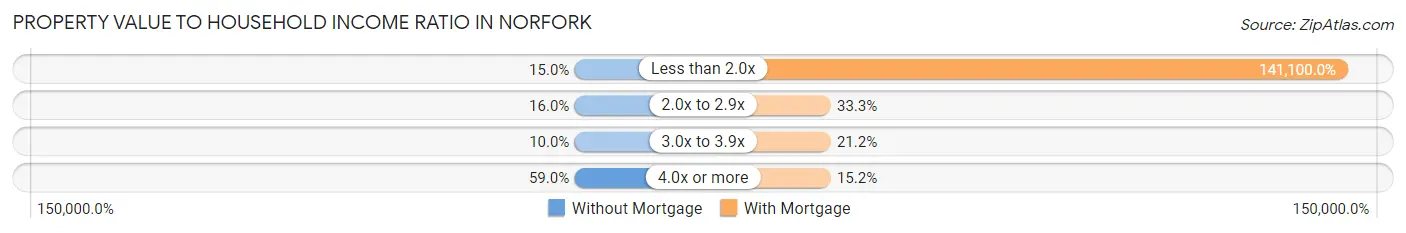
| Value-to-Income Ratio | Without Mortgage | With Mortgage |
| Less than 2.0x | 15 (15.0%) | 46,563 (141,100.0%) |
| 2.0x to 2.9x | 16 (16.0%) | 11 (33.3%) |
| 3.0x to 3.9x | 10 (10.0%) | 7 (21.2%) |
| 4.0x or more | 59 (59.0%) | 5 (15.1%) |
| Total | 100 (100.0%) | 33 (100.0%) |
Real Estate Taxes by Mortgage Status in Norfork
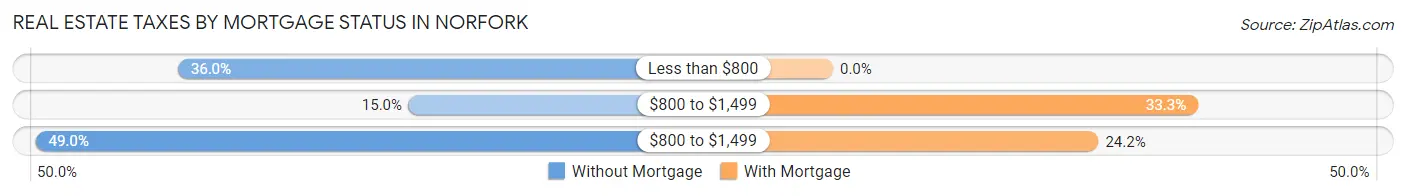
| Property Taxes | Without Mortgage | With Mortgage |
| Less than $800 | 36 (36.0%) | 0 (0.0%) |
| $800 to $1,499 | 15 (15.0%) | 11 (33.3%) |
| $800 to $1,499 | 49 (49.0%) | 8 (24.2%) |
| Total | 100 (100.0%) | 33 (100.0%) |
Health & Disability in Norfork
Health Insurance Coverage by Age in Norfork
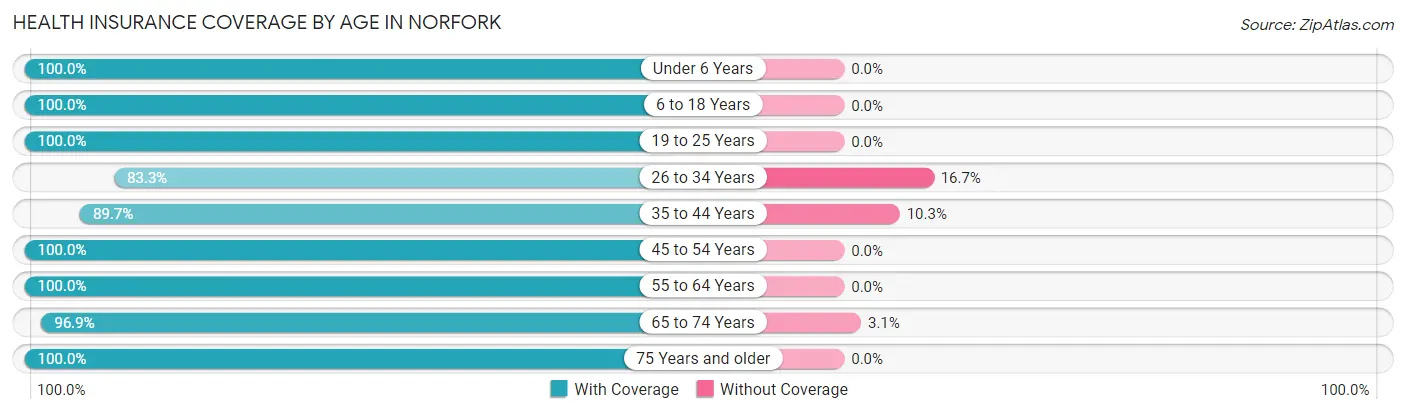
| Age Bracket | With Coverage | Without Coverage |
| Under 6 Years | 83 (100.0%) | 0 (0.0%) |
| 6 to 18 Years | 119 (100.0%) | 0 (0.0%) |
| 19 to 25 Years | 15 (100.0%) | 0 (0.0%) |
| 26 to 34 Years | 40 (83.3%) | 8 (16.7%) |
| 35 to 44 Years | 78 (89.7%) | 9 (10.3%) |
| 45 to 54 Years | 21 (100.0%) | 0 (0.0%) |
| 55 to 64 Years | 60 (100.0%) | 0 (0.0%) |
| 65 to 74 Years | 62 (96.9%) | 2 (3.1%) |
| 75 Years and older | 57 (100.0%) | 0 (0.0%) |
| Total | 535 (96.6%) | 19 (3.4%) |
Health Insurance Coverage by Citizenship Status in Norfork
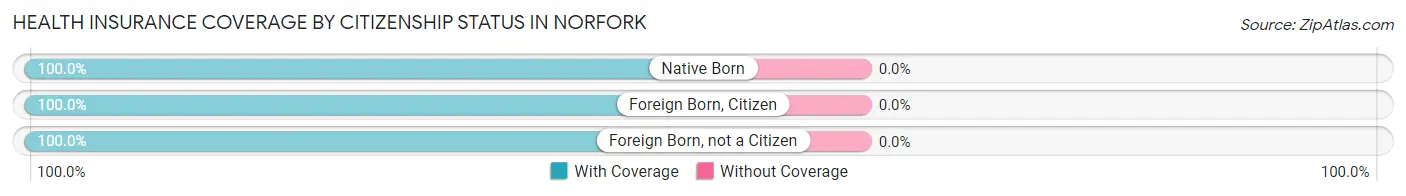
| Citizenship Status | With Coverage | Without Coverage |
| Native Born | 83 (100.0%) | 0 (0.0%) |
| Foreign Born, Citizen | 119 (100.0%) | 0 (0.0%) |
| Foreign Born, not a Citizen | 15 (100.0%) | 0 (0.0%) |
Health Insurance Coverage by Household Income in Norfork
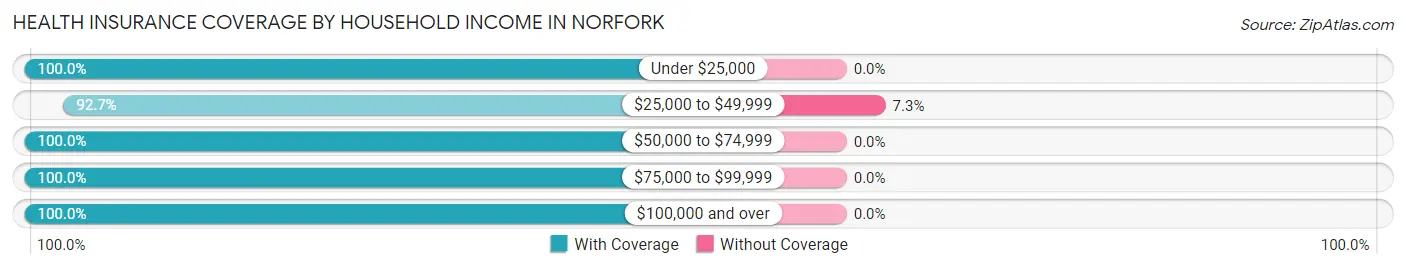
| Household Income | With Coverage | Without Coverage |
| Under $25,000 | 181 (100.0%) | 0 (0.0%) |
| $25,000 to $49,999 | 242 (92.7%) | 19 (7.3%) |
| $50,000 to $74,999 | 60 (100.0%) | 0 (0.0%) |
| $75,000 to $99,999 | 23 (100.0%) | 0 (0.0%) |
| $100,000 and over | 29 (100.0%) | 0 (0.0%) |
Public vs Private Health Insurance Coverage by Age in Norfork
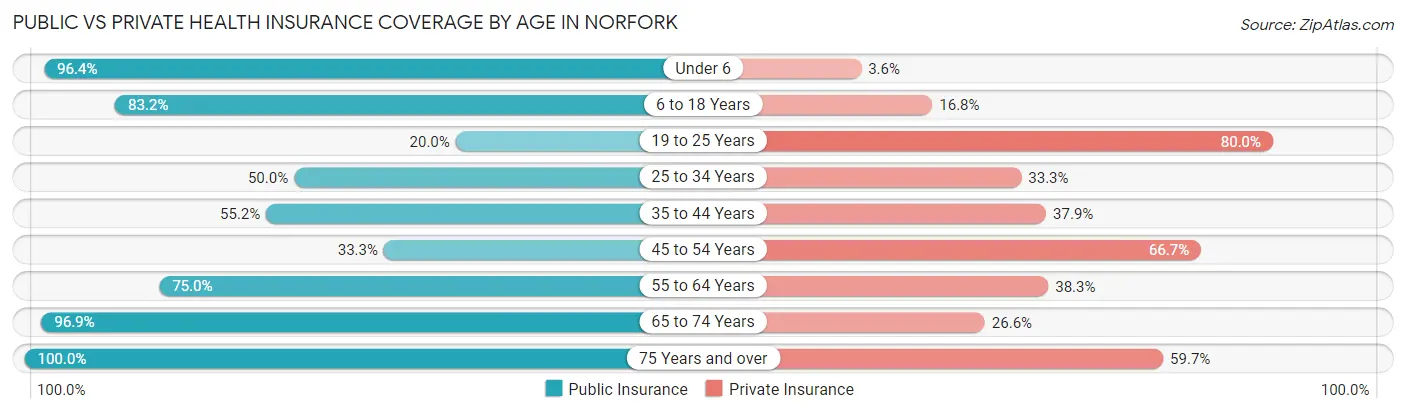
| Age Bracket | Public Insurance | Private Insurance |
| Under 6 | 80 (96.4%) | 3 (3.6%) |
| 6 to 18 Years | 99 (83.2%) | 20 (16.8%) |
| 19 to 25 Years | 3 (20.0%) | 12 (80.0%) |
| 25 to 34 Years | 24 (50.0%) | 16 (33.3%) |
| 35 to 44 Years | 48 (55.2%) | 33 (37.9%) |
| 45 to 54 Years | 7 (33.3%) | 14 (66.7%) |
| 55 to 64 Years | 45 (75.0%) | 23 (38.3%) |
| 65 to 74 Years | 62 (96.9%) | 17 (26.6%) |
| 75 Years and over | 57 (100.0%) | 34 (59.7%) |
| Total | 425 (76.7%) | 172 (31.0%) |
Disability Status by Sex by Age in Norfork
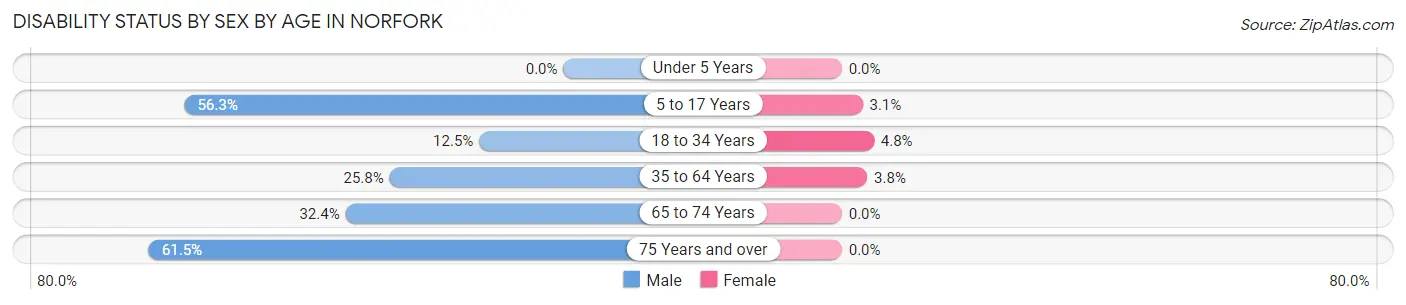
| Age Bracket | Male | Female |
| Under 5 Years | 0 (0.0%) | 0 (0.0%) |
| 5 to 17 Years | 36 (56.2%) | 2 (3.1%) |
| 18 to 34 Years | 3 (12.5%) | 2 (4.8%) |
| 35 to 64 Years | 16 (25.8%) | 4 (3.8%) |
| 65 to 74 Years | 11 (32.4%) | 0 (0.0%) |
| 75 Years and over | 24 (61.5%) | 0 (0.0%) |
Disability Class by Sex by Age in Norfork
Disability Class: Hearing Difficulty
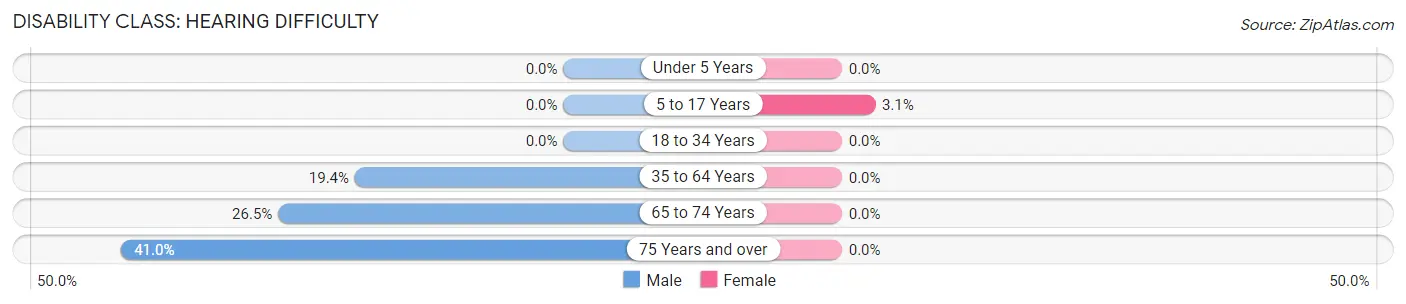
| Age Bracket | Male | Female |
| Under 5 Years | 0 (0.0%) | 0 (0.0%) |
| 5 to 17 Years | 0 (0.0%) | 2 (3.1%) |
| 18 to 34 Years | 0 (0.0%) | 0 (0.0%) |
| 35 to 64 Years | 12 (19.4%) | 0 (0.0%) |
| 65 to 74 Years | 9 (26.5%) | 0 (0.0%) |
| 75 Years and over | 16 (41.0%) | 0 (0.0%) |
Disability Class: Vision Difficulty
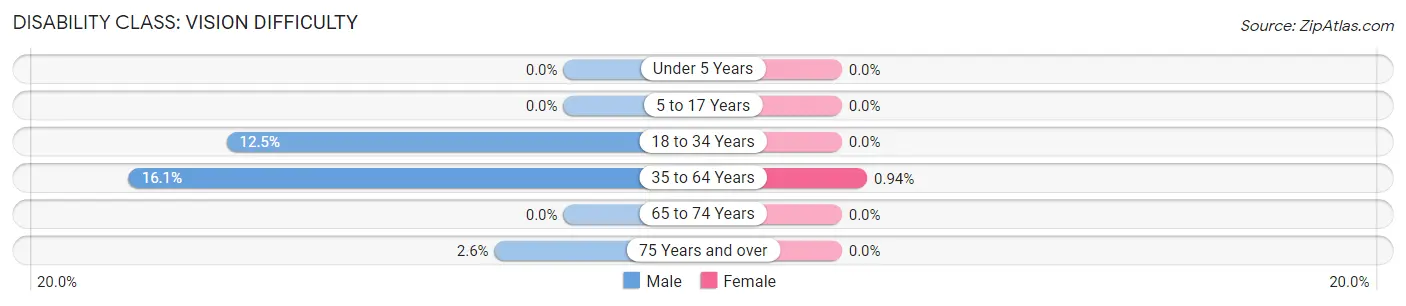
| Age Bracket | Male | Female |
| Under 5 Years | 0 (0.0%) | 0 (0.0%) |
| 5 to 17 Years | 0 (0.0%) | 0 (0.0%) |
| 18 to 34 Years | 3 (12.5%) | 0 (0.0%) |
| 35 to 64 Years | 10 (16.1%) | 1 (0.9%) |
| 65 to 74 Years | 0 (0.0%) | 0 (0.0%) |
| 75 Years and over | 1 (2.6%) | 0 (0.0%) |
Disability Class: Cognitive Difficulty
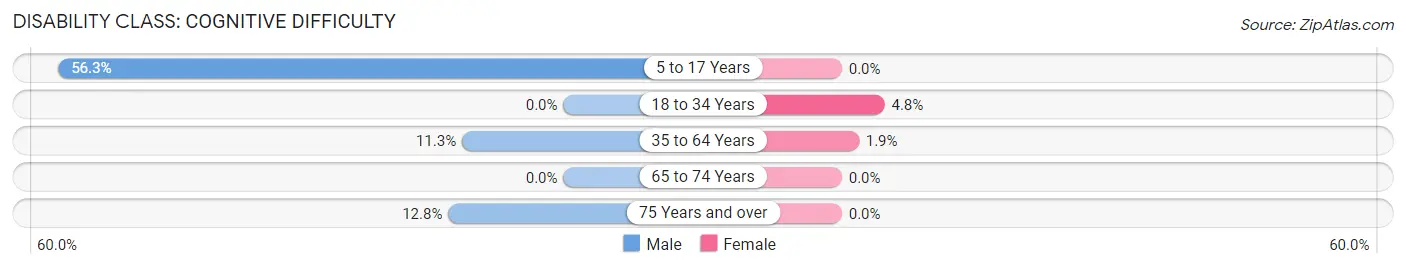
| Age Bracket | Male | Female |
| 5 to 17 Years | 36 (56.2%) | 0 (0.0%) |
| 18 to 34 Years | 0 (0.0%) | 2 (4.8%) |
| 35 to 64 Years | 7 (11.3%) | 2 (1.9%) |
| 65 to 74 Years | 0 (0.0%) | 0 (0.0%) |
| 75 Years and over | 5 (12.8%) | 0 (0.0%) |
Disability Class: Ambulatory Difficulty
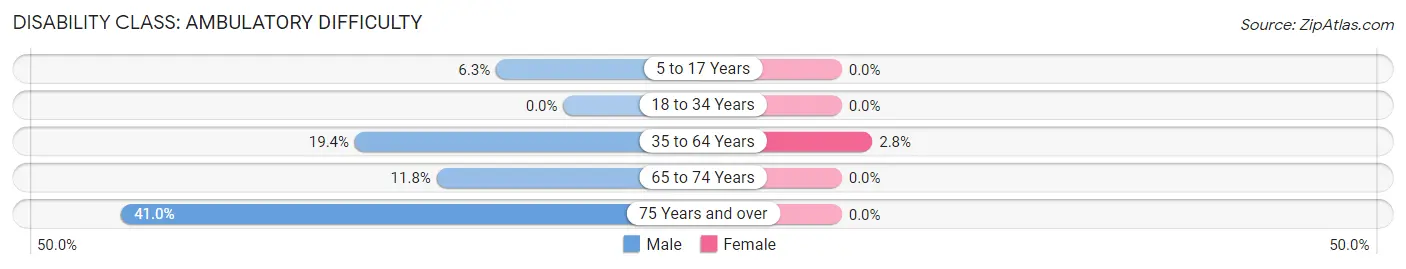
| Age Bracket | Male | Female |
| 5 to 17 Years | 4 (6.2%) | 0 (0.0%) |
| 18 to 34 Years | 0 (0.0%) | 0 (0.0%) |
| 35 to 64 Years | 12 (19.4%) | 3 (2.8%) |
| 65 to 74 Years | 4 (11.8%) | 0 (0.0%) |
| 75 Years and over | 16 (41.0%) | 0 (0.0%) |
Disability Class: Self-Care Difficulty
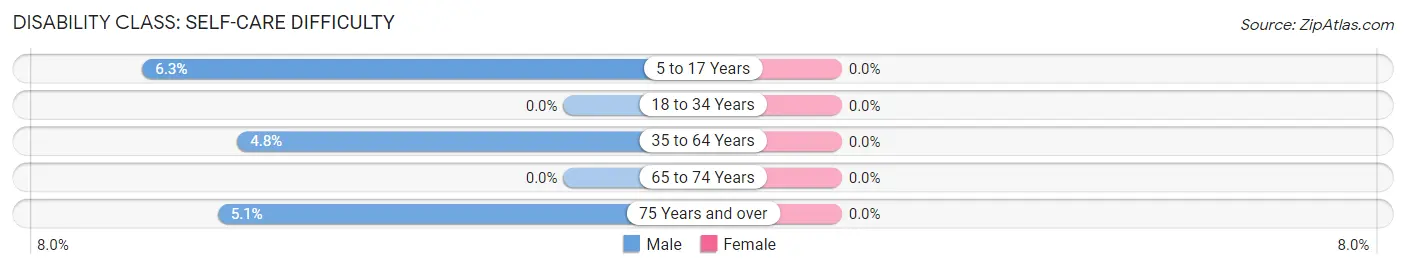
| Age Bracket | Male | Female |
| 5 to 17 Years | 4 (6.2%) | 0 (0.0%) |
| 18 to 34 Years | 0 (0.0%) | 0 (0.0%) |
| 35 to 64 Years | 3 (4.8%) | 0 (0.0%) |
| 65 to 74 Years | 0 (0.0%) | 0 (0.0%) |
| 75 Years and over | 2 (5.1%) | 0 (0.0%) |
Technology Access in Norfork
Computing Device Access in Norfork
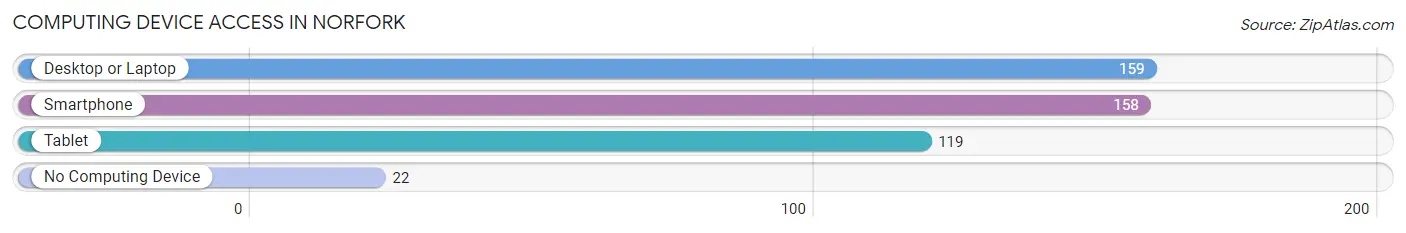
| Device Type | # Households | % Households |
| Desktop or Laptop | 159 | 77.2% |
| Smartphone | 158 | 76.7% |
| Tablet | 119 | 57.8% |
| No Computing Device | 22 | 10.7% |
| Total | 206 | 100.0% |
Internet Access in Norfork
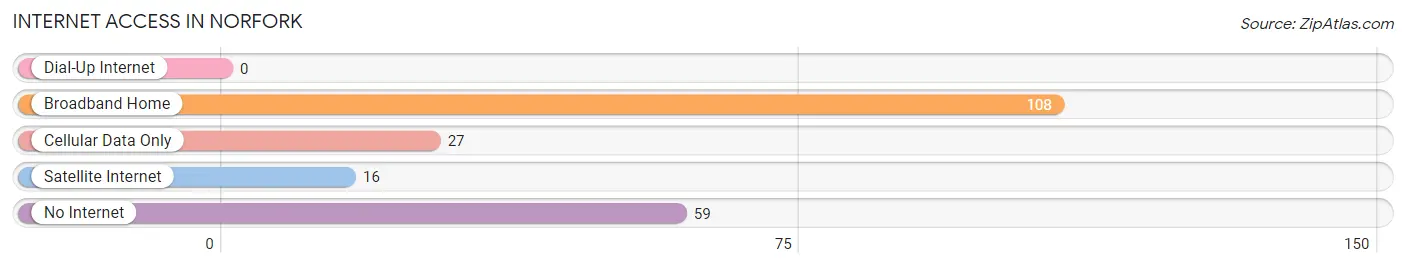
| Internet Type | # Households | % Households |
| Dial-Up Internet | 0 | 0.0% |
| Broadband Home | 108 | 52.4% |
| Cellular Data Only | 27 | 13.1% |
| Satellite Internet | 16 | 7.8% |
| No Internet | 59 | 28.6% |
| Total | 206 | 100.0% |
Norfork Summary
Norfork, Arkansas is a small town located in Baxter County in the northern part of the state. It is situated on the White River, which is a major tributary of the Mississippi River. The town was founded in 1883 and has a population of approximately 1,000 people.
Norfork is located in the Ozark Mountains, which are known for their rugged terrain and beautiful scenery. The town is surrounded by forests and is home to a variety of wildlife, including deer, turkey, and bear. The area is also known for its many lakes and rivers, which provide excellent fishing and recreational opportunities.
The economy of Norfork is largely based on agriculture and tourism. The town is home to several farms, which produce a variety of crops, including corn, soybeans, and wheat. The town also has a number of small businesses, including restaurants, stores, and a few manufacturing plants. Tourism is also an important part of the local economy, as the town is home to several popular attractions, including the Norfork National Fish Hatchery and the Norfork Dam.
The population of Norfork is predominantly white, with a small percentage of African Americans and Hispanics. The median household income is around $30,000, and the median home value is around $90,000. The town has a low unemployment rate and a high rate of home ownership.
Norfork is served by the Norfork School District, which includes two elementary schools, a middle school, and a high school. The town also has a library, a post office, and several churches.
Norfork is a small town with a rich history and a vibrant economy. It is a great place to live and work, and it offers a variety of recreational activities for residents and visitors alike. With its beautiful scenery, friendly people, and strong economy, Norfork is a great place to call home.
Common Questions
What is the Total Population of Norfork?
Total Population of Norfork is 554.
What is the Total Male Population of Norfork?
Total Male Population of Norfork is 275.
What is the Total Female Population of Norfork?
Total Female Population of Norfork is 279.
What is the Ratio of Males per 100 Females in Norfork?
There are 98.57 Males per 100 Females in Norfork.
What is the Ratio of Females per 100 Males in Norfork?
There are 101.45 Females per 100 Males in Norfork.
What is the Median Population Age in Norfork?
Median Population Age in Norfork is 36.0 Years.
What is the Average Family Size in Norfork
Average Family Size in Norfork is 3.4 People.
What is the Average Household Size in Norfork
Average Household Size in Norfork is 2.7 People.
What is Per Capita Income in Norfork?
Per Capita income in Norfork is $15,744.
What is the Median Family Income in Norfork?
Median Family Income in Norfork is $28,819.
What is the Median Household income in Norfork?
Median Household Income in Norfork is $34,444.
What is Income or Wage Gap in Norfork?
Income or Wage Gap in Norfork is 66.4%.
Women in Norfork earn 33.6 cents for every dollar earned by a man.
What is Family Income Deficit in Norfork?
Family Income Deficit in Norfork is $13,421.
Families that are below poverty line in Norfork earn $13,421 less on average than the poverty threshold level.
What is Inequality or Gini Index in Norfork?
Inequality or Gini Index in Norfork is 0.41.
How Large is the Labor Force in Norfork?
There are 145 People in the Labor Forcein in Norfork.
What is the Percentage of People in the Labor Force in Norfork?
39.2% of People are in the Labor Force in Norfork.
What is the Unemployment Rate in Norfork?
Unemployment Rate in Norfork is 1.4%.