Natural Steps, AR
Natural Steps Map
Natural Steps Overview
580
TOTAL POPULATION
285
MALE POPULATION
295
FEMALE POPULATION
96.61
MALES / 100 FEMALES
103.51
FEMALES / 100 MALES
55.6
MEDIAN AGE
2.5
AVG FAMILY SIZE
2.2
AVG HOUSEHOLD SIZE
$82,194
PER CAPITA INCOME
$147,250
AVG FAMILY INCOME
$150,530
AVG HOUSEHOLD INCOME
53.9%
WAGE / INCOME GAP [ % ]
46.1¢/ $1
WAGE / INCOME GAP [ $ ]
0.47
INEQUALITY / GINI INDEX
273
LABOR FORCE [ PEOPLE ]
53.7%
PERCENT IN LABOR FORCE
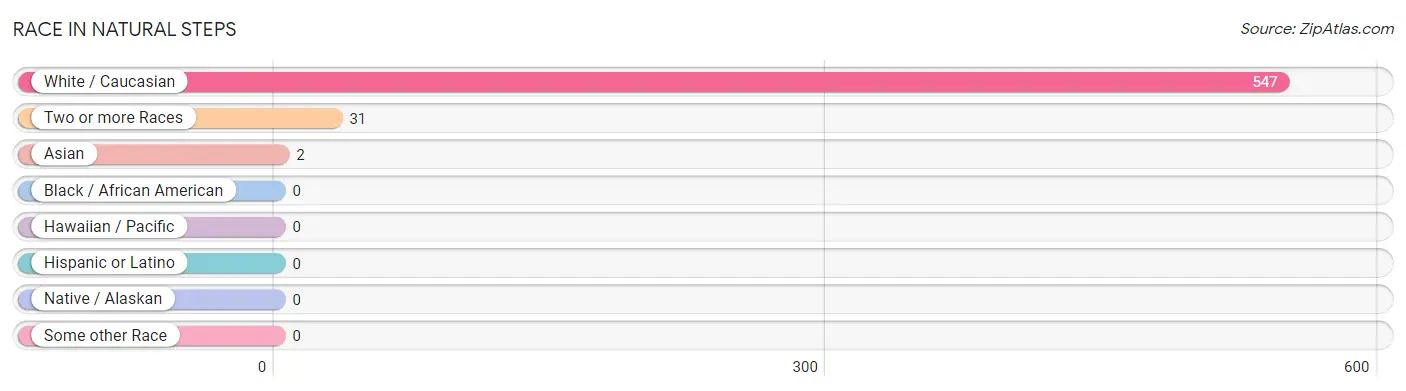
Race in Natural Steps
The most populous races in Natural Steps are White / Caucasian (547 | 94.3%), Two or more Races (31 | 5.3%), and Asian (2 | 0.3%).
| Race | # Population | % Population |
| Asian | 2 | 0.3% |
| Black / African American | 0 | 0.0% |
| Hawaiian / Pacific | 0 | 0.0% |
| Hispanic or Latino | 0 | 0.0% |
| Native / Alaskan | 0 | 0.0% |
| White / Caucasian | 547 | 94.3% |
| Two or more Races | 31 | 5.3% |
| Some other Race | 0 | 0.0% |
| Total | 580 | 100.0% |
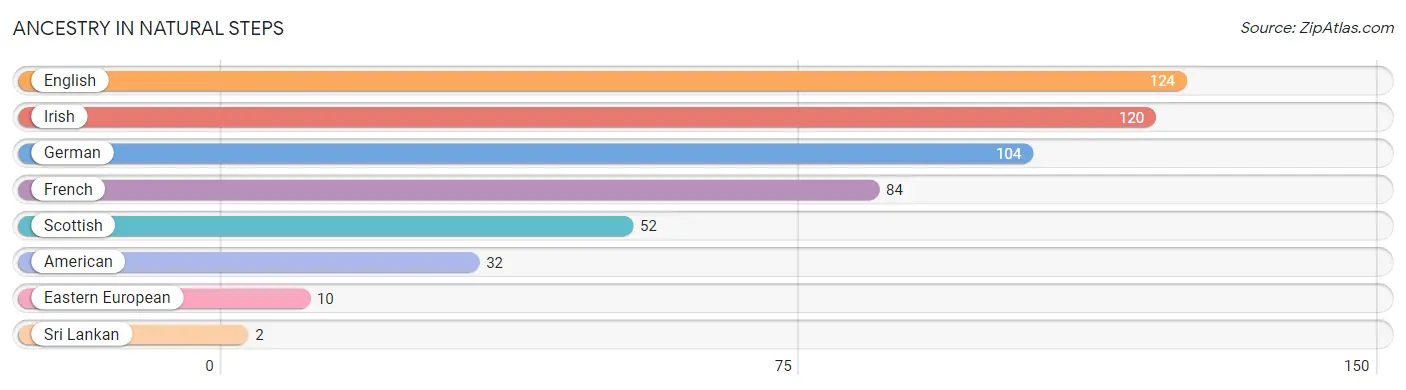
Ancestry in Natural Steps
The most populous ancestries reported in Natural Steps are English (124 | 21.4%), Irish (120 | 20.7%), German (104 | 17.9%), French (84 | 14.5%), and Scottish (52 | 9.0%), together accounting for 83.5% of all Natural Steps residents.
| Ancestry | # Population | % Population |
| American | 32 | 5.5% |
| Eastern European | 10 | 1.7% |
| English | 124 | 21.4% |
| French | 84 | 14.5% |
| German | 104 | 17.9% |
| Irish | 120 | 20.7% |
| Scottish | 52 | 9.0% |
| Sri Lankan | 2 | 0.3% | View All 8 Rows |
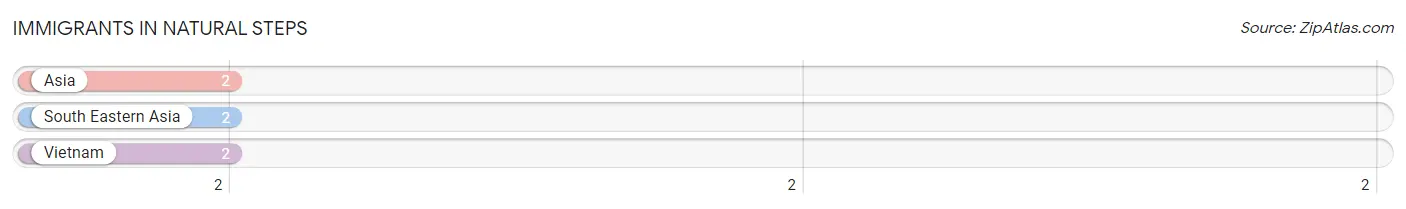
Immigrants in Natural Steps
The most numerous immigrant groups reported in Natural Steps came from Asia (2 | 0.3%), South Eastern Asia (2 | 0.3%), and Vietnam (2 | 0.3%), together accounting for 1.0% of all Natural Steps residents.
| Immigration Origin | # Population | % Population |
| Asia | 2 | 0.3% |
| South Eastern Asia | 2 | 0.3% |
| Vietnam | 2 | 0.3% | View All 3 Rows |
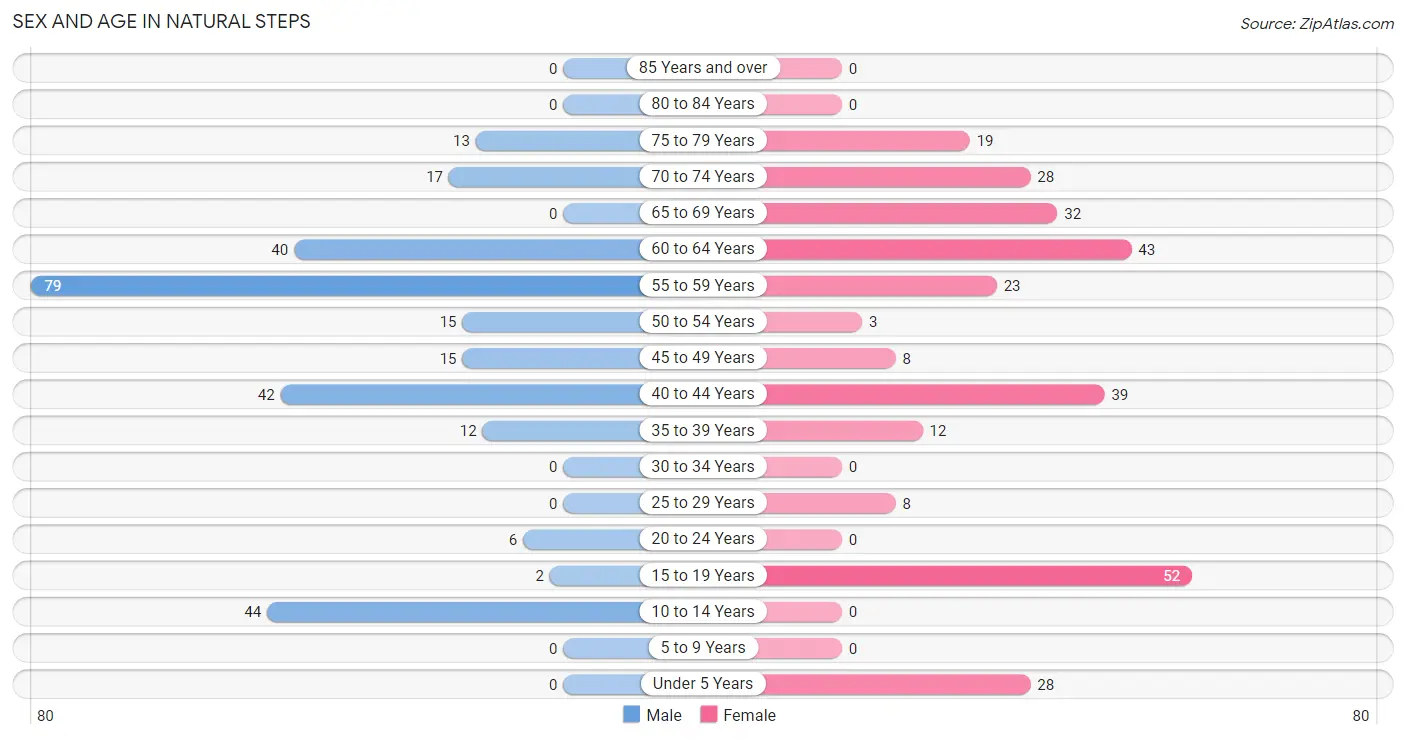
Sex and Age in Natural Steps
Sex and Age in Natural Steps
The most populous age groups in Natural Steps are 55 to 59 Years (79 | 27.7%) for men and 15 to 19 Years (52 | 17.6%) for women.
| Age Bracket | Male | Female |
| Under 5 Years | 0 (0.0%) | 28 (9.5%) |
| 5 to 9 Years | 0 (0.0%) | 0 (0.0%) |
| 10 to 14 Years | 44 (15.4%) | 0 (0.0%) |
| 15 to 19 Years | 2 (0.7%) | 52 (17.6%) |
| 20 to 24 Years | 6 (2.1%) | 0 (0.0%) |
| 25 to 29 Years | 0 (0.0%) | 8 (2.7%) |
| 30 to 34 Years | 0 (0.0%) | 0 (0.0%) |
| 35 to 39 Years | 12 (4.2%) | 12 (4.1%) |
| 40 to 44 Years | 42 (14.7%) | 39 (13.2%) |
| 45 to 49 Years | 15 (5.3%) | 8 (2.7%) |
| 50 to 54 Years | 15 (5.3%) | 3 (1.0%) |
| 55 to 59 Years | 79 (27.7%) | 23 (7.8%) |
| 60 to 64 Years | 40 (14.0%) | 43 (14.6%) |
| 65 to 69 Years | 0 (0.0%) | 32 (10.8%) |
| 70 to 74 Years | 17 (6.0%) | 28 (9.5%) |
| 75 to 79 Years | 13 (4.6%) | 19 (6.4%) |
| 80 to 84 Years | 0 (0.0%) | 0 (0.0%) |
| 85 Years and over | 0 (0.0%) | 0 (0.0%) |
| Total | 285 (100.0%) | 295 (100.0%) |
Families and Households in Natural Steps
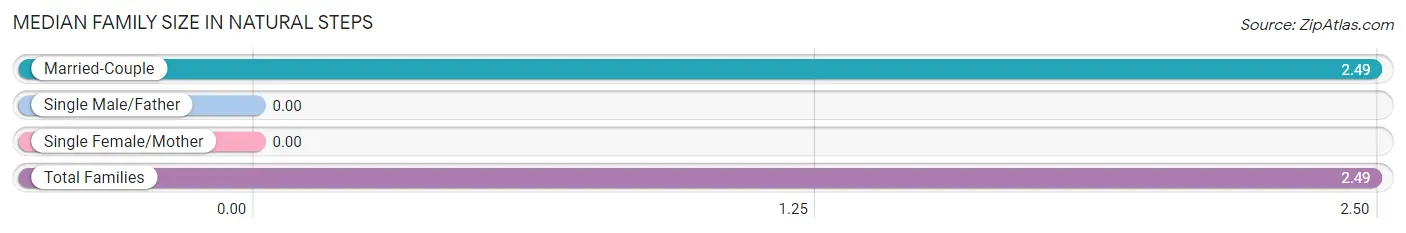
Median Family Size in Natural Steps
| Family Type | # Families | Family Size |
| Married-Couple | 214 (100.0%) | 2.49 |
| Single Male/Father | 0 (0.0%) | - |
| Single Female/Mother | 0 (0.0%) | - |
| Total Families | 214 (100.0%) | 2.49 |
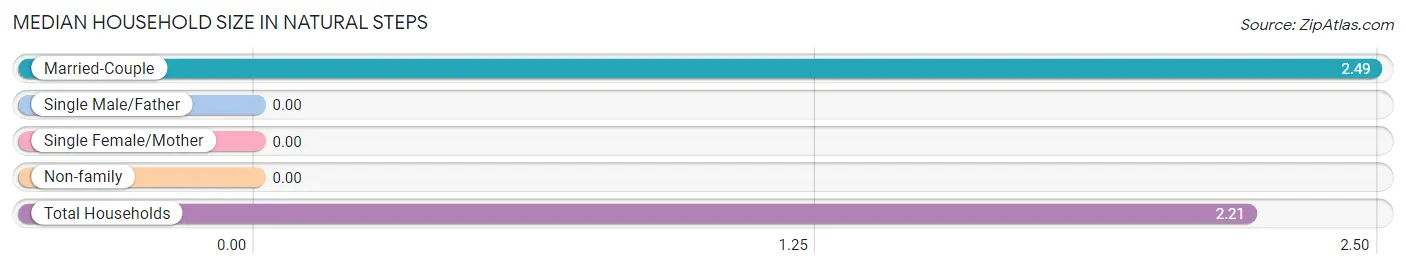
Median Household Size in Natural Steps
| Household Type | # Households | Household Size |
| Married-Couple | 214 (81.7%) | 2.49 |
| Single Male/Father | 0 (0.0%) | - |
| Single Female/Mother | 0 (0.0%) | - |
| Non-family | 48 (18.3%) | - |
| Total Households | 262 (100.0%) | 2.21 |
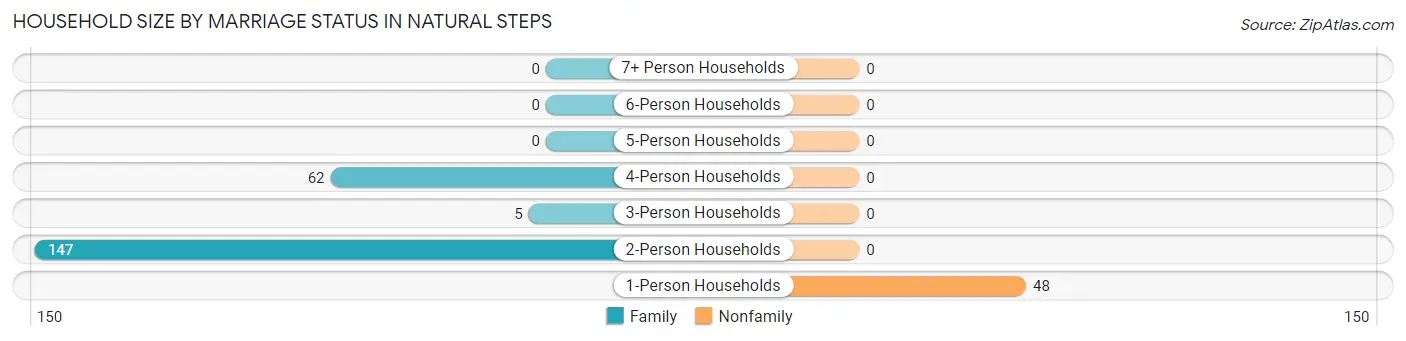
Household Size by Marriage Status in Natural Steps
Out of a total of 262 households in Natural Steps, 214 (81.7%) are family households, while 48 (18.3%) are nonfamily households. The most numerous type of family households are 2-person households, comprising 147, and the most common type of nonfamily households are 1-person households, comprising 48.
| Household Size | Family Households | Nonfamily Households |
| 1-Person Households | - | 48 (18.3%) |
| 2-Person Households | 147 (56.1%) | 0 (0.0%) |
| 3-Person Households | 5 (1.9%) | 0 (0.0%) |
| 4-Person Households | 62 (23.7%) | 0 (0.0%) |
| 5-Person Households | 0 (0.0%) | 0 (0.0%) |
| 6-Person Households | 0 (0.0%) | 0 (0.0%) |
| 7+ Person Households | 0 (0.0%) | 0 (0.0%) |
| Total | 214 (81.7%) | 48 (18.3%) |
Female Fertility in Natural Steps
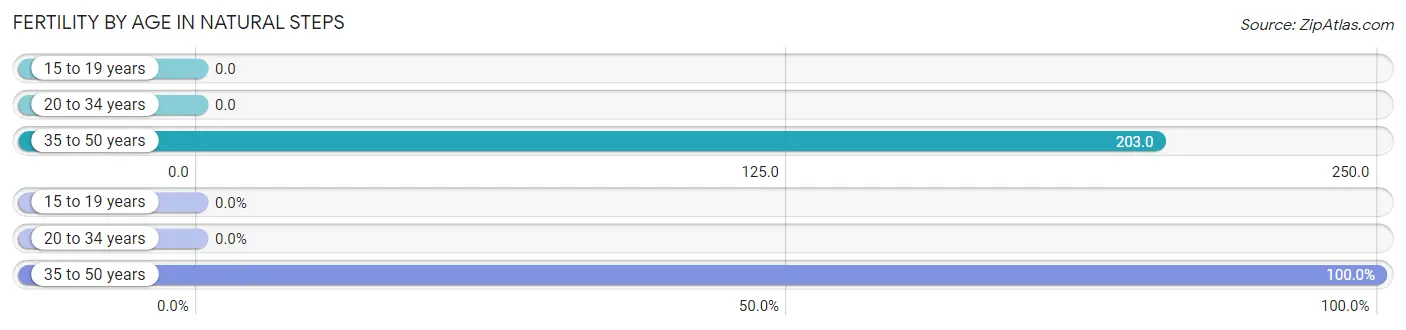
Fertility by Age in Natural Steps
Average fertility rate in Natural Steps is 101.0 births per 1,000 women. Women in the age bracket of 35 to 50 years have the highest fertility rate with 203.0 births per 1,000 women. Women in the age bracket of 35 to 50 years acount for 100.0% of all women with births.
| Age Bracket | Women with Births | Births / 1,000 Women |
| 15 to 19 years | 0 (0.0%) | 0.0 |
| 20 to 34 years | 0 (0.0%) | 0.0 |
| 35 to 50 years | 12 (100.0%) | 203.0 |
| Total | 12 (100.0%) | 101.0 |
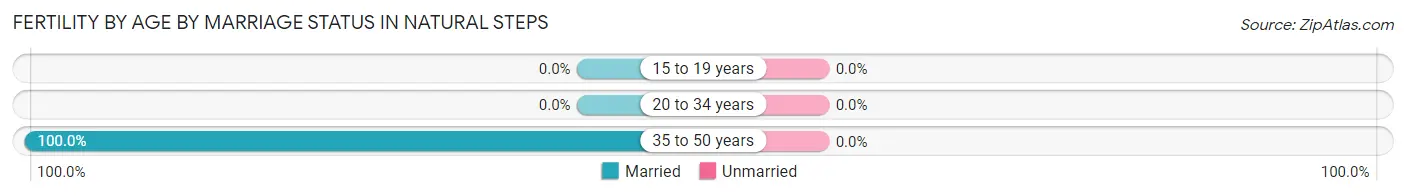
Fertility by Age by Marriage Status in Natural Steps
| Age Bracket | Married | Unmarried |
| 15 to 19 years | 0 (0.0%) | 0 (0.0%) |
| 20 to 34 years | 0 (0.0%) | 0 (0.0%) |
| 35 to 50 years | 12 (100.0%) | 0 (0.0%) |
| Total | 12 (100.0%) | 0 (0.0%) |
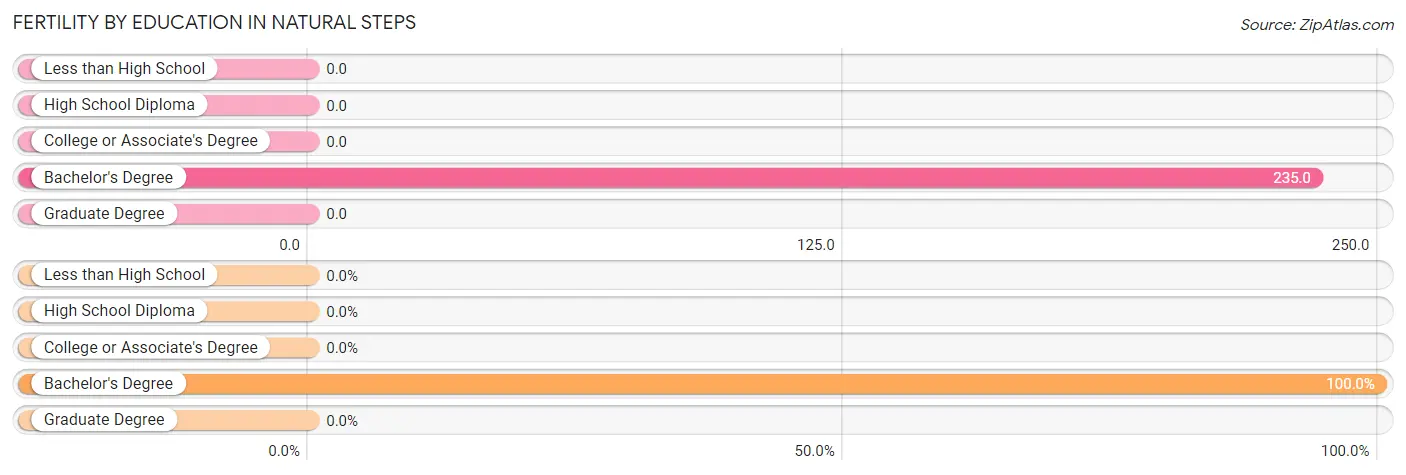
Fertility by Education in Natural Steps
| Educational Attainment | Women with Births | Births / 1,000 Women |
| Less than High School | 0 (0.0%) | 0.0 |
| High School Diploma | 0 (0.0%) | 0.0 |
| College or Associate's Degree | 0 (0.0%) | 0.0 |
| Bachelor's Degree | 12 (100.0%) | 235.0 |
| Graduate Degree | 0 (0.0%) | 0.0 |
| Total | 12 (100.0%) | 101.0 |
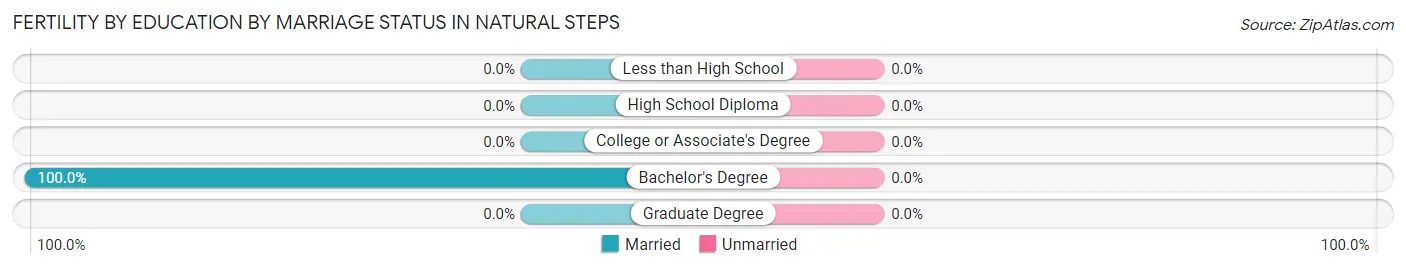
Fertility by Education by Marriage Status in Natural Steps
| Educational Attainment | Married | Unmarried |
| Less than High School | 0 (0.0%) | 0 (0.0%) |
| High School Diploma | 0 (0.0%) | 0 (0.0%) |
| College or Associate's Degree | 0 (0.0%) | 0 (0.0%) |
| Bachelor's Degree | 12 (100.0%) | 0 (0.0%) |
| Graduate Degree | 0 (0.0%) | 0 (0.0%) |
| Total | 12 (100.0%) | 0 (0.0%) |
Income in Natural Steps
Income Overview in Natural Steps
Per Capita Income in Natural Steps is $82,194, while median incomes of families and households are $147,250 and $150,530 respectively.
| Characteristic | Number | Measure |
| Per Capita Income | 580 | $82,194 |
| Median Family Income | 214 | $147,250 |
| Mean Family Income | 214 | $207,009 |
| Median Household Income | 262 | $150,530 |
| Mean Household Income | 262 | $190,958 |
| Income Deficit | 214 | $0 |
| Wage / Income Gap (%) | 580 | 53.88% |
| Wage / Income Gap ($) | 580 | 46.12¢ per $1 |
| Gini / Inequality Index | 580 | 0.47 |
Earnings by Sex in Natural Steps
Average Earnings in Natural Steps are $74,167, $105,500 for men and $48,657 for women, a difference of 53.9%.
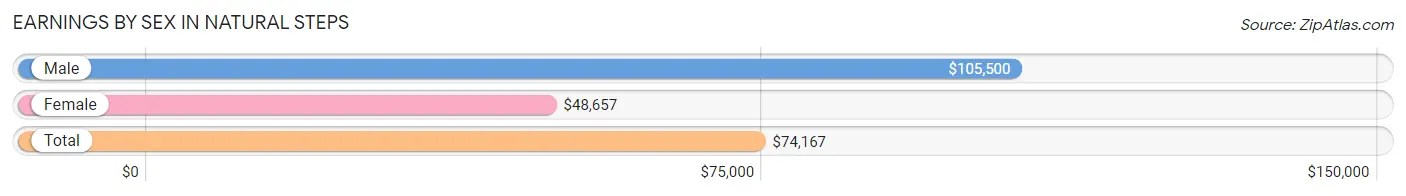
| Sex | Number | Average Earnings |
| Male | 138 (48.6%) | $105,500 |
| Female | 146 (51.4%) | $48,657 |
| Total | 284 (100.0%) | $74,167 |
Earnings by Sex by Income Bracket in Natural Steps
The most common earnings brackets in Natural Steps are $100,000+ for men (71 | 51.4%) and $45,000 to $49,999 for women (54 | 37.0%).
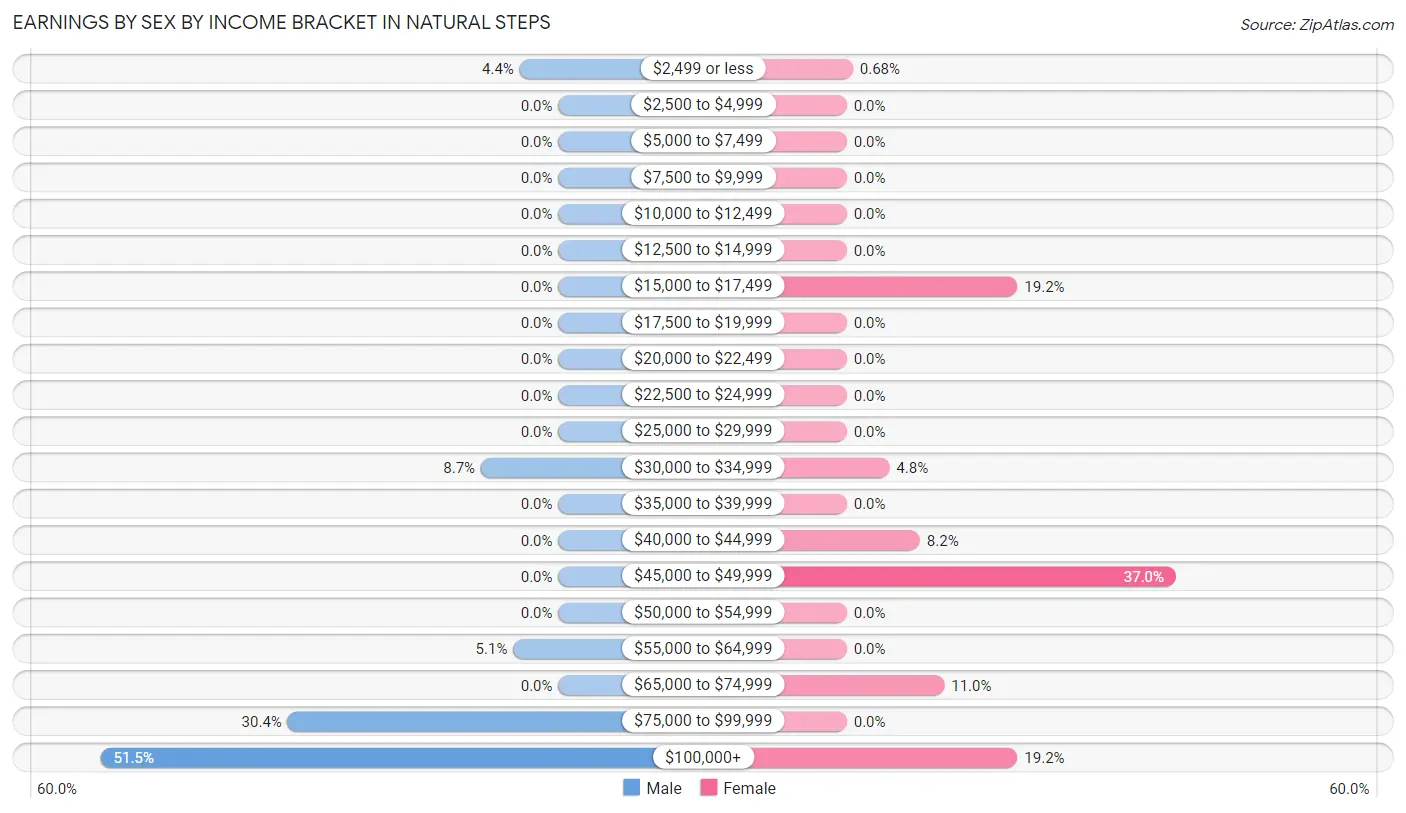
| Income | Male | Female |
| $2,499 or less | 6 (4.3%) | 1 (0.7%) |
| $2,500 to $4,999 | 0 (0.0%) | 0 (0.0%) |
| $5,000 to $7,499 | 0 (0.0%) | 0 (0.0%) |
| $7,500 to $9,999 | 0 (0.0%) | 0 (0.0%) |
| $10,000 to $12,499 | 0 (0.0%) | 0 (0.0%) |
| $12,500 to $14,999 | 0 (0.0%) | 0 (0.0%) |
| $15,000 to $17,499 | 0 (0.0%) | 28 (19.2%) |
| $17,500 to $19,999 | 0 (0.0%) | 0 (0.0%) |
| $20,000 to $22,499 | 0 (0.0%) | 0 (0.0%) |
| $22,500 to $24,999 | 0 (0.0%) | 0 (0.0%) |
| $25,000 to $29,999 | 0 (0.0%) | 0 (0.0%) |
| $30,000 to $34,999 | 12 (8.7%) | 7 (4.8%) |
| $35,000 to $39,999 | 0 (0.0%) | 0 (0.0%) |
| $40,000 to $44,999 | 0 (0.0%) | 12 (8.2%) |
| $45,000 to $49,999 | 0 (0.0%) | 54 (37.0%) |
| $50,000 to $54,999 | 0 (0.0%) | 0 (0.0%) |
| $55,000 to $64,999 | 7 (5.1%) | 0 (0.0%) |
| $65,000 to $74,999 | 0 (0.0%) | 16 (11.0%) |
| $75,000 to $99,999 | 42 (30.4%) | 0 (0.0%) |
| $100,000+ | 71 (51.4%) | 28 (19.2%) |
| Total | 138 (100.0%) | 146 (100.0%) |
Earnings by Sex by Educational Attainment in Natural Steps
| Educational Attainment | Male Income | Female Income |
| Less than High School | - | - |
| High School Diploma | - | - |
| College or Associate's Degree | - | - |
| Bachelor's Degree | - | - |
| Graduate Degree | - | - |
| Total | $106,250 | $48,657 |
Family Income in Natural Steps
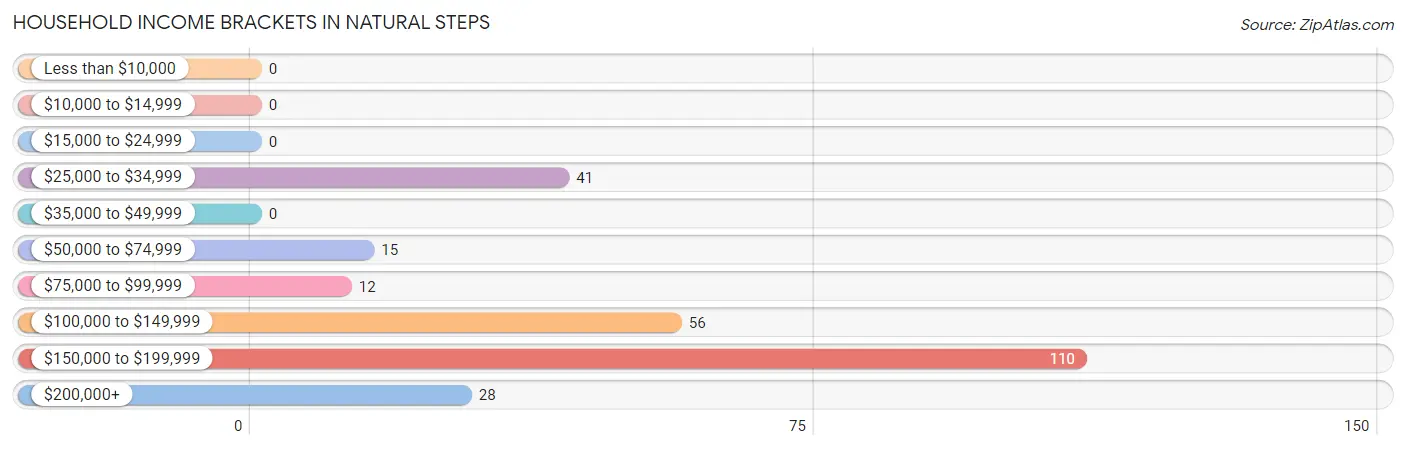
Family Income Brackets in Natural Steps
According to the Natural Steps family income data, there are 77 families falling into the $150,000 to $199,999 income range, which is the most common income bracket and makes up 36.0% of all families.
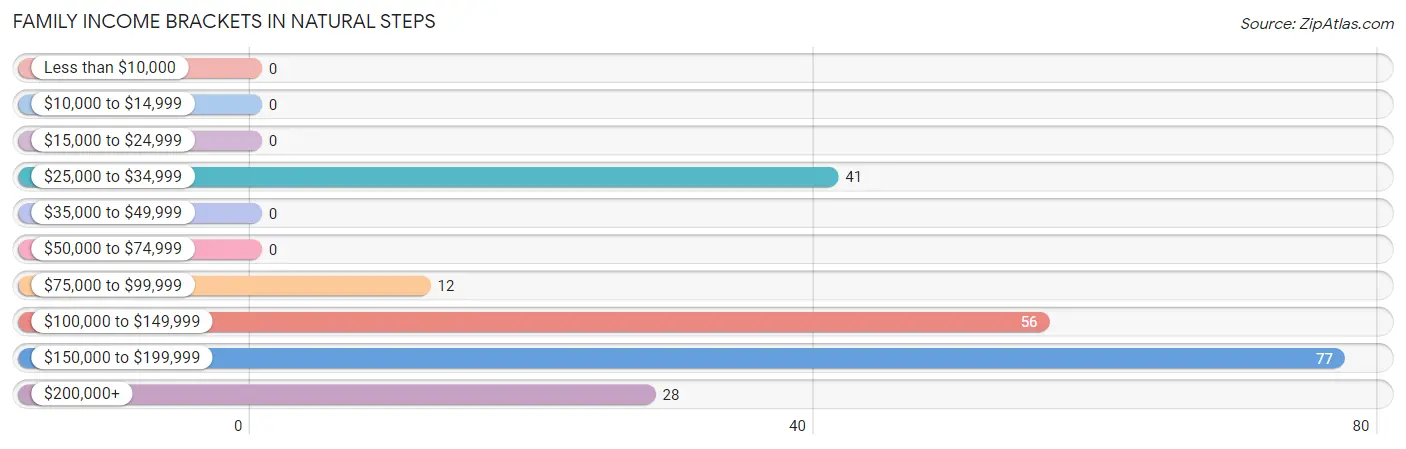
| Income Bracket | # Families | % Families |
| Less than $10,000 | 0 | 0.0% |
| $10,000 to $14,999 | 0 | 0.0% |
| $15,000 to $24,999 | 0 | 0.0% |
| $25,000 to $34,999 | 41 | 19.2% |
| $35,000 to $49,999 | 0 | 0.0% |
| $50,000 to $74,999 | 0 | 0.0% |
| $75,000 to $99,999 | 12 | 5.6% |
| $100,000 to $149,999 | 56 | 26.2% |
| $150,000 to $199,999 | 77 | 36.0% |
| $200,000+ | 28 | 13.1% |
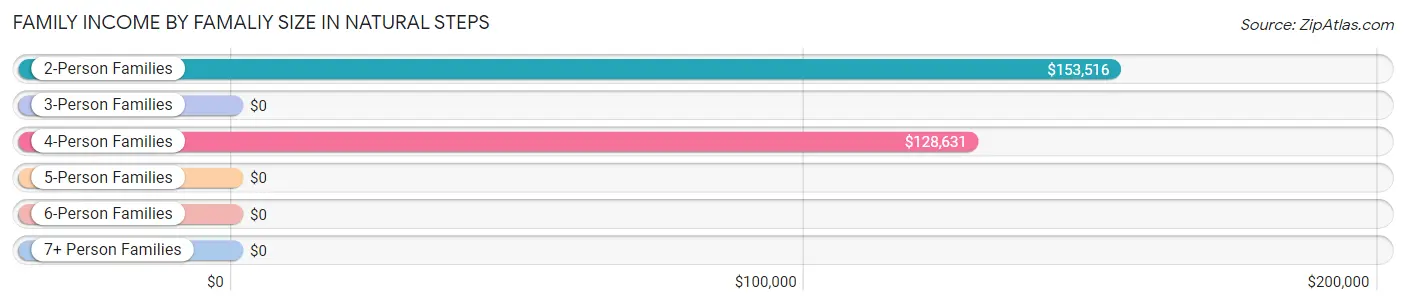
Family Income by Famaliy Size in Natural Steps
2-person families (147 | 68.7%) account for the highest median family income in Natural Steps with $153,516 per family, while 2-person families (147 | 68.7%) have the highest median income of $76,758 per family member.
| Income Bracket | # Families | Median Income |
| 2-Person Families | 147 (68.7%) | $153,516 |
| 3-Person Families | 5 (2.3%) | $0 |
| 4-Person Families | 62 (29.0%) | $128,631 |
| 5-Person Families | 0 (0.0%) | $0 |
| 6-Person Families | 0 (0.0%) | $0 |
| 7+ Person Families | 0 (0.0%) | $0 |
| Total | 214 (100.0%) | $147,250 |
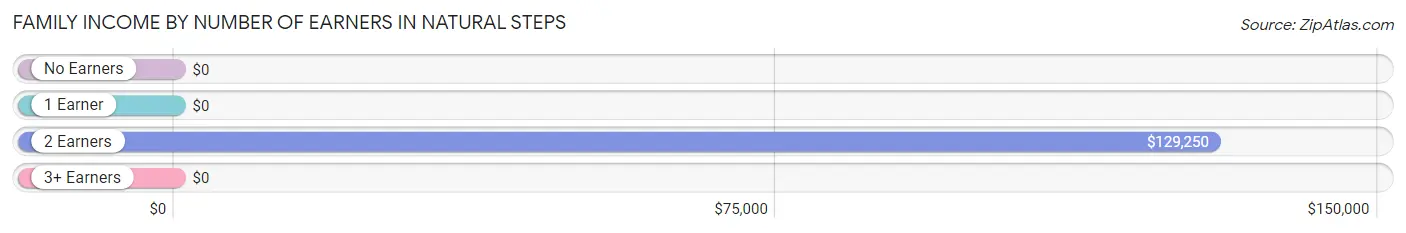
Family Income by Number of Earners in Natural Steps
| Number of Earners | # Families | Median Income |
| No Earners | 30 (14.0%) | $0 |
| 1 Earner | 97 (45.3%) | $0 |
| 2 Earners | 87 (40.6%) | $129,250 |
| 3+ Earners | 0 (0.0%) | $0 |
| Total | 214 (100.0%) | $147,250 |
Household Income in Natural Steps
Household Income Brackets in Natural Steps
With 110 households falling in the category, the $150,000 to $199,999 income range is the most frequent in Natural Steps, accounting for 42.0% of all households.
| Income Bracket | # Households | % Households |
| Less than $10,000 | 0 | 0.0% |
| $10,000 to $14,999 | 0 | 0.0% |
| $15,000 to $24,999 | 0 | 0.0% |
| $25,000 to $34,999 | 41 | 15.6% |
| $35,000 to $49,999 | 0 | 0.0% |
| $50,000 to $74,999 | 15 | 5.7% |
| $75,000 to $99,999 | 12 | 4.6% |
| $100,000 to $149,999 | 56 | 21.4% |
| $150,000 to $199,999 | 110 | 42.0% |
| $200,000+ | 28 | 10.7% |
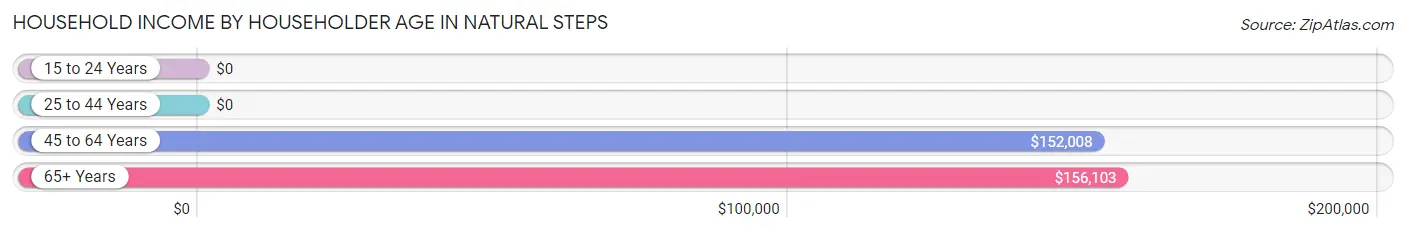
Household Income by Householder Age in Natural Steps
The median household income in Natural Steps is $150,530, with the highest median household income of $156,103 found in the 65+ years age bracket for the primary householder. A total of 45 households (17.2%) fall into this category.
| Income Bracket | # Households | Median Income |
| 15 to 24 Years | 0 (0.0%) | $0 |
| 25 to 44 Years | 54 (20.6%) | $0 |
| 45 to 64 Years | 163 (62.2%) | $152,008 |
| 65+ Years | 45 (17.2%) | $156,103 |
| Total | 262 (100.0%) | $150,530 |
Poverty in Natural Steps
Income Below Poverty by Sex and Age in Natural Steps
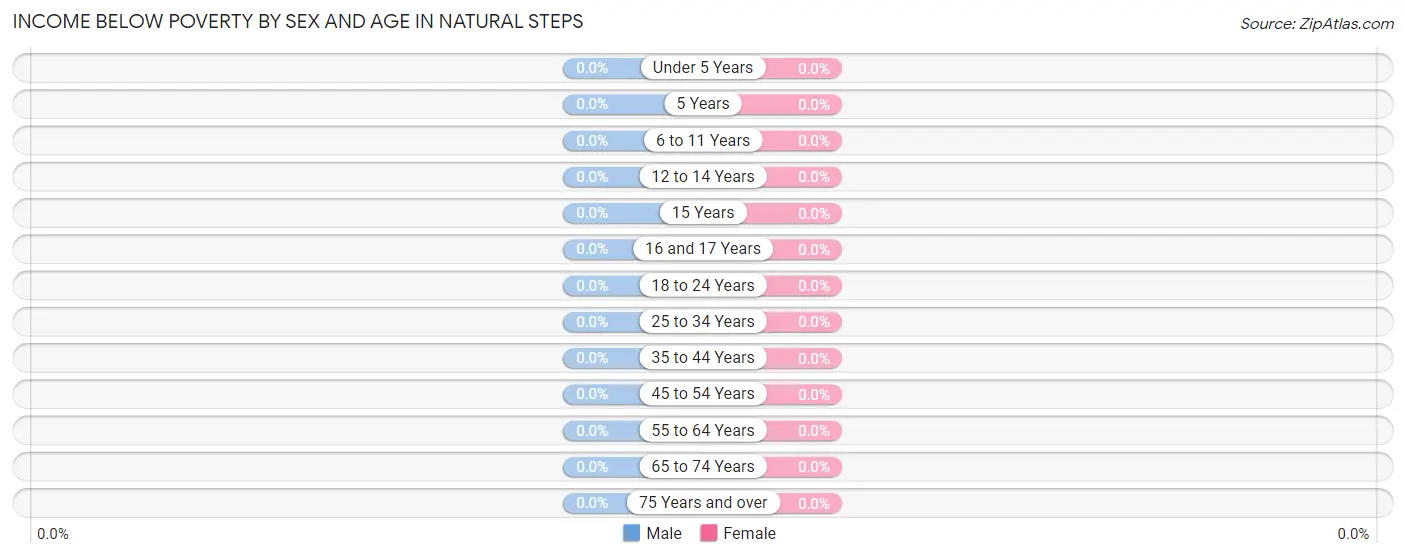
| Age Bracket | Male | Female |
| Under 5 Years | 0 (0.0%) | 0 (0.0%) |
| 5 Years | 0 (0.0%) | 0 (0.0%) |
| 6 to 11 Years | 0 (0.0%) | 0 (0.0%) |
| 12 to 14 Years | 0 (0.0%) | 0 (0.0%) |
| 15 Years | 0 (0.0%) | 0 (0.0%) |
| 16 and 17 Years | 0 (0.0%) | 0 (0.0%) |
| 18 to 24 Years | 0 (0.0%) | 0 (0.0%) |
| 25 to 34 Years | 0 (0.0%) | 0 (0.0%) |
| 35 to 44 Years | 0 (0.0%) | 0 (0.0%) |
| 45 to 54 Years | 0 (0.0%) | 0 (0.0%) |
| 55 to 64 Years | 0 (0.0%) | 0 (0.0%) |
| 65 to 74 Years | 0 (0.0%) | 0 (0.0%) |
| 75 Years and over | 0 (0.0%) | 0 (0.0%) |
| Total | 0 (0.0%) | 0 (0.0%) |
Income Above Poverty by Sex and Age in Natural Steps
According to the poverty statistics in Natural Steps, males aged 6 to 11 years and females aged under 5 years are the age groups that are most secure financially, with 100.0% of males and 100.0% of females in these age groups living above the poverty line.
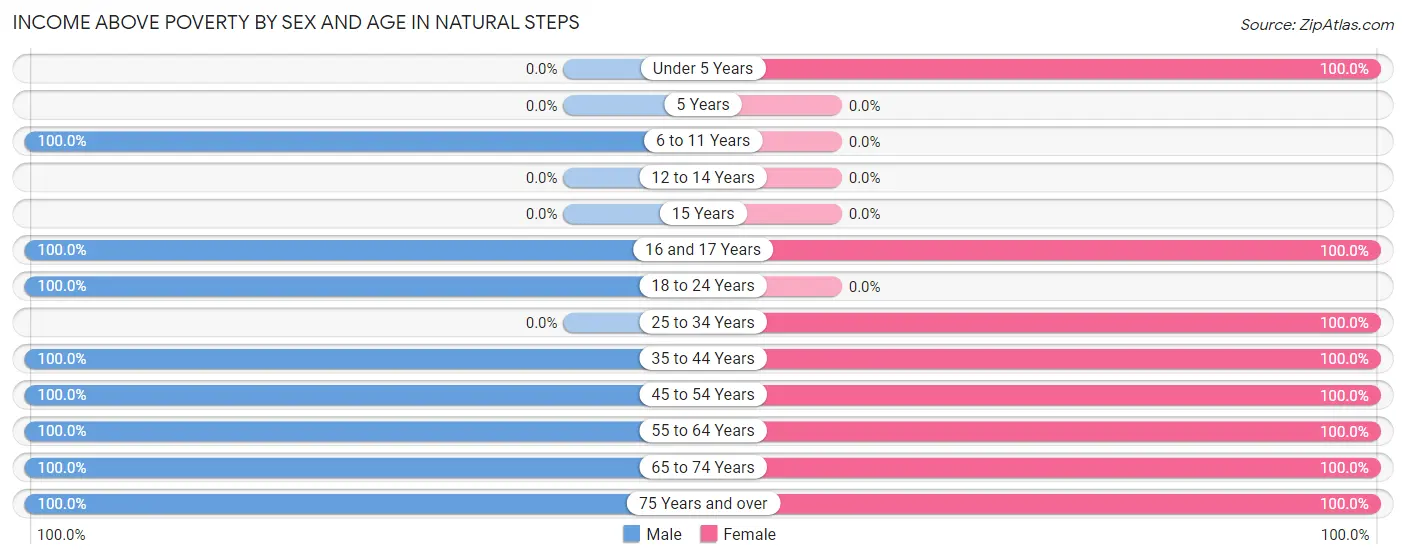
| Age Bracket | Male | Female |
| Under 5 Years | 0 (0.0%) | 28 (100.0%) |
| 5 Years | 0 (0.0%) | 0 (0.0%) |
| 6 to 11 Years | 44 (100.0%) | 0 (0.0%) |
| 12 to 14 Years | 0 (0.0%) | 0 (0.0%) |
| 15 Years | 0 (0.0%) | 0 (0.0%) |
| 16 and 17 Years | 2 (100.0%) | 52 (100.0%) |
| 18 to 24 Years | 6 (100.0%) | 0 (0.0%) |
| 25 to 34 Years | 0 (0.0%) | 8 (100.0%) |
| 35 to 44 Years | 54 (100.0%) | 51 (100.0%) |
| 45 to 54 Years | 30 (100.0%) | 11 (100.0%) |
| 55 to 64 Years | 119 (100.0%) | 66 (100.0%) |
| 65 to 74 Years | 17 (100.0%) | 60 (100.0%) |
| 75 Years and over | 13 (100.0%) | 19 (100.0%) |
| Total | 285 (100.0%) | 295 (100.0%) |
Income Below Poverty Among Married-Couple Families in Natural Steps
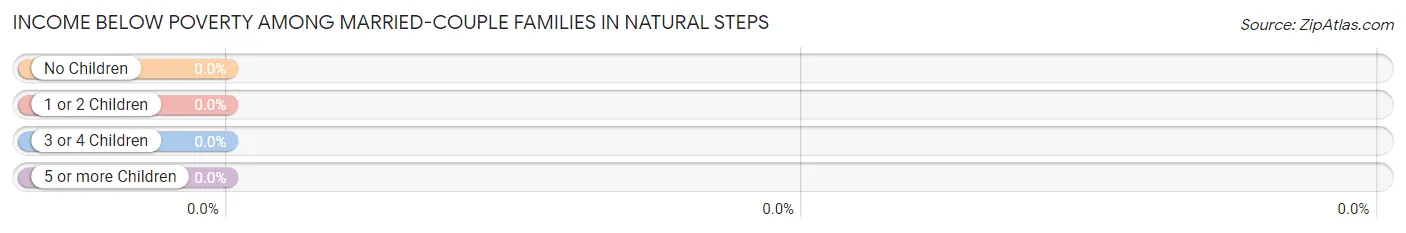
| Children | Above Poverty | Below Poverty |
| No Children | 151 (100.0%) | 0 (0.0%) |
| 1 or 2 Children | 63 (100.0%) | 0 (0.0%) |
| 3 or 4 Children | 0 (0.0%) | 0 (0.0%) |
| 5 or more Children | 0 (0.0%) | 0 (0.0%) |
| Total | 214 (100.0%) | 0 (0.0%) |
Income Below Poverty Among Single-Parent Households in Natural Steps
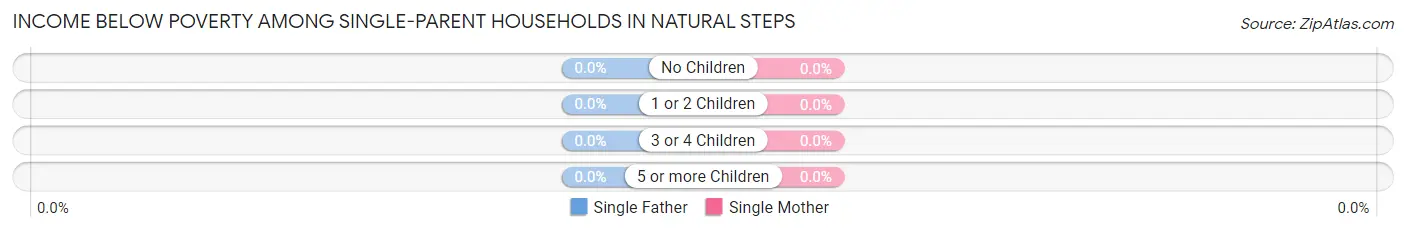
| Children | Single Father | Single Mother |
| No Children | 0 (0.0%) | 0 (0.0%) |
| 1 or 2 Children | 0 (0.0%) | 0 (0.0%) |
| 3 or 4 Children | 0 (0.0%) | 0 (0.0%) |
| 5 or more Children | 0 (0.0%) | 0 (0.0%) |
| Total | 0 (0.0%) | 0 (0.0%) |
Income Below Poverty Among Married-Couple vs Single-Parent Households in Natural Steps
| Children | Married-Couple Families | Single-Parent Households |
| No Children | 0 (0.0%) | 0 (0.0%) |
| 1 or 2 Children | 0 (0.0%) | 0 (0.0%) |
| 3 or 4 Children | 0 (0.0%) | 0 (0.0%) |
| 5 or more Children | 0 (0.0%) | 0 (0.0%) |
| Total | 0 (0.0%) | 0 (0.0%) |
Employment Characteristics in Natural Steps
Employment by Class of Employer in Natural Steps
Among the 273 employed individuals in Natural Steps, private company employees (168 | 61.5%), self-employed (not incorporated) (41 | 15.0%), and local government employees (39 | 14.3%) make up the most common classes of employment.
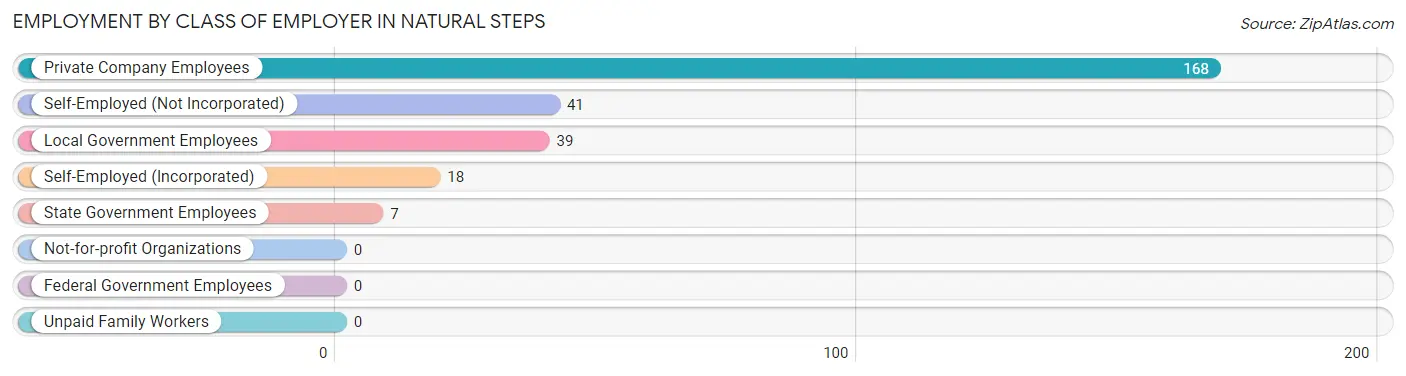
| Employer Class | # Employees | % Employees |
| Private Company Employees | 168 | 61.5% |
| Self-Employed (Incorporated) | 18 | 6.6% |
| Self-Employed (Not Incorporated) | 41 | 15.0% |
| Not-for-profit Organizations | 0 | 0.0% |
| Local Government Employees | 39 | 14.3% |
| State Government Employees | 7 | 2.6% |
| Federal Government Employees | 0 | 0.0% |
| Unpaid Family Workers | 0 | 0.0% |
| Total | 273 | 100.0% |
Employment Status by Age in Natural Steps
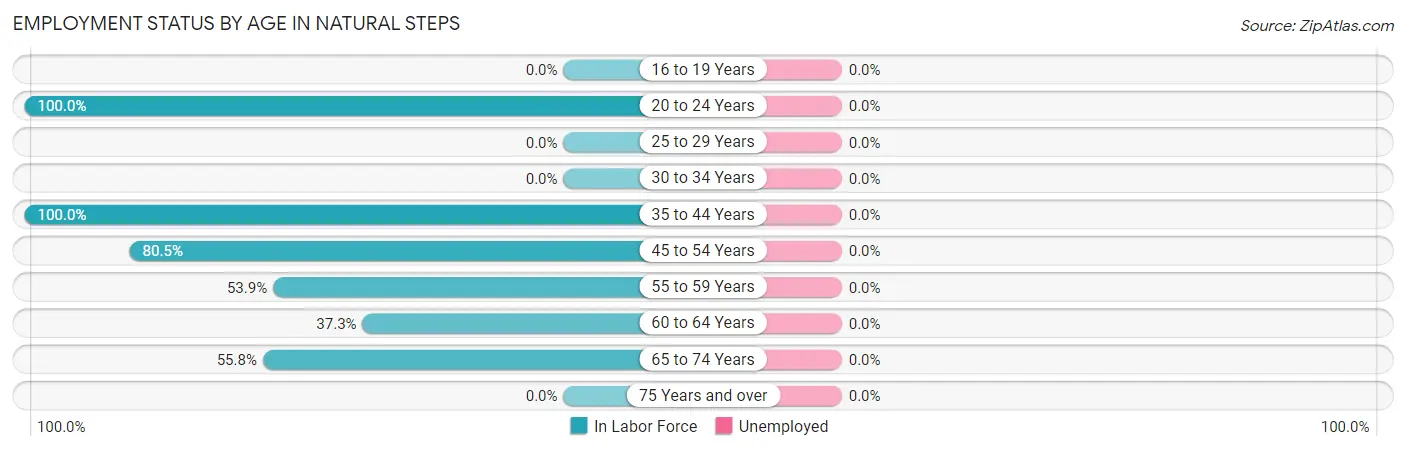
| Age Bracket | In Labor Force | Unemployed |
| 16 to 19 Years | 0 (0.0%) | 0 (0.0%) |
| 20 to 24 Years | 6 (100.0%) | 0 (0.0%) |
| 25 to 29 Years | 0 (0.0%) | 0 (0.0%) |
| 30 to 34 Years | 0 (0.0%) | 0 (0.0%) |
| 35 to 44 Years | 105 (100.0%) | 0 (0.0%) |
| 45 to 54 Years | 33 (80.5%) | 0 (0.0%) |
| 55 to 59 Years | 55 (53.9%) | 0 (0.0%) |
| 60 to 64 Years | 31 (37.3%) | 0 (0.0%) |
| 65 to 74 Years | 43 (55.8%) | 0 (0.0%) |
| 75 Years and over | 0 (0.0%) | 0 (0.0%) |
| Total | 273 (53.7%) | 0 (0.0%) |
Employment Status by Educational Attainment in Natural Steps
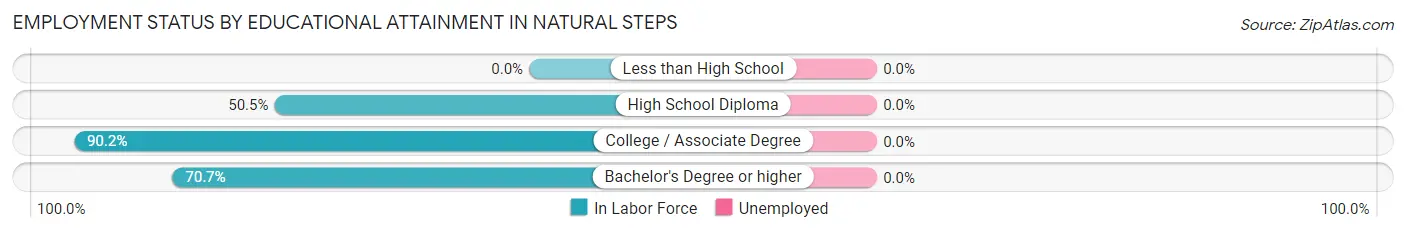
| Educational Attainment | In Labor Force | Unemployed |
| Less than High School | 0 (0.0%) | 0 (0.0%) |
| High School Diploma | 50 (50.5%) | 0 (0.0%) |
| College / Associate Degree | 46 (90.2%) | 0 (0.0%) |
| Bachelor's Degree or higher | 128 (70.7%) | 0 (0.0%) |
| Total | 224 (66.1%) | 0 (0.0%) |
Employment Occupations by Sex in Natural Steps
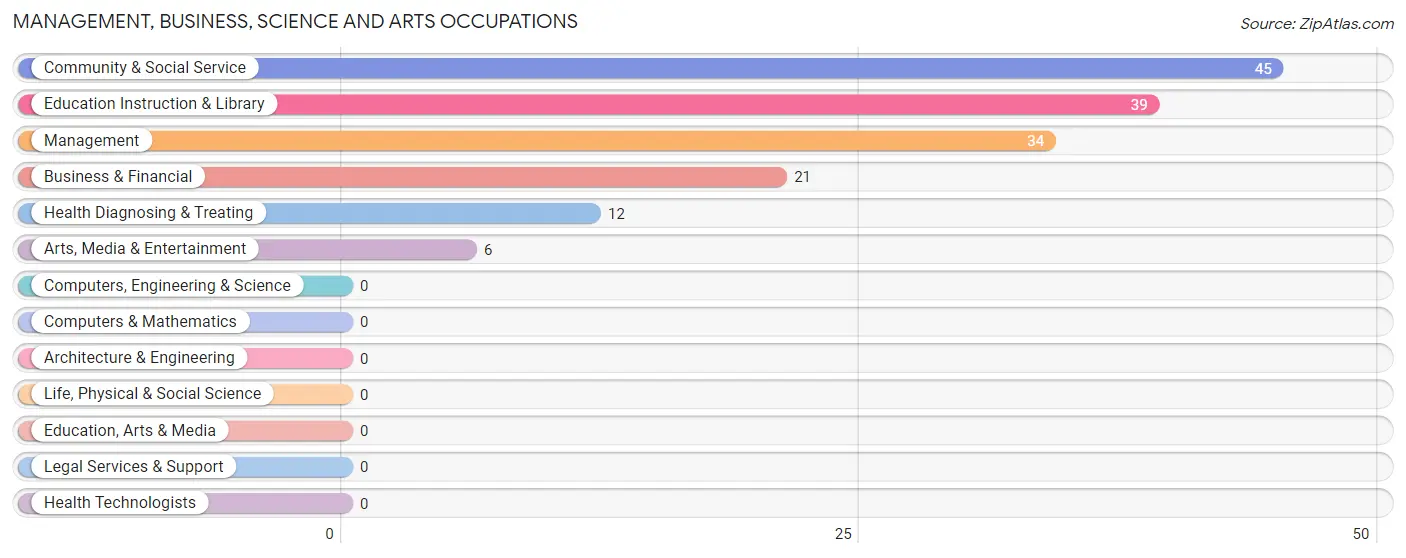
Management, Business, Science and Arts Occupations
The most common Management, Business, Science and Arts occupations in Natural Steps are Community & Social Service (45 | 16.5%), Education Instruction & Library (39 | 14.3%), Management (34 | 12.4%), Business & Financial (21 | 7.7%), and Health Diagnosing & Treating (12 | 4.4%).
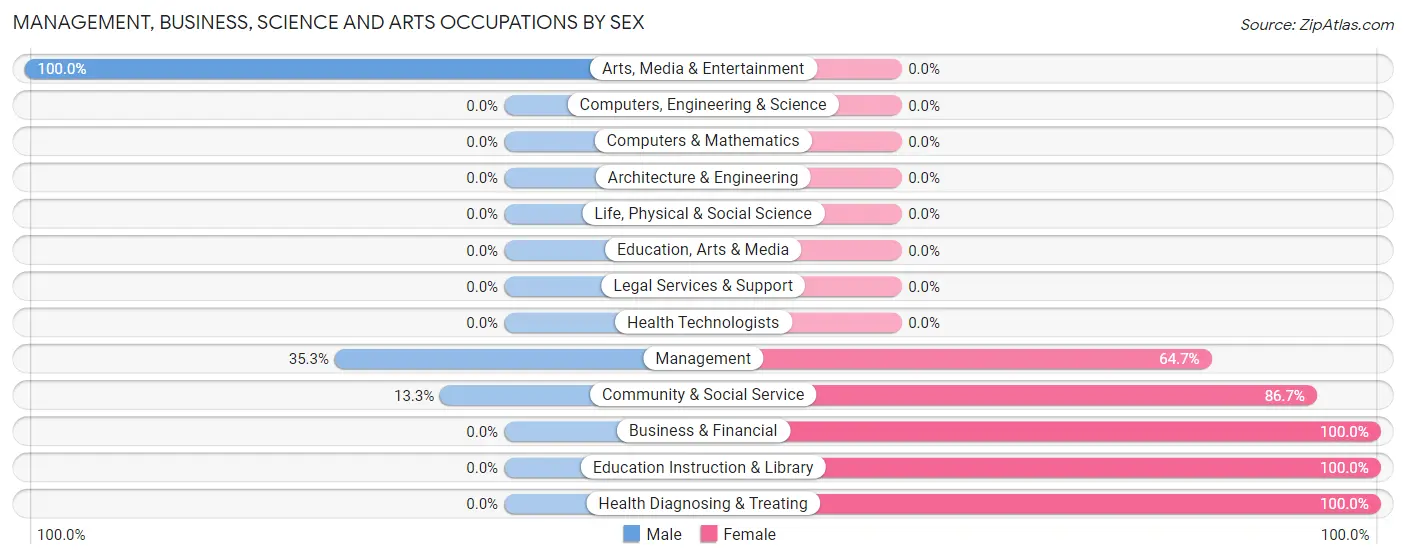
Management, Business, Science and Arts Occupations by Sex
Within the Management, Business, Science and Arts occupations in Natural Steps, the most male-oriented occupations are Arts, Media & Entertainment (100.0%), Management (35.3%), and Community & Social Service (13.3%), while the most female-oriented occupations are Business & Financial (100.0%), Education Instruction & Library (100.0%), and Health Diagnosing & Treating (100.0%).
| Occupation | Male | Female |
| Management | 12 (35.3%) | 22 (64.7%) |
| Business & Financial | 0 (0.0%) | 21 (100.0%) |
| Computers, Engineering & Science | 0 (0.0%) | 0 (0.0%) |
| Computers & Mathematics | 0 (0.0%) | 0 (0.0%) |
| Architecture & Engineering | 0 (0.0%) | 0 (0.0%) |
| Life, Physical & Social Science | 0 (0.0%) | 0 (0.0%) |
| Community & Social Service | 6 (13.3%) | 39 (86.7%) |
| Education, Arts & Media | 0 (0.0%) | 0 (0.0%) |
| Legal Services & Support | 0 (0.0%) | 0 (0.0%) |
| Education Instruction & Library | 0 (0.0%) | 39 (100.0%) |
| Arts, Media & Entertainment | 6 (100.0%) | 0 (0.0%) |
| Health Diagnosing & Treating | 0 (0.0%) | 12 (100.0%) |
| Health Technologists | 0 (0.0%) | 0 (0.0%) |
| Total (Category) | 18 (16.1%) | 94 (83.9%) |
| Total (Overall) | 128 (46.9%) | 145 (53.1%) |
Services Occupations
Services Occupations by Sex
| Occupation | Male | Female |
| Healthcare Support | 0 (0.0%) | 0 (0.0%) |
| Security & Protection | 0 (0.0%) | 0 (0.0%) |
| Firefighting & Prevention | 0 (0.0%) | 0 (0.0%) |
| Law Enforcement | 0 (0.0%) | 0 (0.0%) |
| Food Preparation & Serving | 0 (0.0%) | 0 (0.0%) |
| Cleaning & Maintenance | 0 (0.0%) | 0 (0.0%) |
| Personal Care & Service | 0 (0.0%) | 0 (0.0%) |
| Total (Category) | 0 (0.0%) | 0 (0.0%) |
| Total (Overall) | 128 (46.9%) | 145 (53.1%) |
Sales and Office Occupations
The most common Sales and Office occupations in Natural Steps are Sales & Related (98 | 35.9%), and Office & Administration (15 | 5.5%).
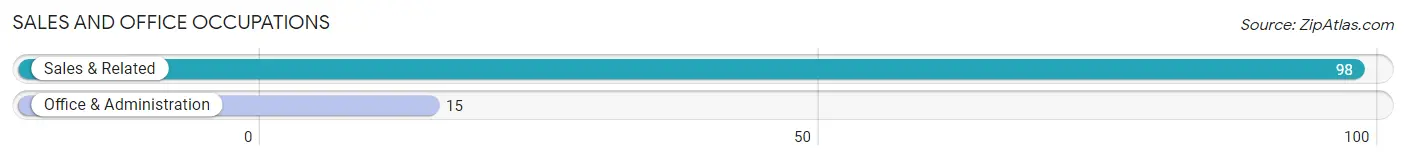
Sales and Office Occupations by Sex

| Occupation | Male | Female |
| Sales & Related | 75 (76.5%) | 23 (23.5%) |
| Office & Administration | 15 (100.0%) | 0 (0.0%) |
| Total (Category) | 90 (79.6%) | 23 (20.3%) |
| Total (Overall) | 128 (46.9%) | 145 (53.1%) |
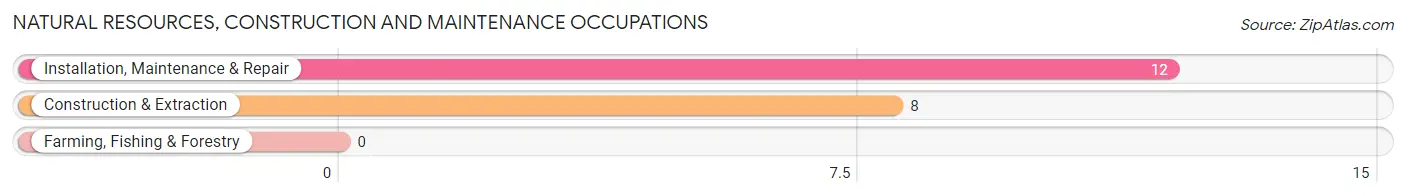
Natural Resources, Construction and Maintenance Occupations
The most common Natural Resources, Construction and Maintenance occupations in Natural Steps are Installation, Maintenance & Repair (12 | 4.4%), and Construction & Extraction (8 | 2.9%).
Natural Resources, Construction and Maintenance Occupations by Sex
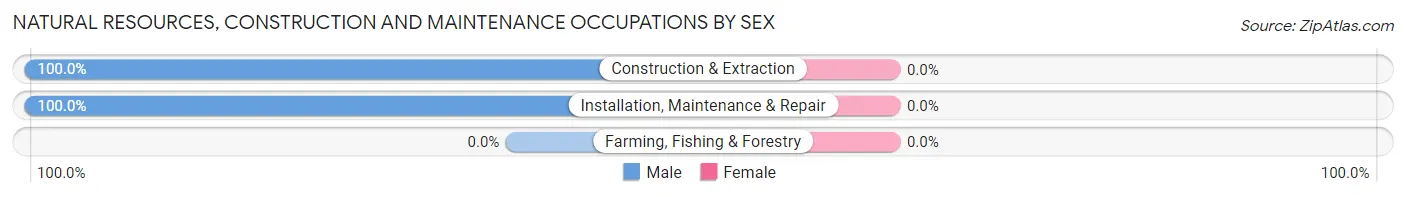
| Occupation | Male | Female |
| Farming, Fishing & Forestry | 0 (0.0%) | 0 (0.0%) |
| Construction & Extraction | 8 (100.0%) | 0 (0.0%) |
| Installation, Maintenance & Repair | 12 (100.0%) | 0 (0.0%) |
| Total (Category) | 20 (100.0%) | 0 (0.0%) |
| Total (Overall) | 128 (46.9%) | 145 (53.1%) |
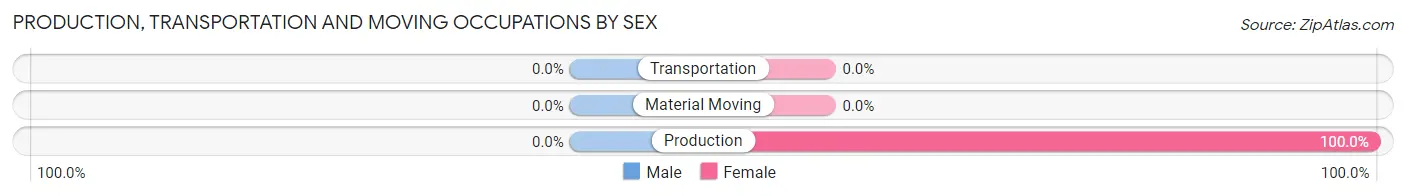
Production, Transportation and Moving Occupations
The most common Production, Transportation and Moving occupations in Natural Steps are , and Production (28 | 10.3%).
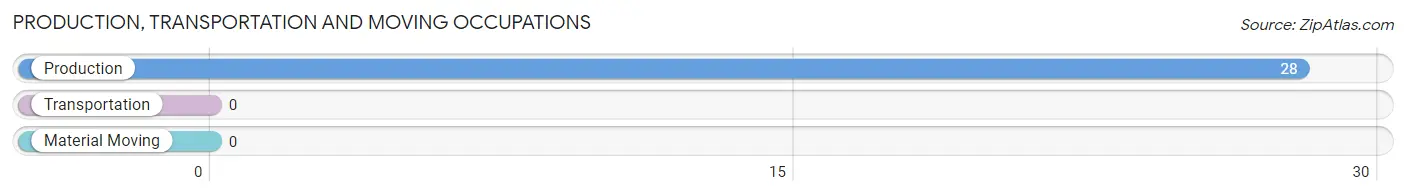
Production, Transportation and Moving Occupations by Sex
| Occupation | Male | Female |
| Production | 0 (0.0%) | 28 (100.0%) |
| Transportation | 0 (0.0%) | 0 (0.0%) |
| Material Moving | 0 (0.0%) | 0 (0.0%) |
| Total (Category) | 0 (0.0%) | 28 (100.0%) |
| Total (Overall) | 128 (46.9%) | 145 (53.1%) |
Employment Industries by Sex in Natural Steps
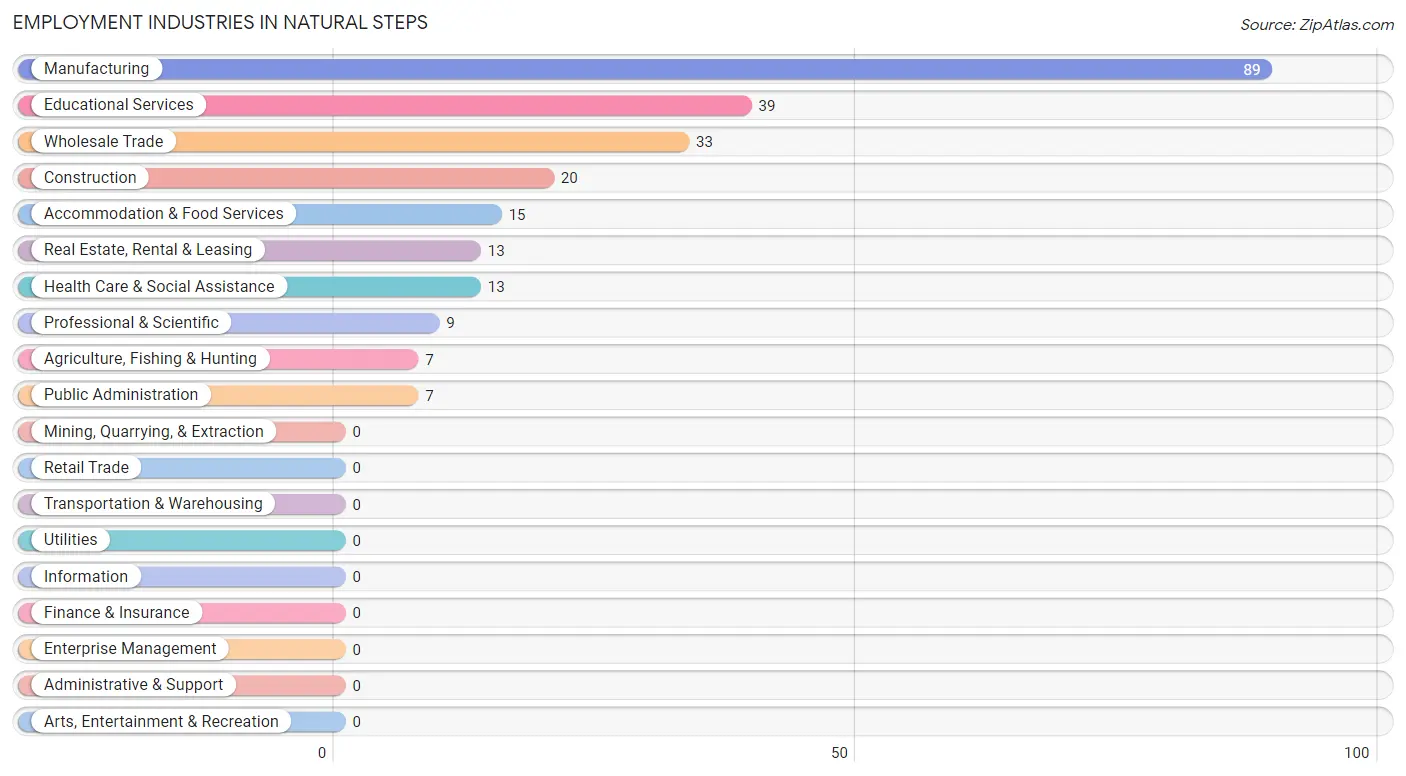
Employment Industries in Natural Steps
The major employment industries in Natural Steps include Manufacturing (89 | 32.6%), Educational Services (39 | 14.3%), Wholesale Trade (33 | 12.1%), Construction (20 | 7.3%), and Accommodation & Food Services (15 | 5.5%).
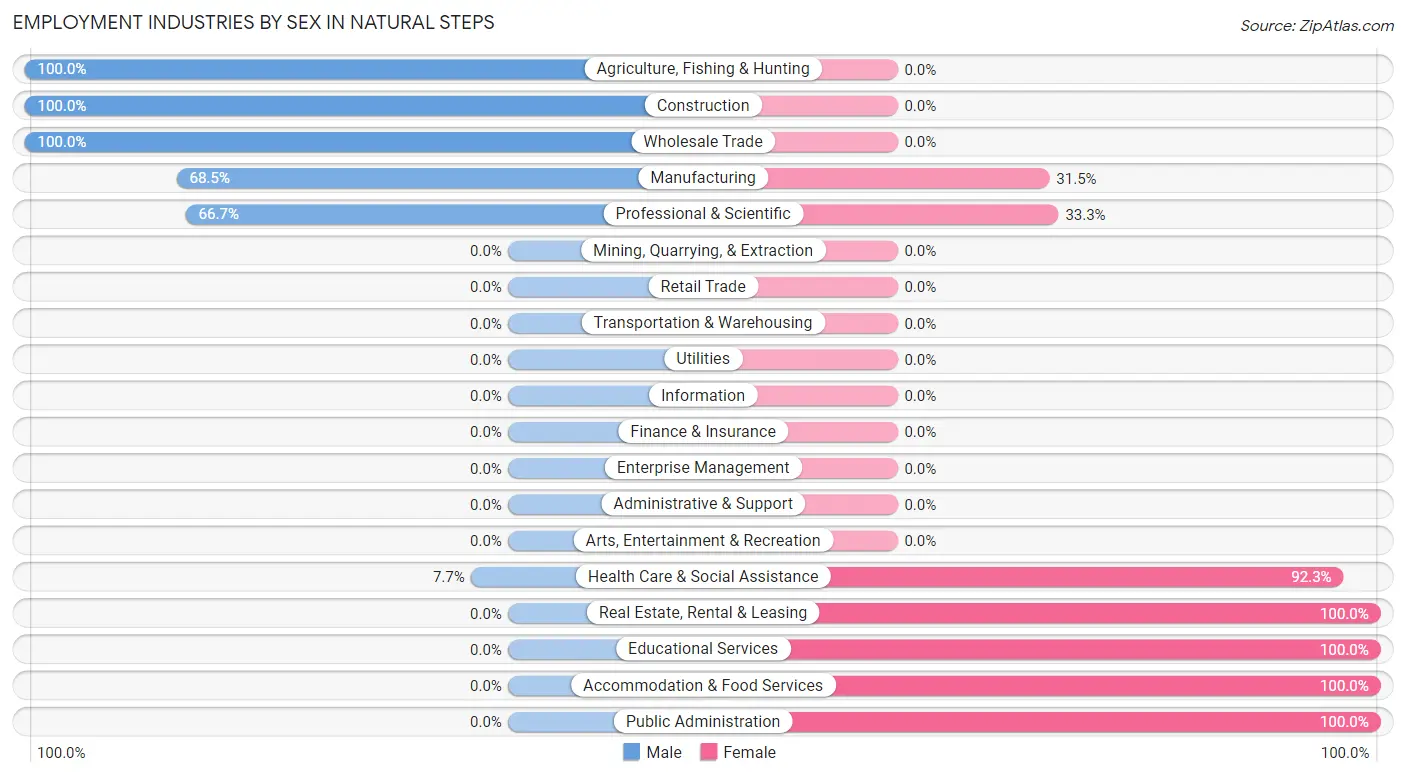
Employment Industries by Sex in Natural Steps
The Natural Steps industries that see more men than women are Agriculture, Fishing & Hunting (100.0%), Construction (100.0%), and Wholesale Trade (100.0%), whereas the industries that tend to have a higher number of women are Real Estate, Rental & Leasing (100.0%), Educational Services (100.0%), and Accommodation & Food Services (100.0%).
| Industry | Male | Female |
| Agriculture, Fishing & Hunting | 7 (100.0%) | 0 (0.0%) |
| Mining, Quarrying, & Extraction | 0 (0.0%) | 0 (0.0%) |
| Construction | 20 (100.0%) | 0 (0.0%) |
| Manufacturing | 61 (68.5%) | 28 (31.5%) |
| Wholesale Trade | 33 (100.0%) | 0 (0.0%) |
| Retail Trade | 0 (0.0%) | 0 (0.0%) |
| Transportation & Warehousing | 0 (0.0%) | 0 (0.0%) |
| Utilities | 0 (0.0%) | 0 (0.0%) |
| Information | 0 (0.0%) | 0 (0.0%) |
| Finance & Insurance | 0 (0.0%) | 0 (0.0%) |
| Real Estate, Rental & Leasing | 0 (0.0%) | 13 (100.0%) |
| Professional & Scientific | 6 (66.7%) | 3 (33.3%) |
| Enterprise Management | 0 (0.0%) | 0 (0.0%) |
| Administrative & Support | 0 (0.0%) | 0 (0.0%) |
| Educational Services | 0 (0.0%) | 39 (100.0%) |
| Health Care & Social Assistance | 1 (7.7%) | 12 (92.3%) |
| Arts, Entertainment & Recreation | 0 (0.0%) | 0 (0.0%) |
| Accommodation & Food Services | 0 (0.0%) | 15 (100.0%) |
| Public Administration | 0 (0.0%) | 7 (100.0%) |
| Total | 128 (46.9%) | 145 (53.1%) |
Education in Natural Steps
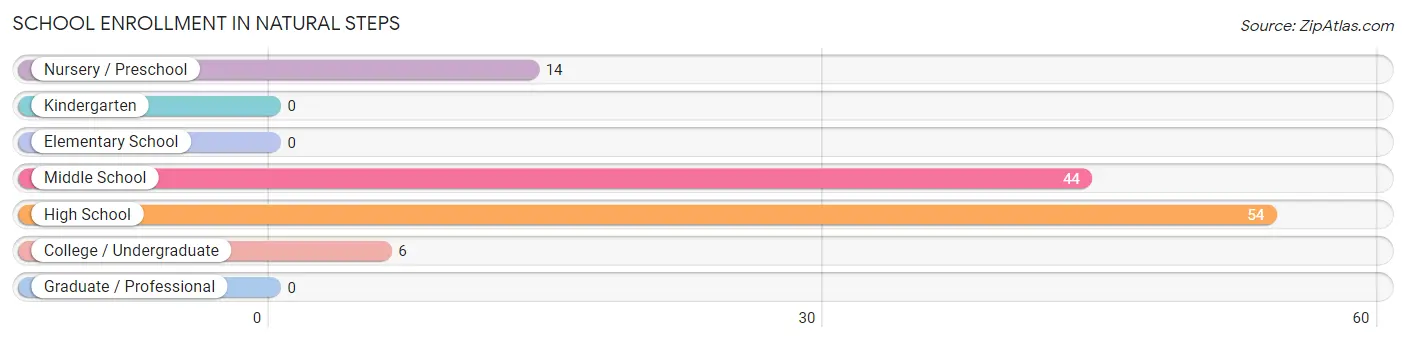
School Enrollment in Natural Steps
The most common levels of schooling among the 118 students in Natural Steps are high school (54 | 45.8%), middle school (44 | 37.3%), and nursery / preschool (14 | 11.9%).
| School Level | # Students | % Students |
| Nursery / Preschool | 14 | 11.9% |
| Kindergarten | 0 | 0.0% |
| Elementary School | 0 | 0.0% |
| Middle School | 44 | 37.3% |
| High School | 54 | 45.8% |
| College / Undergraduate | 6 | 5.1% |
| Graduate / Professional | 0 | 0.0% |
| Total | 118 | 100.0% |
School Enrollment by Age by Funding Source in Natural Steps
Out of a total of 118 students who are enrolled in schools in Natural Steps, 22 (18.6%) attend a private institution, while the remaining 96 (81.4%) are enrolled in public schools. The age group of 3 to 4 year olds has the highest likelihood of being enrolled in private schools, with 14 (100.0% in the age bracket) enrolled. Conversely, the age group of 10 to 14 year olds has the lowest likelihood of being enrolled in a private school, with 44 (100.0% in the age bracket) attending a public institution.
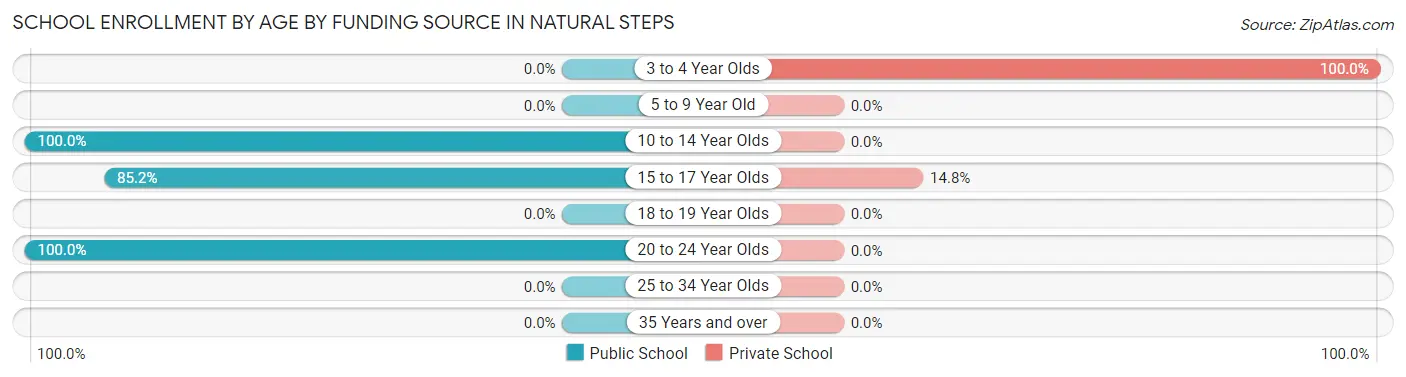
| Age Bracket | Public School | Private School |
| 3 to 4 Year Olds | 0 (0.0%) | 14 (100.0%) |
| 5 to 9 Year Old | 0 (0.0%) | 0 (0.0%) |
| 10 to 14 Year Olds | 44 (100.0%) | 0 (0.0%) |
| 15 to 17 Year Olds | 46 (85.2%) | 8 (14.8%) |
| 18 to 19 Year Olds | 0 (0.0%) | 0 (0.0%) |
| 20 to 24 Year Olds | 6 (100.0%) | 0 (0.0%) |
| 25 to 34 Year Olds | 0 (0.0%) | 0 (0.0%) |
| 35 Years and over | 0 (0.0%) | 0 (0.0%) |
| Total | 96 (81.4%) | 22 (18.6%) |
Educational Attainment by Field of Study in Natural Steps
Bio, nature & agricultural (73 | 27.0%), business (66 | 24.4%), education (56 | 20.7%), science & technology (27 | 10.0%), and liberal arts & history (13 | 4.8%) are the most common fields of study among 270 individuals in Natural Steps who have obtained a bachelor's degree or higher.
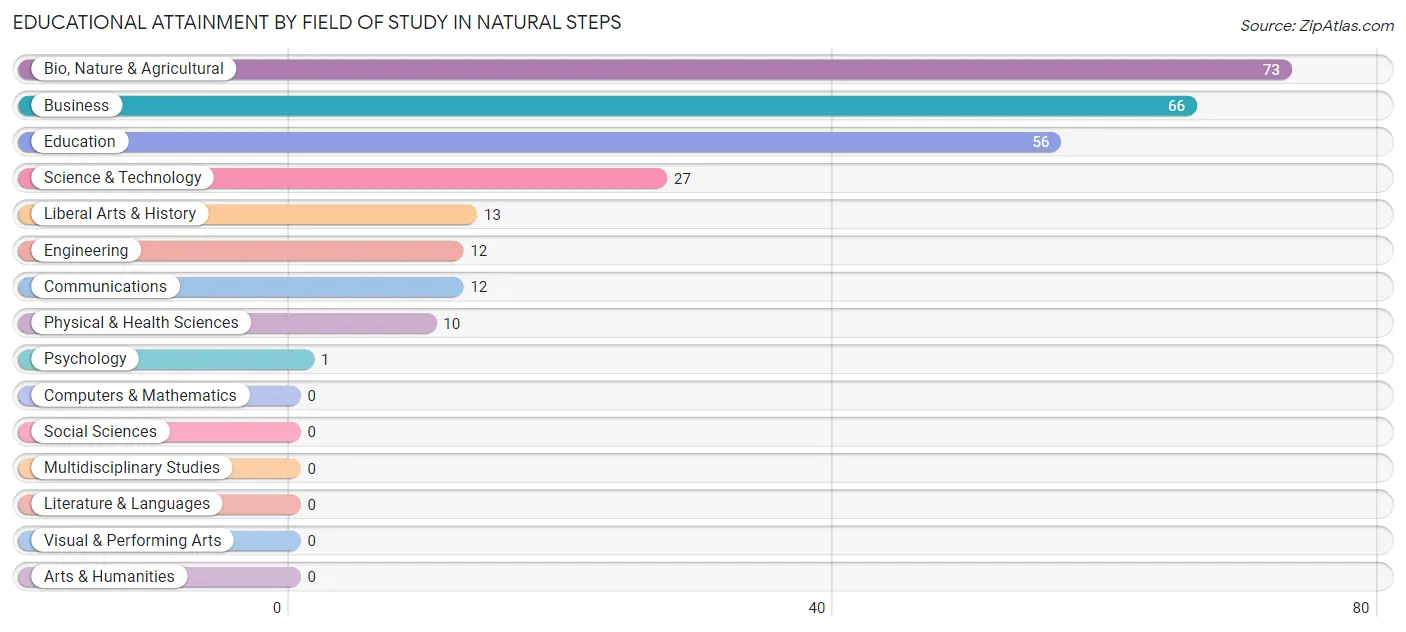
| Field of Study | # Graduates | % Graduates |
| Computers & Mathematics | 0 | 0.0% |
| Bio, Nature & Agricultural | 73 | 27.0% |
| Physical & Health Sciences | 10 | 3.7% |
| Psychology | 1 | 0.4% |
| Social Sciences | 0 | 0.0% |
| Engineering | 12 | 4.4% |
| Multidisciplinary Studies | 0 | 0.0% |
| Science & Technology | 27 | 10.0% |
| Business | 66 | 24.4% |
| Education | 56 | 20.7% |
| Literature & Languages | 0 | 0.0% |
| Liberal Arts & History | 13 | 4.8% |
| Visual & Performing Arts | 0 | 0.0% |
| Communications | 12 | 4.4% |
| Arts & Humanities | 0 | 0.0% |
| Total | 270 | 100.0% |
Transportation & Commute in Natural Steps
Vehicle Availability by Sex in Natural Steps
The most prevalent vehicle ownership categories in Natural Steps are males with 3 vehicles (68, accounting for 53.1%) and females with 3 vehicles (77, making up 46.9%).
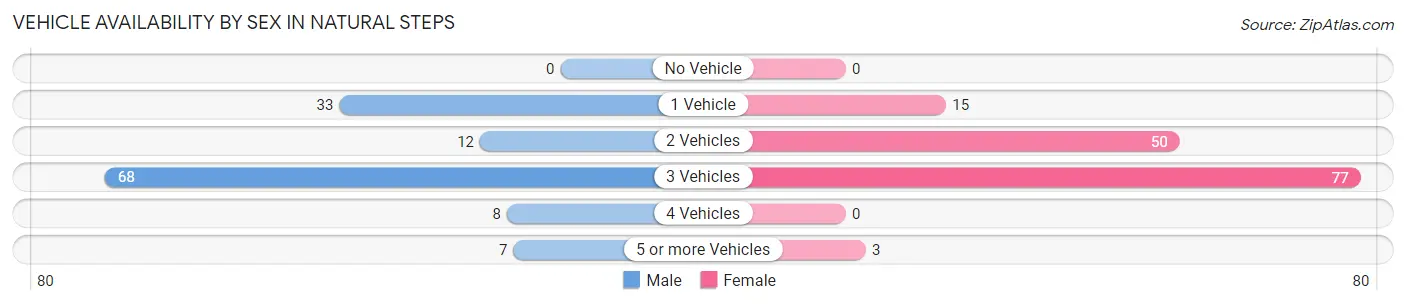
| Vehicles Available | Male | Female |
| No Vehicle | 0 (0.0%) | 0 (0.0%) |
| 1 Vehicle | 33 (25.8%) | 15 (10.3%) |
| 2 Vehicles | 12 (9.4%) | 50 (34.5%) |
| 3 Vehicles | 68 (53.1%) | 77 (53.1%) |
| 4 Vehicles | 8 (6.2%) | 0 (0.0%) |
| 5 or more Vehicles | 7 (5.5%) | 3 (2.1%) |
| Total | 128 (100.0%) | 145 (100.0%) |
Commute Time in Natural Steps
The most frequently occuring commute durations in Natural Steps are 30 to 34 minutes (94 commuters, 38.5%), 10 to 14 minutes (54 commuters, 22.1%), and 35 to 39 minutes (33 commuters, 13.5%).
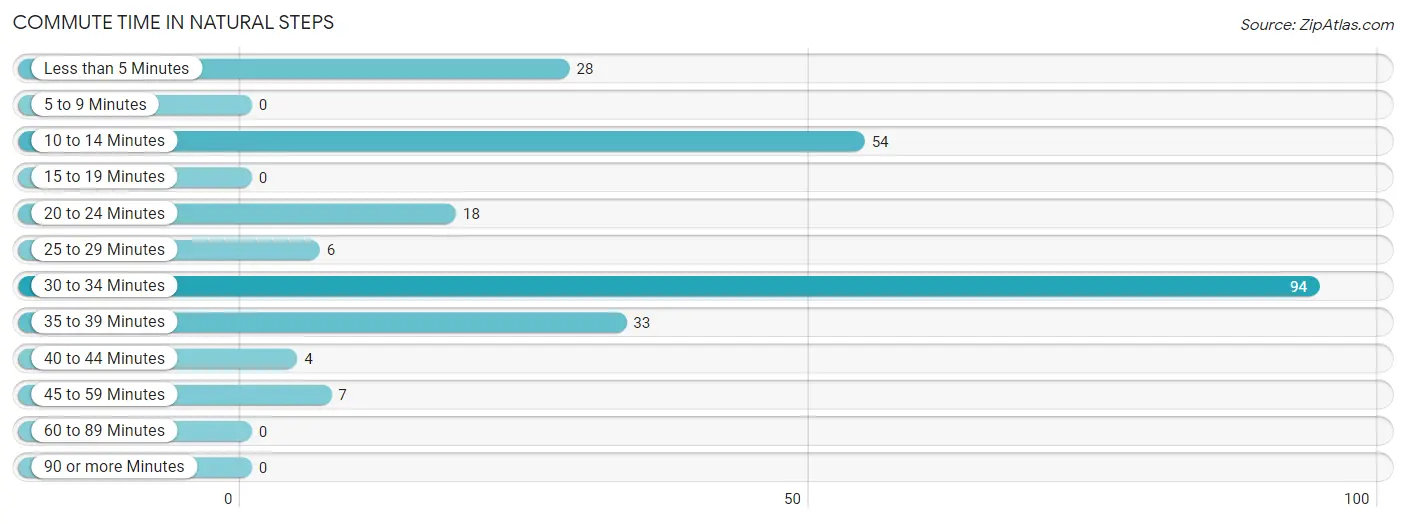
| Commute Time | # Commuters | % Commuters |
| Less than 5 Minutes | 28 | 11.5% |
| 5 to 9 Minutes | 0 | 0.0% |
| 10 to 14 Minutes | 54 | 22.1% |
| 15 to 19 Minutes | 0 | 0.0% |
| 20 to 24 Minutes | 18 | 7.4% |
| 25 to 29 Minutes | 6 | 2.5% |
| 30 to 34 Minutes | 94 | 38.5% |
| 35 to 39 Minutes | 33 | 13.5% |
| 40 to 44 Minutes | 4 | 1.6% |
| 45 to 59 Minutes | 7 | 2.9% |
| 60 to 89 Minutes | 0 | 0.0% |
| 90 or more Minutes | 0 | 0.0% |
Commute Time by Sex in Natural Steps
The most common commute times in Natural Steps are 30 to 34 minutes (62 commuters, 55.4%) for males and 10 to 14 minutes (54 commuters, 40.9%) for females.
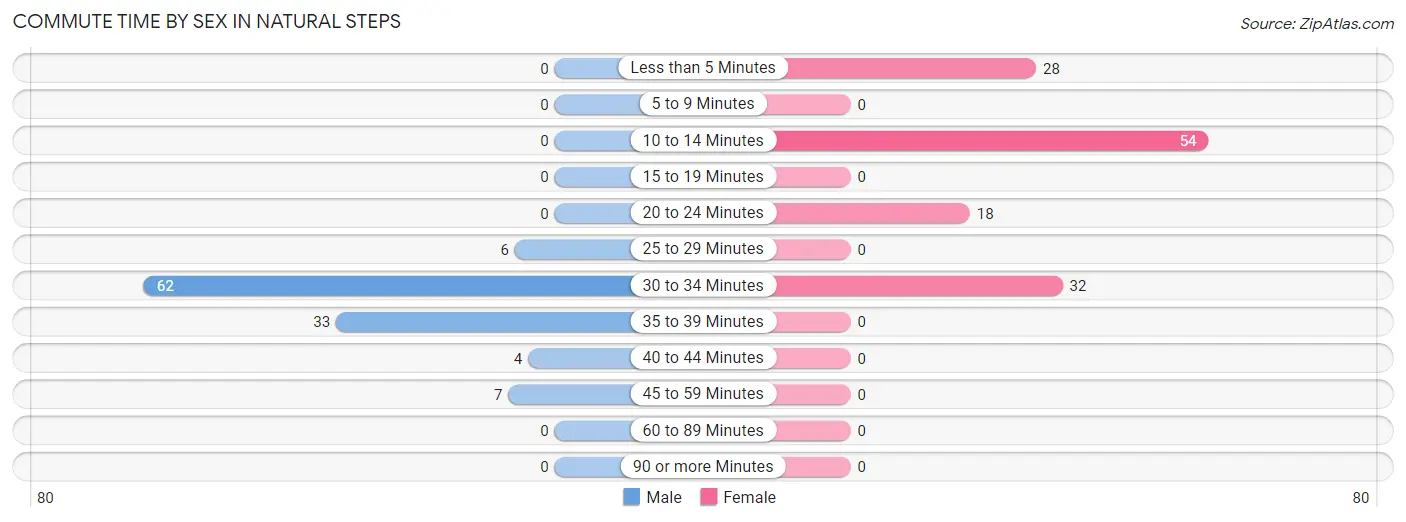
| Commute Time | Male | Female |
| Less than 5 Minutes | 0 (0.0%) | 28 (21.2%) |
| 5 to 9 Minutes | 0 (0.0%) | 0 (0.0%) |
| 10 to 14 Minutes | 0 (0.0%) | 54 (40.9%) |
| 15 to 19 Minutes | 0 (0.0%) | 0 (0.0%) |
| 20 to 24 Minutes | 0 (0.0%) | 18 (13.6%) |
| 25 to 29 Minutes | 6 (5.4%) | 0 (0.0%) |
| 30 to 34 Minutes | 62 (55.4%) | 32 (24.2%) |
| 35 to 39 Minutes | 33 (29.5%) | 0 (0.0%) |
| 40 to 44 Minutes | 4 (3.6%) | 0 (0.0%) |
| 45 to 59 Minutes | 7 (6.2%) | 0 (0.0%) |
| 60 to 89 Minutes | 0 (0.0%) | 0 (0.0%) |
| 90 or more Minutes | 0 (0.0%) | 0 (0.0%) |
Time of Departure to Work by Sex in Natural Steps
The most frequent times of departure to work in Natural Steps are 7:30 AM to 7:59 AM (50, 44.6%) for males and 7:30 AM to 7:59 AM (57, 43.2%) for females.
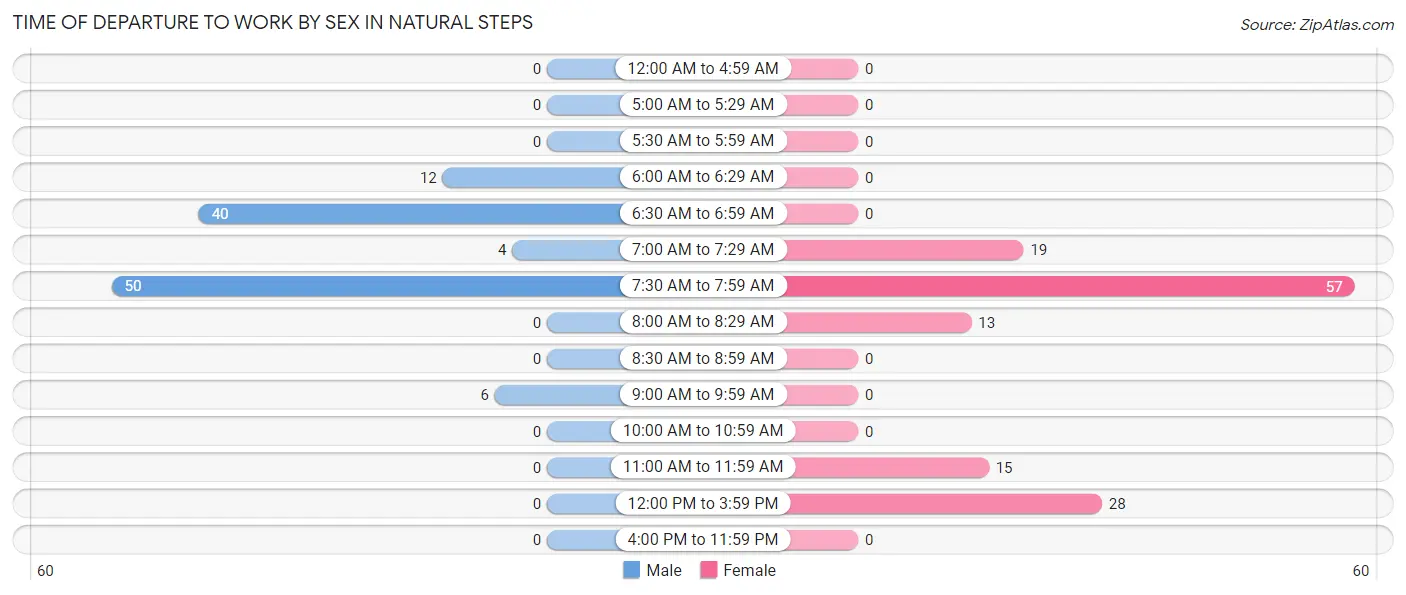
| Time of Departure | Male | Female |
| 12:00 AM to 4:59 AM | 0 (0.0%) | 0 (0.0%) |
| 5:00 AM to 5:29 AM | 0 (0.0%) | 0 (0.0%) |
| 5:30 AM to 5:59 AM | 0 (0.0%) | 0 (0.0%) |
| 6:00 AM to 6:29 AM | 12 (10.7%) | 0 (0.0%) |
| 6:30 AM to 6:59 AM | 40 (35.7%) | 0 (0.0%) |
| 7:00 AM to 7:29 AM | 4 (3.6%) | 19 (14.4%) |
| 7:30 AM to 7:59 AM | 50 (44.6%) | 57 (43.2%) |
| 8:00 AM to 8:29 AM | 0 (0.0%) | 13 (9.9%) |
| 8:30 AM to 8:59 AM | 0 (0.0%) | 0 (0.0%) |
| 9:00 AM to 9:59 AM | 6 (5.4%) | 0 (0.0%) |
| 10:00 AM to 10:59 AM | 0 (0.0%) | 0 (0.0%) |
| 11:00 AM to 11:59 AM | 0 (0.0%) | 15 (11.4%) |
| 12:00 PM to 3:59 PM | 0 (0.0%) | 28 (21.2%) |
| 4:00 PM to 11:59 PM | 0 (0.0%) | 0 (0.0%) |
| Total | 112 (100.0%) | 132 (100.0%) |
Housing Occupancy in Natural Steps
Occupancy by Ownership in Natural Steps
Of the total 262 dwellings in Natural Steps, owner-occupied units account for 252 (96.2%), while renter-occupied units make up 10 (3.8%).
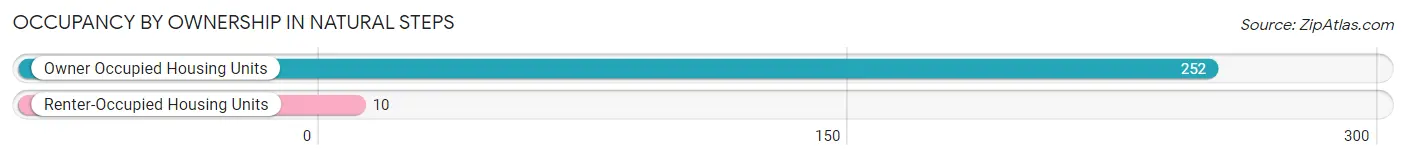
| Occupancy | # Housing Units | % Housing Units |
| Owner Occupied Housing Units | 252 | 96.2% |
| Renter-Occupied Housing Units | 10 | 3.8% |
| Total Occupied Housing Units | 262 | 100.0% |
Occupancy by Household Size in Natural Steps
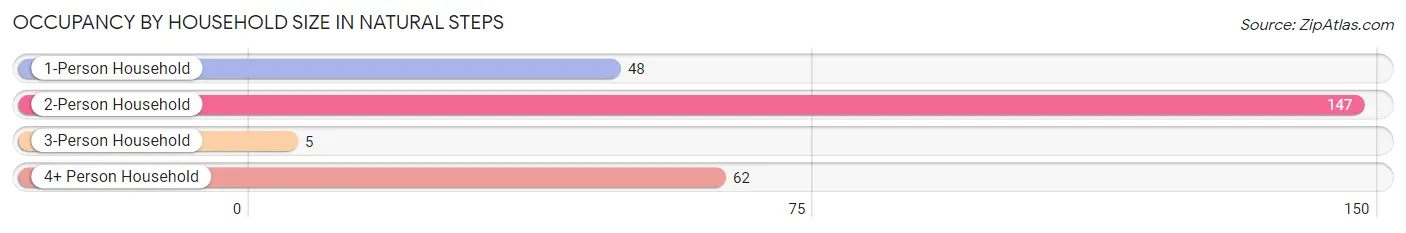
| Household Size | # Housing Units | % Housing Units |
| 1-Person Household | 48 | 18.3% |
| 2-Person Household | 147 | 56.1% |
| 3-Person Household | 5 | 1.9% |
| 4+ Person Household | 62 | 23.7% |
| Total Housing Units | 262 | 100.0% |
Occupancy by Ownership by Household Size in Natural Steps
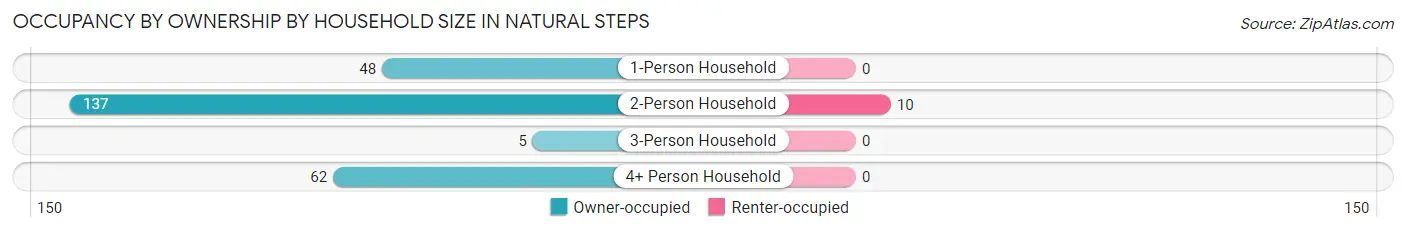
| Household Size | Owner-occupied | Renter-occupied |
| 1-Person Household | 48 (100.0%) | 0 (0.0%) |
| 2-Person Household | 137 (93.2%) | 10 (6.8%) |
| 3-Person Household | 5 (100.0%) | 0 (0.0%) |
| 4+ Person Household | 62 (100.0%) | 0 (0.0%) |
| Total Housing Units | 252 (96.2%) | 10 (3.8%) |
Occupancy by Educational Attainment in Natural Steps
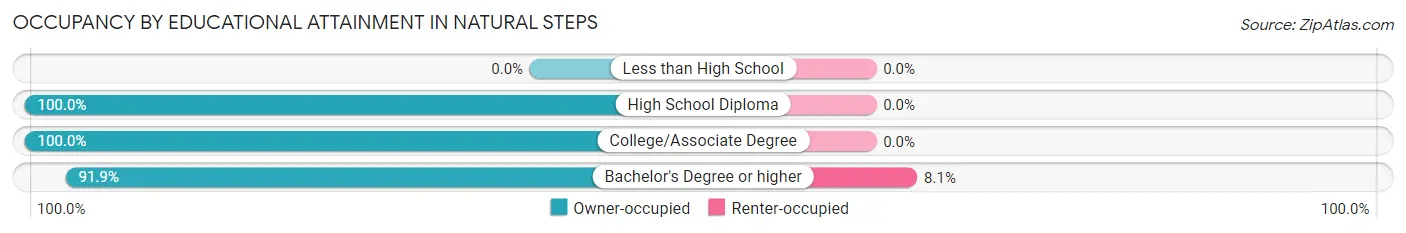
| Household Size | Owner-occupied | Renter-occupied |
| Less than High School | 0 (0.0%) | 0 (0.0%) |
| High School Diploma | 91 (100.0%) | 0 (0.0%) |
| College/Associate Degree | 48 (100.0%) | 0 (0.0%) |
| Bachelor's Degree or higher | 113 (91.9%) | 10 (8.1%) |
Occupancy by Age of Householder in Natural Steps
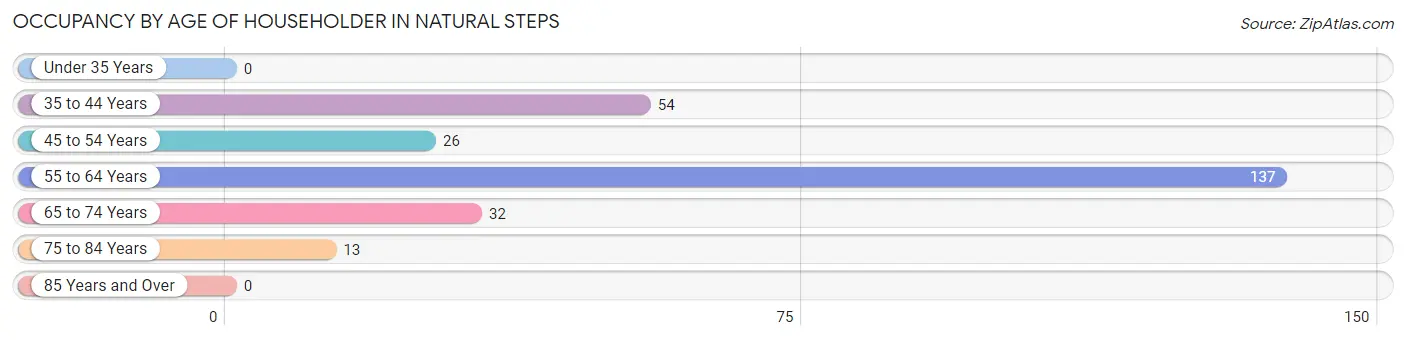
| Age Bracket | # Households | % Households |
| Under 35 Years | 0 | 0.0% |
| 35 to 44 Years | 54 | 20.6% |
| 45 to 54 Years | 26 | 9.9% |
| 55 to 64 Years | 137 | 52.3% |
| 65 to 74 Years | 32 | 12.2% |
| 75 to 84 Years | 13 | 5.0% |
| 85 Years and Over | 0 | 0.0% |
| Total | 262 | 100.0% |
Housing Finances in Natural Steps
Median Income by Occupancy in Natural Steps
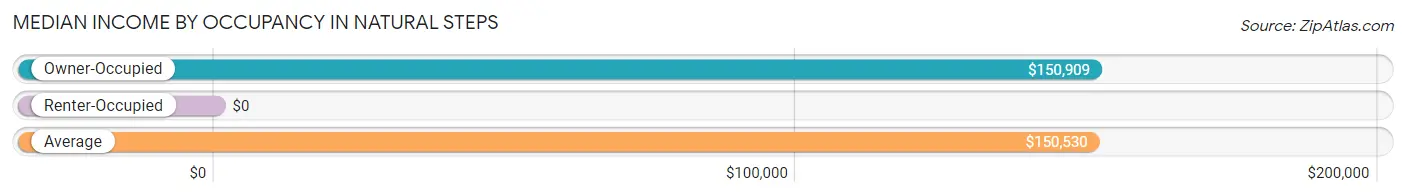
| Occupancy Type | # Households | Median Income |
| Owner-Occupied | 252 (96.2%) | $150,909 |
| Renter-Occupied | 10 (3.8%) | $0 |
| Average | 262 (100.0%) | $150,530 |
Occupancy by Householder Income Bracket in Natural Steps
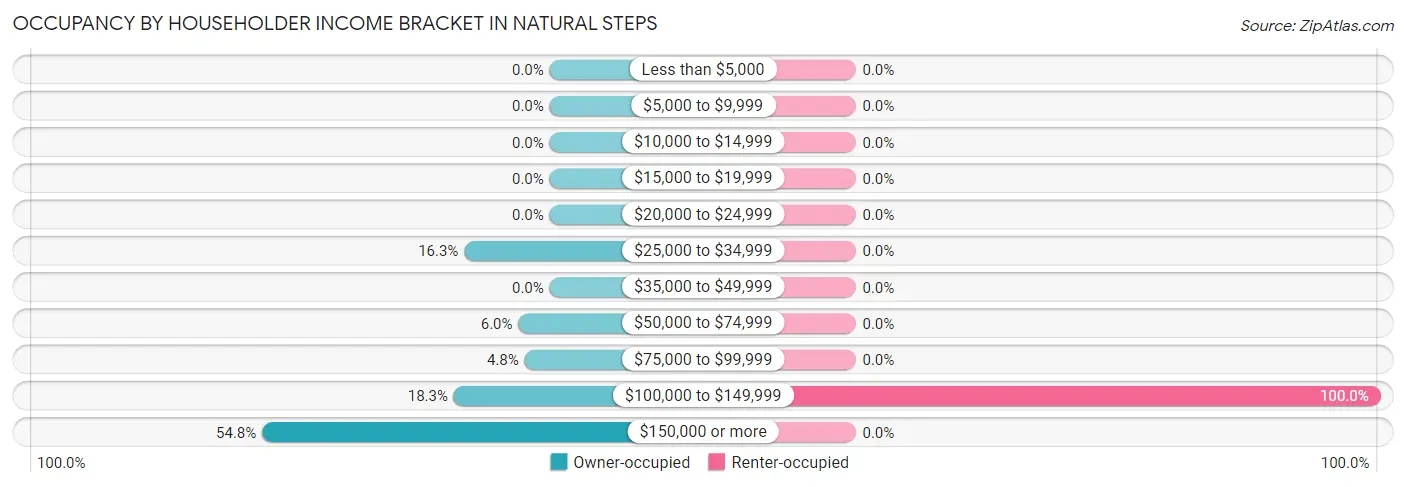
| Income Bracket | Owner-occupied | Renter-occupied |
| Less than $5,000 | 0 (0.0%) | 0 (0.0%) |
| $5,000 to $9,999 | 0 (0.0%) | 0 (0.0%) |
| $10,000 to $14,999 | 0 (0.0%) | 0 (0.0%) |
| $15,000 to $19,999 | 0 (0.0%) | 0 (0.0%) |
| $20,000 to $24,999 | 0 (0.0%) | 0 (0.0%) |
| $25,000 to $34,999 | 41 (16.3%) | 0 (0.0%) |
| $35,000 to $49,999 | 0 (0.0%) | 0 (0.0%) |
| $50,000 to $74,999 | 15 (5.9%) | 0 (0.0%) |
| $75,000 to $99,999 | 12 (4.8%) | 0 (0.0%) |
| $100,000 to $149,999 | 46 (18.2%) | 10 (100.0%) |
| $150,000 or more | 138 (54.8%) | 0 (0.0%) |
| Total | 252 (100.0%) | 10 (100.0%) |
Monthly Housing Cost Tiers in Natural Steps
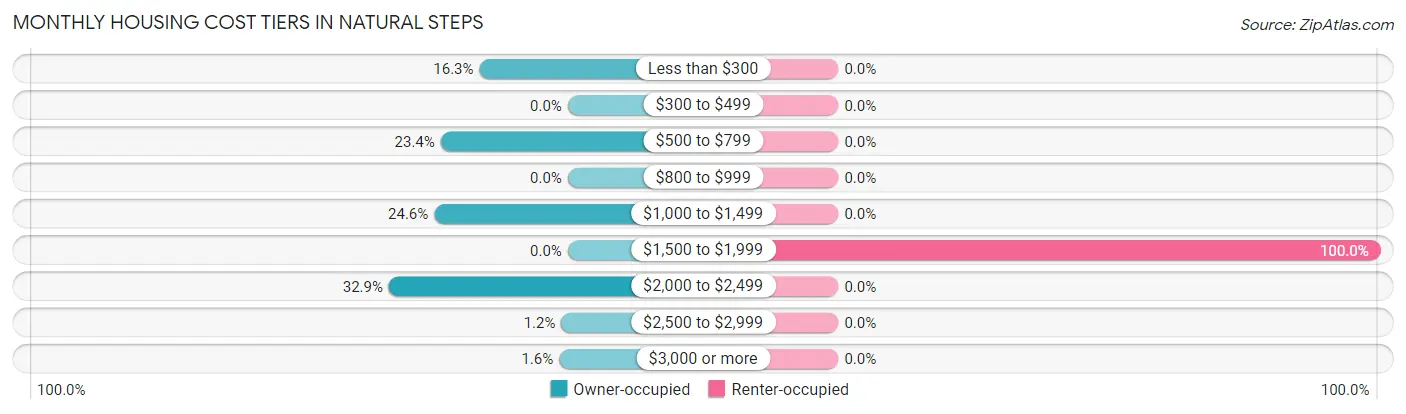
| Monthly Cost | Owner-occupied | Renter-occupied |
| Less than $300 | 41 (16.3%) | 0 (0.0%) |
| $300 to $499 | 0 (0.0%) | 0 (0.0%) |
| $500 to $799 | 59 (23.4%) | 0 (0.0%) |
| $800 to $999 | 0 (0.0%) | 0 (0.0%) |
| $1,000 to $1,499 | 62 (24.6%) | 0 (0.0%) |
| $1,500 to $1,999 | 0 (0.0%) | 10 (100.0%) |
| $2,000 to $2,499 | 83 (32.9%) | 0 (0.0%) |
| $2,500 to $2,999 | 3 (1.2%) | 0 (0.0%) |
| $3,000 or more | 4 (1.6%) | 0 (0.0%) |
| Total | 252 (100.0%) | 10 (100.0%) |
Physical Housing Characteristics in Natural Steps
Housing Structures in Natural Steps
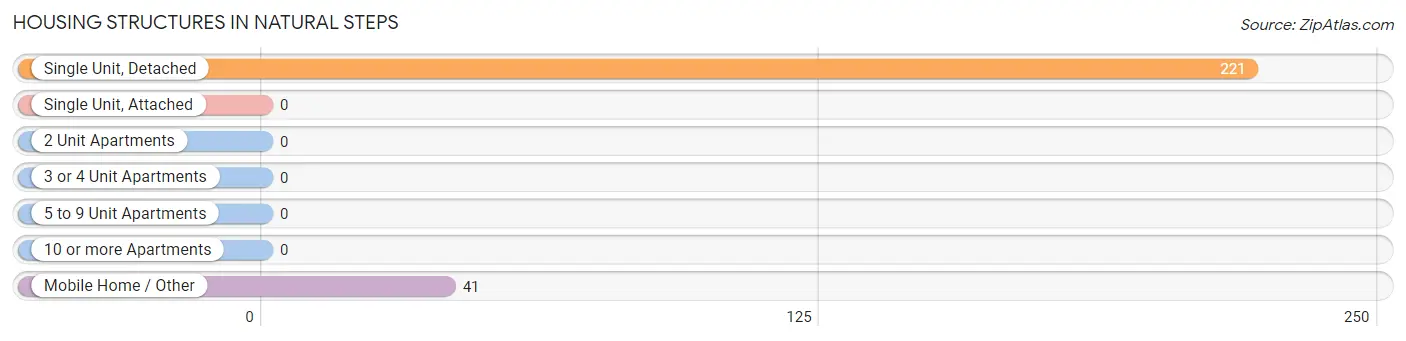
| Structure Type | # Housing Units | % Housing Units |
| Single Unit, Detached | 221 | 84.4% |
| Single Unit, Attached | 0 | 0.0% |
| 2 Unit Apartments | 0 | 0.0% |
| 3 or 4 Unit Apartments | 0 | 0.0% |
| 5 to 9 Unit Apartments | 0 | 0.0% |
| 10 or more Apartments | 0 | 0.0% |
| Mobile Home / Other | 41 | 15.7% |
| Total | 262 | 100.0% |
Housing Structures by Occupancy in Natural Steps
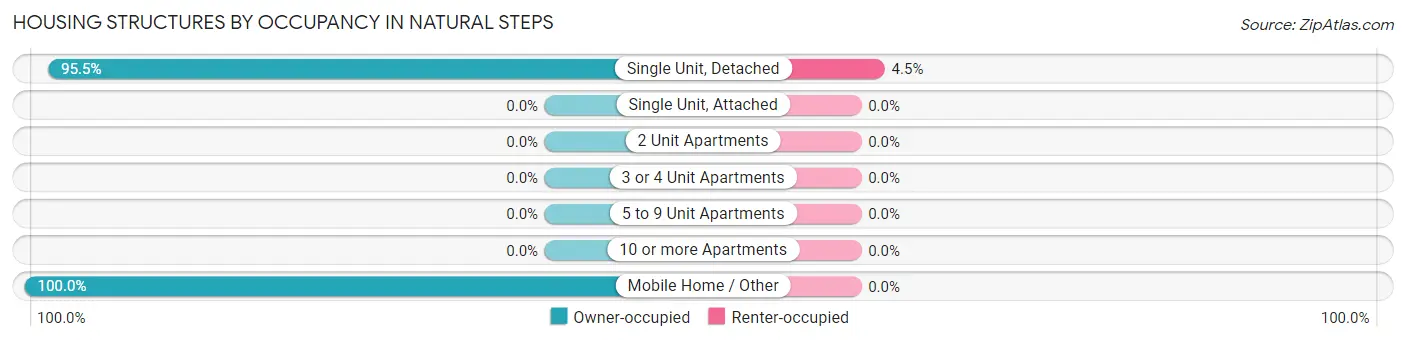
| Structure Type | Owner-occupied | Renter-occupied |
| Single Unit, Detached | 211 (95.5%) | 10 (4.5%) |
| Single Unit, Attached | 0 (0.0%) | 0 (0.0%) |
| 2 Unit Apartments | 0 (0.0%) | 0 (0.0%) |
| 3 or 4 Unit Apartments | 0 (0.0%) | 0 (0.0%) |
| 5 to 9 Unit Apartments | 0 (0.0%) | 0 (0.0%) |
| 10 or more Apartments | 0 (0.0%) | 0 (0.0%) |
| Mobile Home / Other | 41 (100.0%) | 0 (0.0%) |
| Total | 252 (96.2%) | 10 (3.8%) |
Housing Structures by Number of Rooms in Natural Steps
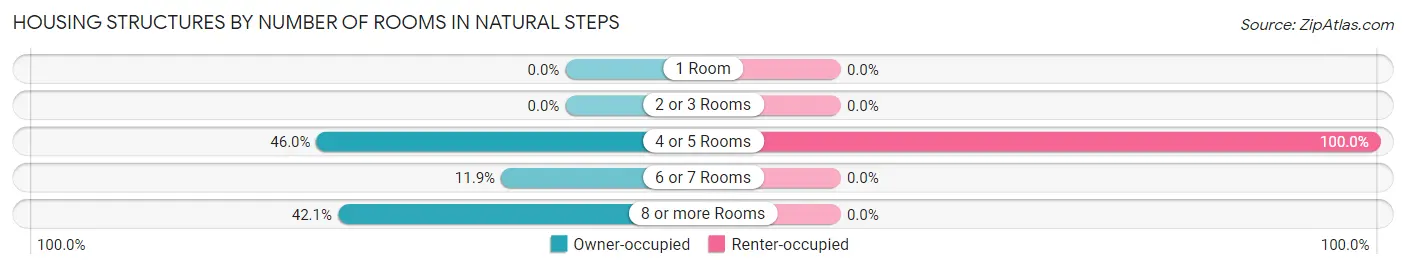
| Number of Rooms | Owner-occupied | Renter-occupied |
| 1 Room | 0 (0.0%) | 0 (0.0%) |
| 2 or 3 Rooms | 0 (0.0%) | 0 (0.0%) |
| 4 or 5 Rooms | 116 (46.0%) | 10 (100.0%) |
| 6 or 7 Rooms | 30 (11.9%) | 0 (0.0%) |
| 8 or more Rooms | 106 (42.1%) | 0 (0.0%) |
| Total | 252 (100.0%) | 10 (100.0%) |
Housing Structure by Heating Type in Natural Steps
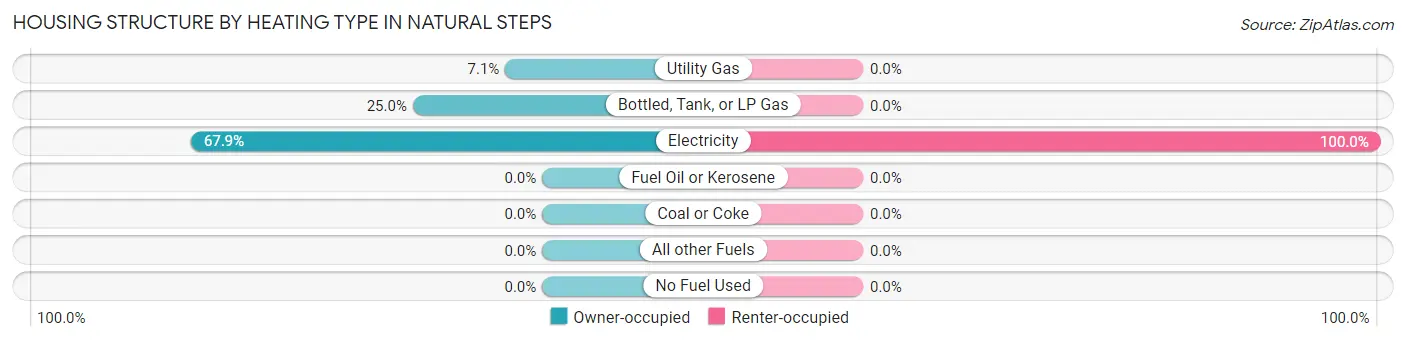
| Heating Type | Owner-occupied | Renter-occupied |
| Utility Gas | 18 (7.1%) | 0 (0.0%) |
| Bottled, Tank, or LP Gas | 63 (25.0%) | 0 (0.0%) |
| Electricity | 171 (67.9%) | 10 (100.0%) |
| Fuel Oil or Kerosene | 0 (0.0%) | 0 (0.0%) |
| Coal or Coke | 0 (0.0%) | 0 (0.0%) |
| All other Fuels | 0 (0.0%) | 0 (0.0%) |
| No Fuel Used | 0 (0.0%) | 0 (0.0%) |
| Total | 252 (100.0%) | 10 (100.0%) |
Household Vehicle Usage in Natural Steps
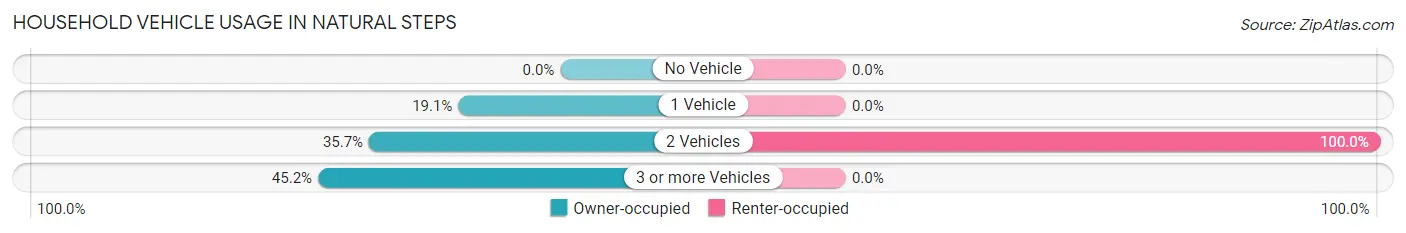
| Vehicles per Household | Owner-occupied | Renter-occupied |
| No Vehicle | 0 (0.0%) | 0 (0.0%) |
| 1 Vehicle | 48 (19.1%) | 0 (0.0%) |
| 2 Vehicles | 90 (35.7%) | 10 (100.0%) |
| 3 or more Vehicles | 114 (45.2%) | 0 (0.0%) |
| Total | 252 (100.0%) | 10 (100.0%) |
Real Estate & Mortgages in Natural Steps
Real Estate and Mortgage Overview in Natural Steps
| Characteristic | Without Mortgage | With Mortgage |
| Housing Units | 113 | 139 |
| Median Property Value | - | - |
| Median Household Income | $128,423 | $108 |
| Monthly Housing Costs | $726 | $4 |
| Real Estate Taxes | - | - |
Property Value by Mortgage Status in Natural Steps
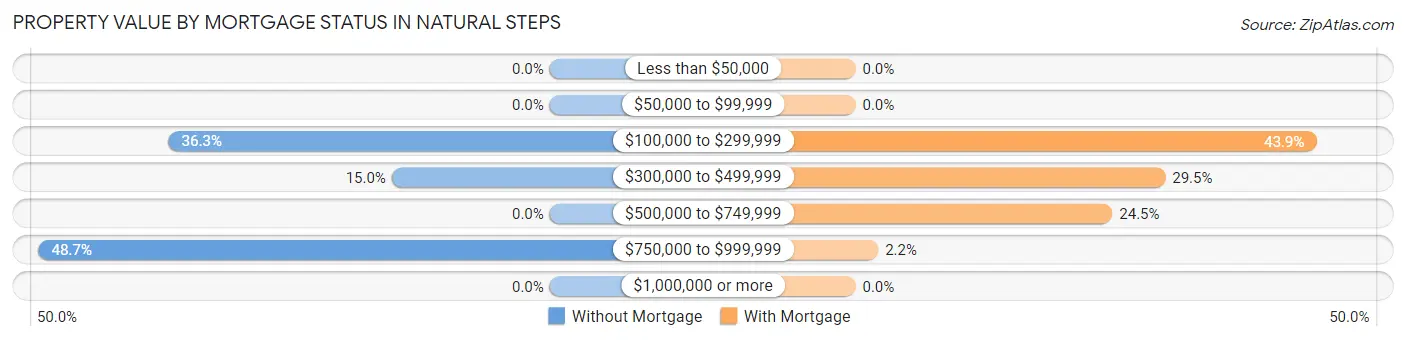
| Property Value | Without Mortgage | With Mortgage |
| Less than $50,000 | 0 (0.0%) | 0 (0.0%) |
| $50,000 to $99,999 | 0 (0.0%) | 0 (0.0%) |
| $100,000 to $299,999 | 41 (36.3%) | 61 (43.9%) |
| $300,000 to $499,999 | 17 (15.0%) | 41 (29.5%) |
| $500,000 to $749,999 | 0 (0.0%) | 34 (24.5%) |
| $750,000 to $999,999 | 55 (48.7%) | 3 (2.2%) |
| $1,000,000 or more | 0 (0.0%) | 0 (0.0%) |
| Total | 113 (100.0%) | 139 (100.0%) |
Household Income by Mortgage Status in Natural Steps
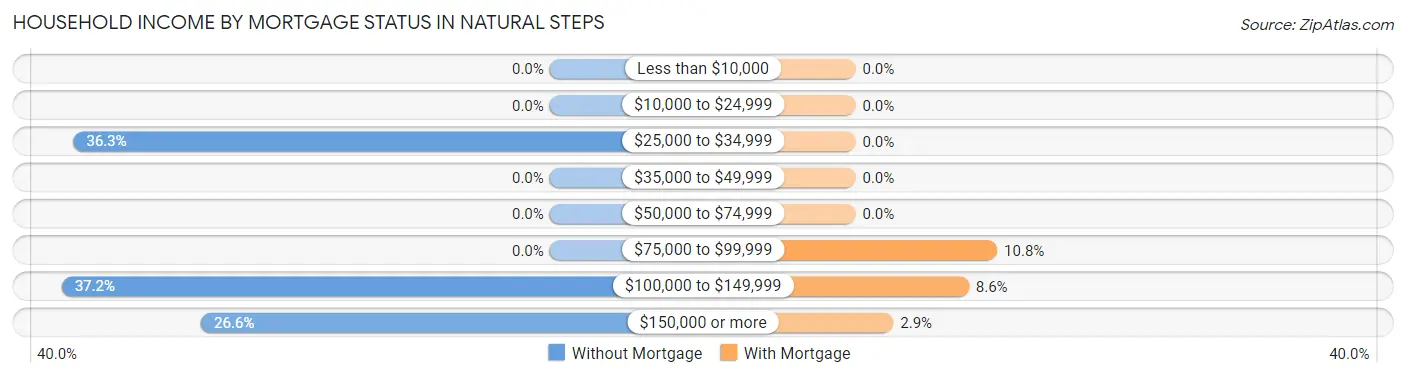
| Household Income | Without Mortgage | With Mortgage |
| Less than $10,000 | 0 (0.0%) | 0 (0.0%) |
| $10,000 to $24,999 | 0 (0.0%) | 0 (0.0%) |
| $25,000 to $34,999 | 41 (36.3%) | 0 (0.0%) |
| $35,000 to $49,999 | 0 (0.0%) | 0 (0.0%) |
| $50,000 to $74,999 | 0 (0.0%) | 0 (0.0%) |
| $75,000 to $99,999 | 0 (0.0%) | 15 (10.8%) |
| $100,000 to $149,999 | 42 (37.2%) | 12 (8.6%) |
| $150,000 or more | 30 (26.6%) | 4 (2.9%) |
| Total | 113 (100.0%) | 139 (100.0%) |
Property Value to Household Income Ratio in Natural Steps
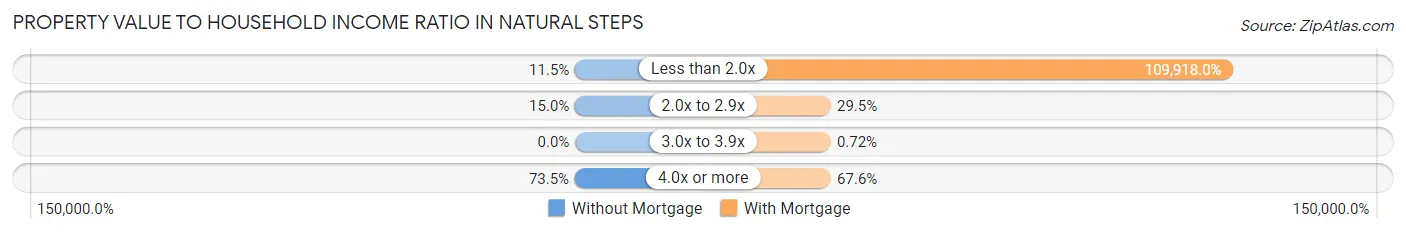
| Value-to-Income Ratio | Without Mortgage | With Mortgage |
| Less than 2.0x | 13 (11.5%) | 152,786 (109,918.0%) |
| 2.0x to 2.9x | 17 (15.0%) | 41 (29.5%) |
| 3.0x to 3.9x | 0 (0.0%) | 1 (0.7%) |
| 4.0x or more | 83 (73.5%) | 94 (67.6%) |
| Total | 113 (100.0%) | 139 (100.0%) |
Real Estate Taxes by Mortgage Status in Natural Steps
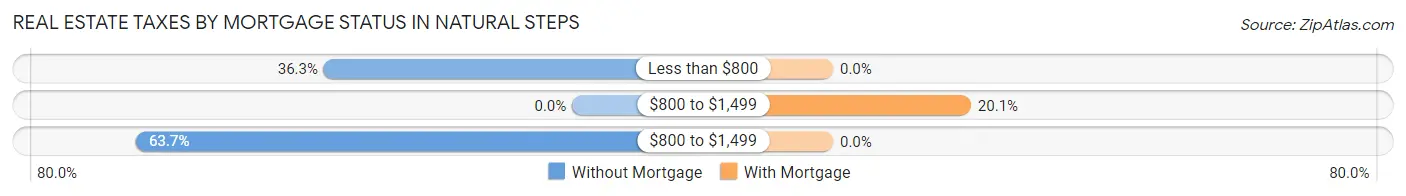
| Property Taxes | Without Mortgage | With Mortgage |
| Less than $800 | 41 (36.3%) | 0 (0.0%) |
| $800 to $1,499 | 0 (0.0%) | 28 (20.1%) |
| $800 to $1,499 | 72 (63.7%) | 0 (0.0%) |
| Total | 113 (100.0%) | 139 (100.0%) |
Health & Disability in Natural Steps
Health Insurance Coverage by Age in Natural Steps
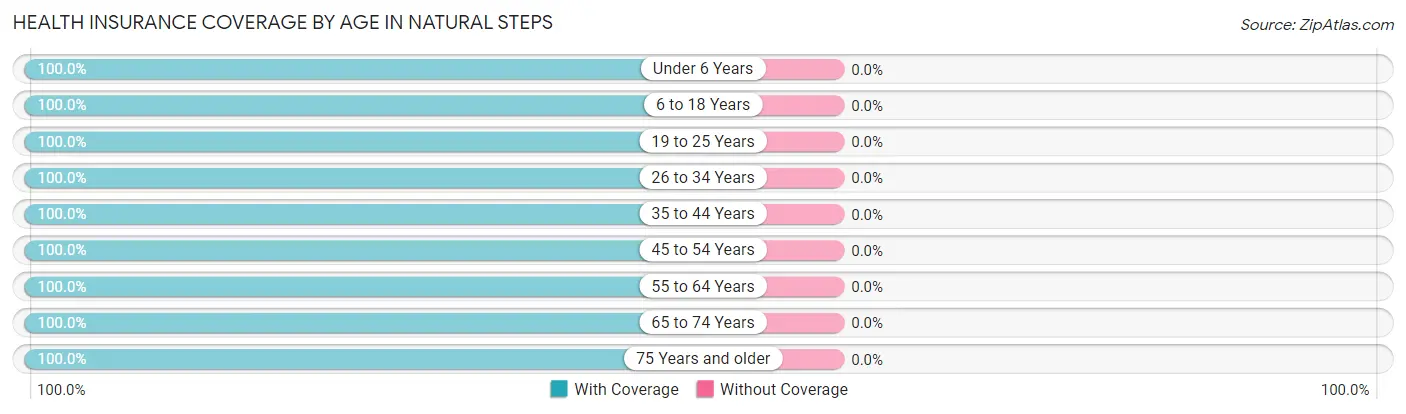
| Age Bracket | With Coverage | Without Coverage |
| Under 6 Years | 28 (100.0%) | 0 (0.0%) |
| 6 to 18 Years | 98 (100.0%) | 0 (0.0%) |
| 19 to 25 Years | 6 (100.0%) | 0 (0.0%) |
| 26 to 34 Years | 8 (100.0%) | 0 (0.0%) |
| 35 to 44 Years | 105 (100.0%) | 0 (0.0%) |
| 45 to 54 Years | 41 (100.0%) | 0 (0.0%) |
| 55 to 64 Years | 185 (100.0%) | 0 (0.0%) |
| 65 to 74 Years | 77 (100.0%) | 0 (0.0%) |
| 75 Years and older | 32 (100.0%) | 0 (0.0%) |
| Total | 580 (100.0%) | 0 (0.0%) |
Health Insurance Coverage by Citizenship Status in Natural Steps
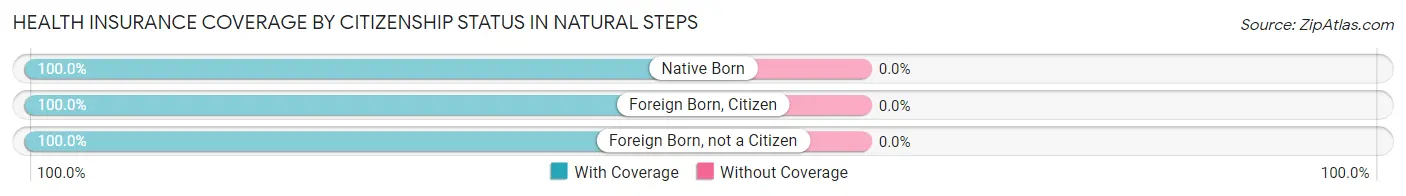
| Citizenship Status | With Coverage | Without Coverage |
| Native Born | 28 (100.0%) | 0 (0.0%) |
| Foreign Born, Citizen | 98 (100.0%) | 0 (0.0%) |
| Foreign Born, not a Citizen | 6 (100.0%) | 0 (0.0%) |
Health Insurance Coverage by Household Income in Natural Steps
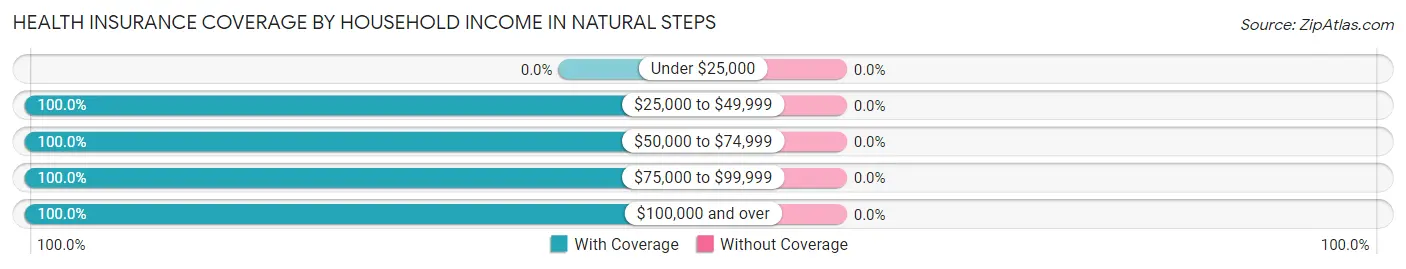
| Household Income | With Coverage | Without Coverage |
| Under $25,000 | 0 (0.0%) | 0 (0.0%) |
| $25,000 to $49,999 | 69 (100.0%) | 0 (0.0%) |
| $50,000 to $74,999 | 15 (100.0%) | 0 (0.0%) |
| $75,000 to $99,999 | 52 (100.0%) | 0 (0.0%) |
| $100,000 and over | 444 (100.0%) | 0 (0.0%) |
Public vs Private Health Insurance Coverage by Age in Natural Steps
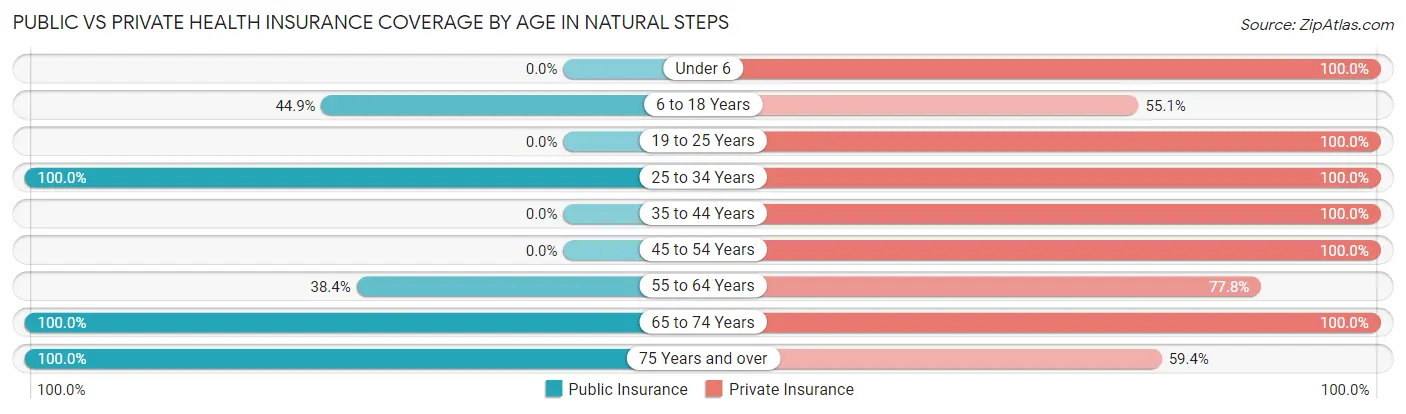
| Age Bracket | Public Insurance | Private Insurance |
| Under 6 | 0 (0.0%) | 28 (100.0%) |
| 6 to 18 Years | 44 (44.9%) | 54 (55.1%) |
| 19 to 25 Years | 0 (0.0%) | 6 (100.0%) |
| 25 to 34 Years | 8 (100.0%) | 8 (100.0%) |
| 35 to 44 Years | 0 (0.0%) | 105 (100.0%) |
| 45 to 54 Years | 0 (0.0%) | 41 (100.0%) |
| 55 to 64 Years | 71 (38.4%) | 144 (77.8%) |
| 65 to 74 Years | 77 (100.0%) | 77 (100.0%) |
| 75 Years and over | 32 (100.0%) | 19 (59.4%) |
| Total | 232 (40.0%) | 482 (83.1%) |
Disability Status by Sex by Age in Natural Steps
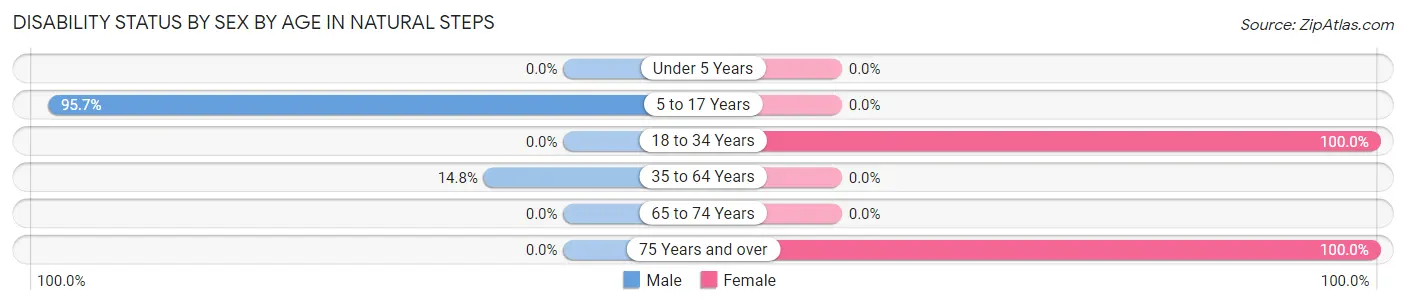
| Age Bracket | Male | Female |
| Under 5 Years | 0 (0.0%) | 0 (0.0%) |
| 5 to 17 Years | 44 (95.7%) | 0 (0.0%) |
| 18 to 34 Years | 0 (0.0%) | 8 (100.0%) |
| 35 to 64 Years | 30 (14.8%) | 0 (0.0%) |
| 65 to 74 Years | 0 (0.0%) | 0 (0.0%) |
| 75 Years and over | 0 (0.0%) | 19 (100.0%) |
Disability Class by Sex by Age in Natural Steps
Disability Class: Hearing Difficulty
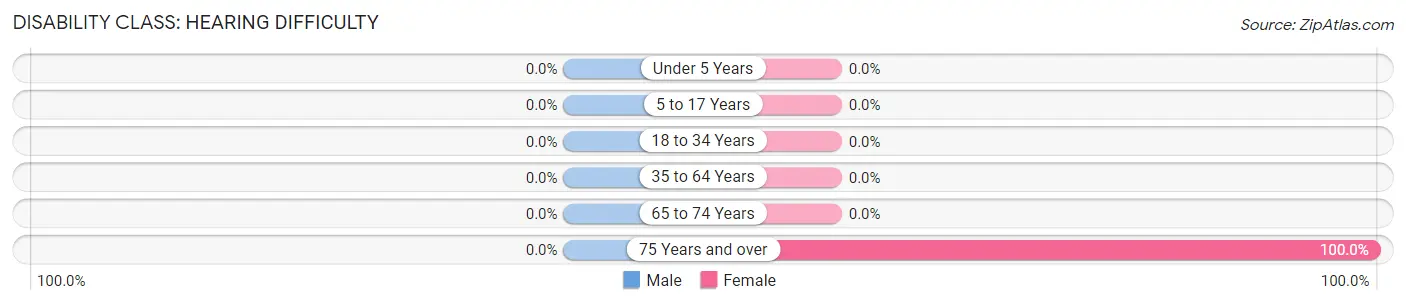
| Age Bracket | Male | Female |
| Under 5 Years | 0 (0.0%) | 0 (0.0%) |
| 5 to 17 Years | 0 (0.0%) | 0 (0.0%) |
| 18 to 34 Years | 0 (0.0%) | 0 (0.0%) |
| 35 to 64 Years | 0 (0.0%) | 0 (0.0%) |
| 65 to 74 Years | 0 (0.0%) | 0 (0.0%) |
| 75 Years and over | 0 (0.0%) | 19 (100.0%) |
Disability Class: Vision Difficulty
| Age Bracket | Male | Female |
| Under 5 Years | 0 (0.0%) | 0 (0.0%) |
| 5 to 17 Years | 0 (0.0%) | 0 (0.0%) |
| 18 to 34 Years | 0 (0.0%) | 0 (0.0%) |
| 35 to 64 Years | 0 (0.0%) | 0 (0.0%) |
| 65 to 74 Years | 0 (0.0%) | 0 (0.0%) |
| 75 Years and over | 0 (0.0%) | 0 (0.0%) |
Disability Class: Cognitive Difficulty

| Age Bracket | Male | Female |
| 5 to 17 Years | 44 (95.7%) | 0 (0.0%) |
| 18 to 34 Years | 0 (0.0%) | 8 (100.0%) |
| 35 to 64 Years | 30 (14.8%) | 0 (0.0%) |
| 65 to 74 Years | 0 (0.0%) | 0 (0.0%) |
| 75 Years and over | 0 (0.0%) | 0 (0.0%) |
Disability Class: Ambulatory Difficulty
| Age Bracket | Male | Female |
| 5 to 17 Years | 0 (0.0%) | 0 (0.0%) |
| 18 to 34 Years | 0 (0.0%) | 0 (0.0%) |
| 35 to 64 Years | 0 (0.0%) | 0 (0.0%) |
| 65 to 74 Years | 0 (0.0%) | 0 (0.0%) |
| 75 Years and over | 0 (0.0%) | 0 (0.0%) |
Disability Class: Self-Care Difficulty
| Age Bracket | Male | Female |
| 5 to 17 Years | 0 (0.0%) | 0 (0.0%) |
| 18 to 34 Years | 0 (0.0%) | 0 (0.0%) |
| 35 to 64 Years | 0 (0.0%) | 0 (0.0%) |
| 65 to 74 Years | 0 (0.0%) | 0 (0.0%) |
| 75 Years and over | 0 (0.0%) | 0 (0.0%) |
Technology Access in Natural Steps
Computing Device Access in Natural Steps
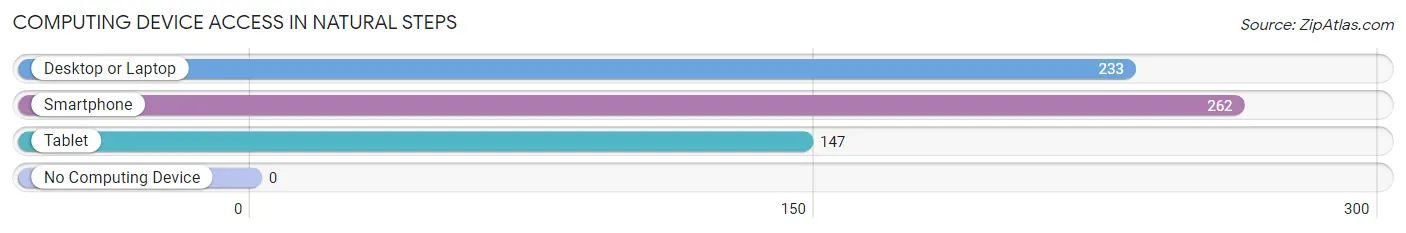
| Device Type | # Households | % Households |
| Desktop or Laptop | 233 | 88.9% |
| Smartphone | 262 | 100.0% |
| Tablet | 147 | 56.1% |
| No Computing Device | 0 | 0.0% |
| Total | 262 | 100.0% |
Internet Access in Natural Steps
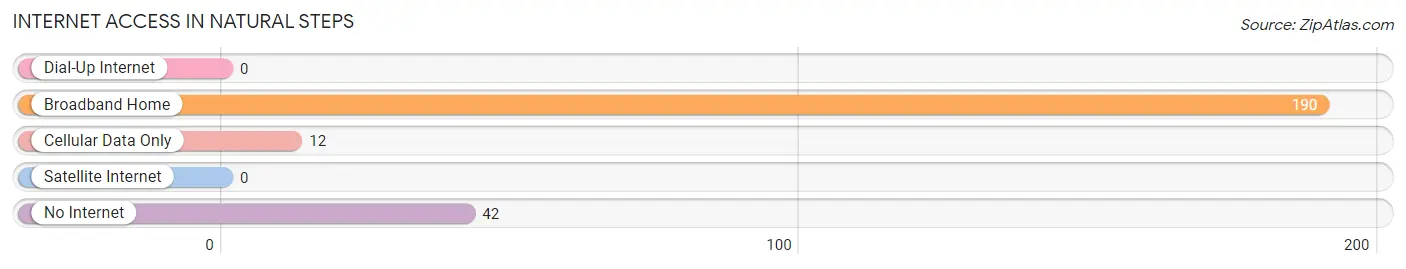
| Internet Type | # Households | % Households |
| Dial-Up Internet | 0 | 0.0% |
| Broadband Home | 190 | 72.5% |
| Cellular Data Only | 12 | 4.6% |
| Satellite Internet | 0 | 0.0% |
| No Internet | 42 | 16.0% |
| Total | 262 | 100.0% |
Natural Steps Summary
Natural Steps is a small town located in Pulaski County, Arkansas. It is situated in the foothills of the Ouachita Mountains, about 25 miles northwest of Little Rock. The town has a population of approximately 1,000 people and is known for its rural charm and friendly atmosphere.
History
The area that is now Natural Steps was first settled in the early 1800s by a group of settlers from Tennessee. The town was originally known as “Hickory Hill” and was a small farming community. In 1836, the town was renamed “Natural Steps” after a nearby waterfall. The town grew slowly over the years and by the early 1900s had a population of around 500 people.
In the early 20th century, the town began to experience a period of growth and development. The town was incorporated in 1912 and the first mayor was elected in 1913. During this time, the town saw the construction of a school, a post office, and a number of businesses.
Geography
Natural Steps is located in the foothills of the Ouachita Mountains in Pulaski County, Arkansas. The town is situated on the banks of the Little Maumelle River and is surrounded by rolling hills and forests. The town is located about 25 miles northwest of Little Rock and is accessible by Highway 10.
Economy
The economy of Natural Steps is largely based on agriculture and tourism. The town is home to a number of small farms that produce a variety of crops, including corn, soybeans, and cotton. The town also has a number of small businesses, including restaurants, shops, and a few bed and breakfasts.
Tourism is also an important part of the local economy. The town is home to a number of attractions, including the Natural Steps Waterfall, the Natural Steps Museum, and the Natural Steps Historic District. The town also hosts a number of festivals and events throughout the year, including the Natural Steps Music Festival and the Natural Steps Arts and Crafts Fair.
Demographics
As of the 2010 census, the population of Natural Steps was 1,000 people. The racial makeup of the town was 95.2% White, 1.2% African American, 0.7% Native American, 0.3% Asian, and 2.6% from other races. The median household income was $37,500 and the median age was 38.
Natural Steps is a small town with a rich history and a friendly atmosphere. The town is home to a number of attractions and businesses, and is a popular destination for tourists. The town is also home to a diverse population and is a great place to live and work.
Common Questions
What is the Total Population of Natural Steps?
Total Population of Natural Steps is 580.
What is the Total Male Population of Natural Steps?
Total Male Population of Natural Steps is 285.
What is the Total Female Population of Natural Steps?
Total Female Population of Natural Steps is 295.
What is the Ratio of Males per 100 Females in Natural Steps?
There are 96.61 Males per 100 Females in Natural Steps.
What is the Ratio of Females per 100 Males in Natural Steps?
There are 103.51 Females per 100 Males in Natural Steps.
What is the Median Population Age in Natural Steps?
Median Population Age in Natural Steps is 55.6 Years.
What is the Average Family Size in Natural Steps
Average Family Size in Natural Steps is 2.5 People.
What is the Average Household Size in Natural Steps
Average Household Size in Natural Steps is 2.2 People.
What is Per Capita Income in Natural Steps?
Per Capita income in Natural Steps is $82,194.
What is the Median Family Income in Natural Steps?
Median Family Income in Natural Steps is $147,250.
What is the Median Household income in Natural Steps?
Median Household Income in Natural Steps is $150,530.
What is Income or Wage Gap in Natural Steps?
Income or Wage Gap in Natural Steps is 53.9%.
Women in Natural Steps earn 46.1 cents for every dollar earned by a man.
What is Inequality or Gini Index in Natural Steps?
Inequality or Gini Index in Natural Steps is 0.47.
How Large is the Labor Force in Natural Steps?
There are 273 People in the Labor Forcein in Natural Steps.
What is the Percentage of People in the Labor Force in Natural Steps?
53.7% of People are in the Labor Force in Natural Steps.