Zip Codes with the Highest Percentage of Population Employed in Health Diagnosing & Treating in Little Rock, AR
RELATED REPORTS & OPTIONS
Health Diagnosing & Treating
Little Rock
Compare Zip Codes
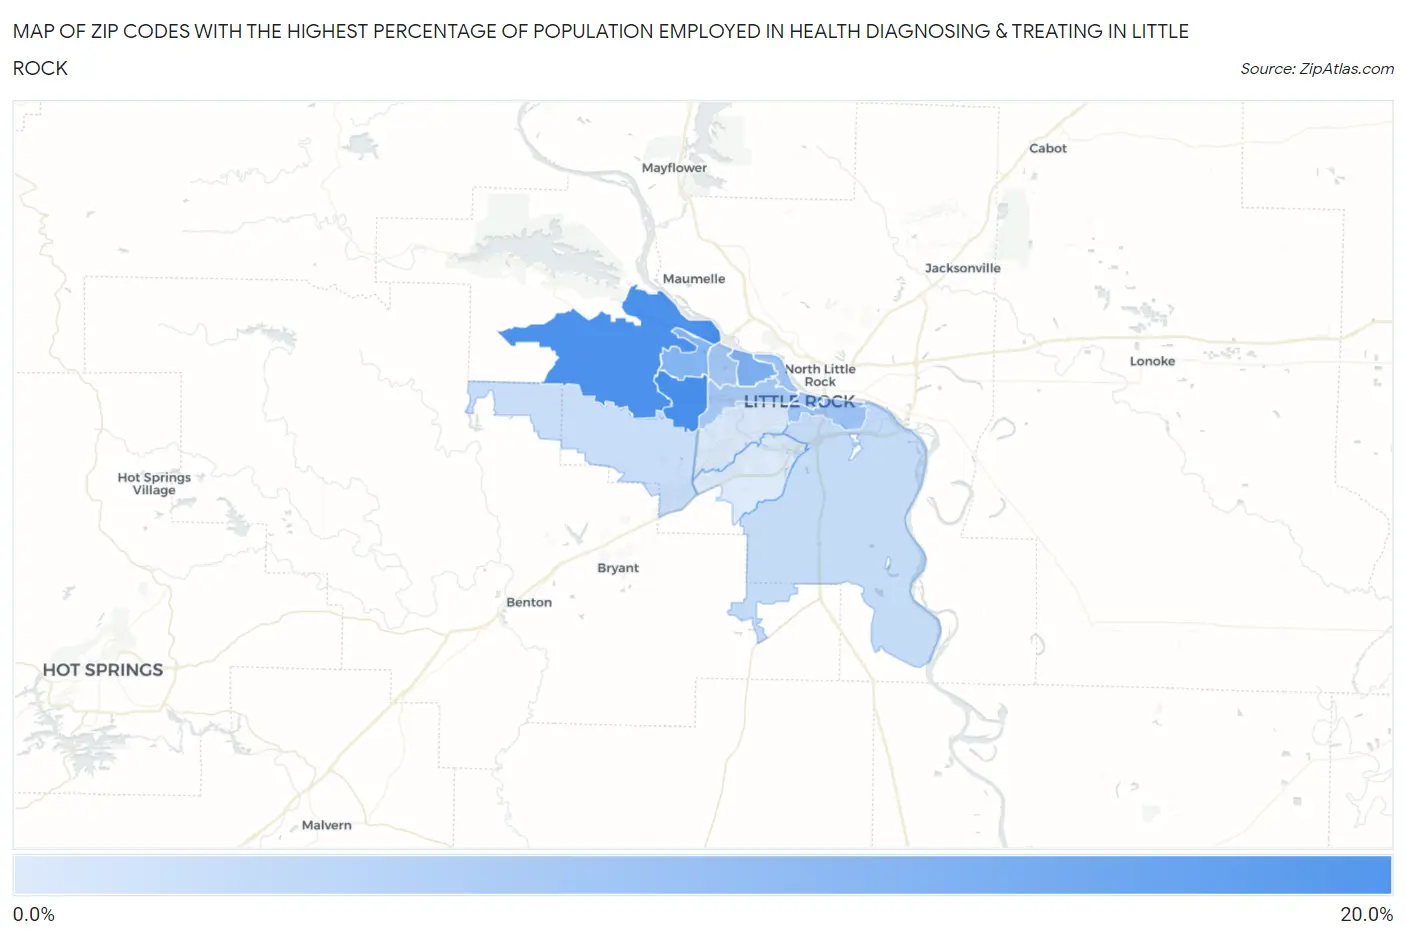
Map of Zip Codes with the Highest Percentage of Population Employed in Health Diagnosing & Treating in Little Rock
0.0%
20.0%
Zip Codes with the Highest Percentage of Population Employed in Health Diagnosing & Treating in Little Rock, AR
| Zip Code | % Employed | vs State | vs National | |
| 1. | 72211 | 17.3% | 7.2%(+10.1)#30 | 6.2%(+11.1)#783 |
| 2. | 72223 | 16.8% | 7.2%(+9.66)#31 | 6.2%(+10.6)#834 |
| 3. | 72207 | 12.9% | 7.2%(+5.67)#54 | 6.2%(+6.61)#1,800 |
| 4. | 72212 | 12.5% | 7.2%(+5.33)#57 | 6.2%(+6.27)#1,946 |
| 5. | 72202 | 10.3% | 7.2%(+3.08)#91 | 6.2%(+4.02)#3,574 |
| 6. | 72227 | 10.0% | 7.2%(+2.86)#96 | 6.2%(+3.79)#3,844 |
| 7. | 72201 | 10.0% | 7.2%(+2.82)#98 | 6.2%(+3.76)#3,891 |
| 8. | 72205 | 9.9% | 7.2%(+2.68)#101 | 6.2%(+3.61)#4,055 |
| 9. | 72206 | 7.3% | 7.2%(+0.137)#191 | 6.2%(+1.07)#9,376 |
| 10. | 72210 | 7.2% | 7.2%(+0.043)#196 | 6.2%(+0.977)#9,658 |
| 11. | 72204 | 5.7% | 7.2%(-1.45)#259 | 6.2%(-0.513)#14,867 |
| 12. | 72209 | 5.6% | 7.2%(-1.56)#266 | 6.2%(-0.624)#15,310 |
1
Common Questions
What are the Top 10 Zip Codes with the Highest Percentage of Population Employed in Health Diagnosing & Treating in Little Rock, AR?
Top 10 Zip Codes with the Highest Percentage of Population Employed in Health Diagnosing & Treating in Little Rock, AR are:
What zip code has the Highest Percentage of Population Employed in Health Diagnosing & Treating in Little Rock, AR?
72211 has the Highest Percentage of Population Employed in Health Diagnosing & Treating in Little Rock, AR with 17.3%.
What is the Percentage of Population Employed in Health Diagnosing & Treating in Little Rock, AR?
Percentage of Population Employed in Health Diagnosing & Treating in Little Rock is 10.7%.
What is the Percentage of Population Employed in Health Diagnosing & Treating in Arkansas?
Percentage of Population Employed in Health Diagnosing & Treating in Arkansas is 7.2%.
What is the Percentage of Population Employed in Health Diagnosing & Treating in the United States?
Percentage of Population Employed in Health Diagnosing & Treating in the United States is 6.2%.