Clinton, AR
Clinton Map
Clinton Overview
2,508
TOTAL POPULATION
1,125
MALE POPULATION
1,383
FEMALE POPULATION
81.34
MALES / 100 FEMALES
122.93
FEMALES / 100 MALES
46.8
MEDIAN AGE
3.1
AVG FAMILY SIZE
2.4
AVG HOUSEHOLD SIZE
$21,809
PER CAPITA INCOME
$60,203
AVG FAMILY INCOME
$42,292
AVG HOUSEHOLD INCOME
9.4%
WAGE / INCOME GAP [ % ]
90.6¢/ $1
WAGE / INCOME GAP [ $ ]
$8,628
FAMILY INCOME DEFICIT
0.40
INEQUALITY / GINI INDEX
941
LABOR FORCE [ PEOPLE ]
45.0%
PERCENT IN LABOR FORCE
2.6%
UNEMPLOYMENT RATE
Clinton Zip Codes
Clinton Area Codes
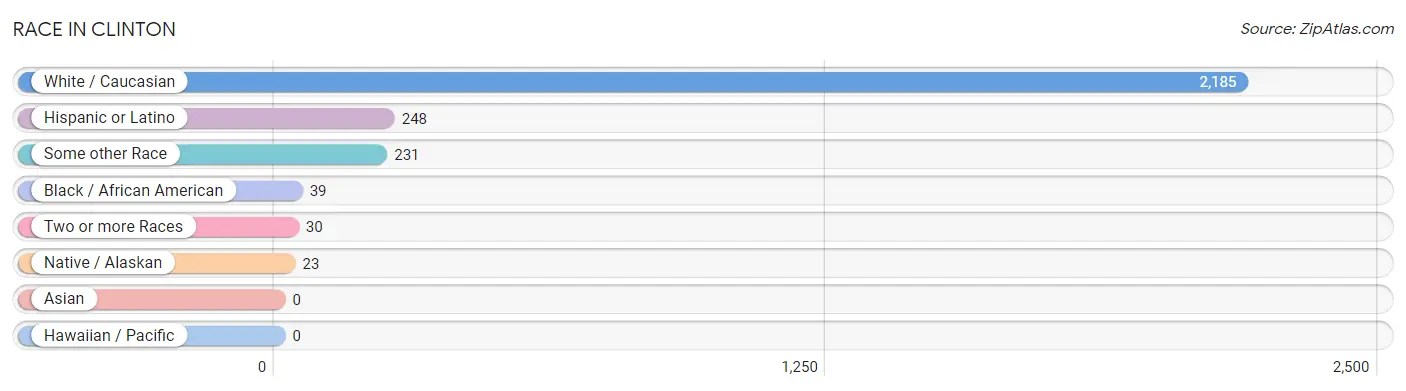
Race in Clinton
The most populous races in Clinton are White / Caucasian (2,185 | 87.1%), Hispanic or Latino (248 | 9.9%), and Some other Race (231 | 9.2%).
| Race | # Population | % Population |
| Asian | 0 | 0.0% |
| Black / African American | 39 | 1.6% |
| Hawaiian / Pacific | 0 | 0.0% |
| Hispanic or Latino | 248 | 9.9% |
| Native / Alaskan | 23 | 0.9% |
| White / Caucasian | 2,185 | 87.1% |
| Two or more Races | 30 | 1.2% |
| Some other Race | 231 | 9.2% |
| Total | 2,508 | 100.0% |
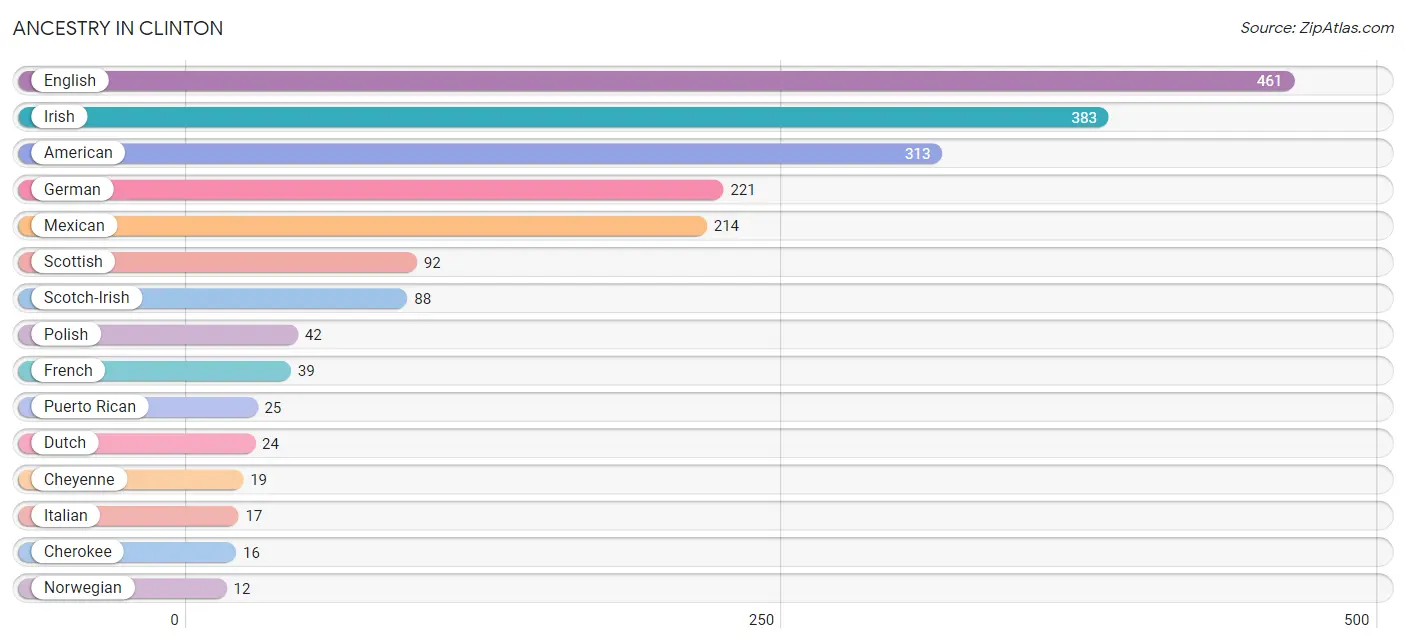
Ancestry in Clinton
The most populous ancestries reported in Clinton are English (461 | 18.4%), Irish (383 | 15.3%), American (313 | 12.5%), German (221 | 8.8%), and Mexican (214 | 8.5%), together accounting for 63.5% of all Clinton residents.
| Ancestry | # Population | % Population |
| American | 313 | 12.5% |
| Cajun | 4 | 0.2% |
| Central American | 9 | 0.4% |
| Cherokee | 16 | 0.6% |
| Cheyenne | 19 | 0.8% |
| Dutch | 24 | 1.0% |
| English | 461 | 18.4% |
| European | 6 | 0.2% |
| French | 39 | 1.6% |
| German | 221 | 8.8% |
| Irish | 383 | 15.3% |
| Italian | 17 | 0.7% |
| Mexican | 214 | 8.5% |
| Nicaraguan | 9 | 0.4% |
| Norwegian | 12 | 0.5% |
| Polish | 42 | 1.7% |
| Puerto Rican | 25 | 1.0% |
| Scandinavian | 4 | 0.2% |
| Scotch-Irish | 88 | 3.5% |
| Scottish | 92 | 3.7% |
| Swedish | 12 | 0.5% |
| Turkish | 6 | 0.2% | View All 22 Rows |
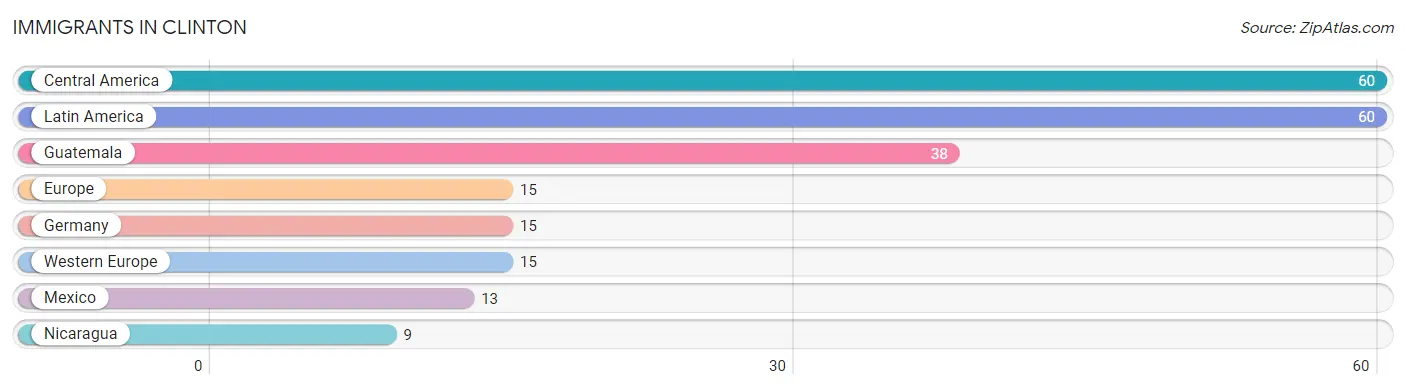
Immigrants in Clinton
The most numerous immigrant groups reported in Clinton came from Central America (60 | 2.4%), Latin America (60 | 2.4%), Guatemala (38 | 1.5%), Europe (15 | 0.6%), and Germany (15 | 0.6%), together accounting for 7.5% of all Clinton residents.
| Immigration Origin | # Population | % Population |
| Central America | 60 | 2.4% |
| Europe | 15 | 0.6% |
| Germany | 15 | 0.6% |
| Guatemala | 38 | 1.5% |
| Latin America | 60 | 2.4% |
| Mexico | 13 | 0.5% |
| Nicaragua | 9 | 0.4% |
| Western Europe | 15 | 0.6% | View All 8 Rows |
Sex and Age in Clinton
Sex and Age in Clinton
The most populous age groups in Clinton are 15 to 19 Years (120 | 10.7%) for men and 65 to 69 Years (172 | 12.4%) for women.
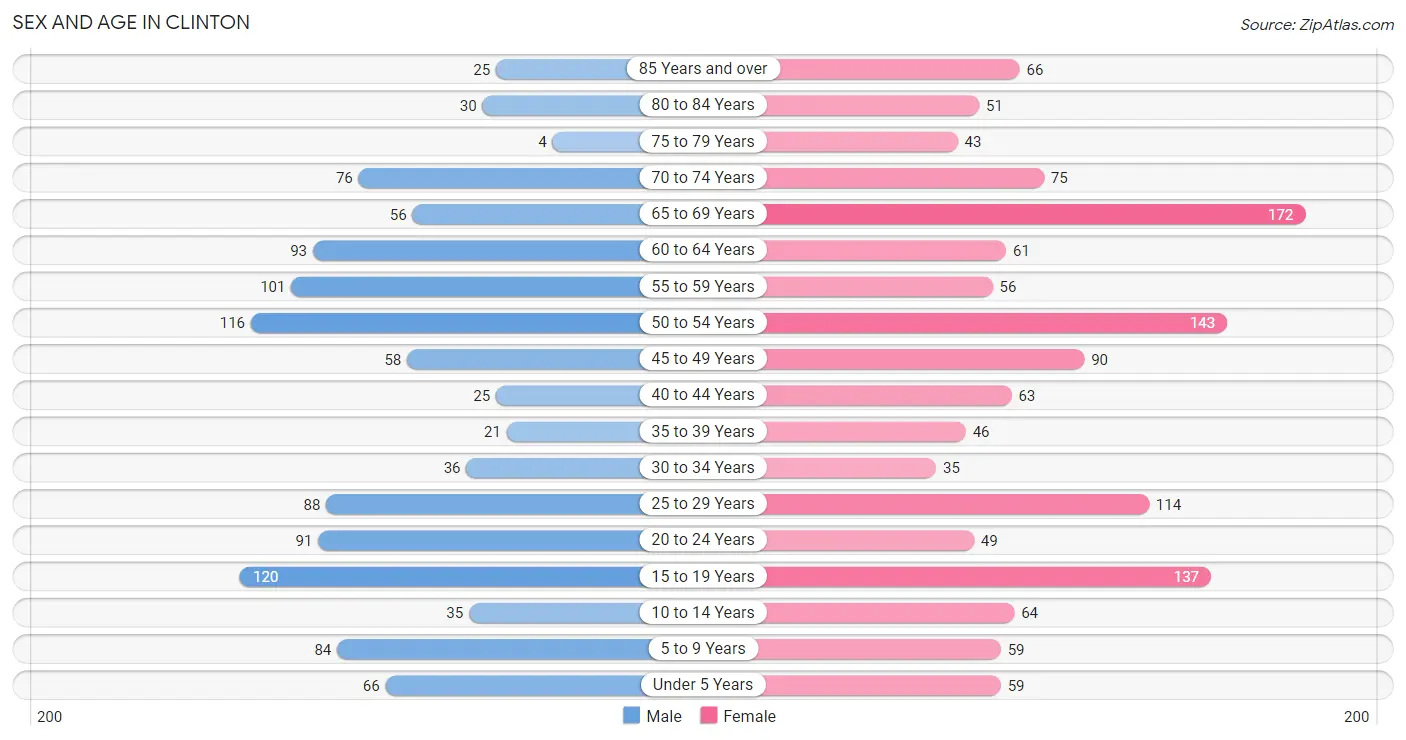
| Age Bracket | Male | Female |
| Under 5 Years | 66 (5.9%) | 59 (4.3%) |
| 5 to 9 Years | 84 (7.5%) | 59 (4.3%) |
| 10 to 14 Years | 35 (3.1%) | 64 (4.6%) |
| 15 to 19 Years | 120 (10.7%) | 137 (9.9%) |
| 20 to 24 Years | 91 (8.1%) | 49 (3.5%) |
| 25 to 29 Years | 88 (7.8%) | 114 (8.2%) |
| 30 to 34 Years | 36 (3.2%) | 35 (2.5%) |
| 35 to 39 Years | 21 (1.9%) | 46 (3.3%) |
| 40 to 44 Years | 25 (2.2%) | 63 (4.6%) |
| 45 to 49 Years | 58 (5.2%) | 90 (6.5%) |
| 50 to 54 Years | 116 (10.3%) | 143 (10.3%) |
| 55 to 59 Years | 101 (9.0%) | 56 (4.1%) |
| 60 to 64 Years | 93 (8.3%) | 61 (4.4%) |
| 65 to 69 Years | 56 (5.0%) | 172 (12.4%) |
| 70 to 74 Years | 76 (6.8%) | 75 (5.4%) |
| 75 to 79 Years | 4 (0.4%) | 43 (3.1%) |
| 80 to 84 Years | 30 (2.7%) | 51 (3.7%) |
| 85 Years and over | 25 (2.2%) | 66 (4.8%) |
| Total | 1,125 (100.0%) | 1,383 (100.0%) |
Families and Households in Clinton
Median Family Size in Clinton
The median family size in Clinton is 3.12 persons per family, with married-couple families (396 | 66.1%) accounting for the largest median family size of 3.15 persons per family. On the other hand, single male/father families (13 | 2.2%) represent the smallest median family size with 2.38 persons per family.
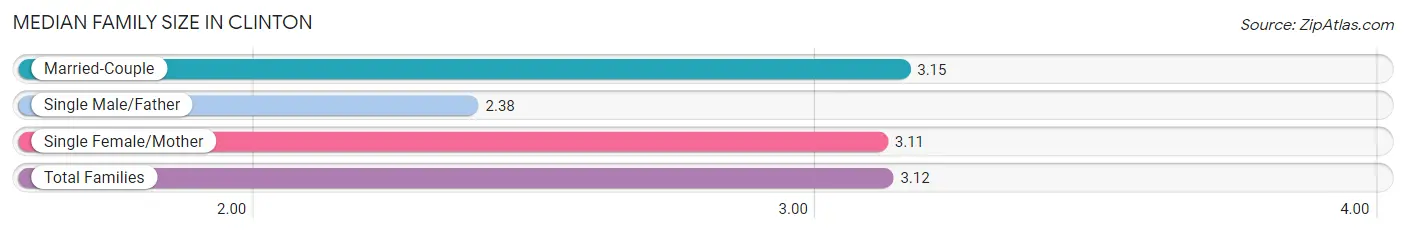
| Family Type | # Families | Family Size |
| Married-Couple | 396 (66.1%) | 3.15 |
| Single Male/Father | 13 (2.2%) | 2.38 |
| Single Female/Mother | 190 (31.7%) | 3.11 |
| Total Families | 599 (100.0%) | 3.12 |
Median Household Size in Clinton
The median household size in Clinton is 2.38 persons per household, with single female/mother households (190 | 19.3%) accounting for the largest median household size of 3.32 persons per household. non-family households (388 | 39.3%) represent the smallest median household size with 1.12 persons per household.
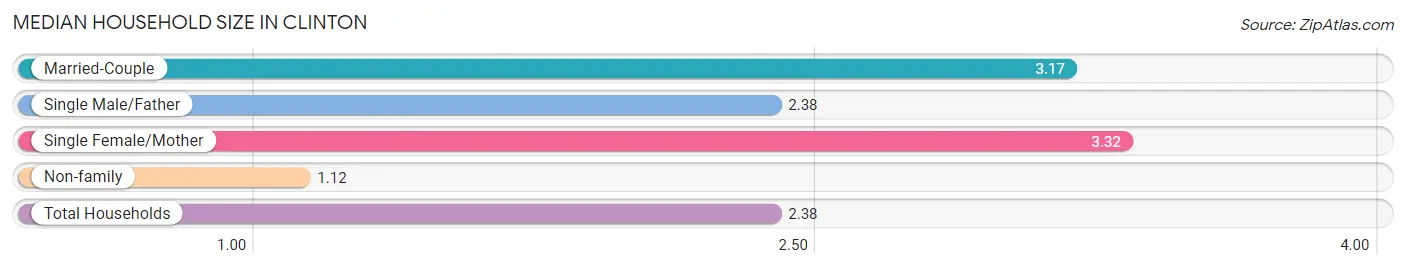
| Household Type | # Households | Household Size |
| Married-Couple | 396 (40.1%) | 3.17 |
| Single Male/Father | 13 (1.3%) | 2.38 |
| Single Female/Mother | 190 (19.3%) | 3.32 |
| Non-family | 388 (39.3%) | 1.12 |
| Total Households | 987 (100.0%) | 2.38 |
Household Size by Marriage Status in Clinton
Out of a total of 987 households in Clinton, 599 (60.7%) are family households, while 388 (39.3%) are nonfamily households. The most numerous type of family households are 2-person households, comprising 328, and the most common type of nonfamily households are 1-person households, comprising 368.
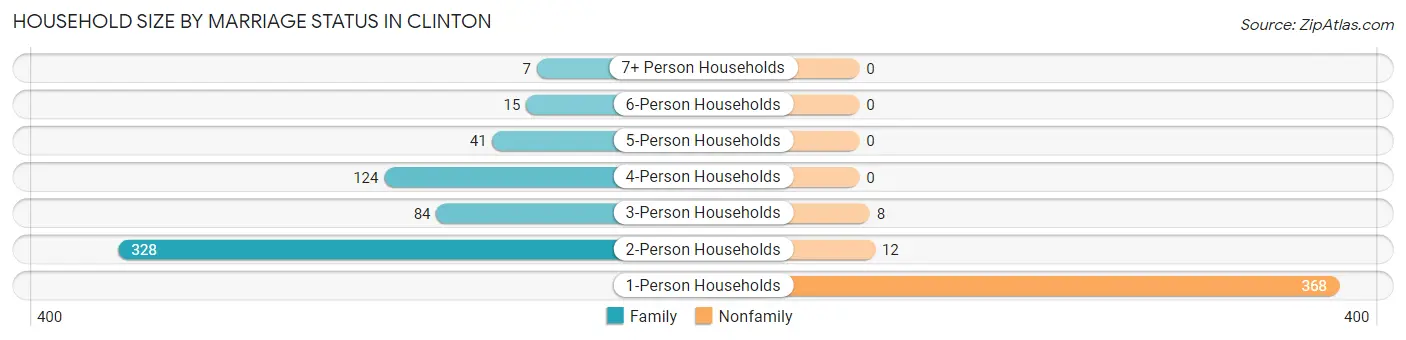
| Household Size | Family Households | Nonfamily Households |
| 1-Person Households | - | 368 (37.3%) |
| 2-Person Households | 328 (33.2%) | 12 (1.2%) |
| 3-Person Households | 84 (8.5%) | 8 (0.8%) |
| 4-Person Households | 124 (12.6%) | 0 (0.0%) |
| 5-Person Households | 41 (4.2%) | 0 (0.0%) |
| 6-Person Households | 15 (1.5%) | 0 (0.0%) |
| 7+ Person Households | 7 (0.7%) | 0 (0.0%) |
| Total | 599 (60.7%) | 388 (39.3%) |
Female Fertility in Clinton
Fertility by Age in Clinton
Average fertility rate in Clinton is 44.0 births per 1,000 women. Women in the age bracket of 20 to 34 years have the highest fertility rate with 126.0 births per 1,000 women. Women in the age bracket of 20 to 34 years acount for 100.0% of all women with births.
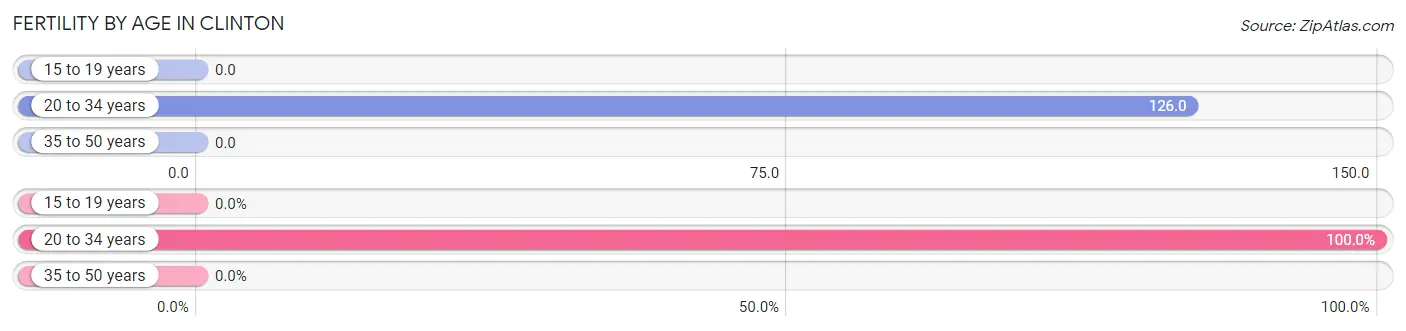
| Age Bracket | Women with Births | Births / 1,000 Women |
| 15 to 19 years | 0 (0.0%) | 0.0 |
| 20 to 34 years | 25 (100.0%) | 126.0 |
| 35 to 50 years | 0 (0.0%) | 0.0 |
| Total | 25 (100.0%) | 44.0 |
Fertility by Age by Marriage Status in Clinton
20.0% of women with births (25) in Clinton are married. The highest percentage of unmarried women with births falls into 20 to 34 years age bracket with 80.0% of them unmarried at the time of birth, while the lowest percentage of unmarried women with births belong to 20 to 34 years age bracket with 80.0% of them unmarried.
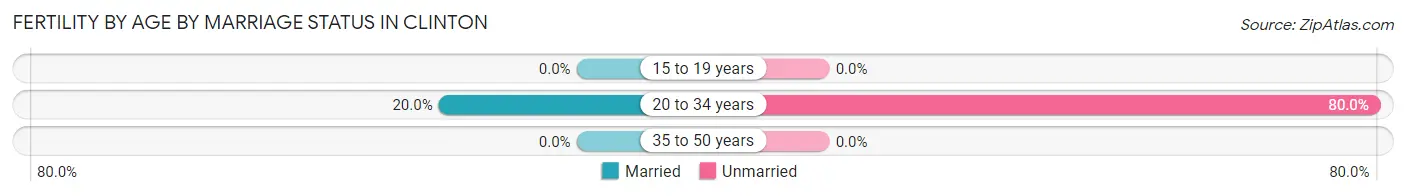
| Age Bracket | Married | Unmarried |
| 15 to 19 years | 0 (0.0%) | 0 (0.0%) |
| 20 to 34 years | 5 (20.0%) | 20 (80.0%) |
| 35 to 50 years | 0 (0.0%) | 0 (0.0%) |
| Total | 5 (20.0%) | 20 (80.0%) |
Fertility by Education in Clinton
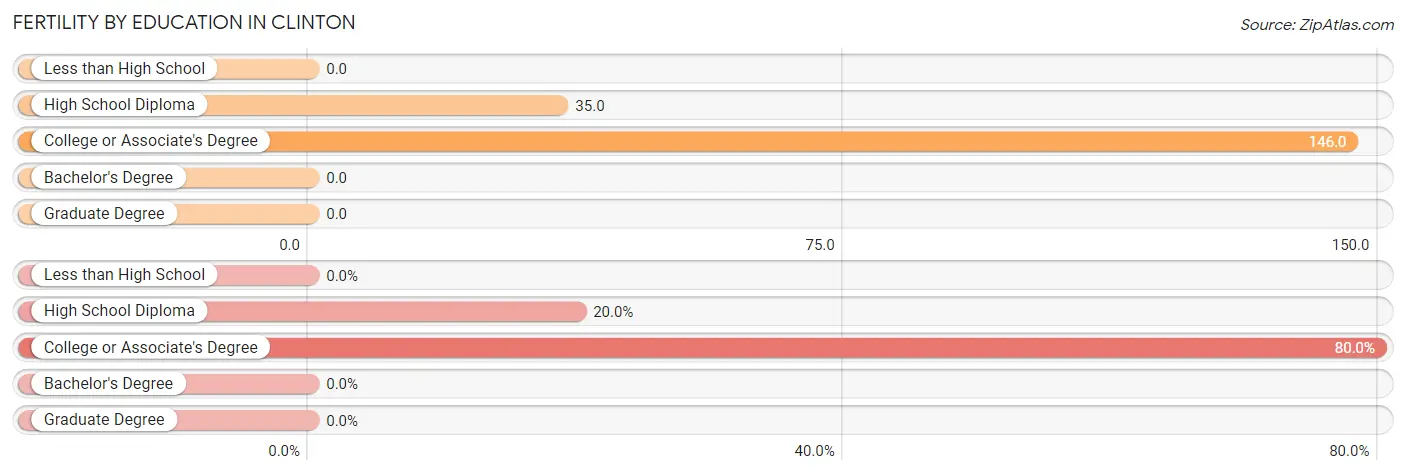
| Educational Attainment | Women with Births | Births / 1,000 Women |
| Less than High School | 0 (0.0%) | 0.0 |
| High School Diploma | 5 (20.0%) | 35.0 |
| College or Associate's Degree | 20 (80.0%) | 146.0 |
| Bachelor's Degree | 0 (0.0%) | 0.0 |
| Graduate Degree | 0 (0.0%) | 0.0 |
| Total | 25 (100.0%) | 44.0 |
Fertility by Education by Marriage Status in Clinton
80.0% of women with births in Clinton are unmarried. Women with the educational attainment of high school diploma are most likely to be married with 100.0% of them married at childbirth, while women with the educational attainment of college or associate's degree are least likely to be married with 100.0% of them unmarried at childbirth.
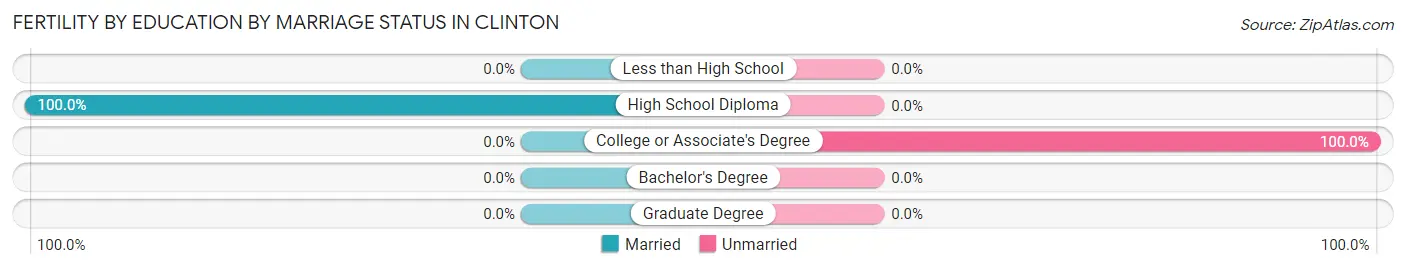
| Educational Attainment | Married | Unmarried |
| Less than High School | 0 (0.0%) | 0 (0.0%) |
| High School Diploma | 5 (100.0%) | 0 (0.0%) |
| College or Associate's Degree | 0 (0.0%) | 20 (100.0%) |
| Bachelor's Degree | 0 (0.0%) | 0 (0.0%) |
| Graduate Degree | 0 (0.0%) | 0 (0.0%) |
| Total | 5 (20.0%) | 20 (80.0%) |
Income in Clinton
Income Overview in Clinton
Per Capita Income in Clinton is $21,809, while median incomes of families and households are $60,203 and $42,292 respectively.
| Characteristic | Number | Measure |
| Per Capita Income | 2,508 | $21,809 |
| Median Family Income | 599 | $60,203 |
| Mean Family Income | 599 | $63,414 |
| Median Household Income | 987 | $42,292 |
| Mean Household Income | 987 | $51,642 |
| Income Deficit | 599 | $8,628 |
| Wage / Income Gap (%) | 2,508 | 9.43% |
| Wage / Income Gap ($) | 2,508 | 90.57¢ per $1 |
| Gini / Inequality Index | 2,508 | 0.40 |
Earnings by Sex in Clinton
Average Earnings in Clinton are $31,925, $32,647 for men and $29,567 for women, a difference of 9.4%.
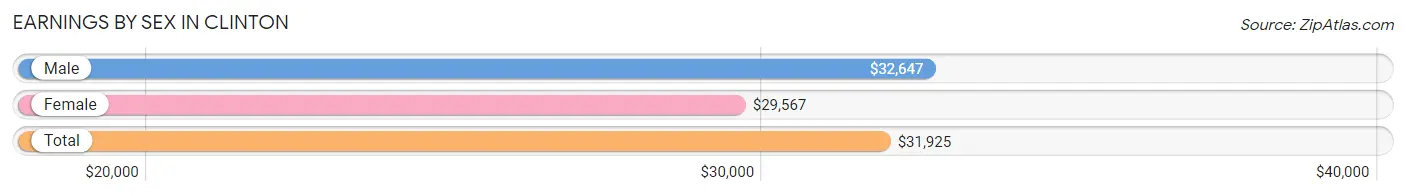
| Sex | Number | Average Earnings |
| Male | 448 (45.6%) | $32,647 |
| Female | 535 (54.4%) | $29,567 |
| Total | 983 (100.0%) | $31,925 |
Earnings by Sex by Income Bracket in Clinton
The most common earnings brackets in Clinton are $30,000 to $34,999 for men (85 | 19.0%) and $40,000 to $44,999 for women (70 | 13.1%).
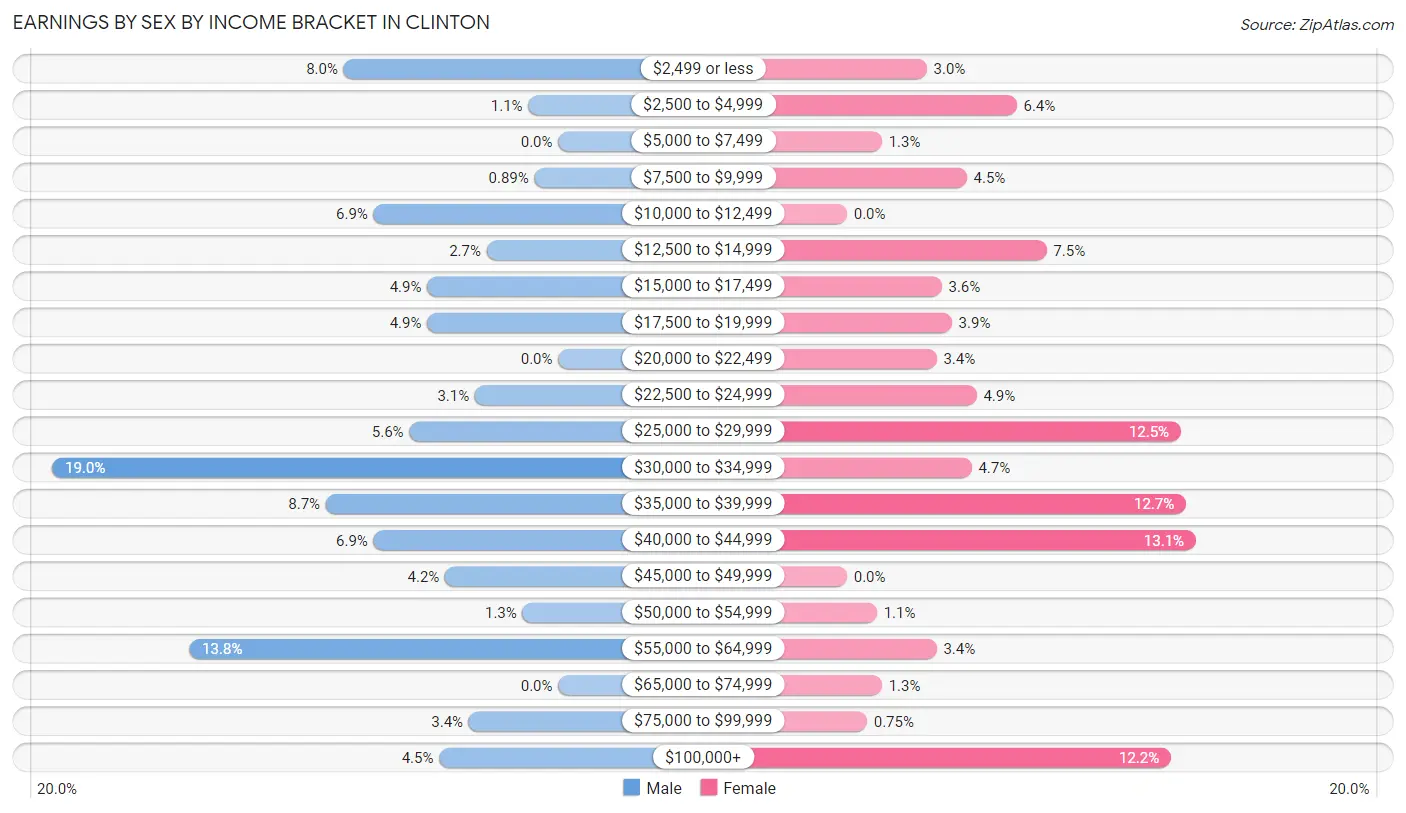
| Income | Male | Female |
| $2,499 or less | 36 (8.0%) | 16 (3.0%) |
| $2,500 to $4,999 | 5 (1.1%) | 34 (6.4%) |
| $5,000 to $7,499 | 0 (0.0%) | 7 (1.3%) |
| $7,500 to $9,999 | 4 (0.9%) | 24 (4.5%) |
| $10,000 to $12,499 | 31 (6.9%) | 0 (0.0%) |
| $12,500 to $14,999 | 12 (2.7%) | 40 (7.5%) |
| $15,000 to $17,499 | 22 (4.9%) | 19 (3.5%) |
| $17,500 to $19,999 | 22 (4.9%) | 21 (3.9%) |
| $20,000 to $22,499 | 0 (0.0%) | 18 (3.4%) |
| $22,500 to $24,999 | 14 (3.1%) | 26 (4.9%) |
| $25,000 to $29,999 | 25 (5.6%) | 67 (12.5%) |
| $30,000 to $34,999 | 85 (19.0%) | 25 (4.7%) |
| $35,000 to $39,999 | 39 (8.7%) | 68 (12.7%) |
| $40,000 to $44,999 | 31 (6.9%) | 70 (13.1%) |
| $45,000 to $49,999 | 19 (4.2%) | 0 (0.0%) |
| $50,000 to $54,999 | 6 (1.3%) | 6 (1.1%) |
| $55,000 to $64,999 | 62 (13.8%) | 18 (3.4%) |
| $65,000 to $74,999 | 0 (0.0%) | 7 (1.3%) |
| $75,000 to $99,999 | 15 (3.4%) | 4 (0.7%) |
| $100,000+ | 20 (4.5%) | 65 (12.1%) |
| Total | 448 (100.0%) | 535 (100.0%) |
Earnings by Sex by Educational Attainment in Clinton
Average earnings in Clinton are $35,641 for men and $34,038 for women, a difference of 4.5%. Men with an educational attainment of bachelor's degree enjoy the highest average annual earnings of $43,611, while those with college or associate's degree education earn the least with $35,795. Women with an educational attainment of bachelor's degree earn the most with the average annual earnings of $103,308, while those with high school diploma education have the smallest earnings of $26,071.
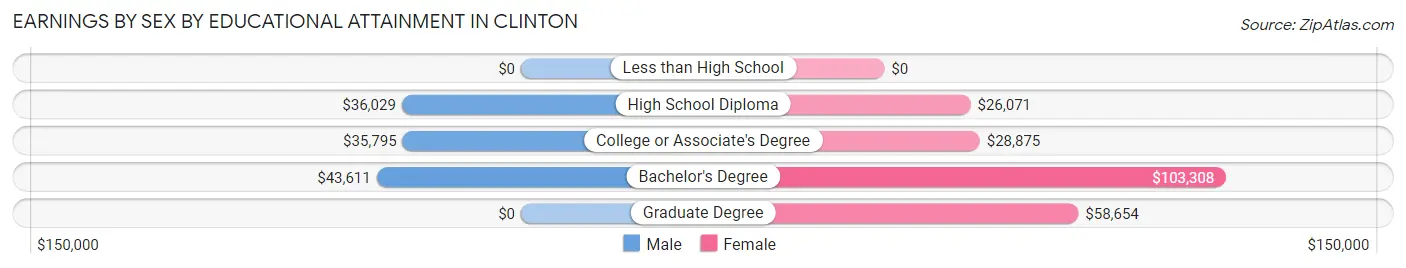
| Educational Attainment | Male Income | Female Income |
| Less than High School | - | - |
| High School Diploma | $36,029 | $26,071 |
| College or Associate's Degree | $35,795 | $28,875 |
| Bachelor's Degree | $43,611 | $103,308 |
| Graduate Degree | - | - |
| Total | $35,641 | $34,038 |
Family Income in Clinton
Family Income Brackets in Clinton
According to the Clinton family income data, there are 178 families falling into the $50,000 to $74,999 income range, which is the most common income bracket and makes up 29.7% of all families. Conversely, the $200,000+ income bracket is the least frequent group with only 6 families (1.0%) belonging to this category.
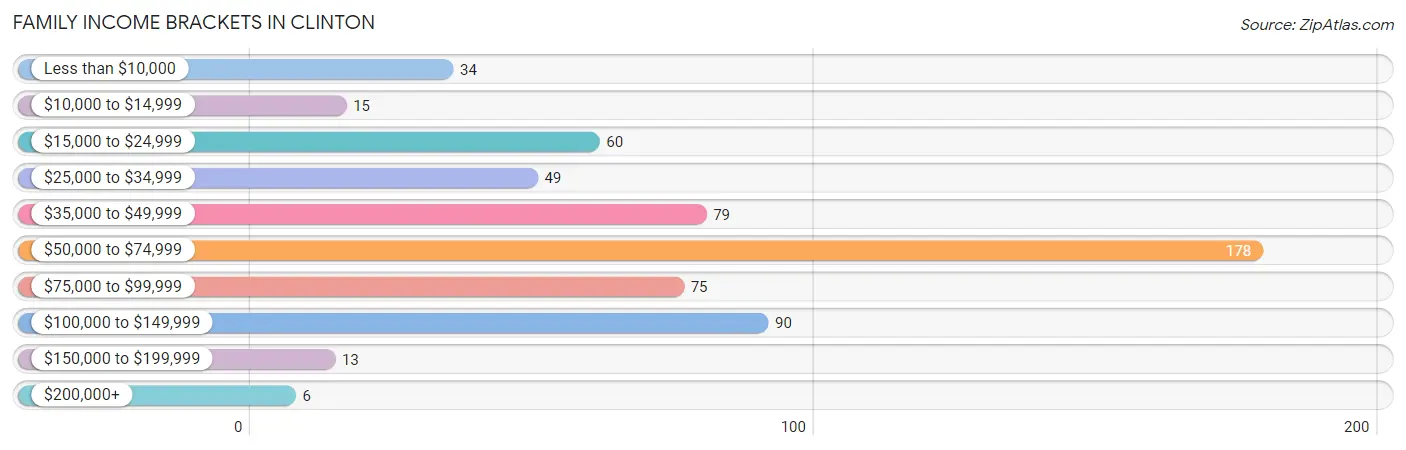
| Income Bracket | # Families | % Families |
| Less than $10,000 | 34 | 5.7% |
| $10,000 to $14,999 | 15 | 2.5% |
| $15,000 to $24,999 | 60 | 10.0% |
| $25,000 to $34,999 | 49 | 8.2% |
| $35,000 to $49,999 | 79 | 13.2% |
| $50,000 to $74,999 | 178 | 29.7% |
| $75,000 to $99,999 | 75 | 12.5% |
| $100,000 to $149,999 | 90 | 15.0% |
| $150,000 to $199,999 | 13 | 2.2% |
| $200,000+ | 6 | 1.0% |
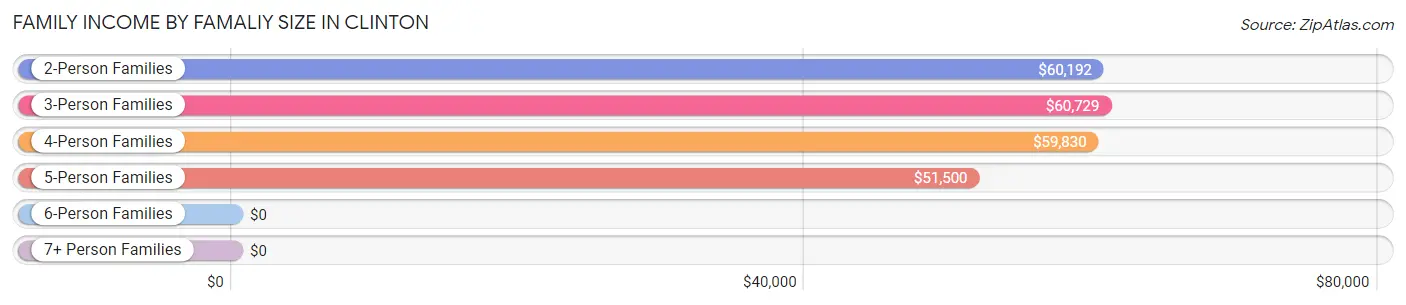
Family Income by Famaliy Size in Clinton
3-person families (85 | 14.2%) account for the highest median family income in Clinton with $60,729 per family, while 2-person families (342 | 57.1%) have the highest median income of $30,096 per family member.
| Income Bracket | # Families | Median Income |
| 2-Person Families | 342 (57.1%) | $60,192 |
| 3-Person Families | 85 (14.2%) | $60,729 |
| 4-Person Families | 109 (18.2%) | $59,830 |
| 5-Person Families | 46 (7.7%) | $51,500 |
| 6-Person Families | 10 (1.7%) | $0 |
| 7+ Person Families | 7 (1.2%) | $0 |
| Total | 599 (100.0%) | $60,203 |
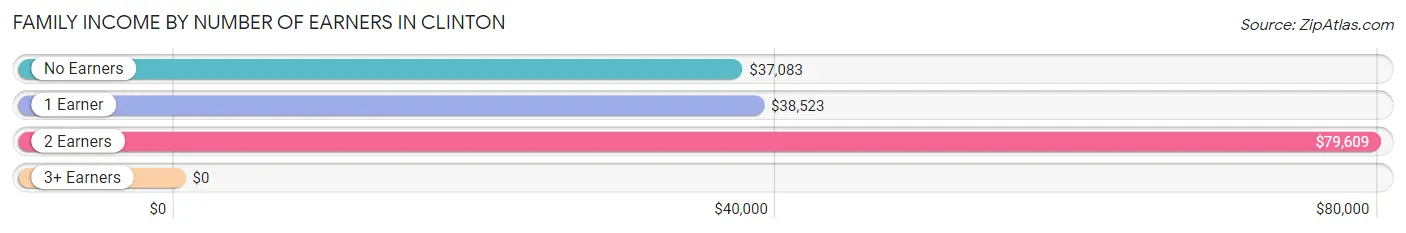
Family Income by Number of Earners in Clinton
| Number of Earners | # Families | Median Income |
| No Earners | 141 (23.5%) | $37,083 |
| 1 Earner | 171 (28.5%) | $38,523 |
| 2 Earners | 265 (44.2%) | $79,609 |
| 3+ Earners | 22 (3.7%) | $0 |
| Total | 599 (100.0%) | $60,203 |
Household Income in Clinton
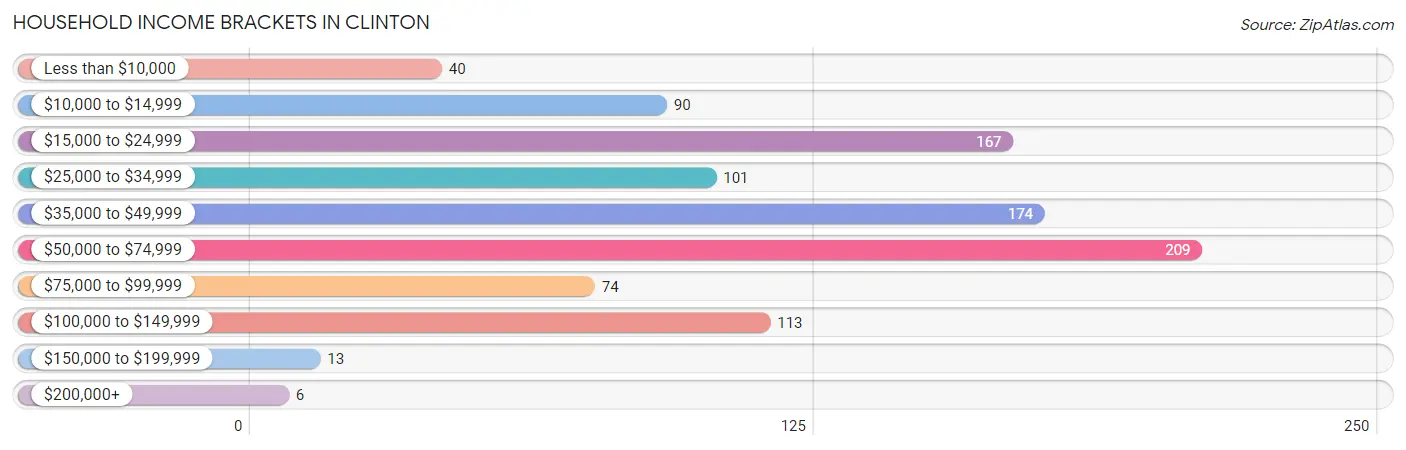
Household Income Brackets in Clinton
With 209 households falling in the category, the $50,000 to $74,999 income range is the most frequent in Clinton, accounting for 21.2% of all households. In contrast, only 6 households (0.6%) fall into the $200,000+ income bracket, making it the least populous group.
| Income Bracket | # Households | % Households |
| Less than $10,000 | 40 | 4.1% |
| $10,000 to $14,999 | 90 | 9.1% |
| $15,000 to $24,999 | 167 | 16.9% |
| $25,000 to $34,999 | 101 | 10.2% |
| $35,000 to $49,999 | 174 | 17.6% |
| $50,000 to $74,999 | 209 | 21.2% |
| $75,000 to $99,999 | 74 | 7.5% |
| $100,000 to $149,999 | 113 | 11.4% |
| $150,000 to $199,999 | 13 | 1.3% |
| $200,000+ | 6 | 0.6% |
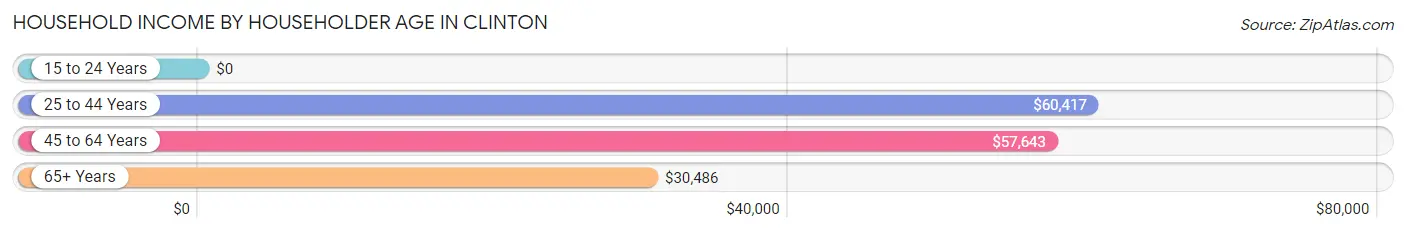
Household Income by Householder Age in Clinton
The median household income in Clinton is $42,292, with the highest median household income of $60,417 found in the 25 to 44 years age bracket for the primary householder. A total of 224 households (22.7%) fall into this category.
| Income Bracket | # Households | Median Income |
| 15 to 24 Years | 0 (0.0%) | $0 |
| 25 to 44 Years | 224 (22.7%) | $60,417 |
| 45 to 64 Years | 402 (40.7%) | $57,643 |
| 65+ Years | 361 (36.6%) | $30,486 |
| Total | 987 (100.0%) | $42,292 |
Poverty in Clinton
Income Below Poverty by Sex and Age in Clinton
With 19.5% poverty level for males and 26.7% for females among the residents of Clinton, under 5 year old males and 6 to 11 year old females are the most vulnerable to poverty, with 48 males (72.7%) and 63 females (71.6%) in their respective age groups living below the poverty level.
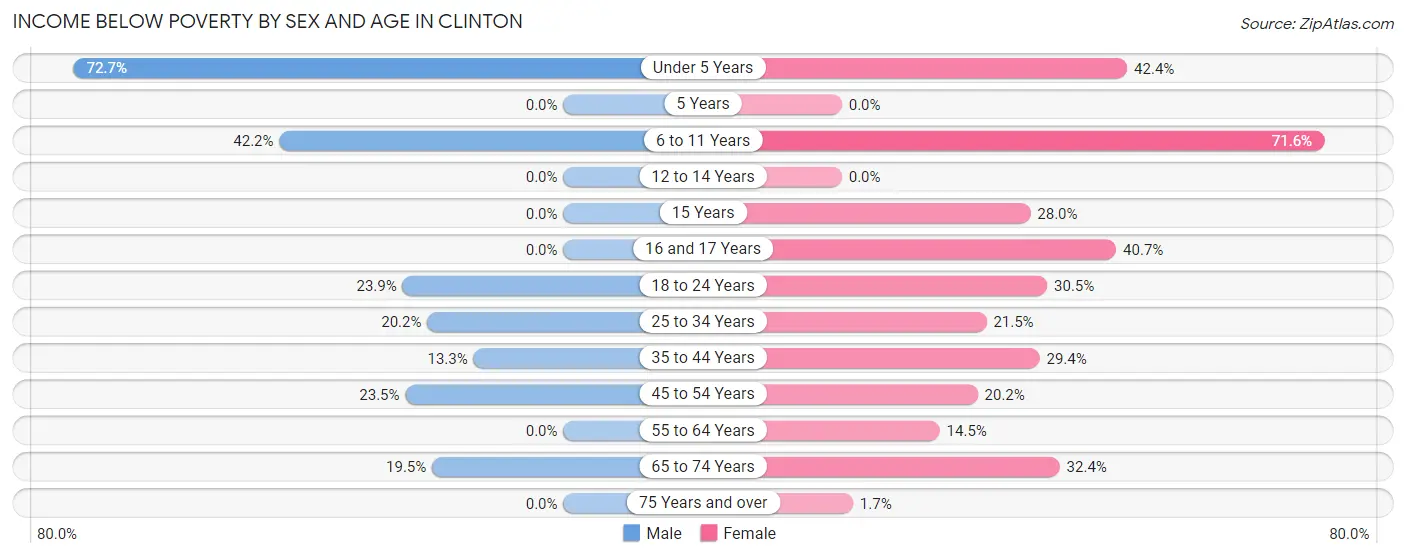
| Age Bracket | Male | Female |
| Under 5 Years | 48 (72.7%) | 25 (42.4%) |
| 5 Years | 0 (0.0%) | 0 (0.0%) |
| 6 to 11 Years | 35 (42.2%) | 63 (71.6%) |
| 12 to 14 Years | 0 (0.0%) | 0 (0.0%) |
| 15 Years | 0 (0.0%) | 14 (28.0%) |
| 16 and 17 Years | 0 (0.0%) | 22 (40.7%) |
| 18 to 24 Years | 32 (23.9%) | 25 (30.5%) |
| 25 to 34 Years | 20 (20.2%) | 32 (21.5%) |
| 35 to 44 Years | 6 (13.3%) | 32 (29.4%) |
| 45 to 54 Years | 38 (23.5%) | 47 (20.2%) |
| 55 to 64 Years | 0 (0.0%) | 17 (14.5%) |
| 65 to 74 Years | 23 (19.5%) | 77 (32.4%) |
| 75 Years and over | 0 (0.0%) | 2 (1.7%) |
| Total | 202 (19.5%) | 356 (26.7%) |
Income Above Poverty by Sex and Age in Clinton
According to the poverty statistics in Clinton, males aged 5 years and females aged 5 years are the age groups that are most secure financially, with 100.0% of males and 100.0% of females in these age groups living above the poverty line.
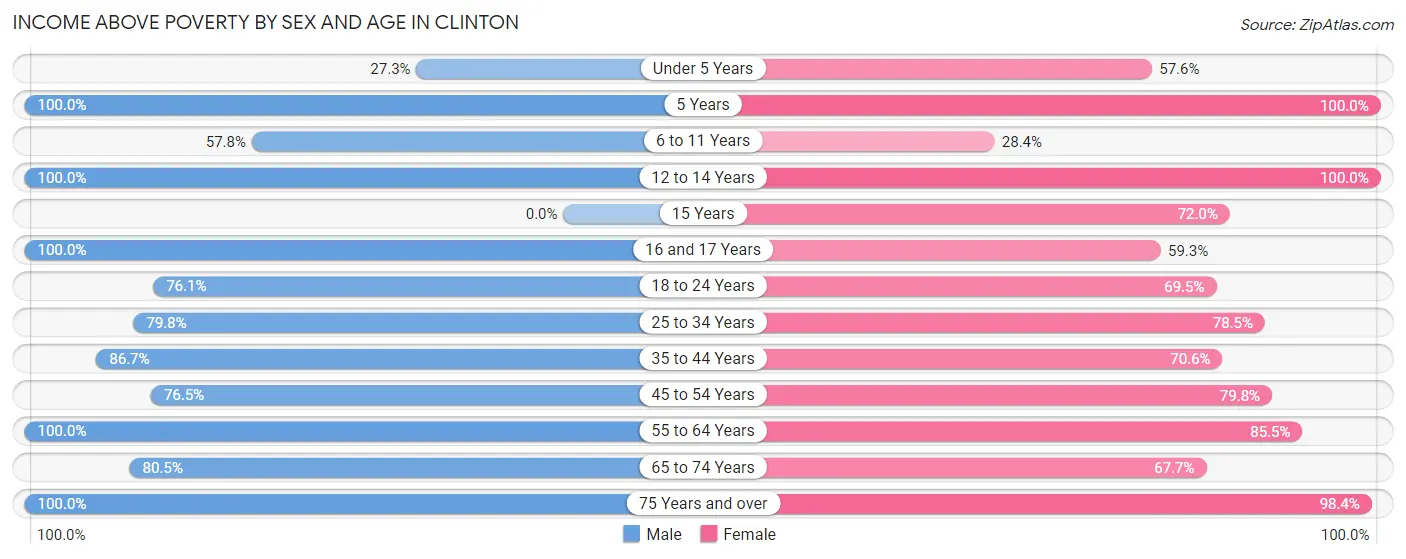
| Age Bracket | Male | Female |
| Under 5 Years | 18 (27.3%) | 34 (57.6%) |
| 5 Years | 23 (100.0%) | 3 (100.0%) |
| 6 to 11 Years | 48 (57.8%) | 25 (28.4%) |
| 12 to 14 Years | 13 (100.0%) | 32 (100.0%) |
| 15 Years | 0 (0.0%) | 36 (72.0%) |
| 16 and 17 Years | 77 (100.0%) | 32 (59.3%) |
| 18 to 24 Years | 102 (76.1%) | 57 (69.5%) |
| 25 to 34 Years | 79 (79.8%) | 117 (78.5%) |
| 35 to 44 Years | 39 (86.7%) | 77 (70.6%) |
| 45 to 54 Years | 124 (76.5%) | 186 (79.8%) |
| 55 to 64 Years | 174 (100.0%) | 100 (85.5%) |
| 65 to 74 Years | 95 (80.5%) | 161 (67.6%) |
| 75 Years and over | 44 (100.0%) | 119 (98.4%) |
| Total | 836 (80.5%) | 979 (73.3%) |
Income Below Poverty Among Married-Couple Families in Clinton
The poverty statistics for married-couple families in Clinton show that 13.4% or 53 of the total 396 families live below the poverty line. Families with no children have the highest poverty rate of 14.0%, comprising of 37 families. On the other hand, families with 3 or 4 children have the lowest poverty rate of 0.0%, which includes 0 families.
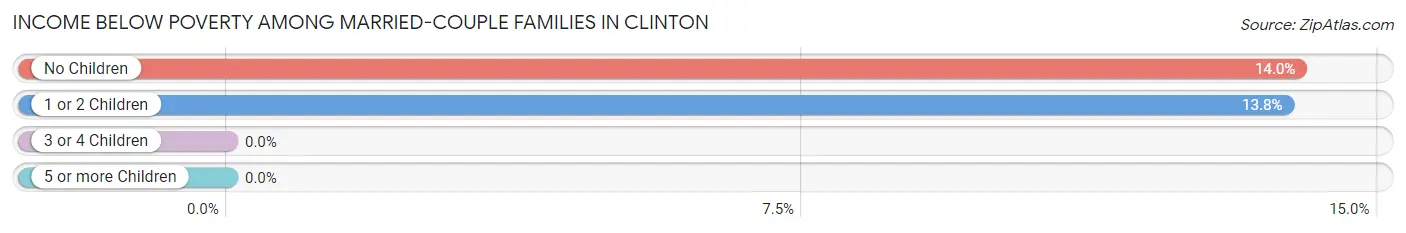
| Children | Above Poverty | Below Poverty |
| No Children | 228 (86.0%) | 37 (14.0%) |
| 1 or 2 Children | 100 (86.2%) | 16 (13.8%) |
| 3 or 4 Children | 15 (100.0%) | 0 (0.0%) |
| 5 or more Children | 0 (0.0%) | 0 (0.0%) |
| Total | 343 (86.6%) | 53 (13.4%) |
Income Below Poverty Among Single-Parent Households in Clinton
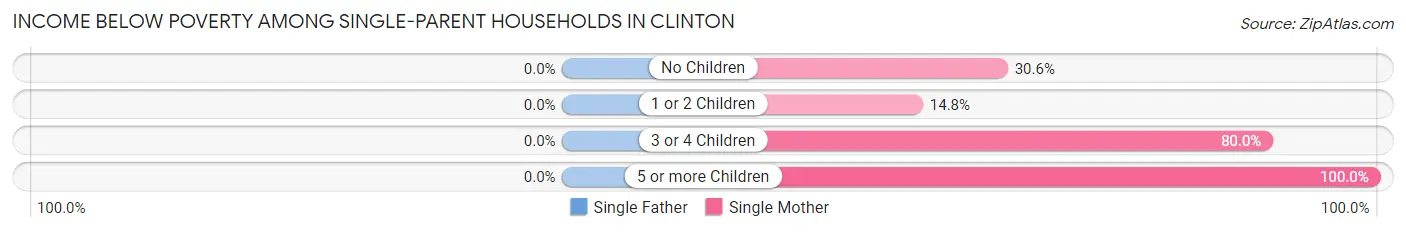
| Children | Single Father | Single Mother |
| No Children | 0 (0.0%) | 11 (30.6%) |
| 1 or 2 Children | 0 (0.0%) | 18 (14.7%) |
| 3 or 4 Children | 0 (0.0%) | 20 (80.0%) |
| 5 or more Children | 0 (0.0%) | 7 (100.0%) |
| Total | 0 (0.0%) | 56 (29.5%) |
Income Below Poverty Among Married-Couple vs Single-Parent Households in Clinton
The poverty data for Clinton shows that 53 of the married-couple family households (13.4%) and 56 of the single-parent households (27.6%) are living below the poverty level. Within the married-couple family households, those with no children have the highest poverty rate, with 37 households (14.0%) falling below the poverty line. Among the single-parent households, those with 5 or more children have the highest poverty rate, with 7 household (100.0%) living below poverty.
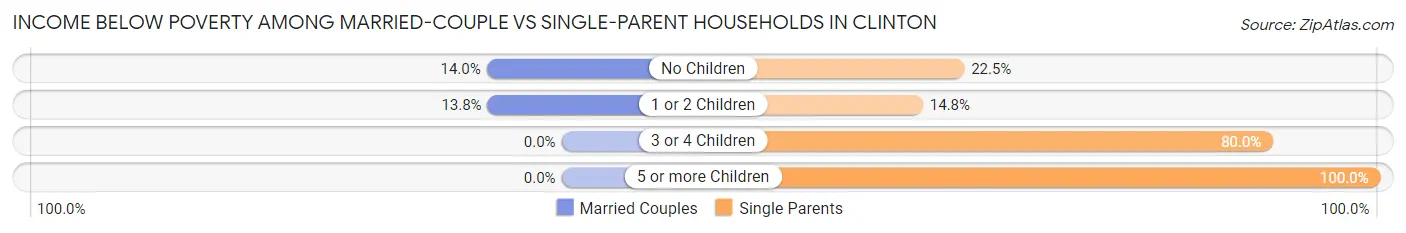
| Children | Married-Couple Families | Single-Parent Households |
| No Children | 37 (14.0%) | 11 (22.5%) |
| 1 or 2 Children | 16 (13.8%) | 18 (14.7%) |
| 3 or 4 Children | 0 (0.0%) | 20 (80.0%) |
| 5 or more Children | 0 (0.0%) | 7 (100.0%) |
| Total | 53 (13.4%) | 56 (27.6%) |
Employment Characteristics in Clinton
Employment by Class of Employer in Clinton
Among the 917 employed individuals in Clinton, private company employees (682 | 74.4%), local government employees (74 | 8.1%), and not-for-profit organizations (73 | 8.0%) make up the most common classes of employment.
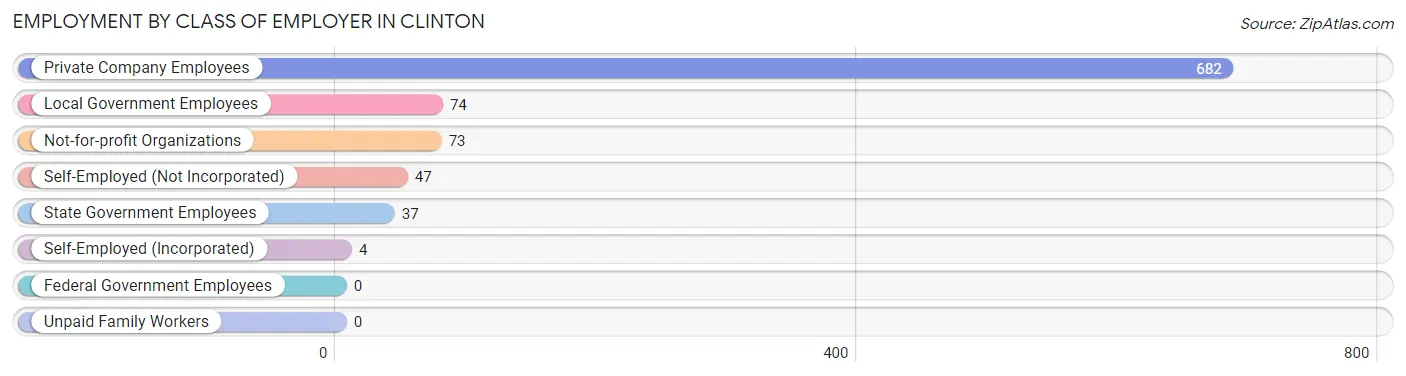
| Employer Class | # Employees | % Employees |
| Private Company Employees | 682 | 74.4% |
| Self-Employed (Incorporated) | 4 | 0.4% |
| Self-Employed (Not Incorporated) | 47 | 5.1% |
| Not-for-profit Organizations | 73 | 8.0% |
| Local Government Employees | 74 | 8.1% |
| State Government Employees | 37 | 4.0% |
| Federal Government Employees | 0 | 0.0% |
| Unpaid Family Workers | 0 | 0.0% |
| Total | 917 | 100.0% |
Employment Status by Age in Clinton
According to the labor force statistics for Clinton, out of the total population over 16 years of age (2,091), 45.0% or 941 individuals are in the labor force, with 2.6% or 24 of them unemployed. The age group with the highest labor force participation rate is 30 to 34 years, with 88.7% or 63 individuals in the labor force. Within the labor force, the 16 to 19 years age range has the highest percentage of unemployed individuals, with 30.0% or 24 of them being unemployed.
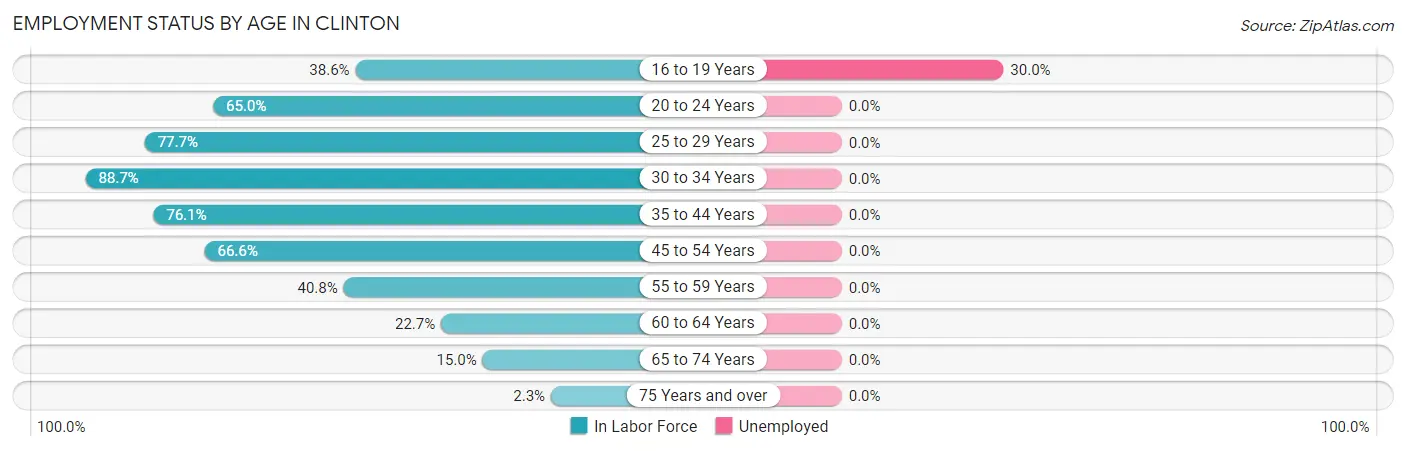
| Age Bracket | In Labor Force | Unemployed |
| 16 to 19 Years | 80 (38.6%) | 24 (30.0%) |
| 20 to 24 Years | 91 (65.0%) | 0 (0.0%) |
| 25 to 29 Years | 157 (77.7%) | 0 (0.0%) |
| 30 to 34 Years | 63 (88.7%) | 0 (0.0%) |
| 35 to 44 Years | 118 (76.1%) | 0 (0.0%) |
| 45 to 54 Years | 271 (66.6%) | 0 (0.0%) |
| 55 to 59 Years | 64 (40.8%) | 0 (0.0%) |
| 60 to 64 Years | 35 (22.7%) | 0 (0.0%) |
| 65 to 74 Years | 57 (15.0%) | 0 (0.0%) |
| 75 Years and over | 5 (2.3%) | 0 (0.0%) |
| Total | 941 (45.0%) | 24 (2.6%) |
Employment Status by Educational Attainment in Clinton
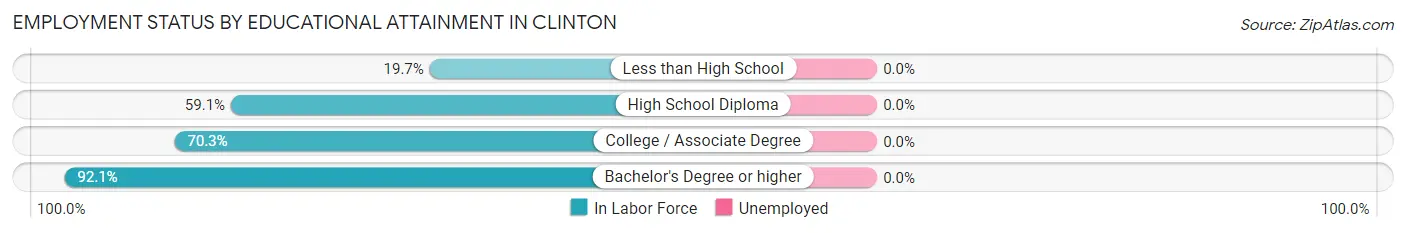
| Educational Attainment | In Labor Force | Unemployed |
| Less than High School | 35 (19.7%) | 0 (0.0%) |
| High School Diploma | 275 (59.1%) | 0 (0.0%) |
| College / Associate Degree | 211 (70.3%) | 0 (0.0%) |
| Bachelor's Degree or higher | 187 (92.1%) | 0 (0.0%) |
| Total | 708 (61.8%) | 0 (0.0%) |
Employment Occupations by Sex in Clinton
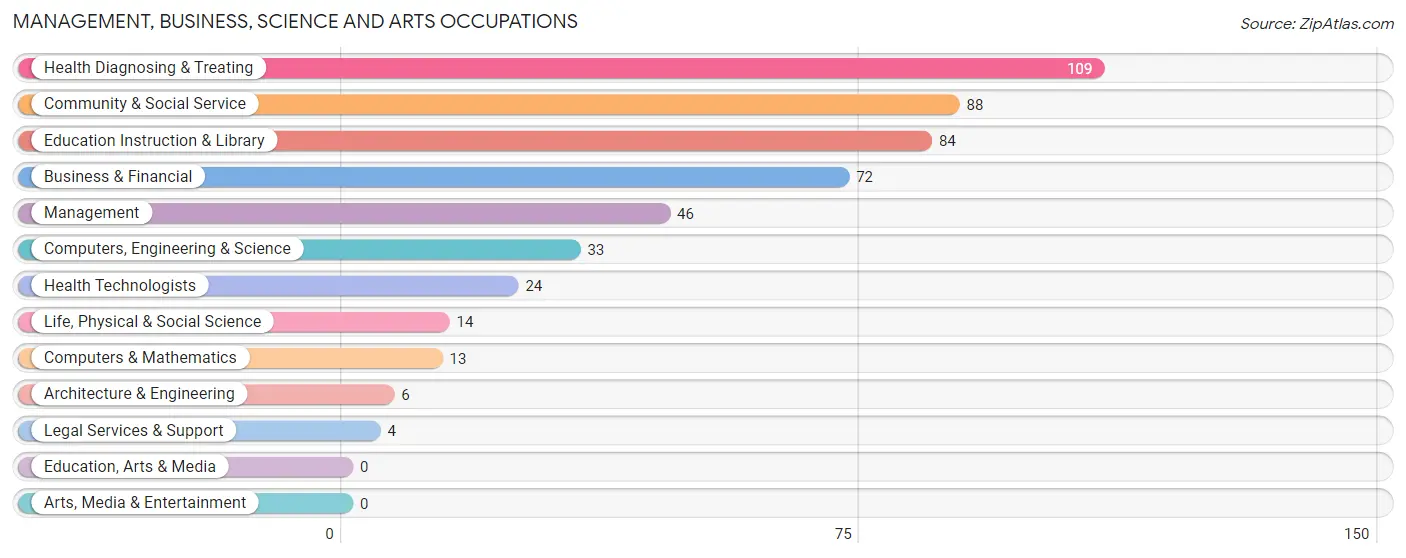
Management, Business, Science and Arts Occupations
The most common Management, Business, Science and Arts occupations in Clinton are Health Diagnosing & Treating (109 | 11.9%), Community & Social Service (88 | 9.6%), Education Instruction & Library (84 | 9.2%), Business & Financial (72 | 7.9%), and Management (46 | 5.0%).
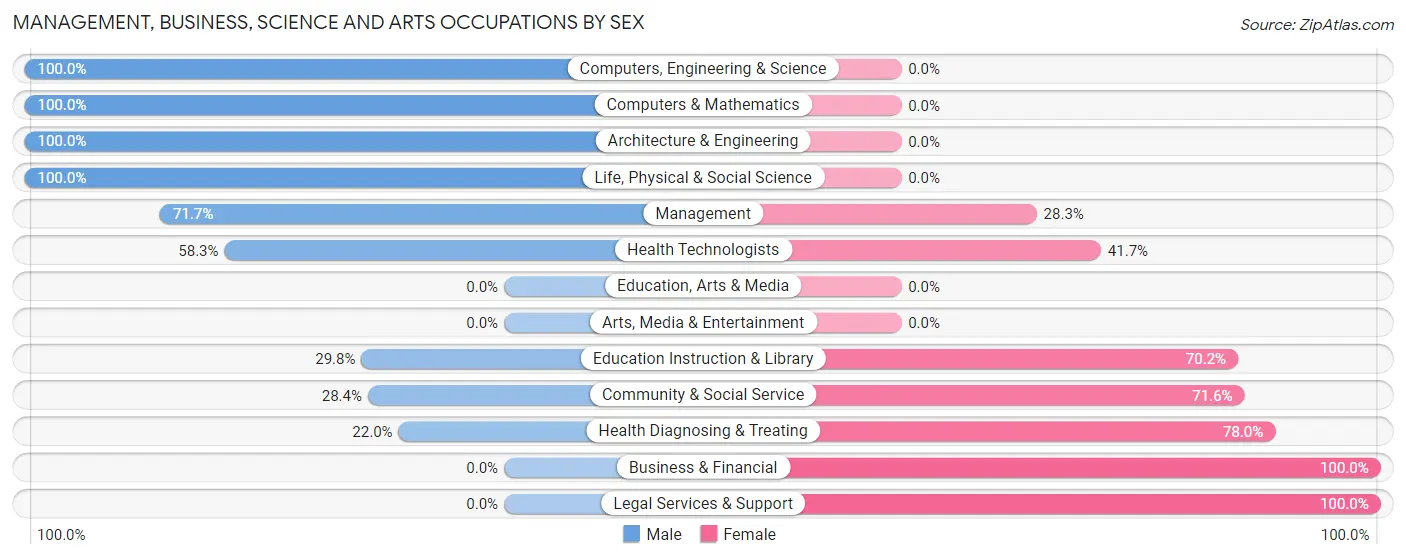
Management, Business, Science and Arts Occupations by Sex
Within the Management, Business, Science and Arts occupations in Clinton, the most male-oriented occupations are Computers, Engineering & Science (100.0%), Computers & Mathematics (100.0%), and Architecture & Engineering (100.0%), while the most female-oriented occupations are Business & Financial (100.0%), Legal Services & Support (100.0%), and Health Diagnosing & Treating (78.0%).
| Occupation | Male | Female |
| Management | 33 (71.7%) | 13 (28.3%) |
| Business & Financial | 0 (0.0%) | 72 (100.0%) |
| Computers, Engineering & Science | 33 (100.0%) | 0 (0.0%) |
| Computers & Mathematics | 13 (100.0%) | 0 (0.0%) |
| Architecture & Engineering | 6 (100.0%) | 0 (0.0%) |
| Life, Physical & Social Science | 14 (100.0%) | 0 (0.0%) |
| Community & Social Service | 25 (28.4%) | 63 (71.6%) |
| Education, Arts & Media | 0 (0.0%) | 0 (0.0%) |
| Legal Services & Support | 0 (0.0%) | 4 (100.0%) |
| Education Instruction & Library | 25 (29.8%) | 59 (70.2%) |
| Arts, Media & Entertainment | 0 (0.0%) | 0 (0.0%) |
| Health Diagnosing & Treating | 24 (22.0%) | 85 (78.0%) |
| Health Technologists | 14 (58.3%) | 10 (41.7%) |
| Total (Category) | 115 (33.1%) | 233 (66.9%) |
| Total (Overall) | 432 (47.1%) | 485 (52.9%) |
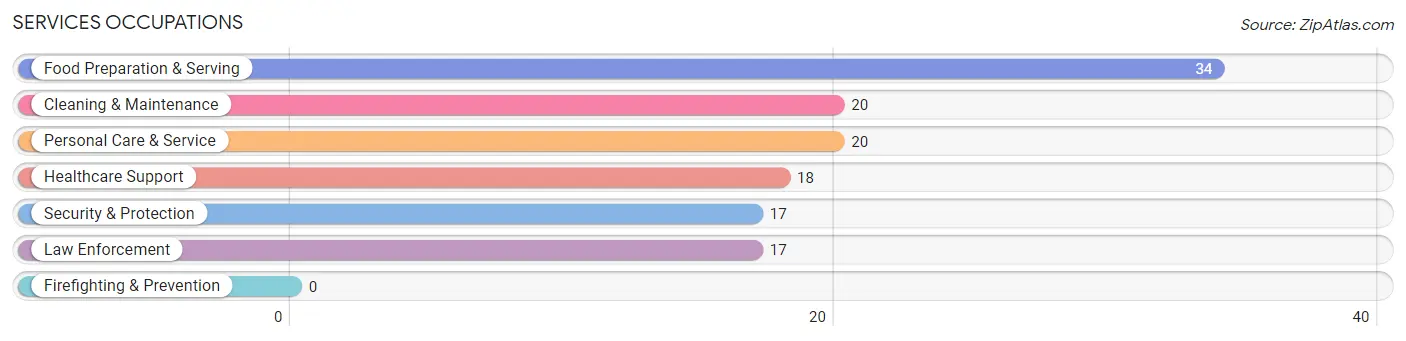
Services Occupations
The most common Services occupations in Clinton are Food Preparation & Serving (34 | 3.7%), Cleaning & Maintenance (20 | 2.2%), Personal Care & Service (20 | 2.2%), Healthcare Support (18 | 2.0%), and Security & Protection (17 | 1.8%).
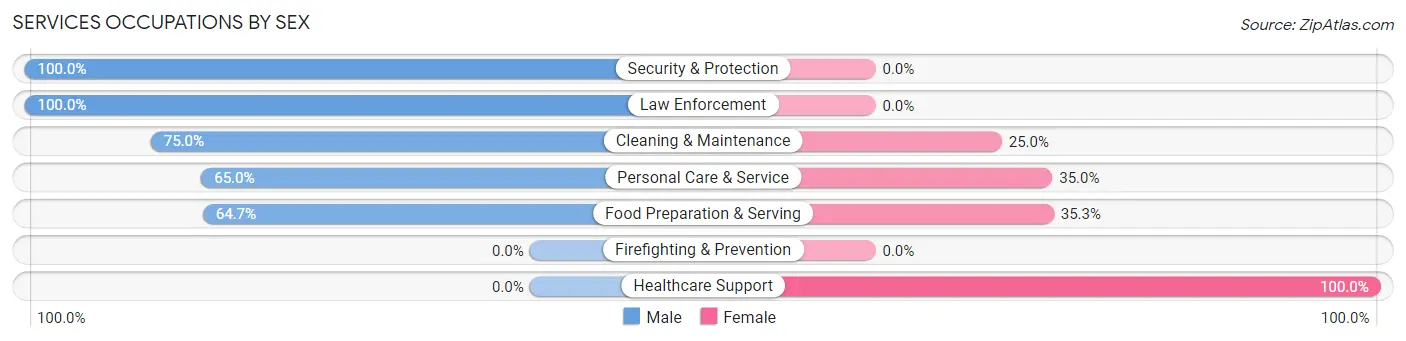
Services Occupations by Sex
Within the Services occupations in Clinton, the most male-oriented occupations are Security & Protection (100.0%), Law Enforcement (100.0%), and Cleaning & Maintenance (75.0%), while the most female-oriented occupations are Healthcare Support (100.0%), Food Preparation & Serving (35.3%), and Personal Care & Service (35.0%).
| Occupation | Male | Female |
| Healthcare Support | 0 (0.0%) | 18 (100.0%) |
| Security & Protection | 17 (100.0%) | 0 (0.0%) |
| Firefighting & Prevention | 0 (0.0%) | 0 (0.0%) |
| Law Enforcement | 17 (100.0%) | 0 (0.0%) |
| Food Preparation & Serving | 22 (64.7%) | 12 (35.3%) |
| Cleaning & Maintenance | 15 (75.0%) | 5 (25.0%) |
| Personal Care & Service | 13 (65.0%) | 7 (35.0%) |
| Total (Category) | 67 (61.5%) | 42 (38.5%) |
| Total (Overall) | 432 (47.1%) | 485 (52.9%) |
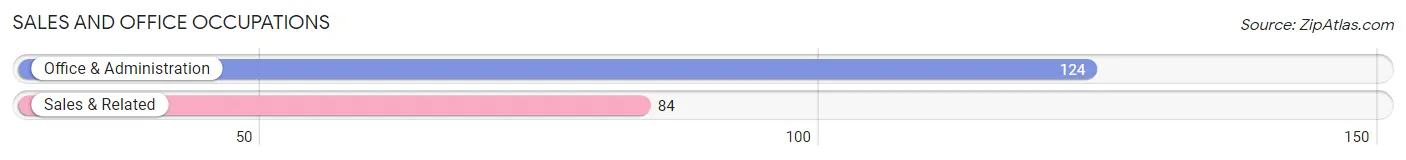
Sales and Office Occupations
The most common Sales and Office occupations in Clinton are Office & Administration (124 | 13.5%), and Sales & Related (84 | 9.2%).
Sales and Office Occupations by Sex
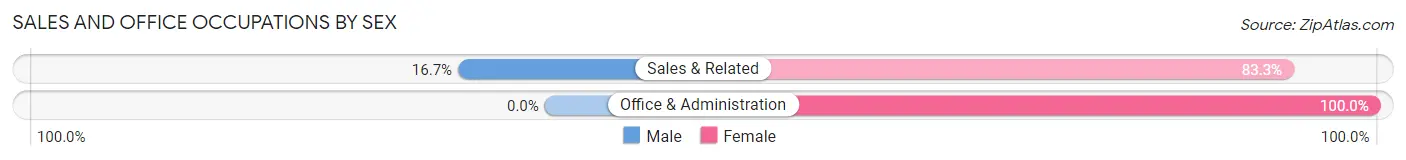
| Occupation | Male | Female |
| Sales & Related | 14 (16.7%) | 70 (83.3%) |
| Office & Administration | 0 (0.0%) | 124 (100.0%) |
| Total (Category) | 14 (6.7%) | 194 (93.3%) |
| Total (Overall) | 432 (47.1%) | 485 (52.9%) |
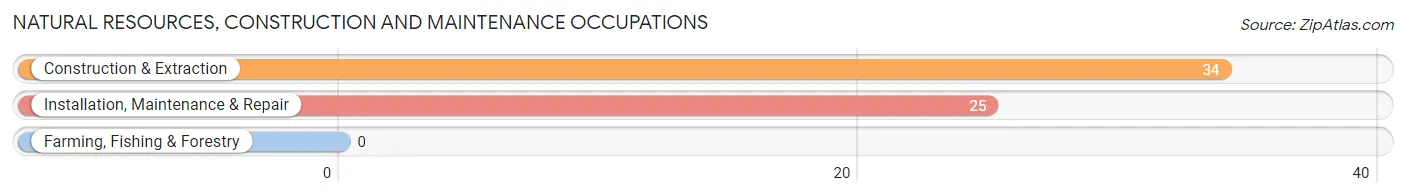
Natural Resources, Construction and Maintenance Occupations
The most common Natural Resources, Construction and Maintenance occupations in Clinton are Construction & Extraction (34 | 3.7%), and Installation, Maintenance & Repair (25 | 2.7%).
Natural Resources, Construction and Maintenance Occupations by Sex
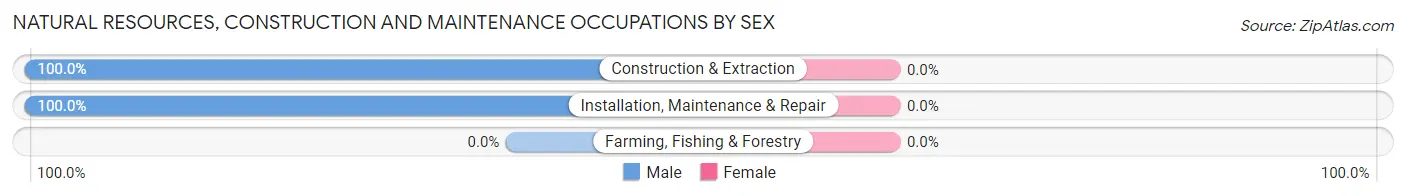
| Occupation | Male | Female |
| Farming, Fishing & Forestry | 0 (0.0%) | 0 (0.0%) |
| Construction & Extraction | 34 (100.0%) | 0 (0.0%) |
| Installation, Maintenance & Repair | 25 (100.0%) | 0 (0.0%) |
| Total (Category) | 59 (100.0%) | 0 (0.0%) |
| Total (Overall) | 432 (47.1%) | 485 (52.9%) |
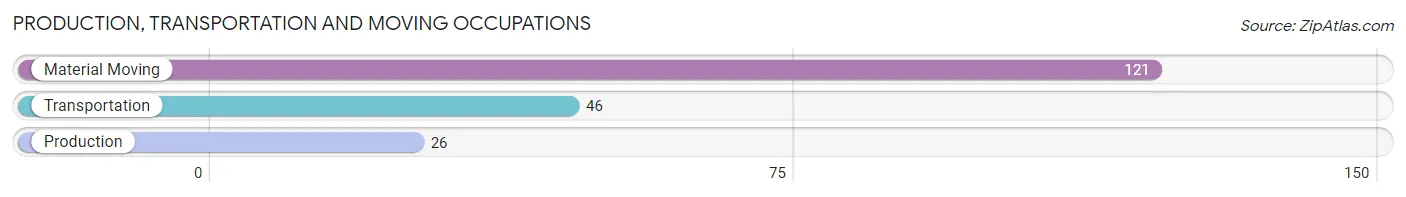
Production, Transportation and Moving Occupations
The most common Production, Transportation and Moving occupations in Clinton are Material Moving (121 | 13.2%), Transportation (46 | 5.0%), and Production (26 | 2.8%).
Production, Transportation and Moving Occupations by Sex
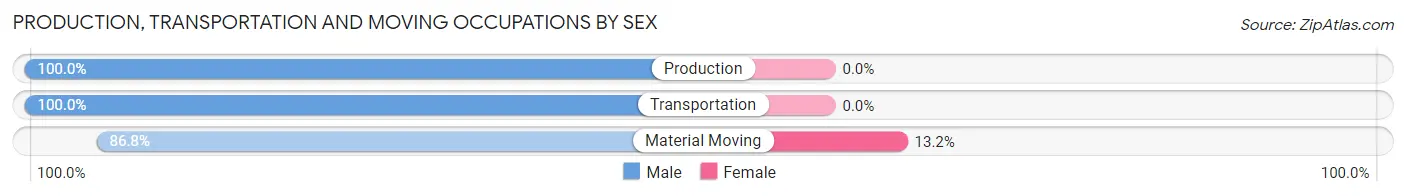
| Occupation | Male | Female |
| Production | 26 (100.0%) | 0 (0.0%) |
| Transportation | 46 (100.0%) | 0 (0.0%) |
| Material Moving | 105 (86.8%) | 16 (13.2%) |
| Total (Category) | 177 (91.7%) | 16 (8.3%) |
| Total (Overall) | 432 (47.1%) | 485 (52.9%) |
Employment Industries by Sex in Clinton
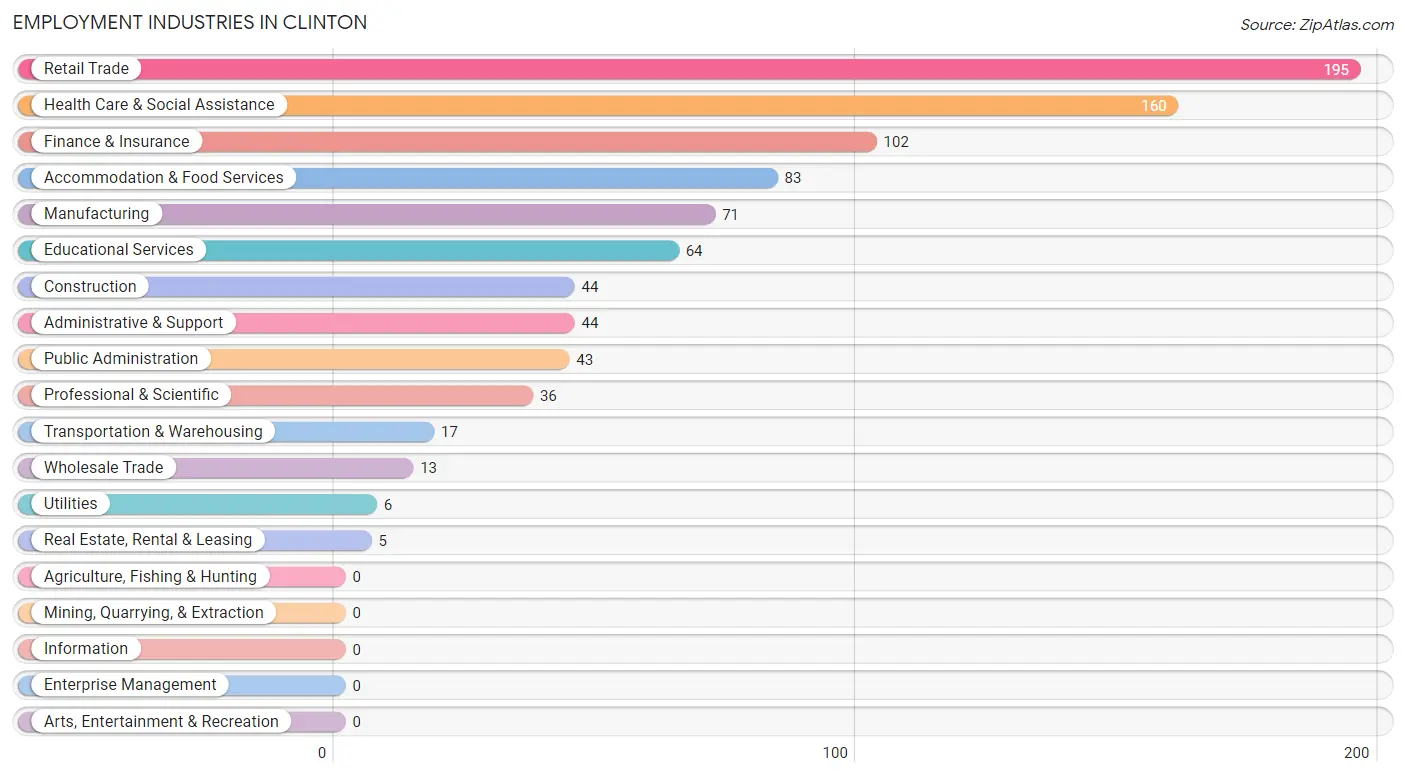
Employment Industries in Clinton
The major employment industries in Clinton include Retail Trade (195 | 21.3%), Health Care & Social Assistance (160 | 17.4%), Finance & Insurance (102 | 11.1%), Accommodation & Food Services (83 | 9.0%), and Manufacturing (71 | 7.7%).
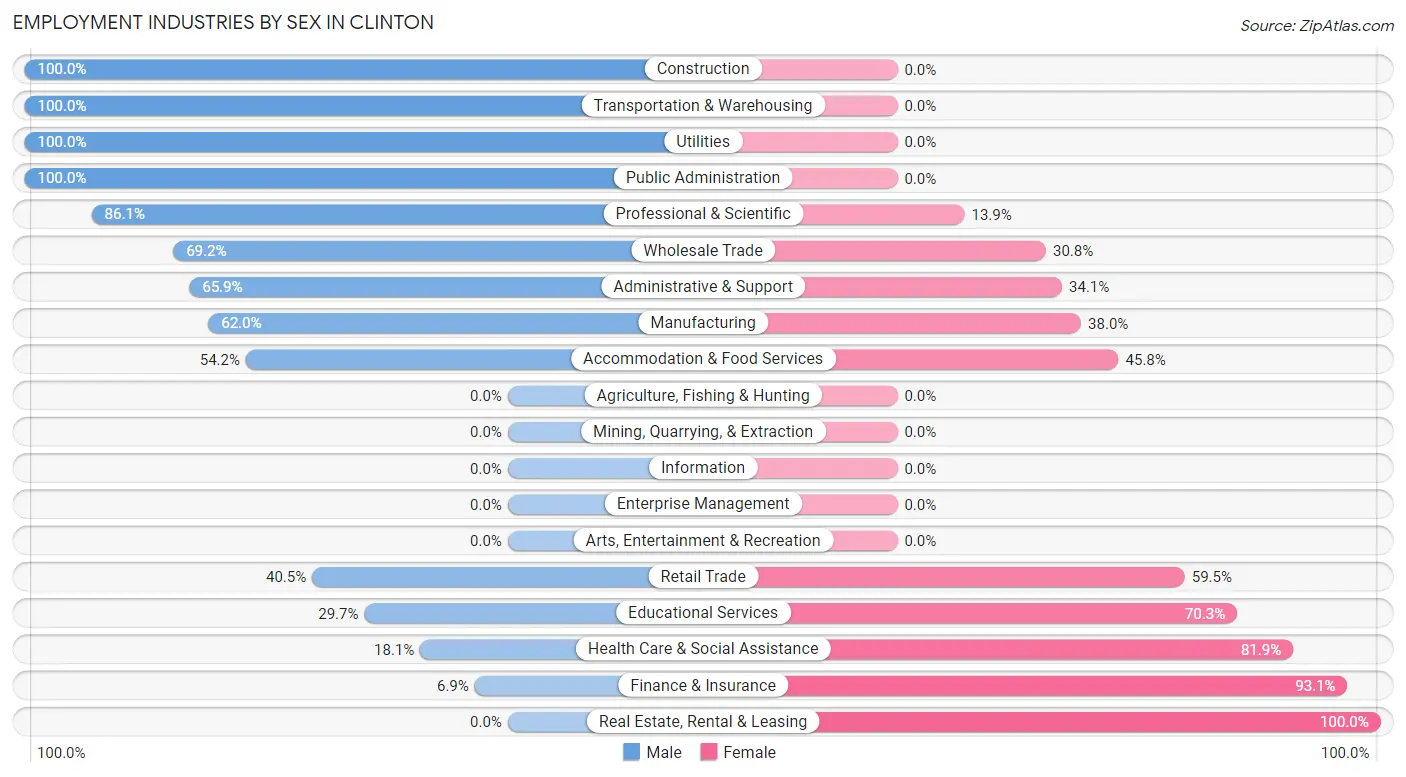
Employment Industries by Sex in Clinton
The Clinton industries that see more men than women are Construction (100.0%), Transportation & Warehousing (100.0%), and Utilities (100.0%), whereas the industries that tend to have a higher number of women are Real Estate, Rental & Leasing (100.0%), Finance & Insurance (93.1%), and Health Care & Social Assistance (81.9%).
| Industry | Male | Female |
| Agriculture, Fishing & Hunting | 0 (0.0%) | 0 (0.0%) |
| Mining, Quarrying, & Extraction | 0 (0.0%) | 0 (0.0%) |
| Construction | 44 (100.0%) | 0 (0.0%) |
| Manufacturing | 44 (62.0%) | 27 (38.0%) |
| Wholesale Trade | 9 (69.2%) | 4 (30.8%) |
| Retail Trade | 79 (40.5%) | 116 (59.5%) |
| Transportation & Warehousing | 17 (100.0%) | 0 (0.0%) |
| Utilities | 6 (100.0%) | 0 (0.0%) |
| Information | 0 (0.0%) | 0 (0.0%) |
| Finance & Insurance | 7 (6.9%) | 95 (93.1%) |
| Real Estate, Rental & Leasing | 0 (0.0%) | 5 (100.0%) |
| Professional & Scientific | 31 (86.1%) | 5 (13.9%) |
| Enterprise Management | 0 (0.0%) | 0 (0.0%) |
| Administrative & Support | 29 (65.9%) | 15 (34.1%) |
| Educational Services | 19 (29.7%) | 45 (70.3%) |
| Health Care & Social Assistance | 29 (18.1%) | 131 (81.9%) |
| Arts, Entertainment & Recreation | 0 (0.0%) | 0 (0.0%) |
| Accommodation & Food Services | 45 (54.2%) | 38 (45.8%) |
| Public Administration | 43 (100.0%) | 0 (0.0%) |
| Total | 432 (47.1%) | 485 (52.9%) |
Education in Clinton
School Enrollment in Clinton
The most common levels of schooling among the 551 students in Clinton are high school (203 | 36.8%), elementary school (113 | 20.5%), and middle school (88 | 16.0%).
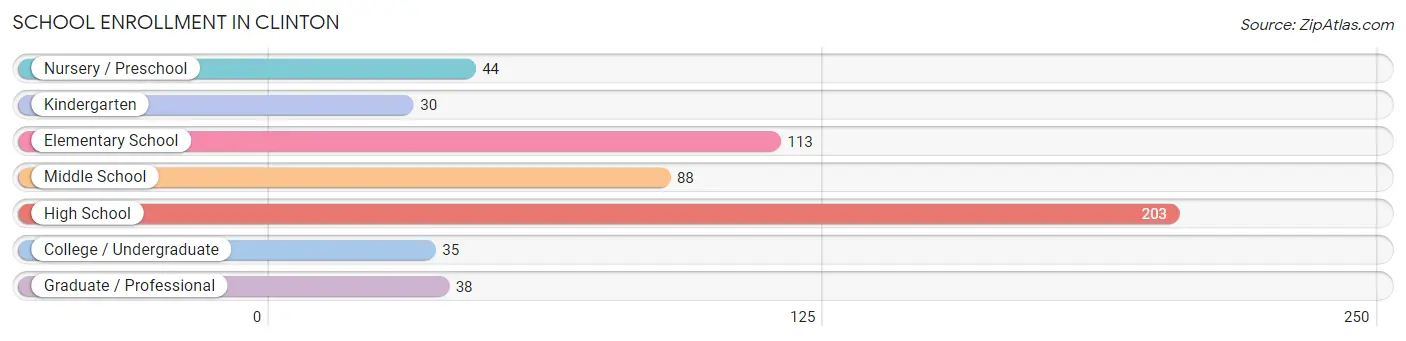
| School Level | # Students | % Students |
| Nursery / Preschool | 44 | 8.0% |
| Kindergarten | 30 | 5.4% |
| Elementary School | 113 | 20.5% |
| Middle School | 88 | 16.0% |
| High School | 203 | 36.8% |
| College / Undergraduate | 35 | 6.4% |
| Graduate / Professional | 38 | 6.9% |
| Total | 551 | 100.0% |
School Enrollment by Age by Funding Source in Clinton
Out of a total of 551 students who are enrolled in schools in Clinton, 28 (5.1%) attend a private institution, while the remaining 523 (94.9%) are enrolled in public schools. The age group of 3 to 4 year olds has the highest likelihood of being enrolled in private schools, with 11 (33.3% in the age bracket) enrolled. Conversely, the age group of 5 to 9 year old has the lowest likelihood of being enrolled in a private school, with 143 (100.0% in the age bracket) attending a public institution.
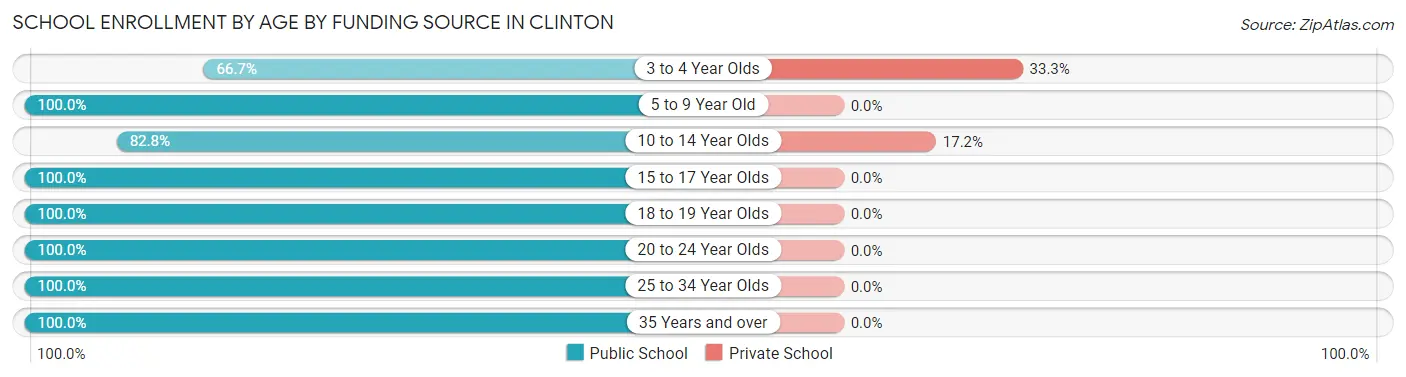
| Age Bracket | Public School | Private School |
| 3 to 4 Year Olds | 22 (66.7%) | 11 (33.3%) |
| 5 to 9 Year Old | 143 (100.0%) | 0 (0.0%) |
| 10 to 14 Year Olds | 82 (82.8%) | 17 (17.2%) |
| 15 to 17 Year Olds | 181 (100.0%) | 0 (0.0%) |
| 18 to 19 Year Olds | 22 (100.0%) | 0 (0.0%) |
| 20 to 24 Year Olds | 16 (100.0%) | 0 (0.0%) |
| 25 to 34 Year Olds | 36 (100.0%) | 0 (0.0%) |
| 35 Years and over | 21 (100.0%) | 0 (0.0%) |
| Total | 523 (94.9%) | 28 (5.1%) |
Educational Attainment by Field of Study in Clinton
Arts & humanities (70 | 24.0%), education (53 | 18.2%), bio, nature & agricultural (52 | 17.9%), science & technology (27 | 9.3%), and computers & mathematics (19 | 6.5%) are the most common fields of study among 291 individuals in Clinton who have obtained a bachelor's degree or higher.
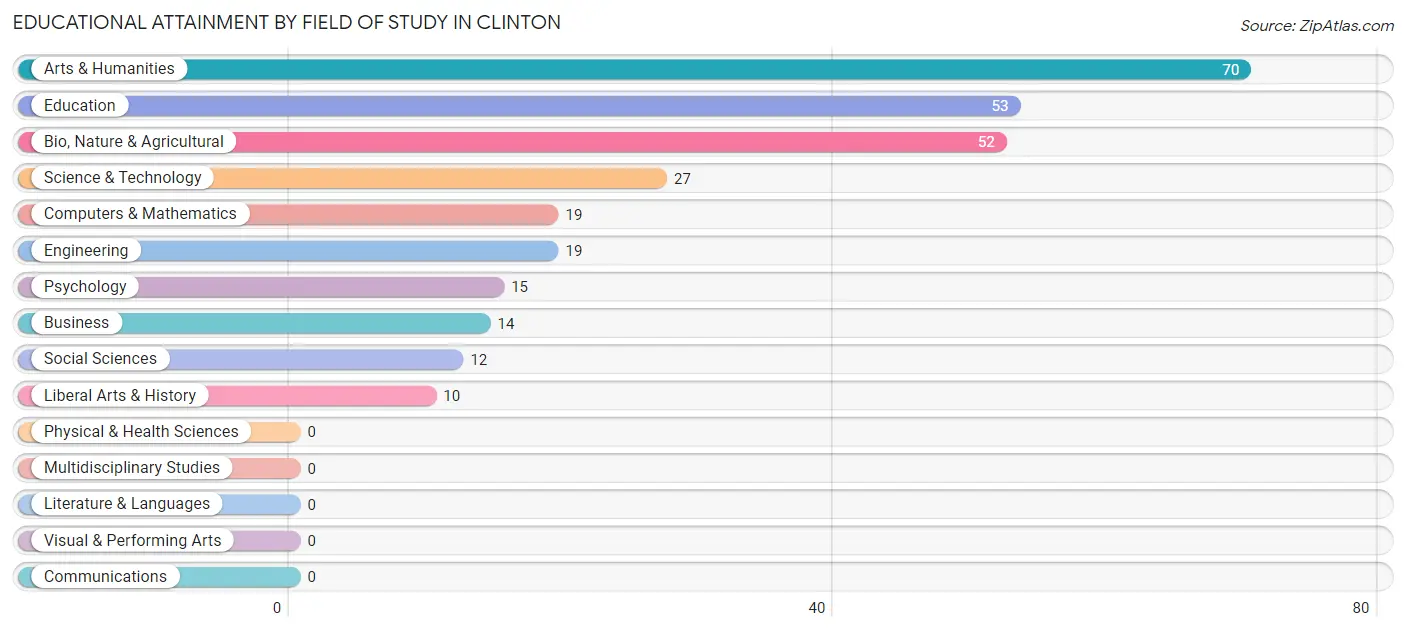
| Field of Study | # Graduates | % Graduates |
| Computers & Mathematics | 19 | 6.5% |
| Bio, Nature & Agricultural | 52 | 17.9% |
| Physical & Health Sciences | 0 | 0.0% |
| Psychology | 15 | 5.1% |
| Social Sciences | 12 | 4.1% |
| Engineering | 19 | 6.5% |
| Multidisciplinary Studies | 0 | 0.0% |
| Science & Technology | 27 | 9.3% |
| Business | 14 | 4.8% |
| Education | 53 | 18.2% |
| Literature & Languages | 0 | 0.0% |
| Liberal Arts & History | 10 | 3.4% |
| Visual & Performing Arts | 0 | 0.0% |
| Communications | 0 | 0.0% |
| Arts & Humanities | 70 | 24.0% |
| Total | 291 | 100.0% |
Transportation & Commute in Clinton
Vehicle Availability by Sex in Clinton
The most prevalent vehicle ownership categories in Clinton are males with 2 vehicles (158, accounting for 36.9%) and females with 2 vehicles (200, making up 32.6%).
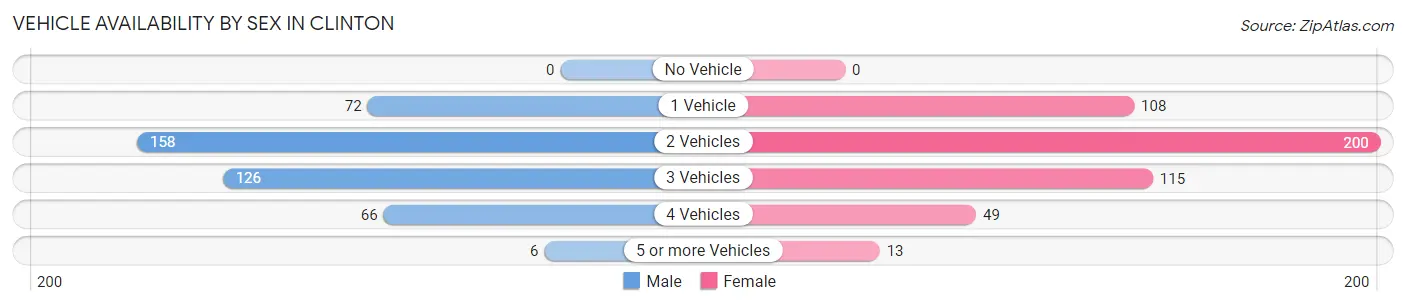
| Vehicles Available | Male | Female |
| No Vehicle | 0 (0.0%) | 0 (0.0%) |
| 1 Vehicle | 72 (16.8%) | 108 (22.3%) |
| 2 Vehicles | 158 (36.9%) | 200 (41.2%) |
| 3 Vehicles | 126 (29.4%) | 115 (23.7%) |
| 4 Vehicles | 66 (15.4%) | 49 (10.1%) |
| 5 or more Vehicles | 6 (1.4%) | 13 (2.7%) |
| Total | 428 (100.0%) | 485 (100.0%) |
Commute Time in Clinton
The most frequently occuring commute durations in Clinton are 5 to 9 minutes (404 commuters, 44.9%), 10 to 14 minutes (201 commuters, 22.4%), and less than 5 minutes (108 commuters, 12.0%).
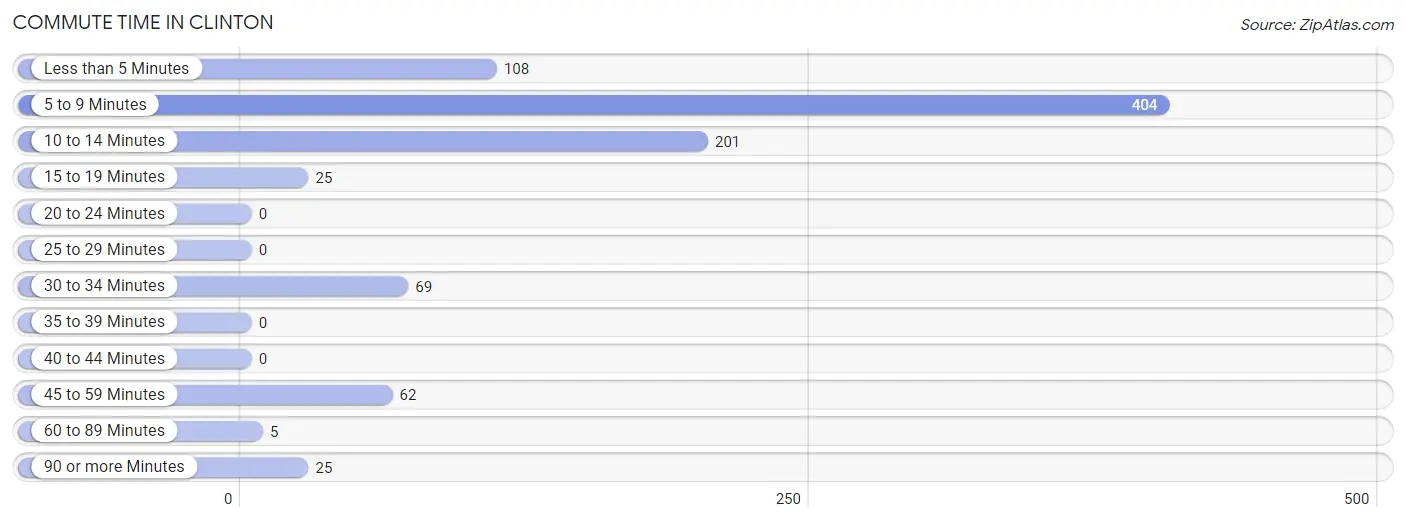
| Commute Time | # Commuters | % Commuters |
| Less than 5 Minutes | 108 | 12.0% |
| 5 to 9 Minutes | 404 | 44.9% |
| 10 to 14 Minutes | 201 | 22.4% |
| 15 to 19 Minutes | 25 | 2.8% |
| 20 to 24 Minutes | 0 | 0.0% |
| 25 to 29 Minutes | 0 | 0.0% |
| 30 to 34 Minutes | 69 | 7.7% |
| 35 to 39 Minutes | 0 | 0.0% |
| 40 to 44 Minutes | 0 | 0.0% |
| 45 to 59 Minutes | 62 | 6.9% |
| 60 to 89 Minutes | 5 | 0.6% |
| 90 or more Minutes | 25 | 2.8% |
Commute Time by Sex in Clinton
The most common commute times in Clinton are 5 to 9 minutes (196 commuters, 46.1%) for males and 5 to 9 minutes (208 commuters, 43.9%) for females.
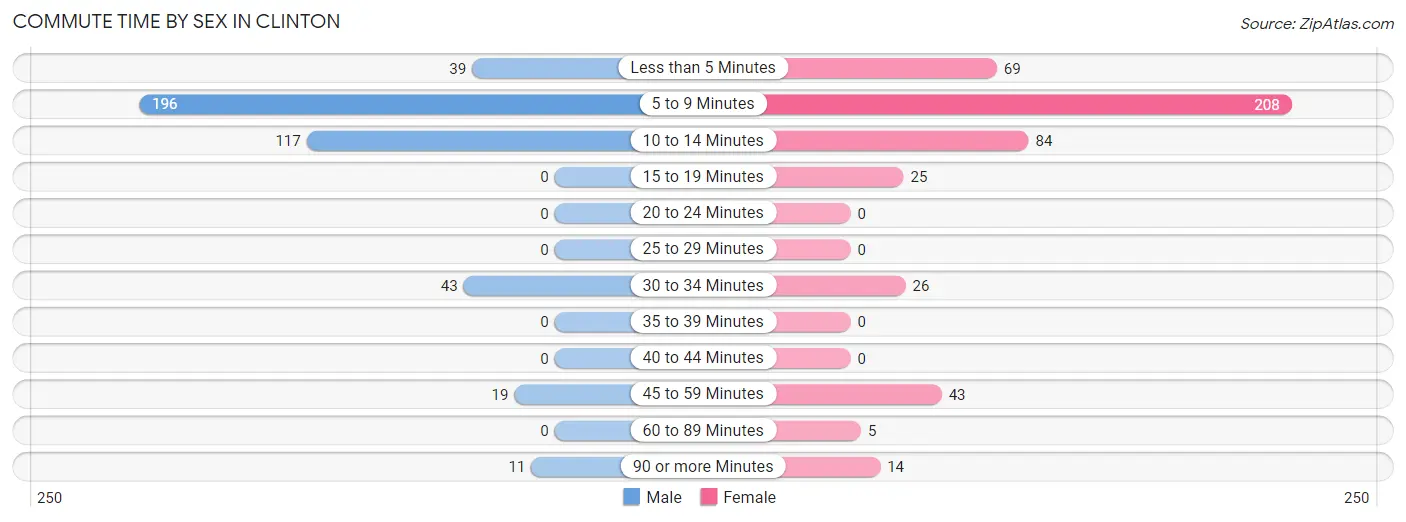
| Commute Time | Male | Female |
| Less than 5 Minutes | 39 (9.2%) | 69 (14.6%) |
| 5 to 9 Minutes | 196 (46.1%) | 208 (43.9%) |
| 10 to 14 Minutes | 117 (27.5%) | 84 (17.7%) |
| 15 to 19 Minutes | 0 (0.0%) | 25 (5.3%) |
| 20 to 24 Minutes | 0 (0.0%) | 0 (0.0%) |
| 25 to 29 Minutes | 0 (0.0%) | 0 (0.0%) |
| 30 to 34 Minutes | 43 (10.1%) | 26 (5.5%) |
| 35 to 39 Minutes | 0 (0.0%) | 0 (0.0%) |
| 40 to 44 Minutes | 0 (0.0%) | 0 (0.0%) |
| 45 to 59 Minutes | 19 (4.5%) | 43 (9.1%) |
| 60 to 89 Minutes | 0 (0.0%) | 5 (1.1%) |
| 90 or more Minutes | 11 (2.6%) | 14 (2.9%) |
Time of Departure to Work by Sex in Clinton
The most frequent times of departure to work in Clinton are 6:30 AM to 6:59 AM (88, 20.7%) for males and 7:30 AM to 7:59 AM (157, 33.1%) for females.
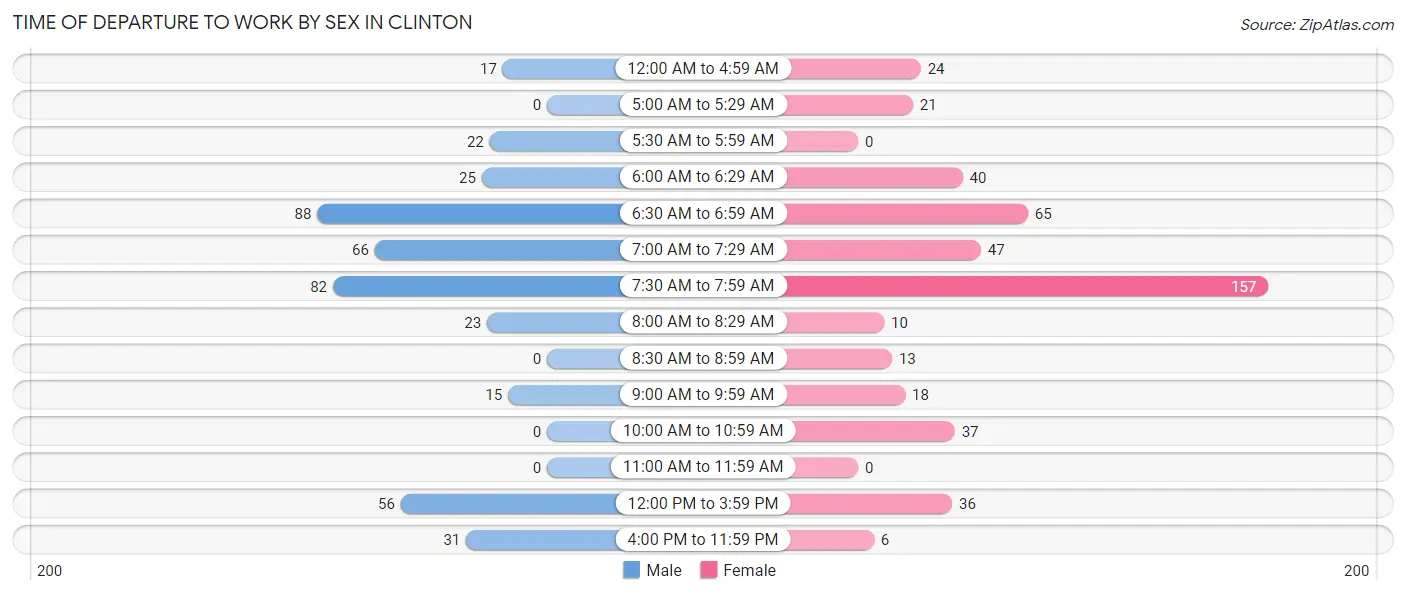
| Time of Departure | Male | Female |
| 12:00 AM to 4:59 AM | 17 (4.0%) | 24 (5.1%) |
| 5:00 AM to 5:29 AM | 0 (0.0%) | 21 (4.4%) |
| 5:30 AM to 5:59 AM | 22 (5.2%) | 0 (0.0%) |
| 6:00 AM to 6:29 AM | 25 (5.9%) | 40 (8.4%) |
| 6:30 AM to 6:59 AM | 88 (20.7%) | 65 (13.7%) |
| 7:00 AM to 7:29 AM | 66 (15.5%) | 47 (9.9%) |
| 7:30 AM to 7:59 AM | 82 (19.3%) | 157 (33.1%) |
| 8:00 AM to 8:29 AM | 23 (5.4%) | 10 (2.1%) |
| 8:30 AM to 8:59 AM | 0 (0.0%) | 13 (2.7%) |
| 9:00 AM to 9:59 AM | 15 (3.5%) | 18 (3.8%) |
| 10:00 AM to 10:59 AM | 0 (0.0%) | 37 (7.8%) |
| 11:00 AM to 11:59 AM | 0 (0.0%) | 0 (0.0%) |
| 12:00 PM to 3:59 PM | 56 (13.2%) | 36 (7.6%) |
| 4:00 PM to 11:59 PM | 31 (7.3%) | 6 (1.3%) |
| Total | 425 (100.0%) | 474 (100.0%) |
Housing Occupancy in Clinton
Occupancy by Ownership in Clinton
Of the total 987 dwellings in Clinton, owner-occupied units account for 686 (69.5%), while renter-occupied units make up 301 (30.5%).
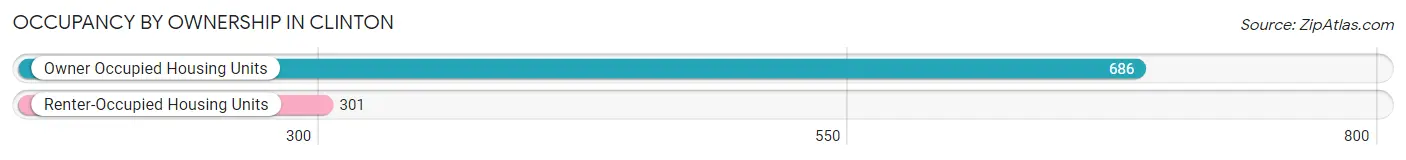
| Occupancy | # Housing Units | % Housing Units |
| Owner Occupied Housing Units | 686 | 69.5% |
| Renter-Occupied Housing Units | 301 | 30.5% |
| Total Occupied Housing Units | 987 | 100.0% |
Occupancy by Household Size in Clinton
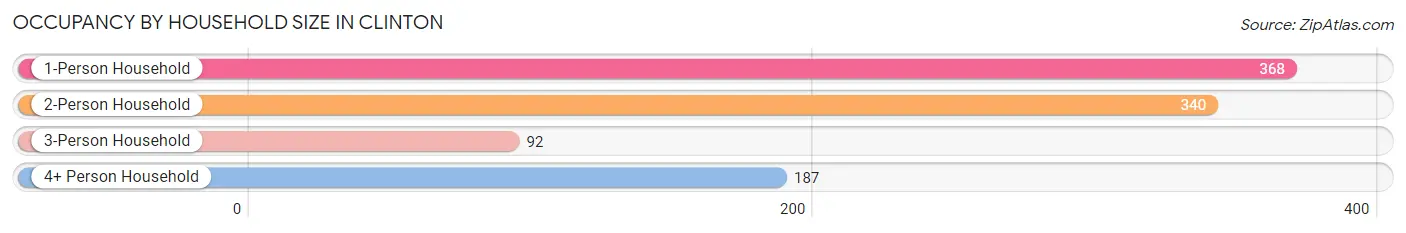
| Household Size | # Housing Units | % Housing Units |
| 1-Person Household | 368 | 37.3% |
| 2-Person Household | 340 | 34.4% |
| 3-Person Household | 92 | 9.3% |
| 4+ Person Household | 187 | 19.0% |
| Total Housing Units | 987 | 100.0% |
Occupancy by Ownership by Household Size in Clinton
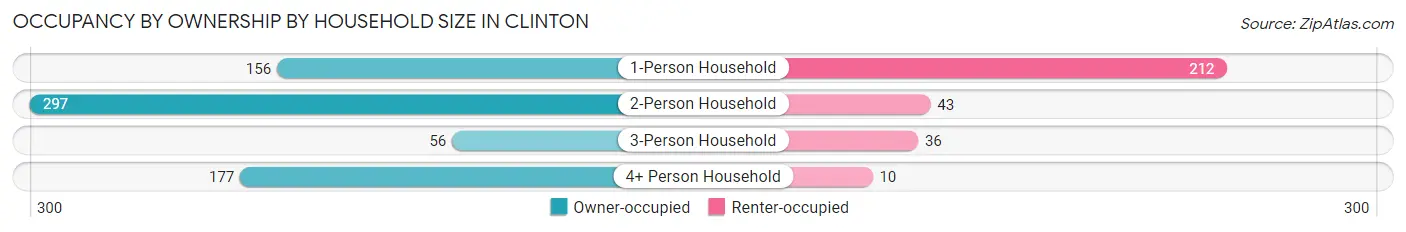
| Household Size | Owner-occupied | Renter-occupied |
| 1-Person Household | 156 (42.4%) | 212 (57.6%) |
| 2-Person Household | 297 (87.4%) | 43 (12.7%) |
| 3-Person Household | 56 (60.9%) | 36 (39.1%) |
| 4+ Person Household | 177 (94.7%) | 10 (5.3%) |
| Total Housing Units | 686 (69.5%) | 301 (30.5%) |
Occupancy by Educational Attainment in Clinton
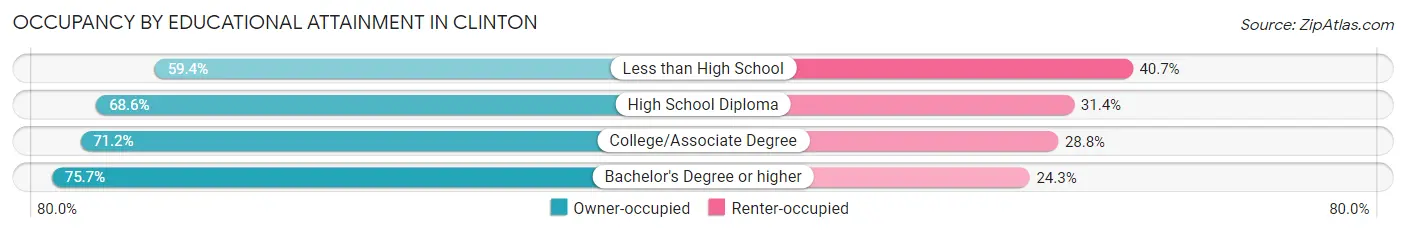
| Household Size | Owner-occupied | Renter-occupied |
| Less than High School | 73 (59.4%) | 50 (40.6%) |
| High School Diploma | 278 (68.6%) | 127 (31.4%) |
| College/Associate Degree | 195 (71.2%) | 79 (28.8%) |
| Bachelor's Degree or higher | 140 (75.7%) | 45 (24.3%) |
Occupancy by Age of Householder in Clinton
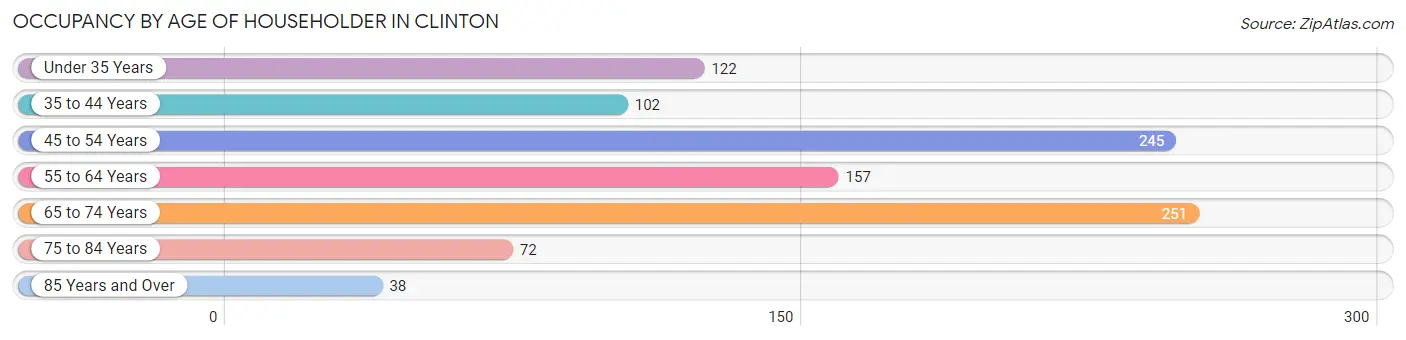
| Age Bracket | # Households | % Households |
| Under 35 Years | 122 | 12.4% |
| 35 to 44 Years | 102 | 10.3% |
| 45 to 54 Years | 245 | 24.8% |
| 55 to 64 Years | 157 | 15.9% |
| 65 to 74 Years | 251 | 25.4% |
| 75 to 84 Years | 72 | 7.3% |
| 85 Years and Over | 38 | 3.8% |
| Total | 987 | 100.0% |
Housing Finances in Clinton
Median Income by Occupancy in Clinton
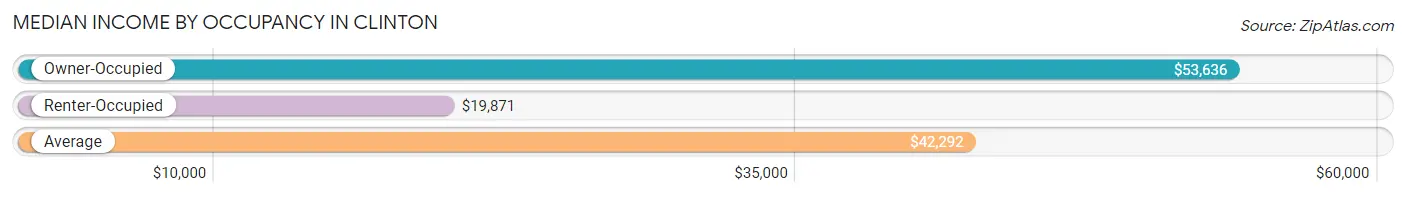
| Occupancy Type | # Households | Median Income |
| Owner-Occupied | 686 (69.5%) | $53,636 |
| Renter-Occupied | 301 (30.5%) | $19,871 |
| Average | 987 (100.0%) | $42,292 |
Occupancy by Householder Income Bracket in Clinton
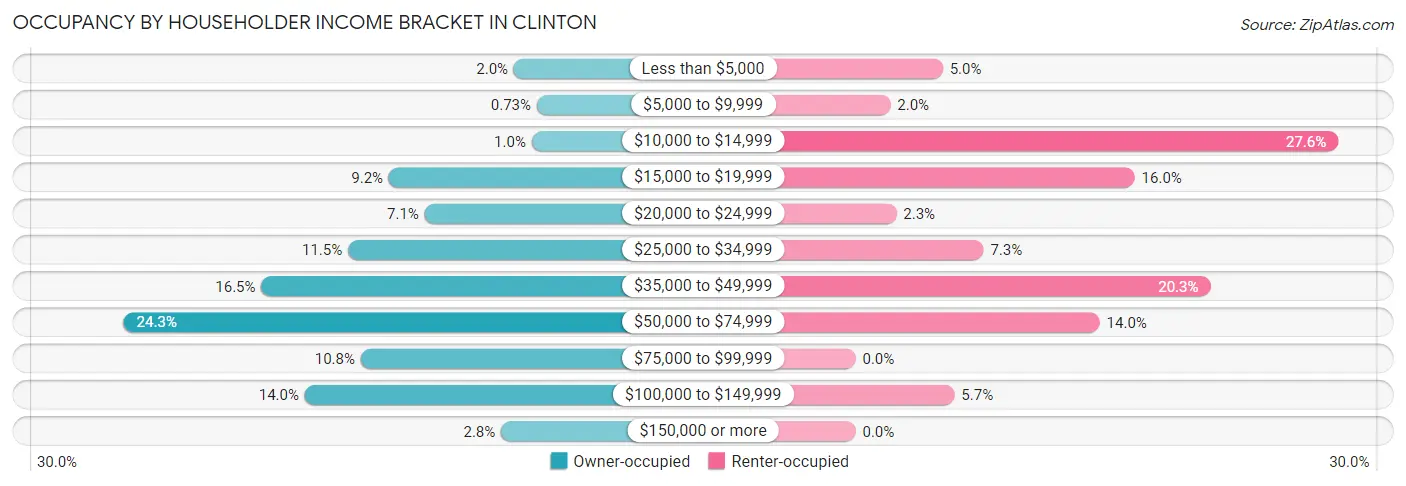
| Income Bracket | Owner-occupied | Renter-occupied |
| Less than $5,000 | 14 (2.0%) | 15 (5.0%) |
| $5,000 to $9,999 | 5 (0.7%) | 6 (2.0%) |
| $10,000 to $14,999 | 7 (1.0%) | 83 (27.6%) |
| $15,000 to $19,999 | 63 (9.2%) | 48 (16.0%) |
| $20,000 to $24,999 | 49 (7.1%) | 7 (2.3%) |
| $25,000 to $34,999 | 79 (11.5%) | 22 (7.3%) |
| $35,000 to $49,999 | 113 (16.5%) | 61 (20.3%) |
| $50,000 to $74,999 | 167 (24.3%) | 42 (14.0%) |
| $75,000 to $99,999 | 74 (10.8%) | 0 (0.0%) |
| $100,000 to $149,999 | 96 (14.0%) | 17 (5.7%) |
| $150,000 or more | 19 (2.8%) | 0 (0.0%) |
| Total | 686 (100.0%) | 301 (100.0%) |
Monthly Housing Cost Tiers in Clinton
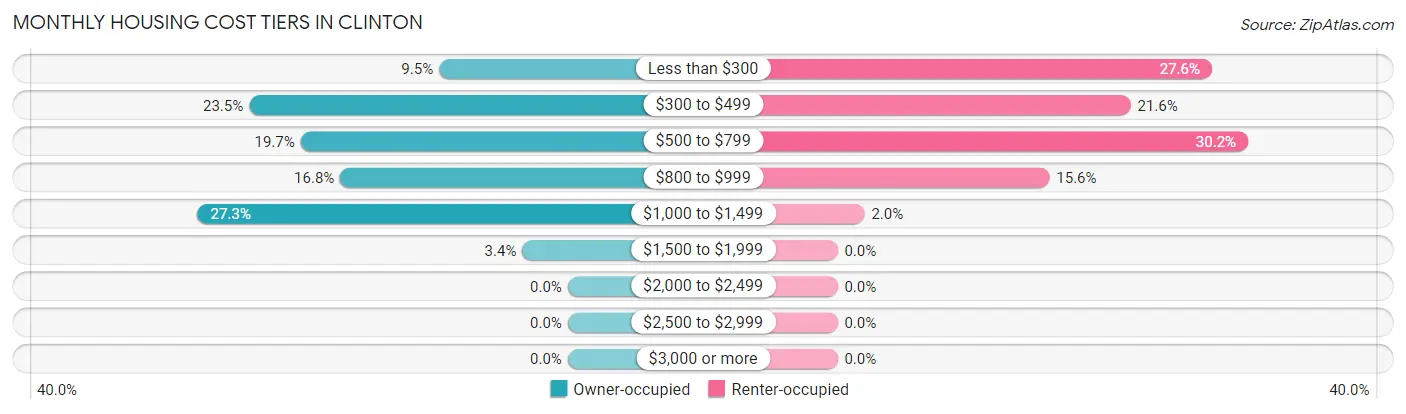
| Monthly Cost | Owner-occupied | Renter-occupied |
| Less than $300 | 65 (9.5%) | 83 (27.6%) |
| $300 to $499 | 161 (23.5%) | 65 (21.6%) |
| $500 to $799 | 135 (19.7%) | 91 (30.2%) |
| $800 to $999 | 115 (16.8%) | 47 (15.6%) |
| $1,000 to $1,499 | 187 (27.3%) | 6 (2.0%) |
| $1,500 to $1,999 | 23 (3.4%) | 0 (0.0%) |
| $2,000 to $2,499 | 0 (0.0%) | 0 (0.0%) |
| $2,500 to $2,999 | 0 (0.0%) | 0 (0.0%) |
| $3,000 or more | 0 (0.0%) | 0 (0.0%) |
| Total | 686 (100.0%) | 301 (100.0%) |
Physical Housing Characteristics in Clinton
Housing Structures in Clinton
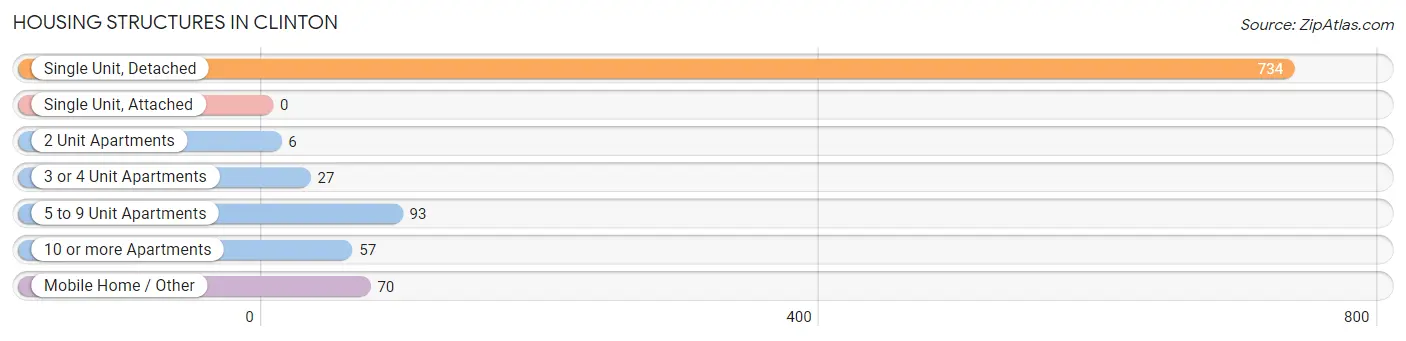
| Structure Type | # Housing Units | % Housing Units |
| Single Unit, Detached | 734 | 74.4% |
| Single Unit, Attached | 0 | 0.0% |
| 2 Unit Apartments | 6 | 0.6% |
| 3 or 4 Unit Apartments | 27 | 2.7% |
| 5 to 9 Unit Apartments | 93 | 9.4% |
| 10 or more Apartments | 57 | 5.8% |
| Mobile Home / Other | 70 | 7.1% |
| Total | 987 | 100.0% |
Housing Structures by Occupancy in Clinton
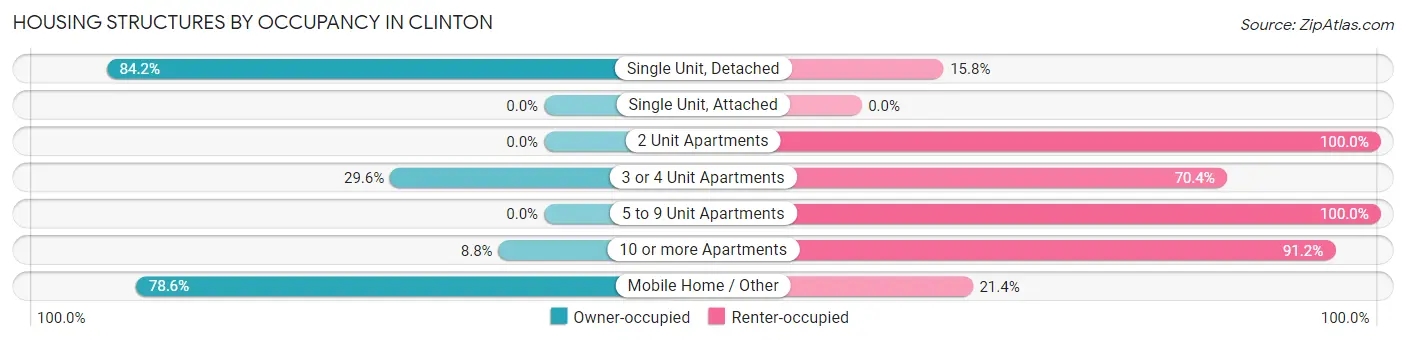
| Structure Type | Owner-occupied | Renter-occupied |
| Single Unit, Detached | 618 (84.2%) | 116 (15.8%) |
| Single Unit, Attached | 0 (0.0%) | 0 (0.0%) |
| 2 Unit Apartments | 0 (0.0%) | 6 (100.0%) |
| 3 or 4 Unit Apartments | 8 (29.6%) | 19 (70.4%) |
| 5 to 9 Unit Apartments | 0 (0.0%) | 93 (100.0%) |
| 10 or more Apartments | 5 (8.8%) | 52 (91.2%) |
| Mobile Home / Other | 55 (78.6%) | 15 (21.4%) |
| Total | 686 (69.5%) | 301 (30.5%) |
Housing Structures by Number of Rooms in Clinton
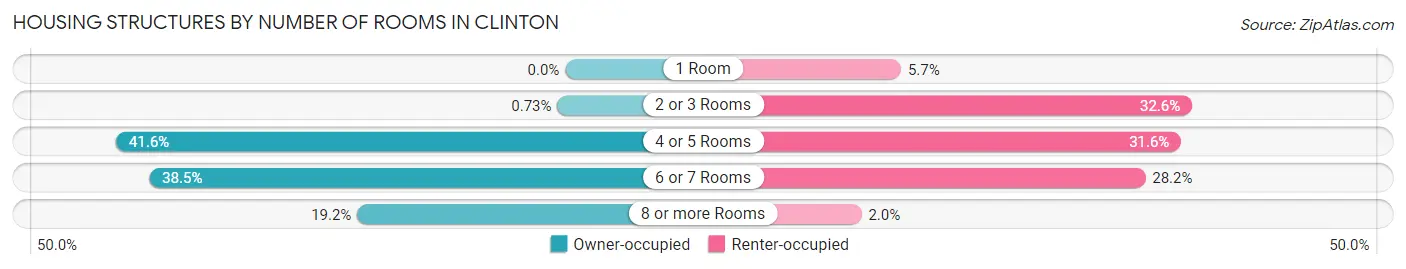
| Number of Rooms | Owner-occupied | Renter-occupied |
| 1 Room | 0 (0.0%) | 17 (5.7%) |
| 2 or 3 Rooms | 5 (0.7%) | 98 (32.6%) |
| 4 or 5 Rooms | 285 (41.5%) | 95 (31.6%) |
| 6 or 7 Rooms | 264 (38.5%) | 85 (28.2%) |
| 8 or more Rooms | 132 (19.2%) | 6 (2.0%) |
| Total | 686 (100.0%) | 301 (100.0%) |
Housing Structure by Heating Type in Clinton
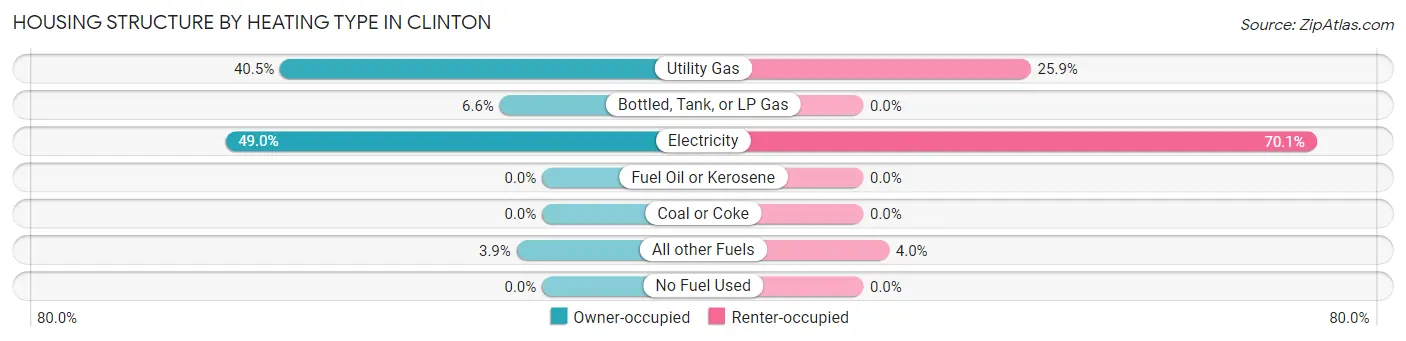
| Heating Type | Owner-occupied | Renter-occupied |
| Utility Gas | 278 (40.5%) | 78 (25.9%) |
| Bottled, Tank, or LP Gas | 45 (6.6%) | 0 (0.0%) |
| Electricity | 336 (49.0%) | 211 (70.1%) |
| Fuel Oil or Kerosene | 0 (0.0%) | 0 (0.0%) |
| Coal or Coke | 0 (0.0%) | 0 (0.0%) |
| All other Fuels | 27 (3.9%) | 12 (4.0%) |
| No Fuel Used | 0 (0.0%) | 0 (0.0%) |
| Total | 686 (100.0%) | 301 (100.0%) |
Household Vehicle Usage in Clinton
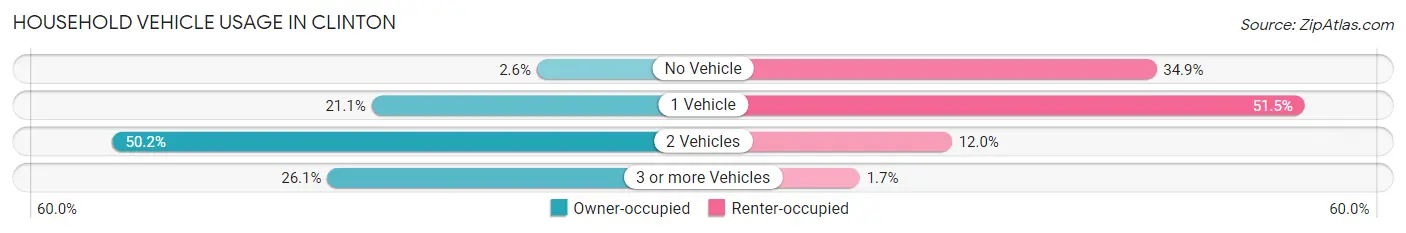
| Vehicles per Household | Owner-occupied | Renter-occupied |
| No Vehicle | 18 (2.6%) | 105 (34.9%) |
| 1 Vehicle | 145 (21.1%) | 155 (51.5%) |
| 2 Vehicles | 344 (50.1%) | 36 (12.0%) |
| 3 or more Vehicles | 179 (26.1%) | 5 (1.7%) |
| Total | 686 (100.0%) | 301 (100.0%) |
Real Estate & Mortgages in Clinton
Real Estate and Mortgage Overview in Clinton
| Characteristic | Without Mortgage | With Mortgage |
| Housing Units | 268 | 418 |
| Median Property Value | $113,700 | $128,400 |
| Median Household Income | $39,706 | $13 |
| Monthly Housing Costs | $386 | $0 |
| Real Estate Taxes | $604 | $25 |
Property Value by Mortgage Status in Clinton
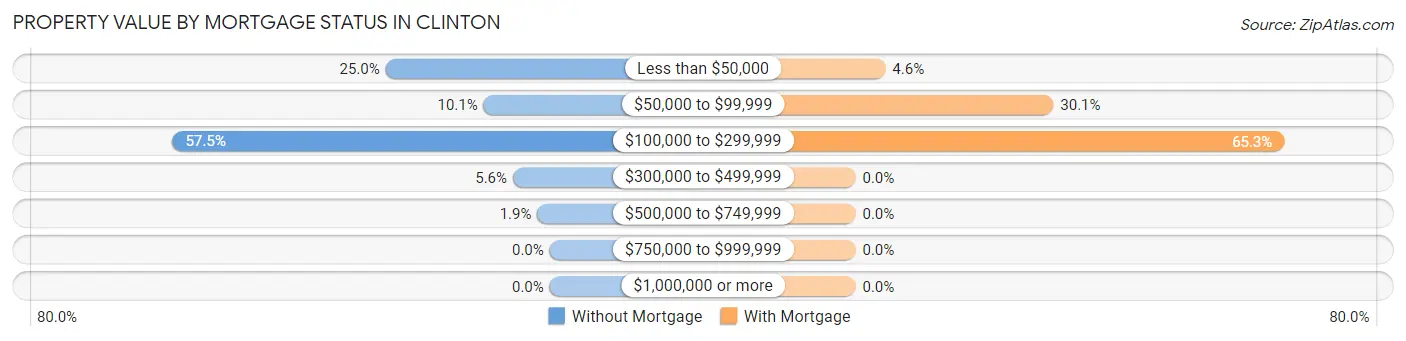
| Property Value | Without Mortgage | With Mortgage |
| Less than $50,000 | 67 (25.0%) | 19 (4.5%) |
| $50,000 to $99,999 | 27 (10.1%) | 126 (30.1%) |
| $100,000 to $299,999 | 154 (57.5%) | 273 (65.3%) |
| $300,000 to $499,999 | 15 (5.6%) | 0 (0.0%) |
| $500,000 to $749,999 | 5 (1.9%) | 0 (0.0%) |
| $750,000 to $999,999 | 0 (0.0%) | 0 (0.0%) |
| $1,000,000 or more | 0 (0.0%) | 0 (0.0%) |
| Total | 268 (100.0%) | 418 (100.0%) |
Household Income by Mortgage Status in Clinton
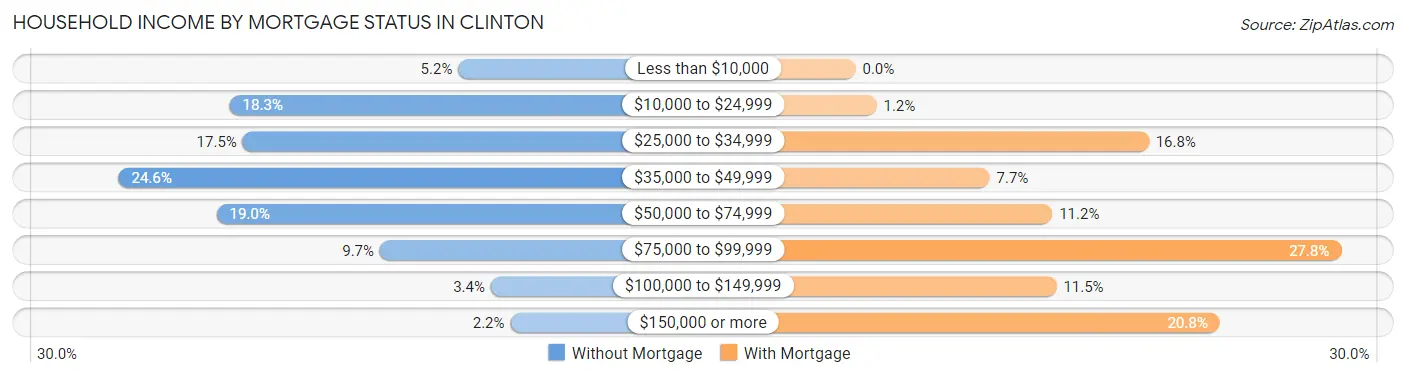
| Household Income | Without Mortgage | With Mortgage |
| Less than $10,000 | 14 (5.2%) | 0 (0.0%) |
| $10,000 to $24,999 | 49 (18.3%) | 5 (1.2%) |
| $25,000 to $34,999 | 47 (17.5%) | 70 (16.8%) |
| $35,000 to $49,999 | 66 (24.6%) | 32 (7.7%) |
| $50,000 to $74,999 | 51 (19.0%) | 47 (11.2%) |
| $75,000 to $99,999 | 26 (9.7%) | 116 (27.8%) |
| $100,000 to $149,999 | 9 (3.4%) | 48 (11.5%) |
| $150,000 or more | 6 (2.2%) | 87 (20.8%) |
| Total | 268 (100.0%) | 418 (100.0%) |
Property Value to Household Income Ratio in Clinton
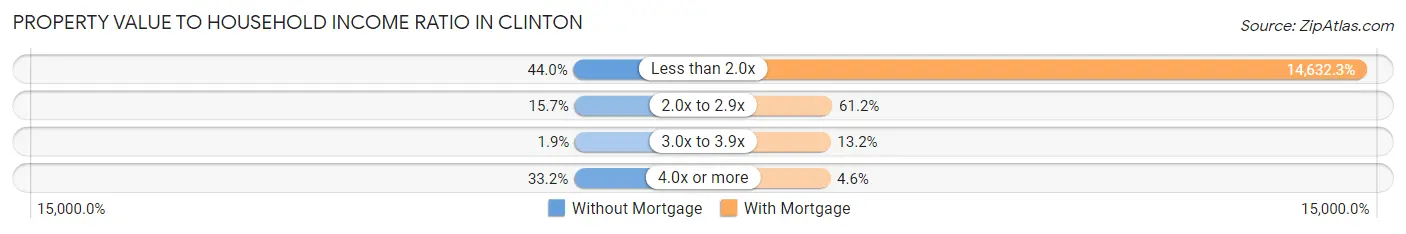
| Value-to-Income Ratio | Without Mortgage | With Mortgage |
| Less than 2.0x | 118 (44.0%) | 61,163 (14,632.3%) |
| 2.0x to 2.9x | 42 (15.7%) | 256 (61.2%) |
| 3.0x to 3.9x | 5 (1.9%) | 55 (13.2%) |
| 4.0x or more | 89 (33.2%) | 19 (4.5%) |
| Total | 268 (100.0%) | 418 (100.0%) |
Real Estate Taxes by Mortgage Status in Clinton
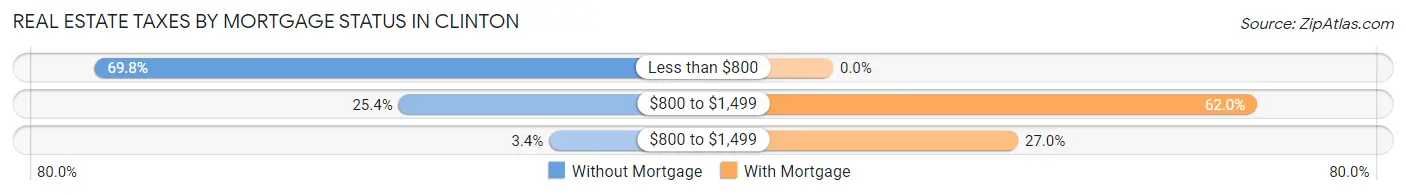
| Property Taxes | Without Mortgage | With Mortgage |
| Less than $800 | 187 (69.8%) | 0 (0.0%) |
| $800 to $1,499 | 68 (25.4%) | 259 (62.0%) |
| $800 to $1,499 | 9 (3.4%) | 113 (27.0%) |
| Total | 268 (100.0%) | 418 (100.0%) |
Health & Disability in Clinton
Health Insurance Coverage by Age in Clinton
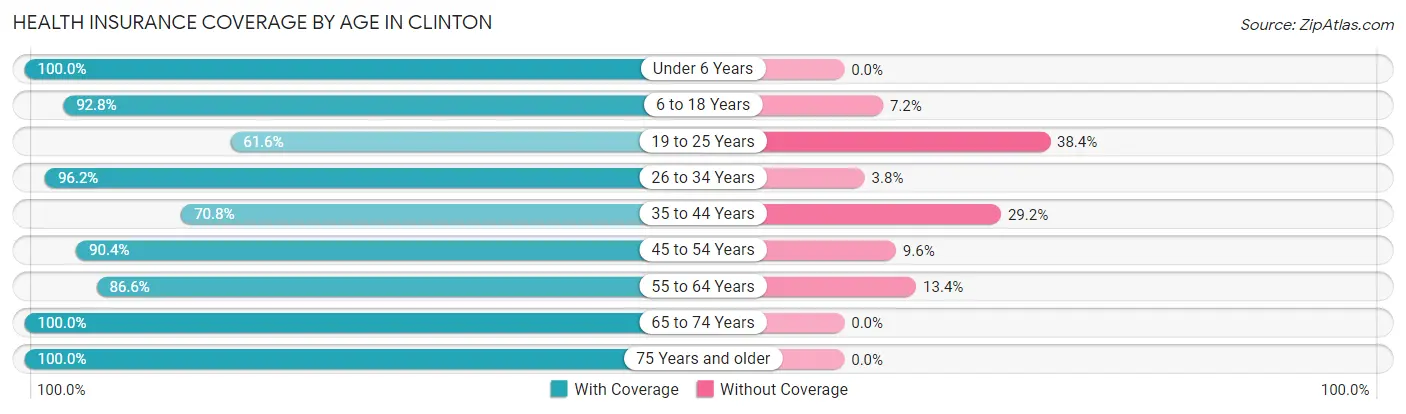
| Age Bracket | With Coverage | Without Coverage |
| Under 6 Years | 151 (100.0%) | 0 (0.0%) |
| 6 to 18 Years | 425 (92.8%) | 33 (7.2%) |
| 19 to 25 Years | 135 (61.6%) | 84 (38.4%) |
| 26 to 34 Years | 177 (96.2%) | 7 (3.8%) |
| 35 to 44 Years | 109 (70.8%) | 45 (29.2%) |
| 45 to 54 Years | 357 (90.4%) | 38 (9.6%) |
| 55 to 64 Years | 252 (86.6%) | 39 (13.4%) |
| 65 to 74 Years | 356 (100.0%) | 0 (0.0%) |
| 75 Years and older | 165 (100.0%) | 0 (0.0%) |
| Total | 2,127 (89.6%) | 246 (10.4%) |
Health Insurance Coverage by Citizenship Status in Clinton
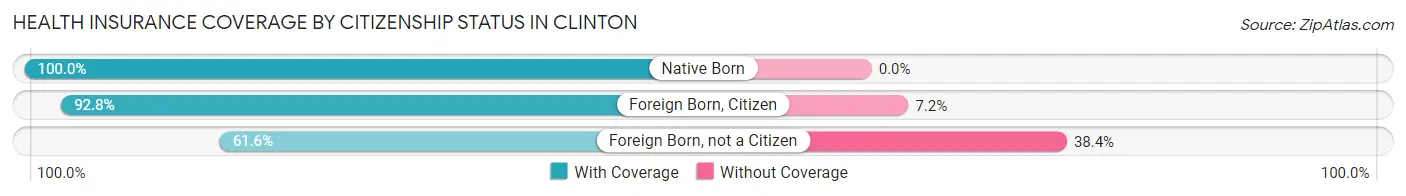
| Citizenship Status | With Coverage | Without Coverage |
| Native Born | 151 (100.0%) | 0 (0.0%) |
| Foreign Born, Citizen | 425 (92.8%) | 33 (7.2%) |
| Foreign Born, not a Citizen | 135 (61.6%) | 84 (38.4%) |
Health Insurance Coverage by Household Income in Clinton
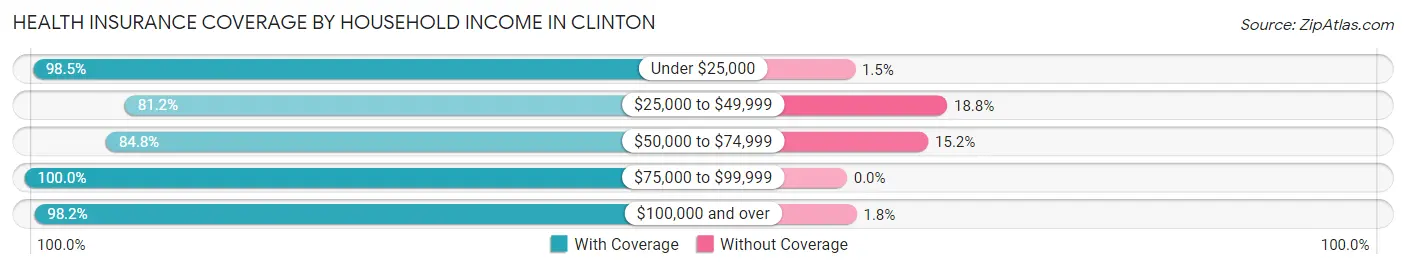
| Household Income | With Coverage | Without Coverage |
| Under $25,000 | 451 (98.5%) | 7 (1.5%) |
| $25,000 to $49,999 | 558 (81.2%) | 129 (18.8%) |
| $50,000 to $74,999 | 545 (84.8%) | 98 (15.2%) |
| $75,000 to $99,999 | 232 (100.0%) | 0 (0.0%) |
| $100,000 and over | 323 (98.2%) | 6 (1.8%) |
Public vs Private Health Insurance Coverage by Age in Clinton
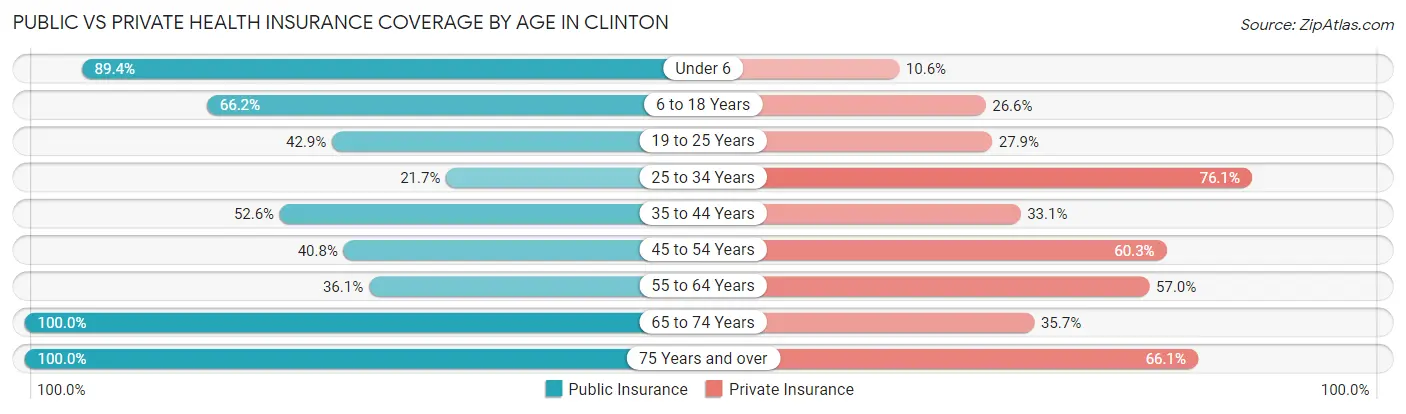
| Age Bracket | Public Insurance | Private Insurance |
| Under 6 | 135 (89.4%) | 16 (10.6%) |
| 6 to 18 Years | 303 (66.2%) | 122 (26.6%) |
| 19 to 25 Years | 94 (42.9%) | 61 (27.9%) |
| 25 to 34 Years | 40 (21.7%) | 140 (76.1%) |
| 35 to 44 Years | 81 (52.6%) | 51 (33.1%) |
| 45 to 54 Years | 161 (40.8%) | 238 (60.3%) |
| 55 to 64 Years | 105 (36.1%) | 166 (57.0%) |
| 65 to 74 Years | 356 (100.0%) | 127 (35.7%) |
| 75 Years and over | 165 (100.0%) | 109 (66.1%) |
| Total | 1,440 (60.7%) | 1,030 (43.4%) |
Disability Status by Sex by Age in Clinton
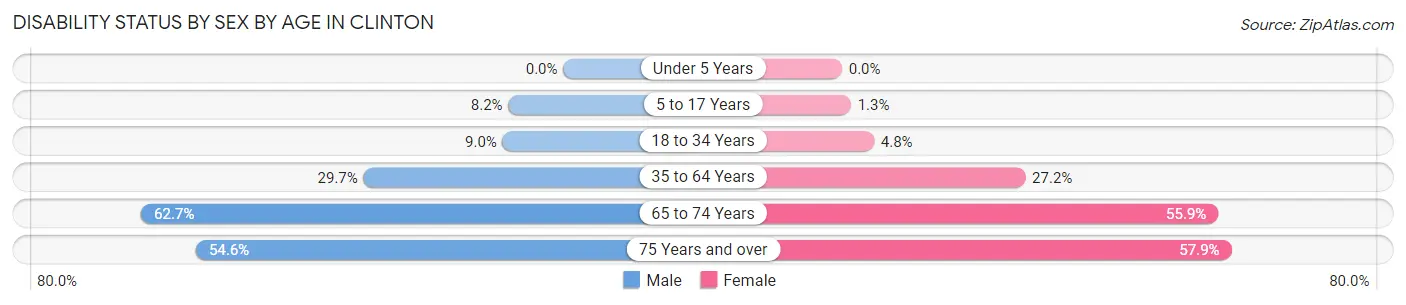
| Age Bracket | Male | Female |
| Under 5 Years | 0 (0.0%) | 0 (0.0%) |
| 5 to 17 Years | 16 (8.2%) | 3 (1.3%) |
| 18 to 34 Years | 21 (9.0%) | 11 (4.8%) |
| 35 to 64 Years | 113 (29.7%) | 125 (27.2%) |
| 65 to 74 Years | 74 (62.7%) | 133 (55.9%) |
| 75 Years and over | 24 (54.5%) | 70 (57.9%) |
Disability Class by Sex by Age in Clinton
Disability Class: Hearing Difficulty
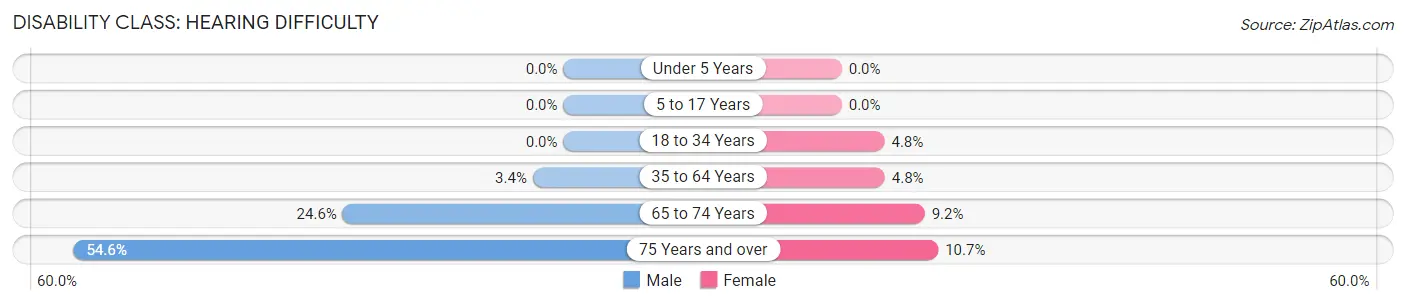
| Age Bracket | Male | Female |
| Under 5 Years | 0 (0.0%) | 0 (0.0%) |
| 5 to 17 Years | 0 (0.0%) | 0 (0.0%) |
| 18 to 34 Years | 0 (0.0%) | 11 (4.8%) |
| 35 to 64 Years | 13 (3.4%) | 22 (4.8%) |
| 65 to 74 Years | 29 (24.6%) | 22 (9.2%) |
| 75 Years and over | 24 (54.5%) | 13 (10.7%) |
Disability Class: Vision Difficulty
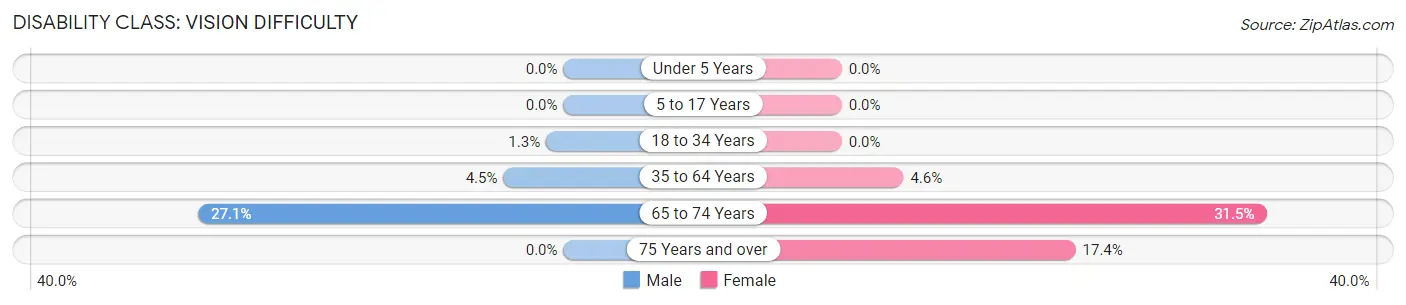
| Age Bracket | Male | Female |
| Under 5 Years | 0 (0.0%) | 0 (0.0%) |
| 5 to 17 Years | 0 (0.0%) | 0 (0.0%) |
| 18 to 34 Years | 3 (1.3%) | 0 (0.0%) |
| 35 to 64 Years | 17 (4.5%) | 21 (4.6%) |
| 65 to 74 Years | 32 (27.1%) | 75 (31.5%) |
| 75 Years and over | 0 (0.0%) | 21 (17.4%) |
Disability Class: Cognitive Difficulty
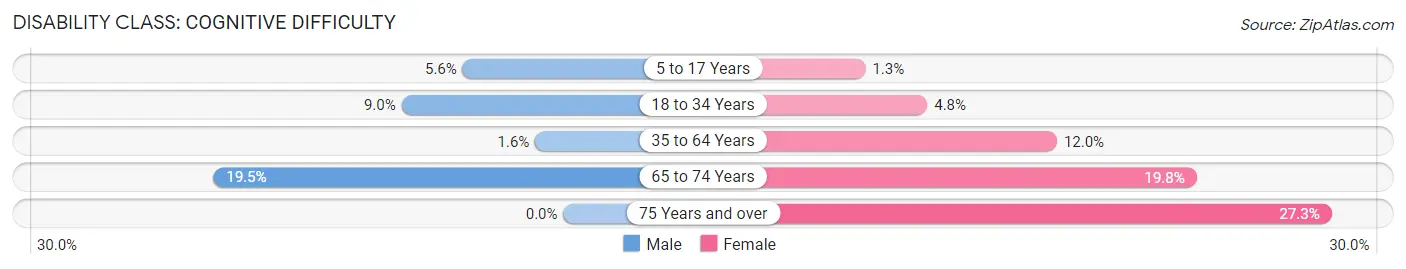
| Age Bracket | Male | Female |
| 5 to 17 Years | 11 (5.6%) | 3 (1.3%) |
| 18 to 34 Years | 21 (9.0%) | 11 (4.8%) |
| 35 to 64 Years | 6 (1.6%) | 55 (12.0%) |
| 65 to 74 Years | 23 (19.5%) | 47 (19.8%) |
| 75 Years and over | 0 (0.0%) | 33 (27.3%) |
Disability Class: Ambulatory Difficulty
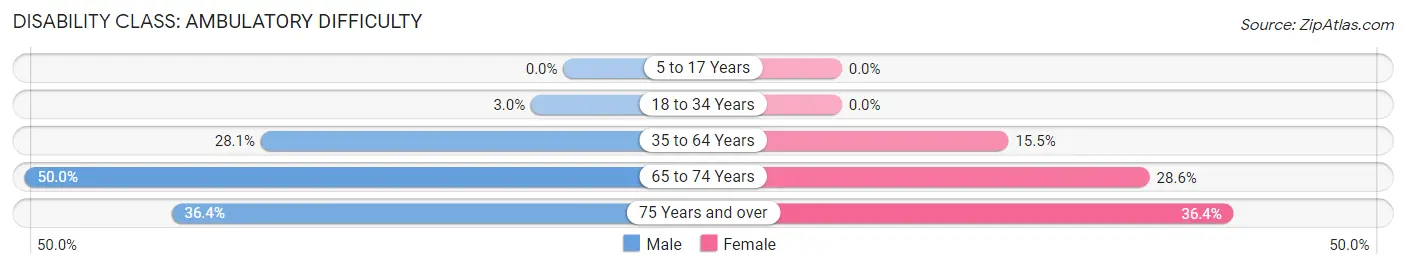
| Age Bracket | Male | Female |
| 5 to 17 Years | 0 (0.0%) | 0 (0.0%) |
| 18 to 34 Years | 7 (3.0%) | 0 (0.0%) |
| 35 to 64 Years | 107 (28.1%) | 71 (15.5%) |
| 65 to 74 Years | 59 (50.0%) | 68 (28.6%) |
| 75 Years and over | 16 (36.4%) | 44 (36.4%) |
Disability Class: Self-Care Difficulty
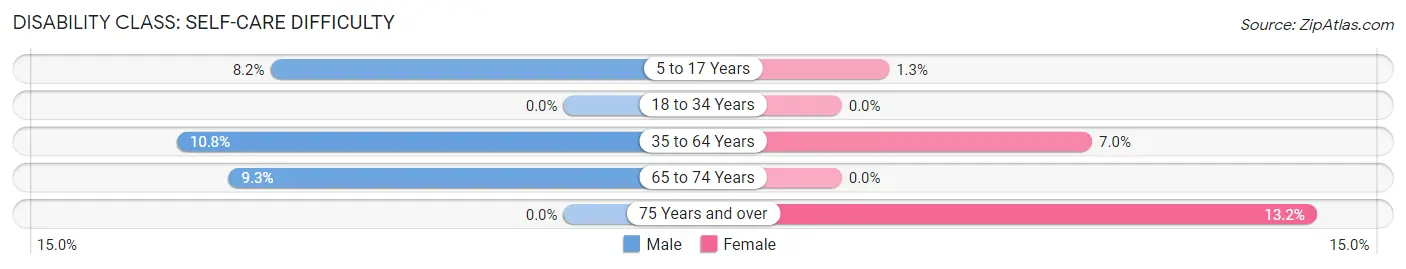
| Age Bracket | Male | Female |
| 5 to 17 Years | 16 (8.2%) | 3 (1.3%) |
| 18 to 34 Years | 0 (0.0%) | 0 (0.0%) |
| 35 to 64 Years | 41 (10.8%) | 32 (7.0%) |
| 65 to 74 Years | 11 (9.3%) | 0 (0.0%) |
| 75 Years and over | 0 (0.0%) | 16 (13.2%) |
Technology Access in Clinton
Computing Device Access in Clinton
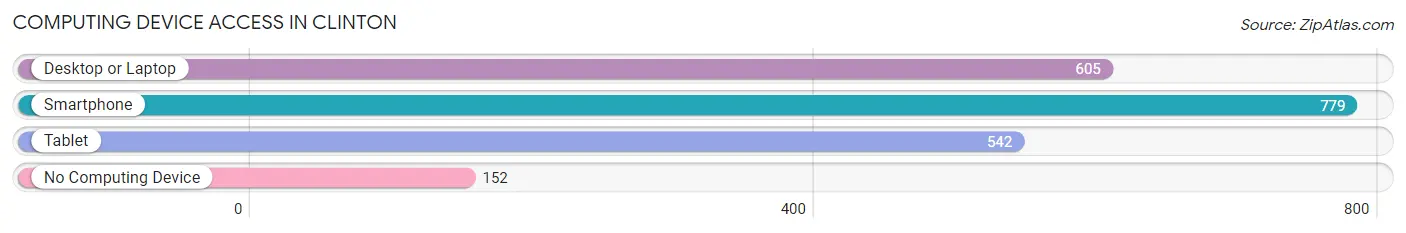
| Device Type | # Households | % Households |
| Desktop or Laptop | 605 | 61.3% |
| Smartphone | 779 | 78.9% |
| Tablet | 542 | 54.9% |
| No Computing Device | 152 | 15.4% |
| Total | 987 | 100.0% |
Internet Access in Clinton
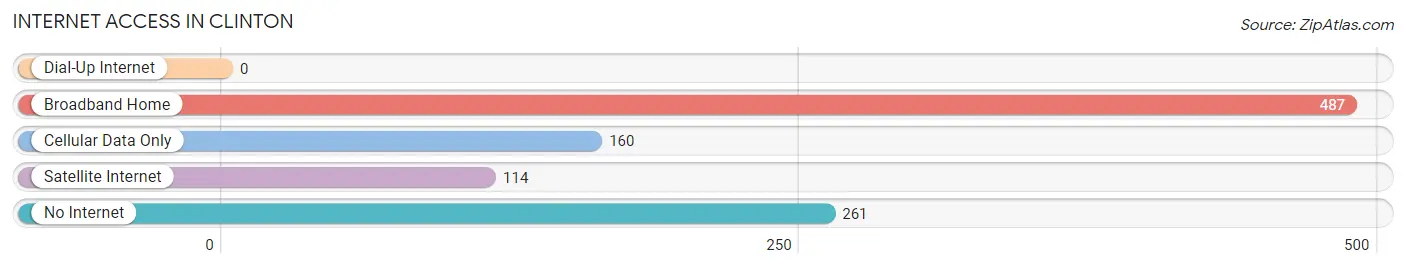
| Internet Type | # Households | % Households |
| Dial-Up Internet | 0 | 0.0% |
| Broadband Home | 487 | 49.3% |
| Cellular Data Only | 160 | 16.2% |
| Satellite Internet | 114 | 11.6% |
| No Internet | 261 | 26.4% |
| Total | 987 | 100.0% |
Clinton Summary
Clinton, Arkansas is a city located in Van Buren County in the Ozark Mountains of the U.S. state of Arkansas. It is the county seat of Van Buren County and is located on the south bank of the Little Red River. The population of Clinton was 2,619 at the 2010 census.
History
The area that is now Clinton was first settled in the early 1800s by settlers from the nearby town of Greers Ferry. The town was originally known as "Greers Ferry Landing" and was a popular stop for travelers on the Little Red River. In 1836, the town was renamed "Clinton" after DeWitt Clinton, the former governor of New York.
In 1872, the St. Louis, Iron Mountain and Southern Railway built a line through the town, connecting it to the larger cities of Little Rock and St. Louis. This allowed the town to become an important shipping center for the surrounding area.
In the late 19th century, Clinton became a popular tourist destination due to its proximity to Greers Ferry Lake. The lake was created in the 1950s when the U.S. Army Corps of Engineers built a dam on the Little Red River. The lake is now a popular spot for fishing, boating, and other recreational activities.
Geography
Clinton is located in the Ozark Mountains of north-central Arkansas. It is situated on the south bank of the Little Red River, about 10 miles (16 km) east of Greers Ferry Lake. The city has a total area of 2.3 square miles (6.0 km2), all of which is land.
The climate in Clinton is humid subtropical, with hot, humid summers and mild winters. The average annual temperature is 63 °F (17 °C), and the average annual precipitation is 48.3 inches (123 cm).
Economy
The economy of Clinton is largely based on agriculture and tourism. The city is home to several large farms, as well as several small businesses. The city is also a popular tourist destination due to its proximity to Greers Ferry Lake.
Demographics
As of the 2010 census, there were 2,619 people, 1,072 households, and 690 families residing in the city. The population density was 1,133.3 people per square mile (438.2/km2). There were 1,183 housing units at an average density of 511.3 per square mile (197.6/km2). The racial makeup of the city was 95.2% White, 0.2% African American, 0.7% Native American, 0.4% Asian, 0.1% Pacific Islander, 1.3% from other races, and 2.1% from two or more races. Hispanic or Latino of any race were 3.2% of the population.
There were 1,072 households, out of which 28.2% had children under the age of 18 living with them, 46.2% were married couples living together, 13.7% had a female householder with no husband present, and 35.2% were non-families. 30.2% of all households were made up of individuals, and 14.2% had someone living alone who was 65 years of age or older. The average household size was 2.41 and the average family size was 2.97.
In the city, the population was spread out, with 24.2% under the age of 18, 8.2% from 18 to 24, 25.2% from 25 to 44, 24.2% from 45 to 64, and 18.2% who were 65 years of age or older. The median age was 38 years. For every 100 females, there were 91.2 males. For every 100 females age 18 and over, there were 87.2 males.
The median income for a household in the city was $30,938, and the median income for a family was $37,813. Males had a median income of $30,000 versus $20,000 for females. The per capita income for the city was $17,845. About 11.2% of families and 14.2% of the population were below the poverty line, including 19.2% of those under age 18 and 11.2% of those age 65 or over.
Common Questions
What is the Total Population of Clinton?
Total Population of Clinton is 2,508.
What is the Total Male Population of Clinton?
Total Male Population of Clinton is 1,125.
What is the Total Female Population of Clinton?
Total Female Population of Clinton is 1,383.
What is the Ratio of Males per 100 Females in Clinton?
There are 81.34 Males per 100 Females in Clinton.
What is the Ratio of Females per 100 Males in Clinton?
There are 122.93 Females per 100 Males in Clinton.
What is the Median Population Age in Clinton?
Median Population Age in Clinton is 46.8 Years.
What is the Average Family Size in Clinton
Average Family Size in Clinton is 3.1 People.
What is the Average Household Size in Clinton
Average Household Size in Clinton is 2.4 People.
What is Per Capita Income in Clinton?
Per Capita income in Clinton is $21,809.
What is the Median Family Income in Clinton?
Median Family Income in Clinton is $60,203.
What is the Median Household income in Clinton?
Median Household Income in Clinton is $42,292.
What is Income or Wage Gap in Clinton?
Income or Wage Gap in Clinton is 9.4%.
Women in Clinton earn 90.6 cents for every dollar earned by a man.
What is Family Income Deficit in Clinton?
Family Income Deficit in Clinton is $8,628.
Families that are below poverty line in Clinton earn $8,628 less on average than the poverty threshold level.
What is Inequality or Gini Index in Clinton?
Inequality or Gini Index in Clinton is 0.40.
How Large is the Labor Force in Clinton?
There are 941 People in the Labor Forcein in Clinton.
What is the Percentage of People in the Labor Force in Clinton?
45.0% of People are in the Labor Force in Clinton.
What is the Unemployment Rate in Clinton?
Unemployment Rate in Clinton is 2.6%.