Carlisle, AR
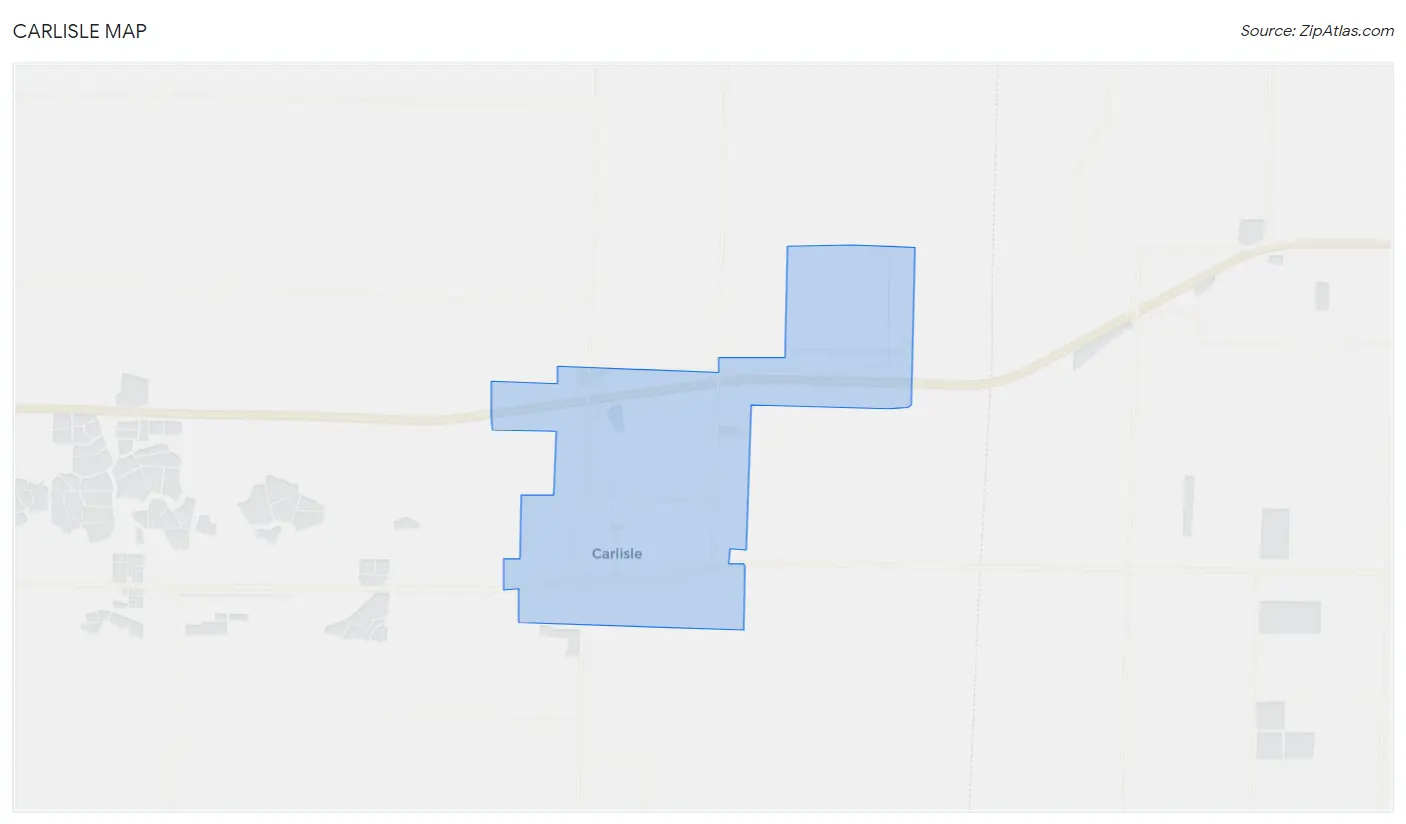
Carlisle Map
Carlisle Overview
2,329
TOTAL POPULATION
990
MALE POPULATION
1,339
FEMALE POPULATION
73.94
MALES / 100 FEMALES
135.25
FEMALES / 100 MALES
42.0
MEDIAN AGE
3.4
AVG FAMILY SIZE
2.6
AVG HOUSEHOLD SIZE
$23,460
PER CAPITA INCOME
$50,000
AVG FAMILY INCOME
$35,769
AVG HOUSEHOLD INCOME
43.9%
WAGE / INCOME GAP [ % ]
56.1¢/ $1
WAGE / INCOME GAP [ $ ]
0.48
INEQUALITY / GINI INDEX
939
LABOR FORCE [ PEOPLE ]
54.2%
PERCENT IN LABOR FORCE
6.2%
UNEMPLOYMENT RATE
Carlisle Zip Codes
Carlisle Area Codes
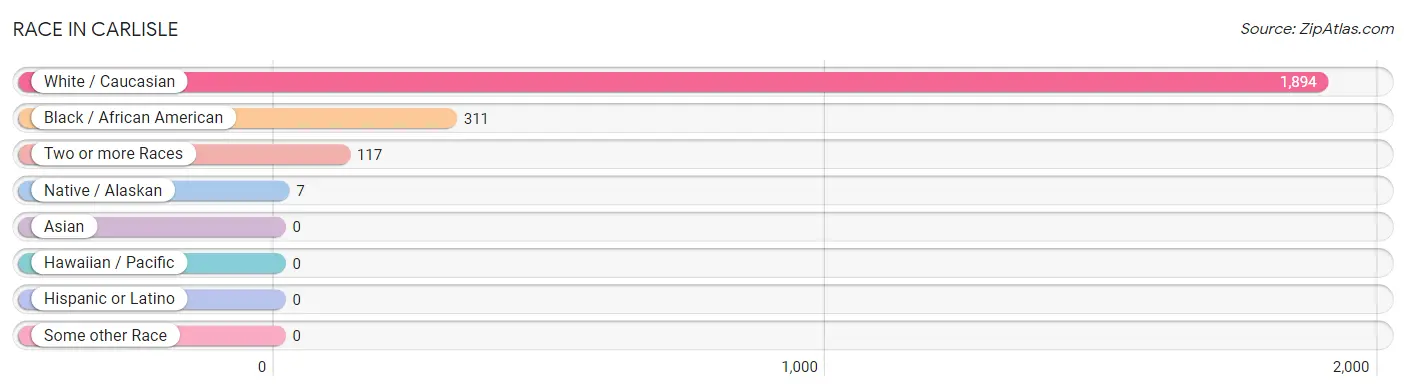
Race in Carlisle
The most populous races in Carlisle are White / Caucasian (1,894 | 81.3%), Black / African American (311 | 13.4%), and Two or more Races (117 | 5.0%).
| Race | # Population | % Population |
| Asian | 0 | 0.0% |
| Black / African American | 311 | 13.4% |
| Hawaiian / Pacific | 0 | 0.0% |
| Hispanic or Latino | 0 | 0.0% |
| Native / Alaskan | 7 | 0.3% |
| White / Caucasian | 1,894 | 81.3% |
| Two or more Races | 117 | 5.0% |
| Some other Race | 0 | 0.0% |
| Total | 2,329 | 100.0% |
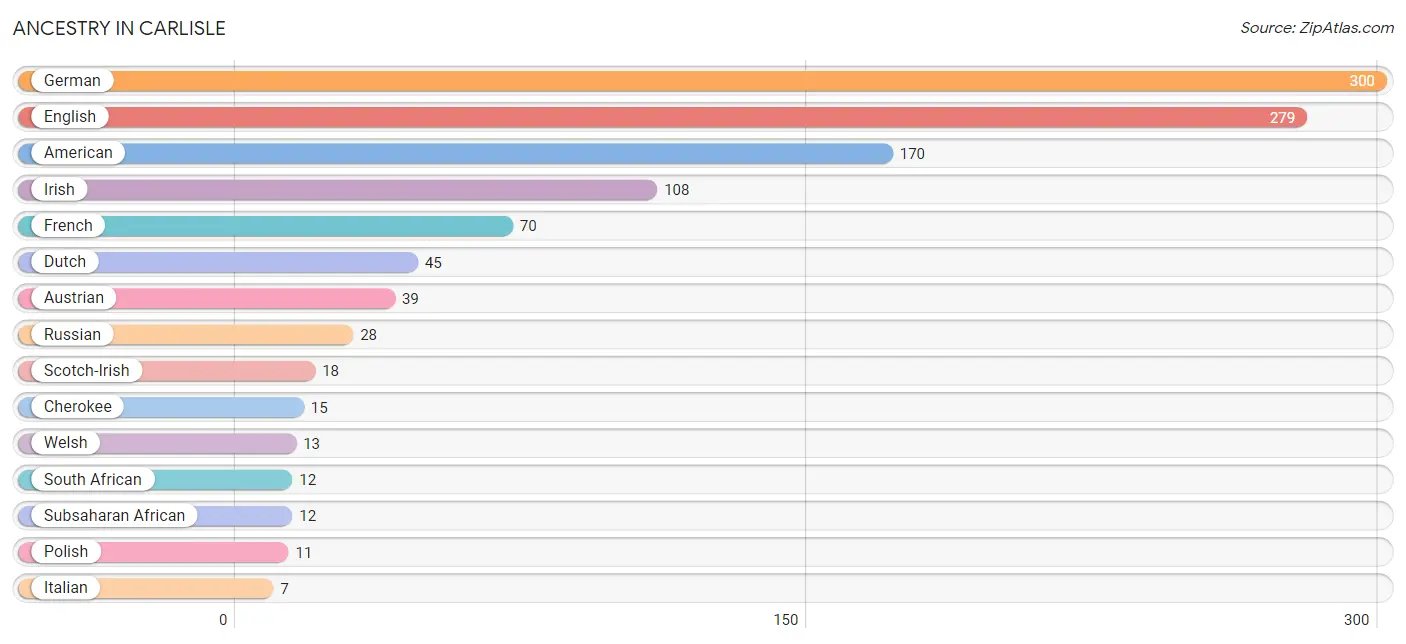
Ancestry in Carlisle
The most populous ancestries reported in Carlisle are German (300 | 12.9%), English (279 | 12.0%), American (170 | 7.3%), Irish (108 | 4.6%), and French (70 | 3.0%), together accounting for 39.8% of all Carlisle residents.
| Ancestry | # Population | % Population |
| American | 170 | 7.3% |
| Austrian | 39 | 1.7% |
| Cherokee | 15 | 0.6% |
| Dutch | 45 | 1.9% |
| English | 279 | 12.0% |
| European | 2 | 0.1% |
| French | 70 | 3.0% |
| German | 300 | 12.9% |
| Irish | 108 | 4.6% |
| Italian | 7 | 0.3% |
| Polish | 11 | 0.5% |
| Russian | 28 | 1.2% |
| Scandinavian | 3 | 0.1% |
| Scotch-Irish | 18 | 0.8% |
| South African | 12 | 0.5% |
| Subsaharan African | 12 | 0.5% |
| Welsh | 13 | 0.6% | View All 17 Rows |
Immigrants in Carlisle

| Immigration Origin | # Population | % Population | View All 0 Rows |
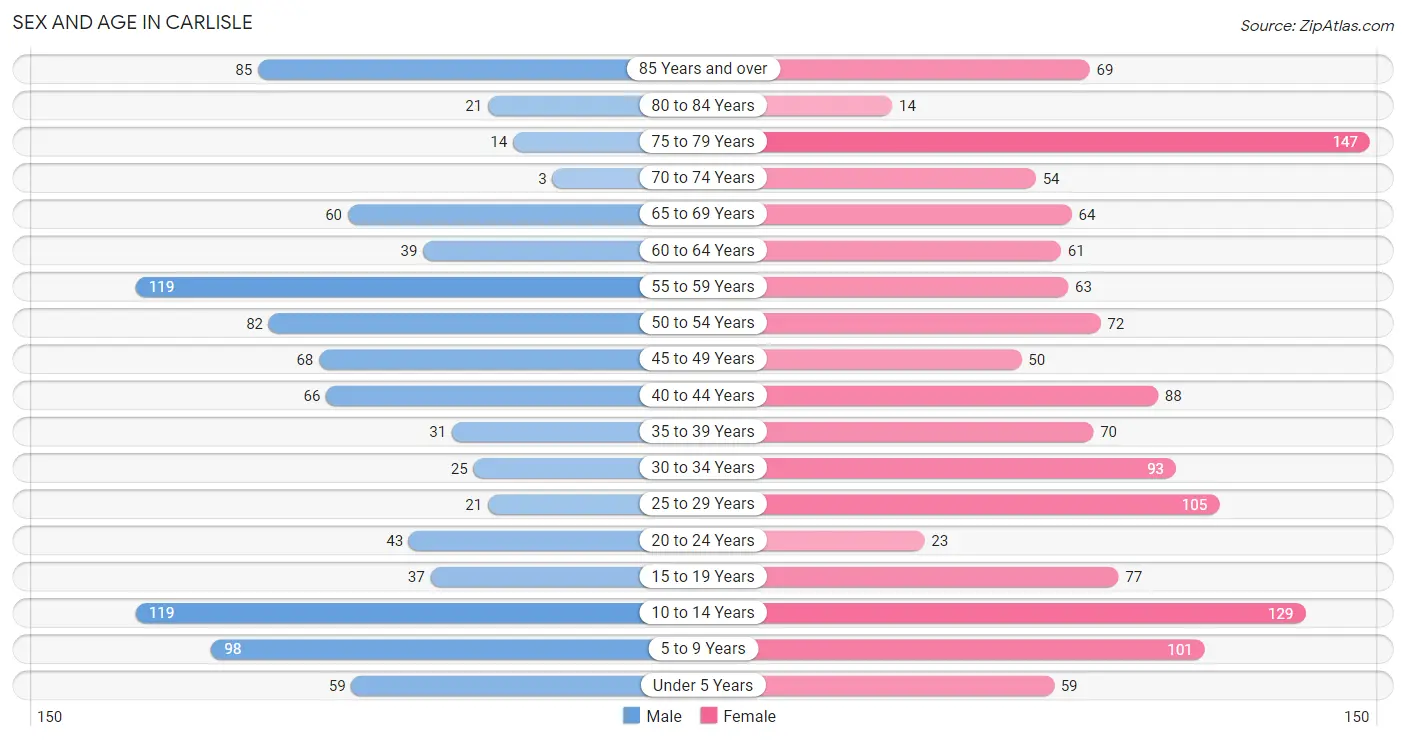
Sex and Age in Carlisle
Sex and Age in Carlisle
The most populous age groups in Carlisle are 10 to 14 Years (119 | 12.0%) for men and 75 to 79 Years (147 | 11.0%) for women.
| Age Bracket | Male | Female |
| Under 5 Years | 59 (6.0%) | 59 (4.4%) |
| 5 to 9 Years | 98 (9.9%) | 101 (7.5%) |
| 10 to 14 Years | 119 (12.0%) | 129 (9.6%) |
| 15 to 19 Years | 37 (3.7%) | 77 (5.8%) |
| 20 to 24 Years | 43 (4.3%) | 23 (1.7%) |
| 25 to 29 Years | 21 (2.1%) | 105 (7.8%) |
| 30 to 34 Years | 25 (2.5%) | 93 (7.0%) |
| 35 to 39 Years | 31 (3.1%) | 70 (5.2%) |
| 40 to 44 Years | 66 (6.7%) | 88 (6.6%) |
| 45 to 49 Years | 68 (6.9%) | 50 (3.7%) |
| 50 to 54 Years | 82 (8.3%) | 72 (5.4%) |
| 55 to 59 Years | 119 (12.0%) | 63 (4.7%) |
| 60 to 64 Years | 39 (3.9%) | 61 (4.6%) |
| 65 to 69 Years | 60 (6.1%) | 64 (4.8%) |
| 70 to 74 Years | 3 (0.3%) | 54 (4.0%) |
| 75 to 79 Years | 14 (1.4%) | 147 (11.0%) |
| 80 to 84 Years | 21 (2.1%) | 14 (1.1%) |
| 85 Years and over | 85 (8.6%) | 69 (5.1%) |
| Total | 990 (100.0%) | 1,339 (100.0%) |
Families and Households in Carlisle
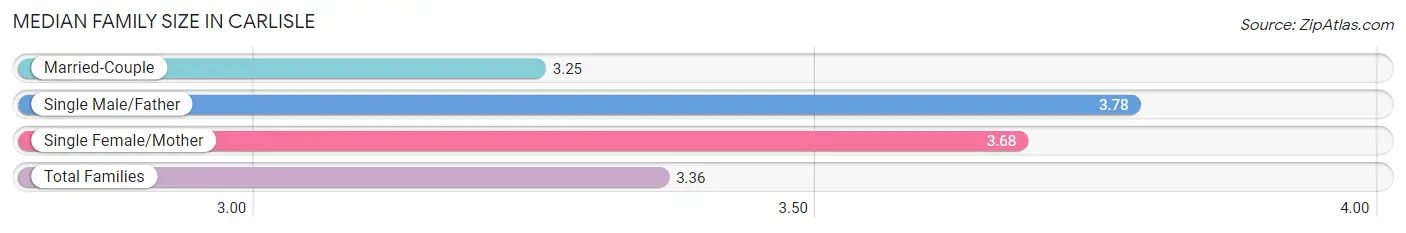
Median Family Size in Carlisle
The median family size in Carlisle is 3.36 persons per family, with single male/father families (18 | 3.1%) accounting for the largest median family size of 3.78 persons per family. On the other hand, married-couple families (429 | 74.0%) represent the smallest median family size with 3.25 persons per family.
| Family Type | # Families | Family Size |
| Married-Couple | 429 (74.0%) | 3.25 |
| Single Male/Father | 18 (3.1%) | 3.78 |
| Single Female/Mother | 133 (22.9%) | 3.68 |
| Total Families | 580 (100.0%) | 3.36 |
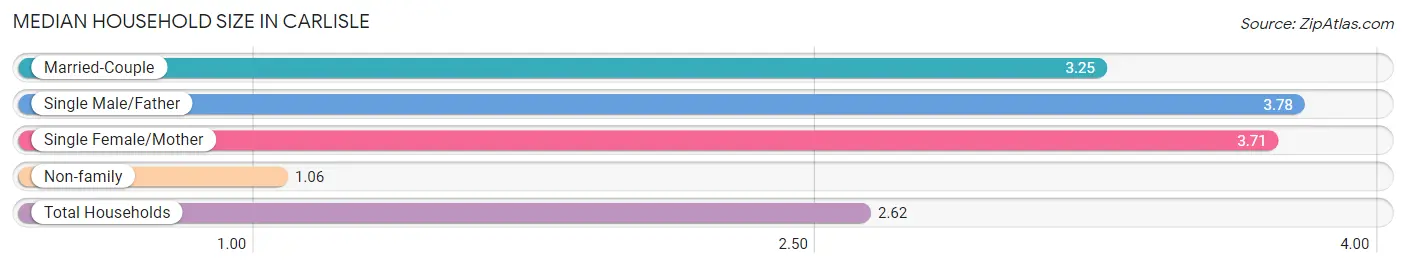
Median Household Size in Carlisle
The median household size in Carlisle is 2.62 persons per household, with single male/father households (18 | 2.1%) accounting for the largest median household size of 3.78 persons per household. non-family households (278 | 32.4%) represent the smallest median household size with 1.06 persons per household.
| Household Type | # Households | Household Size |
| Married-Couple | 429 (50.0%) | 3.25 |
| Single Male/Father | 18 (2.1%) | 3.78 |
| Single Female/Mother | 133 (15.5%) | 3.71 |
| Non-family | 278 (32.4%) | 1.06 |
| Total Households | 858 (100.0%) | 2.62 |
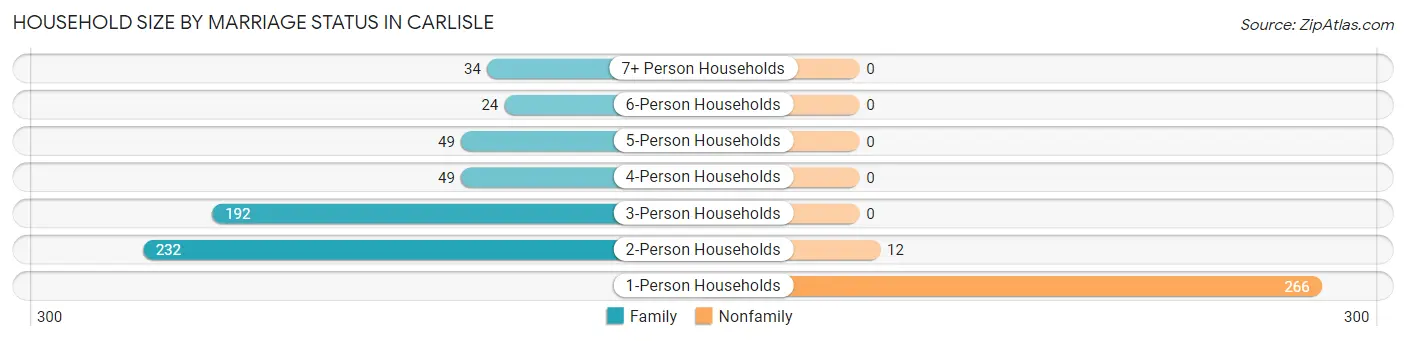
Household Size by Marriage Status in Carlisle
Out of a total of 858 households in Carlisle, 580 (67.6%) are family households, while 278 (32.4%) are nonfamily households. The most numerous type of family households are 2-person households, comprising 232, and the most common type of nonfamily households are 1-person households, comprising 266.
| Household Size | Family Households | Nonfamily Households |
| 1-Person Households | - | 266 (31.0%) |
| 2-Person Households | 232 (27.0%) | 12 (1.4%) |
| 3-Person Households | 192 (22.4%) | 0 (0.0%) |
| 4-Person Households | 49 (5.7%) | 0 (0.0%) |
| 5-Person Households | 49 (5.7%) | 0 (0.0%) |
| 6-Person Households | 24 (2.8%) | 0 (0.0%) |
| 7+ Person Households | 34 (4.0%) | 0 (0.0%) |
| Total | 580 (67.6%) | 278 (32.4%) |
Female Fertility in Carlisle
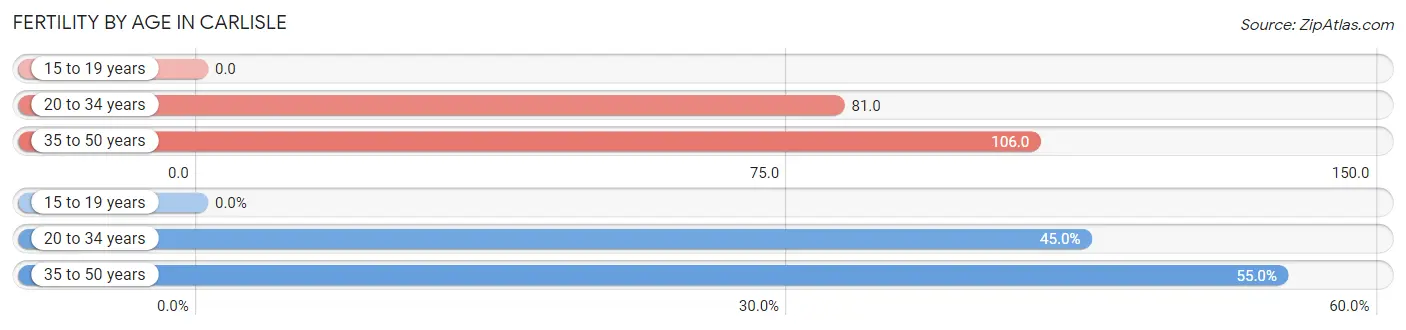
Fertility by Age in Carlisle
Average fertility rate in Carlisle is 79.0 births per 1,000 women. Women in the age bracket of 35 to 50 years have the highest fertility rate with 106.0 births per 1,000 women. Women in the age bracket of 35 to 50 years acount for 55.0% of all women with births.
| Age Bracket | Women with Births | Births / 1,000 Women |
| 15 to 19 years | 0 (0.0%) | 0.0 |
| 20 to 34 years | 18 (45.0%) | 81.0 |
| 35 to 50 years | 22 (55.0%) | 106.0 |
| Total | 40 (100.0%) | 79.0 |
Fertility by Age by Marriage Status in Carlisle
67.5% of women with births (40) in Carlisle are married. The highest percentage of unmarried women with births falls into 20 to 34 years age bracket with 72.2% of them unmarried at the time of birth, while the lowest percentage of unmarried women with births belong to 35 to 50 years age bracket with 0.0% of them unmarried.
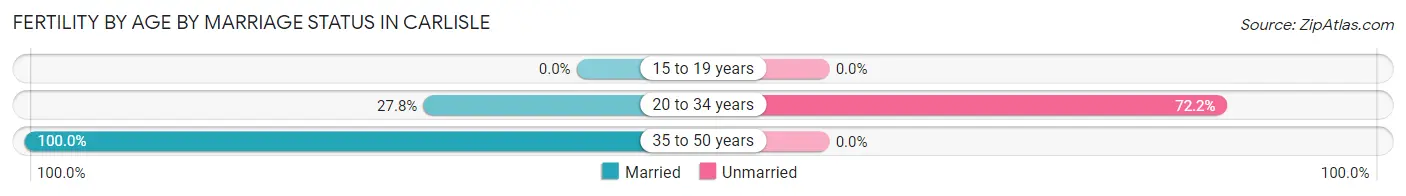
| Age Bracket | Married | Unmarried |
| 15 to 19 years | 0 (0.0%) | 0 (0.0%) |
| 20 to 34 years | 5 (27.8%) | 13 (72.2%) |
| 35 to 50 years | 22 (100.0%) | 0 (0.0%) |
| Total | 27 (67.5%) | 13 (32.5%) |
Fertility by Education in Carlisle
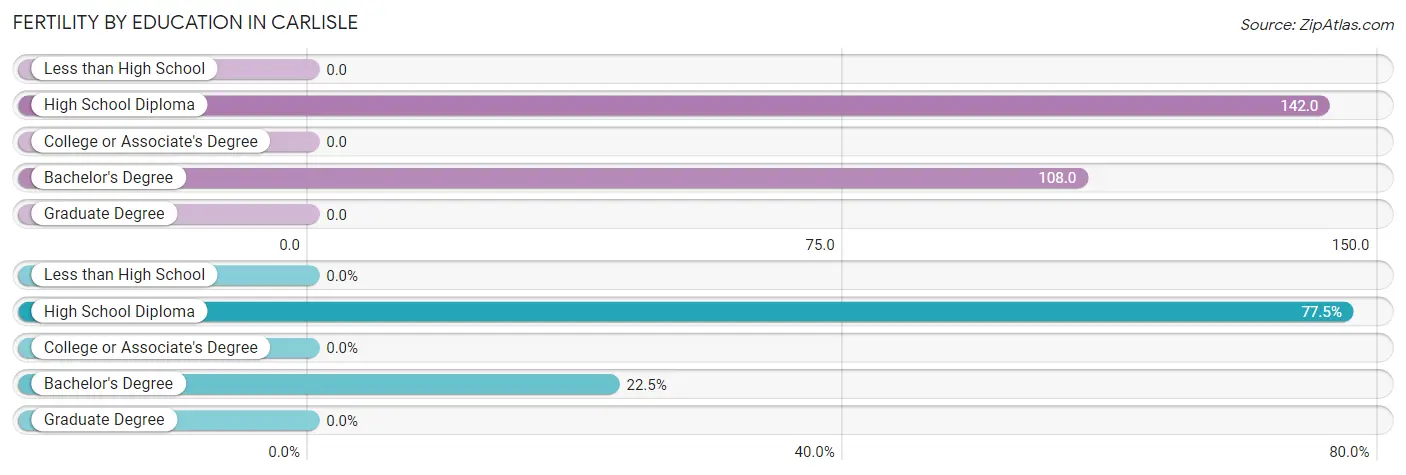
| Educational Attainment | Women with Births | Births / 1,000 Women |
| Less than High School | 0 (0.0%) | 0.0 |
| High School Diploma | 31 (77.5%) | 142.0 |
| College or Associate's Degree | 0 (0.0%) | 0.0 |
| Bachelor's Degree | 9 (22.5%) | 108.0 |
| Graduate Degree | 0 (0.0%) | 0.0 |
| Total | 40 (100.0%) | 79.0 |
Fertility by Education by Marriage Status in Carlisle
32.5% of women with births in Carlisle are unmarried. Women with the educational attainment of bachelor's degree are most likely to be married with 100.0% of them married at childbirth, while women with the educational attainment of high school diploma are least likely to be married with 41.9% of them unmarried at childbirth.
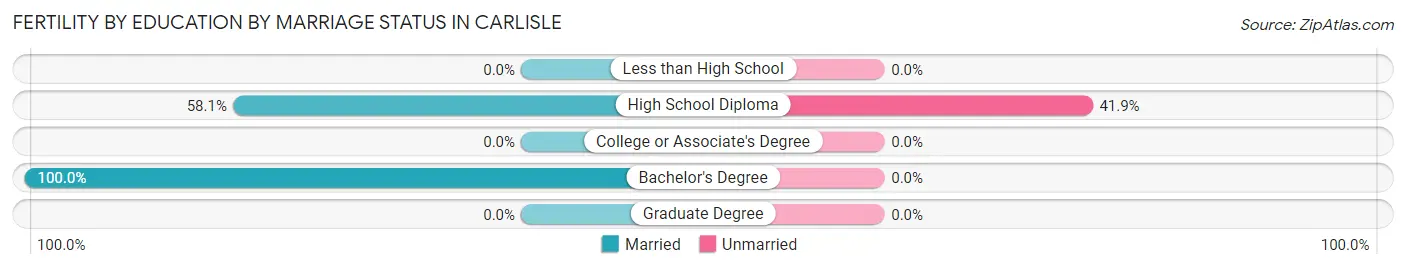
| Educational Attainment | Married | Unmarried |
| Less than High School | 0 (0.0%) | 0 (0.0%) |
| High School Diploma | 18 (58.1%) | 13 (41.9%) |
| College or Associate's Degree | 0 (0.0%) | 0 (0.0%) |
| Bachelor's Degree | 9 (100.0%) | 0 (0.0%) |
| Graduate Degree | 0 (0.0%) | 0 (0.0%) |
| Total | 27 (67.5%) | 13 (32.5%) |
Income in Carlisle
Income Overview in Carlisle
Per Capita Income in Carlisle is $23,460, while median incomes of families and households are $50,000 and $35,769 respectively.
| Characteristic | Number | Measure |
| Per Capita Income | 2,329 | $23,460 |
| Median Family Income | 580 | $50,000 |
| Mean Family Income | 580 | $77,961 |
| Median Household Income | 858 | $35,769 |
| Mean Household Income | 858 | $60,383 |
| Income Deficit | 580 | $0 |
| Wage / Income Gap (%) | 2,329 | 43.85% |
| Wage / Income Gap ($) | 2,329 | 56.15¢ per $1 |
| Gini / Inequality Index | 2,329 | 0.48 |
Earnings by Sex in Carlisle
Average Earnings in Carlisle are $36,528, $44,464 for men and $24,965 for women, a difference of 43.9%.
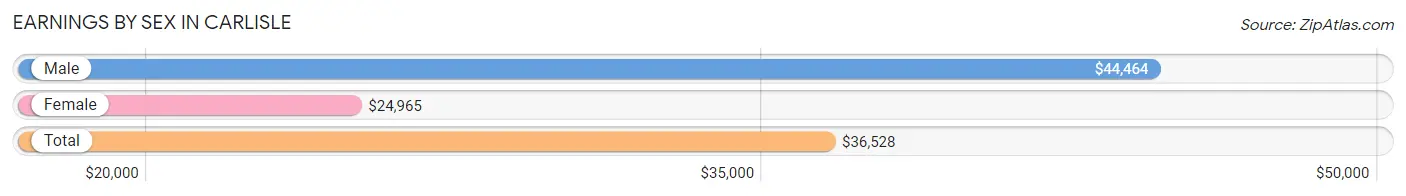
| Sex | Number | Average Earnings |
| Male | 497 (52.4%) | $44,464 |
| Female | 452 (47.6%) | $24,965 |
| Total | 949 (100.0%) | $36,528 |
Earnings by Sex by Income Bracket in Carlisle
The most common earnings brackets in Carlisle are $100,000+ for men (57 | 11.5%) and $22,500 to $24,999 for women (72 | 15.9%).
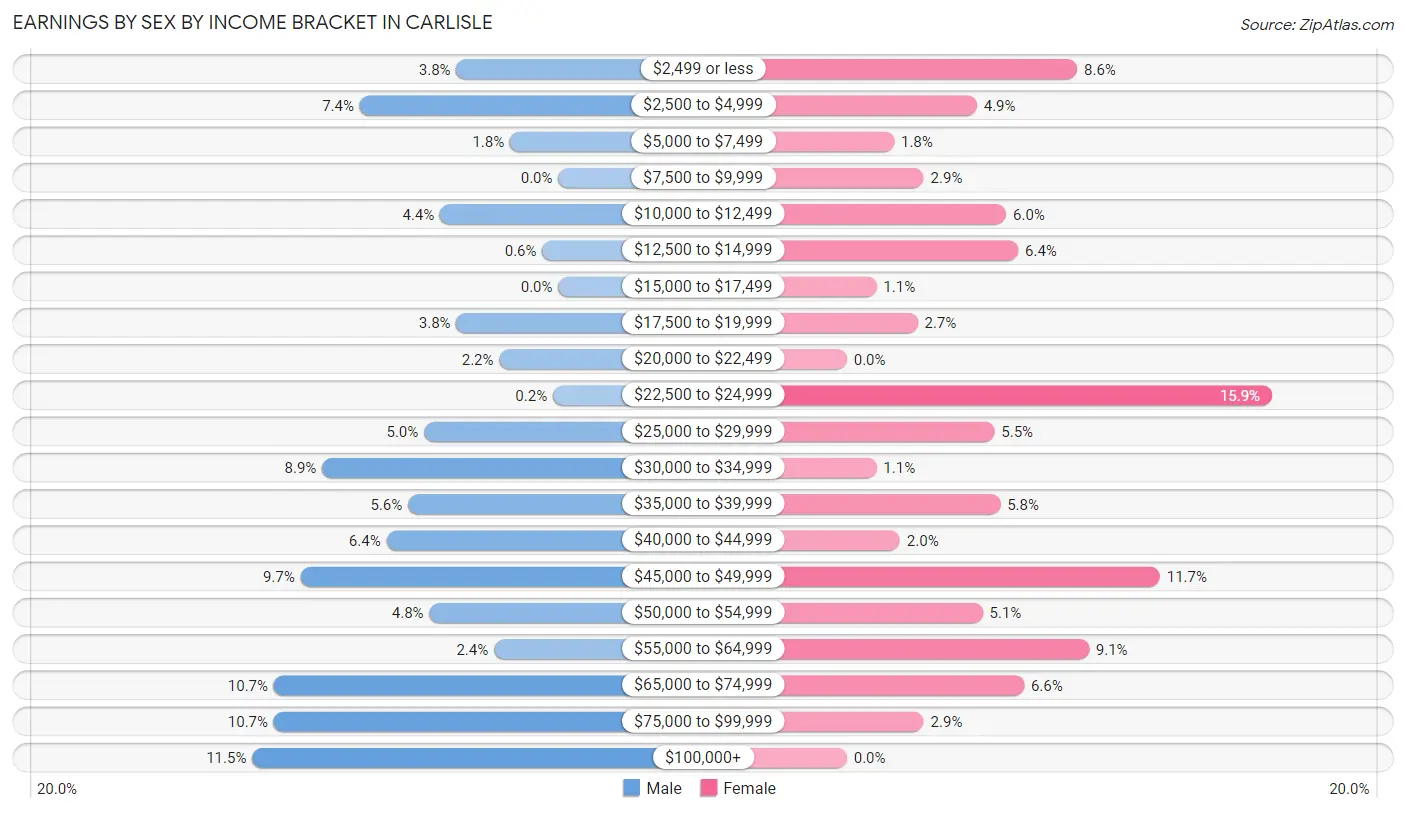
| Income | Male | Female |
| $2,499 or less | 19 (3.8%) | 39 (8.6%) |
| $2,500 to $4,999 | 37 (7.4%) | 22 (4.9%) |
| $5,000 to $7,499 | 9 (1.8%) | 8 (1.8%) |
| $7,500 to $9,999 | 0 (0.0%) | 13 (2.9%) |
| $10,000 to $12,499 | 22 (4.4%) | 27 (6.0%) |
| $12,500 to $14,999 | 3 (0.6%) | 29 (6.4%) |
| $15,000 to $17,499 | 0 (0.0%) | 5 (1.1%) |
| $17,500 to $19,999 | 19 (3.8%) | 12 (2.6%) |
| $20,000 to $22,499 | 11 (2.2%) | 0 (0.0%) |
| $22,500 to $24,999 | 1 (0.2%) | 72 (15.9%) |
| $25,000 to $29,999 | 25 (5.0%) | 25 (5.5%) |
| $30,000 to $34,999 | 44 (8.8%) | 5 (1.1%) |
| $35,000 to $39,999 | 28 (5.6%) | 26 (5.8%) |
| $40,000 to $44,999 | 32 (6.4%) | 9 (2.0%) |
| $45,000 to $49,999 | 48 (9.7%) | 53 (11.7%) |
| $50,000 to $54,999 | 24 (4.8%) | 23 (5.1%) |
| $55,000 to $64,999 | 12 (2.4%) | 41 (9.1%) |
| $65,000 to $74,999 | 53 (10.7%) | 30 (6.6%) |
| $75,000 to $99,999 | 53 (10.7%) | 13 (2.9%) |
| $100,000+ | 57 (11.5%) | 0 (0.0%) |
| Total | 497 (100.0%) | 452 (100.0%) |
Earnings by Sex by Educational Attainment in Carlisle
Average earnings in Carlisle are $45,500 for men and $29,904 for women, a difference of 34.3%. Men with an educational attainment of college or associate's degree enjoy the highest average annual earnings of $58,571, while those with high school diploma education earn the least with $42,050. Women with an educational attainment of bachelor's degree earn the most with the average annual earnings of $49,637, while those with college or associate's degree education have the smallest earnings of $24,375.
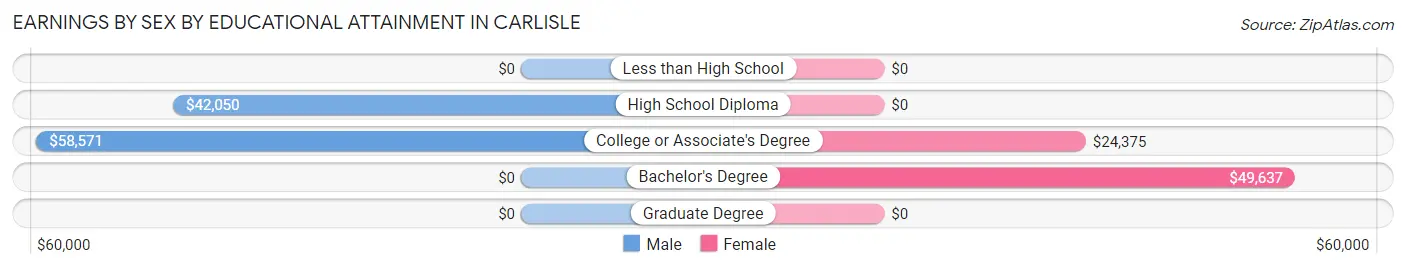
| Educational Attainment | Male Income | Female Income |
| Less than High School | - | - |
| High School Diploma | $42,050 | $0 |
| College or Associate's Degree | $58,571 | $24,375 |
| Bachelor's Degree | - | - |
| Graduate Degree | - | - |
| Total | $45,500 | $29,904 |
Family Income in Carlisle
Family Income Brackets in Carlisle
According to the Carlisle family income data, there are 135 families falling into the $100,000 to $149,999 income range, which is the most common income bracket and makes up 23.3% of all families. Conversely, the less than $10,000 income bracket is the least frequent group with only 7 families (1.2%) belonging to this category.
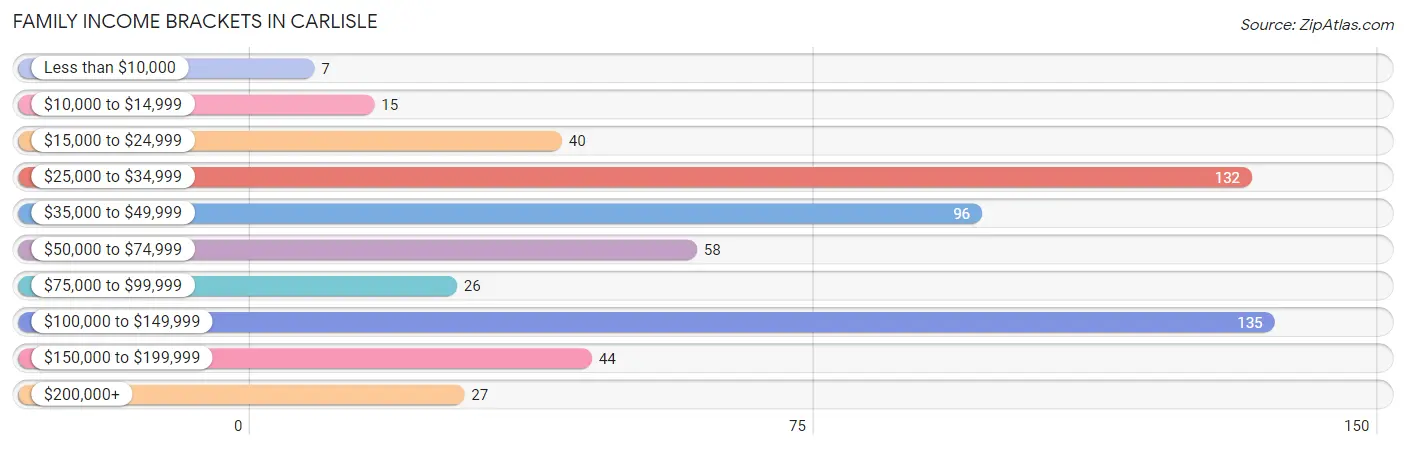
| Income Bracket | # Families | % Families |
| Less than $10,000 | 7 | 1.2% |
| $10,000 to $14,999 | 15 | 2.6% |
| $15,000 to $24,999 | 40 | 6.9% |
| $25,000 to $34,999 | 132 | 22.8% |
| $35,000 to $49,999 | 96 | 16.6% |
| $50,000 to $74,999 | 58 | 10.0% |
| $75,000 to $99,999 | 26 | 4.5% |
| $100,000 to $149,999 | 135 | 23.3% |
| $150,000 to $199,999 | 44 | 7.6% |
| $200,000+ | 27 | 4.7% |
Family Income by Famaliy Size in Carlisle
5-person families (49 | 8.5%) account for the highest median family income in Carlisle with $85,625 per family, while 2-person families (236 | 40.7%) have the highest median income of $23,646 per family member.
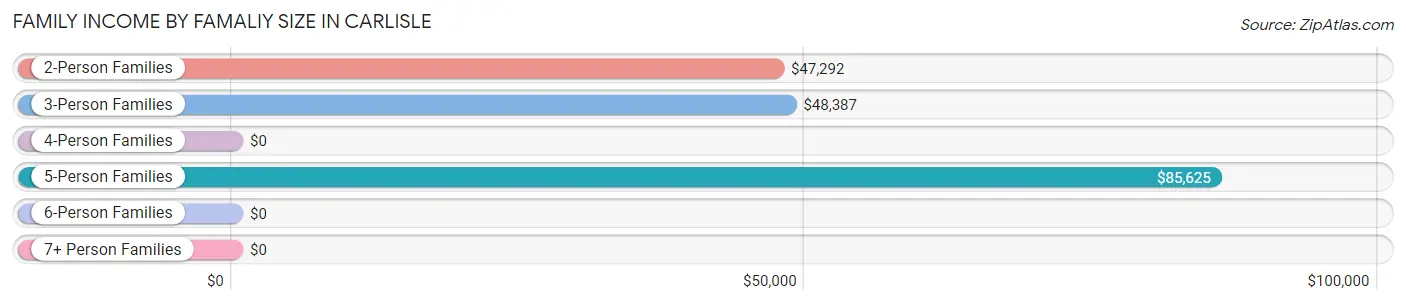
| Income Bracket | # Families | Median Income |
| 2-Person Families | 236 (40.7%) | $47,292 |
| 3-Person Families | 188 (32.4%) | $48,387 |
| 4-Person Families | 49 (8.5%) | $0 |
| 5-Person Families | 49 (8.5%) | $85,625 |
| 6-Person Families | 24 (4.1%) | $0 |
| 7+ Person Families | 34 (5.9%) | $0 |
| Total | 580 (100.0%) | $50,000 |
Family Income by Number of Earners in Carlisle
The median family income in Carlisle is $50,000, with families comprising 3+ earners (72) having the highest median family income of $128,261, while families with no earners (89) have the lowest median family income of $30,708, accounting for 12.4% and 15.3% of families, respectively.
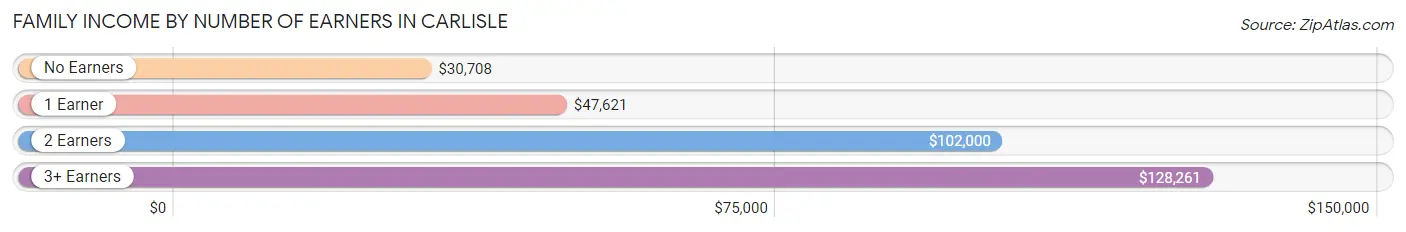
| Number of Earners | # Families | Median Income |
| No Earners | 89 (15.3%) | $30,708 |
| 1 Earner | 211 (36.4%) | $47,621 |
| 2 Earners | 208 (35.9%) | $102,000 |
| 3+ Earners | 72 (12.4%) | $128,261 |
| Total | 580 (100.0%) | $50,000 |
Household Income in Carlisle
Household Income Brackets in Carlisle
With 160 households falling in the category, the $15,000 to $24,999 income range is the most frequent in Carlisle, accounting for 18.6% of all households. In contrast, only 27 households (3.2%) fall into the $200,000+ income bracket, making it the least populous group.
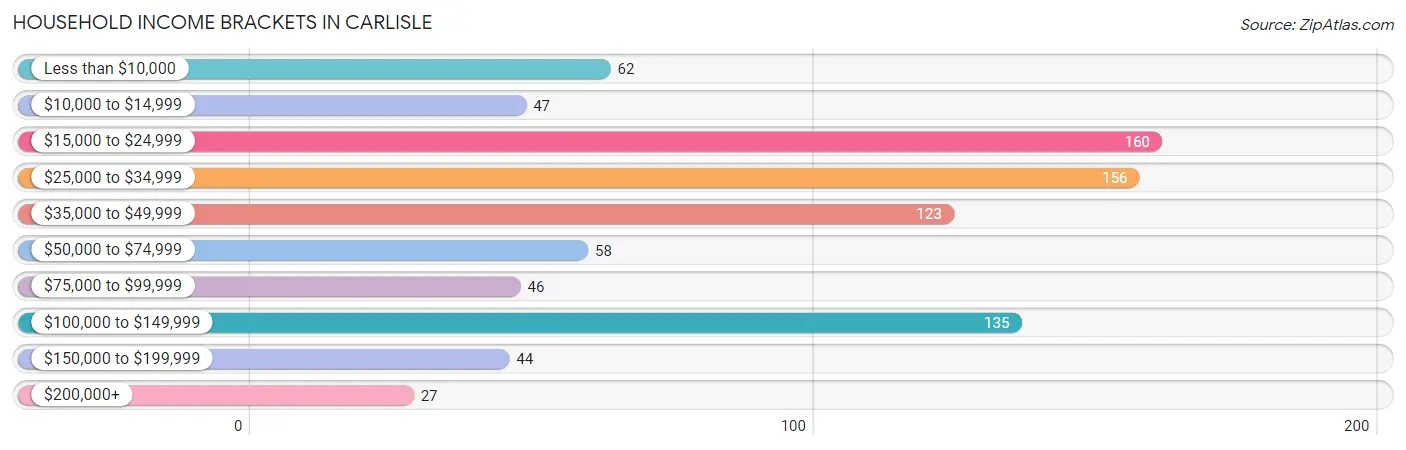
| Income Bracket | # Households | % Households |
| Less than $10,000 | 62 | 7.2% |
| $10,000 to $14,999 | 47 | 5.5% |
| $15,000 to $24,999 | 160 | 18.6% |
| $25,000 to $34,999 | 156 | 18.2% |
| $35,000 to $49,999 | 123 | 14.3% |
| $50,000 to $74,999 | 58 | 6.8% |
| $75,000 to $99,999 | 46 | 5.4% |
| $100,000 to $149,999 | 135 | 15.7% |
| $150,000 to $199,999 | 44 | 5.1% |
| $200,000+ | 27 | 3.1% |
Household Income by Householder Age in Carlisle
The median household income in Carlisle is $35,769, with the highest median household income of $47,000 found in the 45 to 64 years age bracket for the primary householder. A total of 296 households (34.5%) fall into this category.
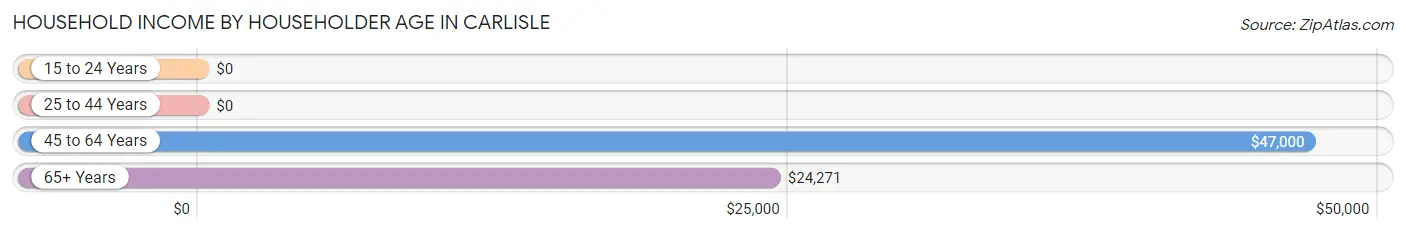
| Income Bracket | # Households | Median Income |
| 15 to 24 Years | 0 (0.0%) | $0 |
| 25 to 44 Years | 232 (27.0%) | $0 |
| 45 to 64 Years | 296 (34.5%) | $47,000 |
| 65+ Years | 330 (38.5%) | $24,271 |
| Total | 858 (100.0%) | $35,769 |
Poverty in Carlisle
Income Below Poverty by Sex and Age in Carlisle
With 16.6% poverty level for males and 19.7% for females among the residents of Carlisle, 6 to 11 year old males and 15 year old females are the most vulnerable to poverty, with 63 males (73.3%) and 20 females (100.0%) in their respective age groups living below the poverty level.
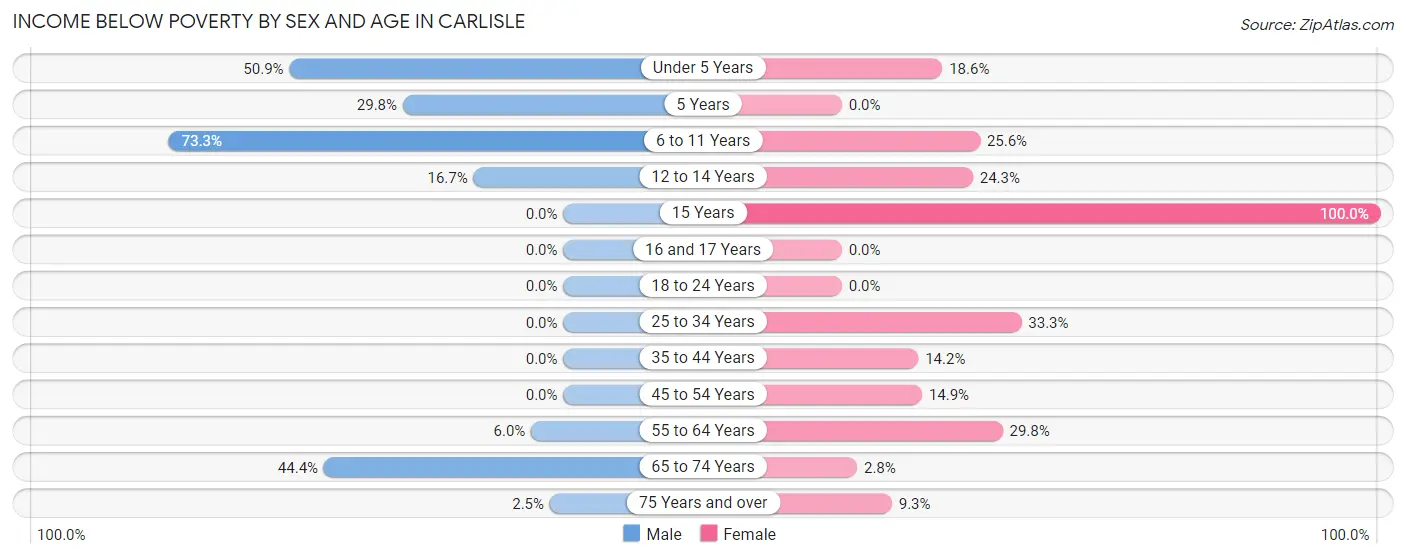
| Age Bracket | Male | Female |
| Under 5 Years | 30 (50.8%) | 11 (18.6%) |
| 5 Years | 14 (29.8%) | 0 (0.0%) |
| 6 to 11 Years | 63 (73.3%) | 40 (25.6%) |
| 12 to 14 Years | 14 (16.7%) | 18 (24.3%) |
| 15 Years | 0 (0.0%) | 20 (100.0%) |
| 16 and 17 Years | 0 (0.0%) | 0 (0.0%) |
| 18 to 24 Years | 0 (0.0%) | 0 (0.0%) |
| 25 to 34 Years | 0 (0.0%) | 66 (33.3%) |
| 35 to 44 Years | 0 (0.0%) | 22 (14.2%) |
| 45 to 54 Years | 0 (0.0%) | 18 (14.9%) |
| 55 to 64 Years | 8 (6.0%) | 37 (29.8%) |
| 65 to 74 Years | 28 (44.4%) | 3 (2.8%) |
| 75 Years and over | 3 (2.5%) | 18 (9.3%) |
| Total | 160 (16.6%) | 253 (19.7%) |
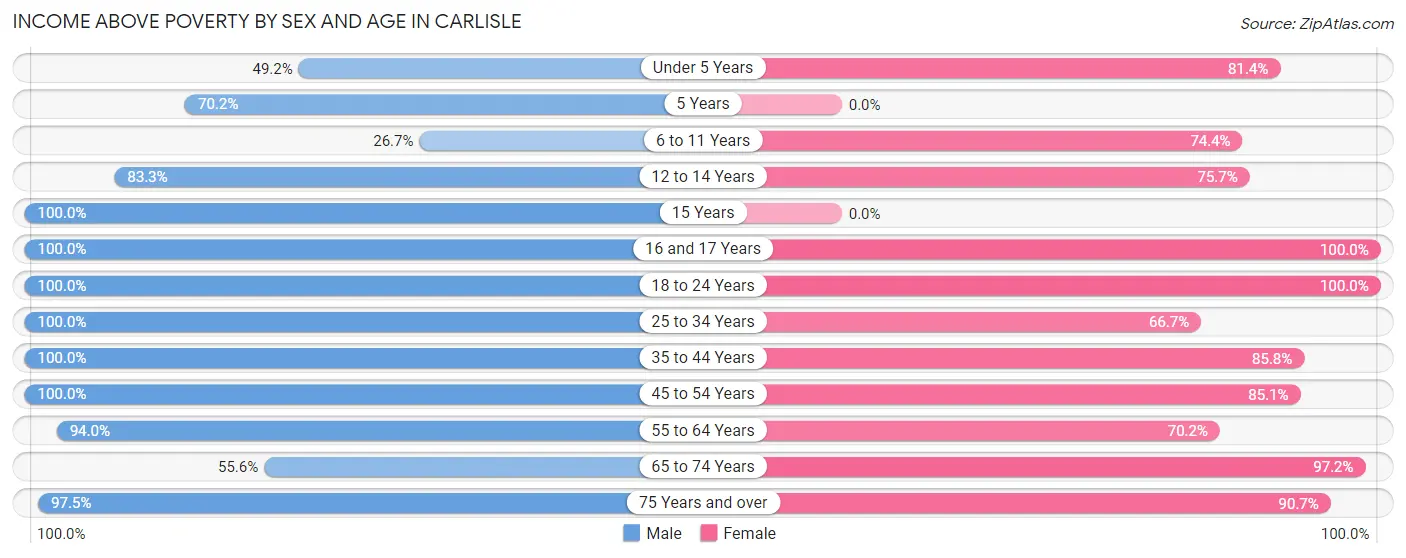
Income Above Poverty by Sex and Age in Carlisle
According to the poverty statistics in Carlisle, males aged 15 years and females aged 16 and 17 years are the age groups that are most secure financially, with 100.0% of males and 100.0% of females in these age groups living above the poverty line.
| Age Bracket | Male | Female |
| Under 5 Years | 29 (49.1%) | 48 (81.4%) |
| 5 Years | 33 (70.2%) | 0 (0.0%) |
| 6 to 11 Years | 23 (26.7%) | 116 (74.4%) |
| 12 to 14 Years | 70 (83.3%) | 56 (75.7%) |
| 15 Years | 11 (100.0%) | 0 (0.0%) |
| 16 and 17 Years | 14 (100.0%) | 24 (100.0%) |
| 18 to 24 Years | 54 (100.0%) | 56 (100.0%) |
| 25 to 34 Years | 44 (100.0%) | 132 (66.7%) |
| 35 to 44 Years | 97 (100.0%) | 133 (85.8%) |
| 45 to 54 Years | 150 (100.0%) | 103 (85.1%) |
| 55 to 64 Years | 126 (94.0%) | 87 (70.2%) |
| 65 to 74 Years | 35 (55.6%) | 103 (97.2%) |
| 75 Years and over | 117 (97.5%) | 176 (90.7%) |
| Total | 803 (83.4%) | 1,034 (80.3%) |
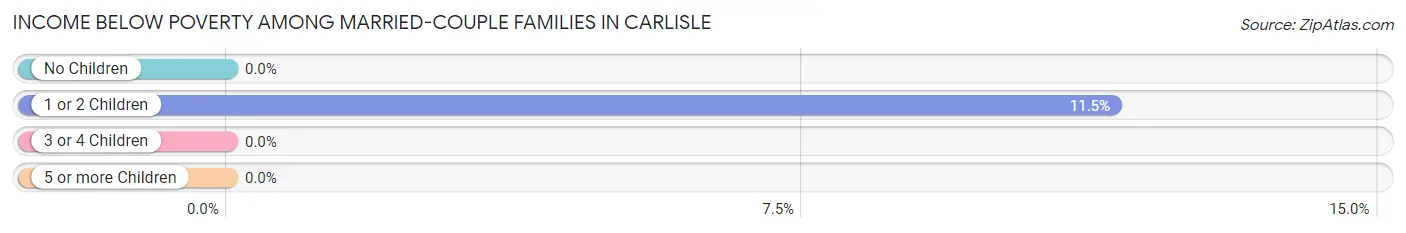
Income Below Poverty Among Married-Couple Families in Carlisle
The poverty statistics for married-couple families in Carlisle show that 3.5% or 15 of the total 429 families live below the poverty line. Families with 1 or 2 children have the highest poverty rate of 11.5%, comprising of 15 families. On the other hand, families with no children have the lowest poverty rate of 0.0%, which includes 0 families.
| Children | Above Poverty | Below Poverty |
| No Children | 243 (100.0%) | 0 (0.0%) |
| 1 or 2 Children | 115 (88.5%) | 15 (11.5%) |
| 3 or 4 Children | 40 (100.0%) | 0 (0.0%) |
| 5 or more Children | 16 (100.0%) | 0 (0.0%) |
| Total | 414 (96.5%) | 15 (3.5%) |
Income Below Poverty Among Single-Parent Households in Carlisle
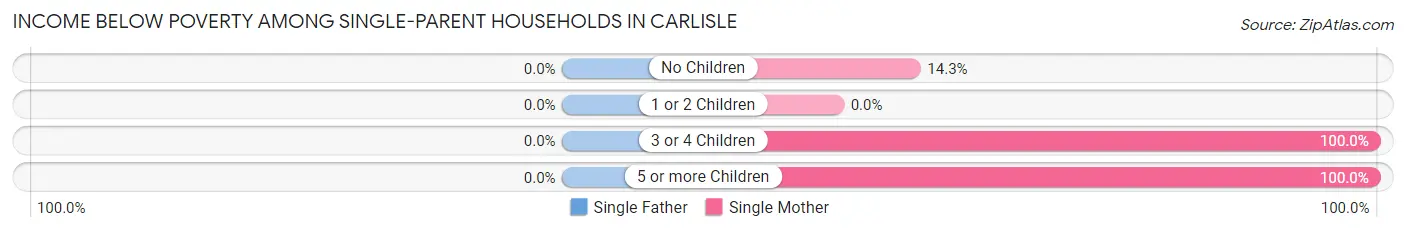
| Children | Single Father | Single Mother |
| No Children | 0 (0.0%) | 4 (14.3%) |
| 1 or 2 Children | 0 (0.0%) | 0 (0.0%) |
| 3 or 4 Children | 0 (0.0%) | 35 (100.0%) |
| 5 or more Children | 0 (0.0%) | 7 (100.0%) |
| Total | 0 (0.0%) | 46 (34.6%) |
Income Below Poverty Among Married-Couple vs Single-Parent Households in Carlisle
The poverty data for Carlisle shows that 15 of the married-couple family households (3.5%) and 46 of the single-parent households (30.5%) are living below the poverty level. Within the married-couple family households, those with 1 or 2 children have the highest poverty rate, with 15 households (11.5%) falling below the poverty line. Among the single-parent households, those with 5 or more children have the highest poverty rate, with 7 household (100.0%) living below poverty.
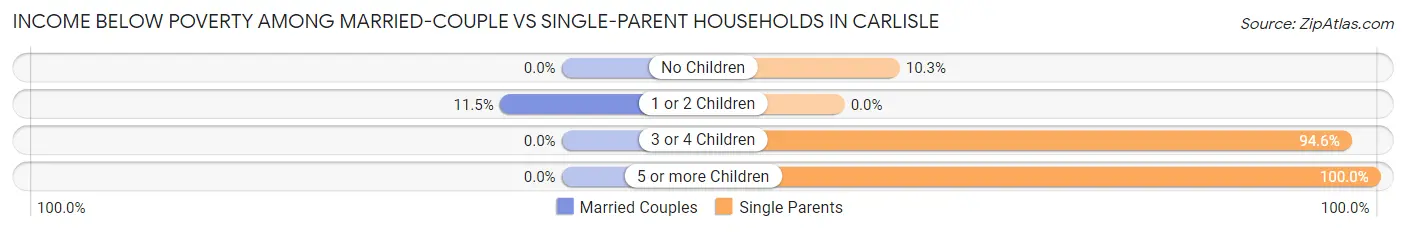
| Children | Married-Couple Families | Single-Parent Households |
| No Children | 0 (0.0%) | 4 (10.3%) |
| 1 or 2 Children | 15 (11.5%) | 0 (0.0%) |
| 3 or 4 Children | 0 (0.0%) | 35 (94.6%) |
| 5 or more Children | 0 (0.0%) | 7 (100.0%) |
| Total | 15 (3.5%) | 46 (30.5%) |
Employment Characteristics in Carlisle
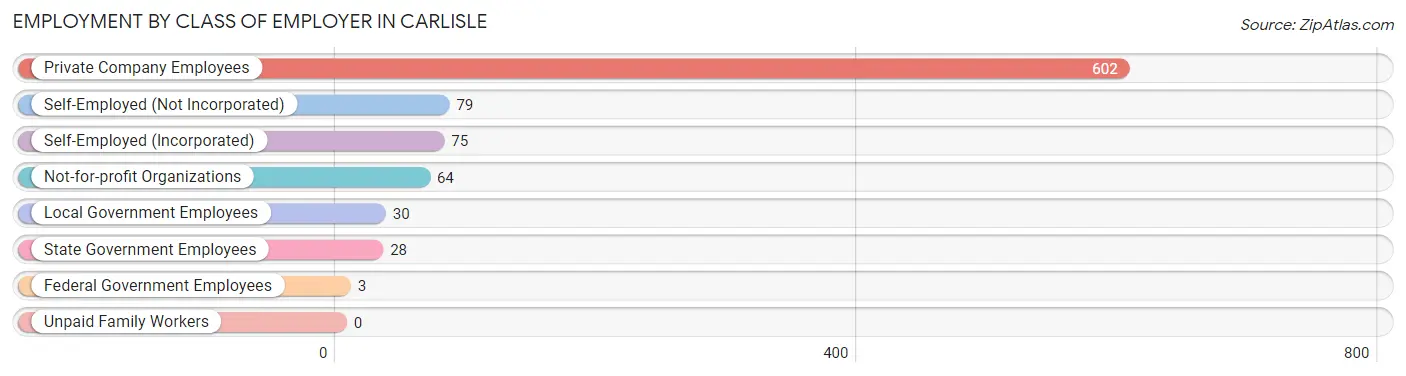
Employment by Class of Employer in Carlisle
Among the 881 employed individuals in Carlisle, private company employees (602 | 68.3%), self-employed (not incorporated) (79 | 9.0%), and self-employed (incorporated) (75 | 8.5%) make up the most common classes of employment.
| Employer Class | # Employees | % Employees |
| Private Company Employees | 602 | 68.3% |
| Self-Employed (Incorporated) | 75 | 8.5% |
| Self-Employed (Not Incorporated) | 79 | 9.0% |
| Not-for-profit Organizations | 64 | 7.3% |
| Local Government Employees | 30 | 3.4% |
| State Government Employees | 28 | 3.2% |
| Federal Government Employees | 3 | 0.3% |
| Unpaid Family Workers | 0 | 0.0% |
| Total | 881 | 100.0% |
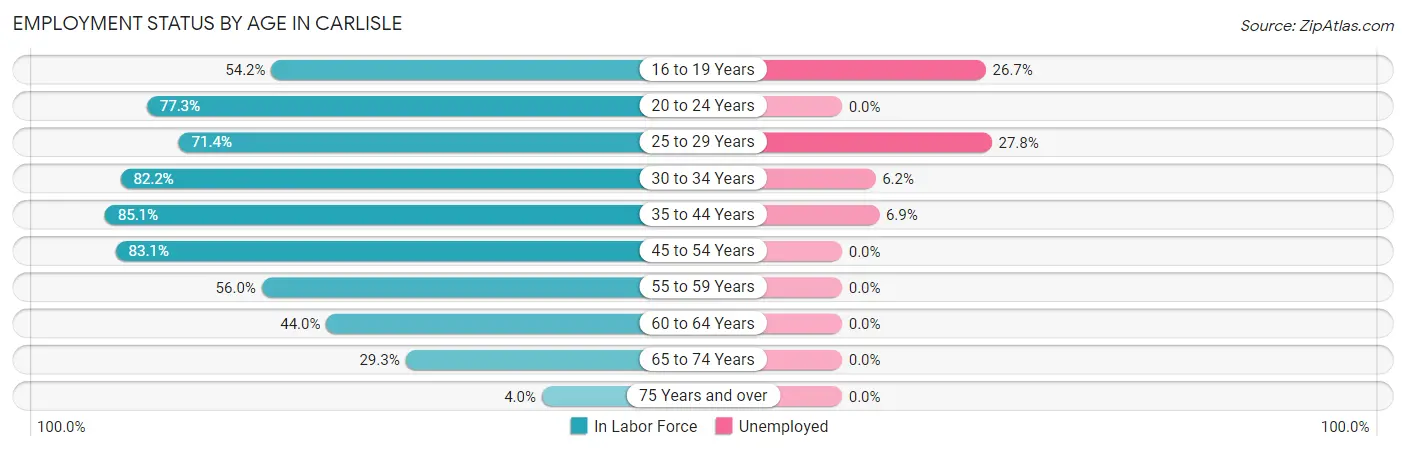
Employment Status by Age in Carlisle
According to the labor force statistics for Carlisle, out of the total population over 16 years of age (1,733), 54.2% or 939 individuals are in the labor force, with 6.2% or 58 of them unemployed. The age group with the highest labor force participation rate is 35 to 44 years, with 85.1% or 217 individuals in the labor force. Within the labor force, the 25 to 29 years age range has the highest percentage of unemployed individuals, with 27.8% or 25 of them being unemployed.
| Age Bracket | In Labor Force | Unemployed |
| 16 to 19 Years | 45 (54.2%) | 12 (26.7%) |
| 20 to 24 Years | 51 (77.3%) | 0 (0.0%) |
| 25 to 29 Years | 90 (71.4%) | 25 (27.8%) |
| 30 to 34 Years | 97 (82.2%) | 6 (6.2%) |
| 35 to 44 Years | 217 (85.1%) | 15 (6.9%) |
| 45 to 54 Years | 226 (83.1%) | 0 (0.0%) |
| 55 to 59 Years | 102 (56.0%) | 0 (0.0%) |
| 60 to 64 Years | 44 (44.0%) | 0 (0.0%) |
| 65 to 74 Years | 53 (29.3%) | 0 (0.0%) |
| 75 Years and over | 14 (4.0%) | 0 (0.0%) |
| Total | 939 (54.2%) | 58 (6.2%) |
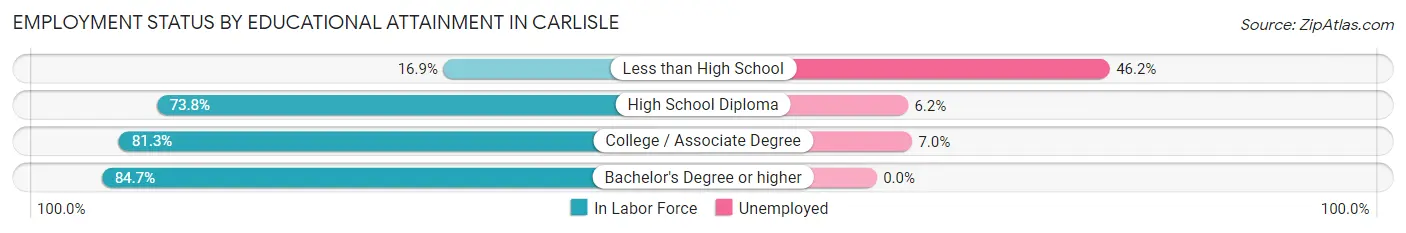
Employment Status by Educational Attainment in Carlisle
According to labor force statistics for Carlisle, 73.7% of individuals (776) out of the total population between 25 and 64 years of age (1,053) are in the labor force, with 5.9% or 46 of them being unemployed. The group with the highest labor force participation rate are those with the educational attainment of bachelor's degree or higher, with 84.7% or 150 individuals in the labor force. Within the labor force, individuals with less than high school education have the highest percentage of unemployment, with 46.2% or 6 of them being unemployed.
| Educational Attainment | In Labor Force | Unemployed |
| Less than High School | 13 (16.9%) | 36 (46.2%) |
| High School Diploma | 357 (73.8%) | 30 (6.2%) |
| College / Associate Degree | 256 (81.3%) | 22 (7.0%) |
| Bachelor's Degree or higher | 150 (84.7%) | 0 (0.0%) |
| Total | 776 (73.7%) | 62 (5.9%) |
Employment Occupations by Sex in Carlisle
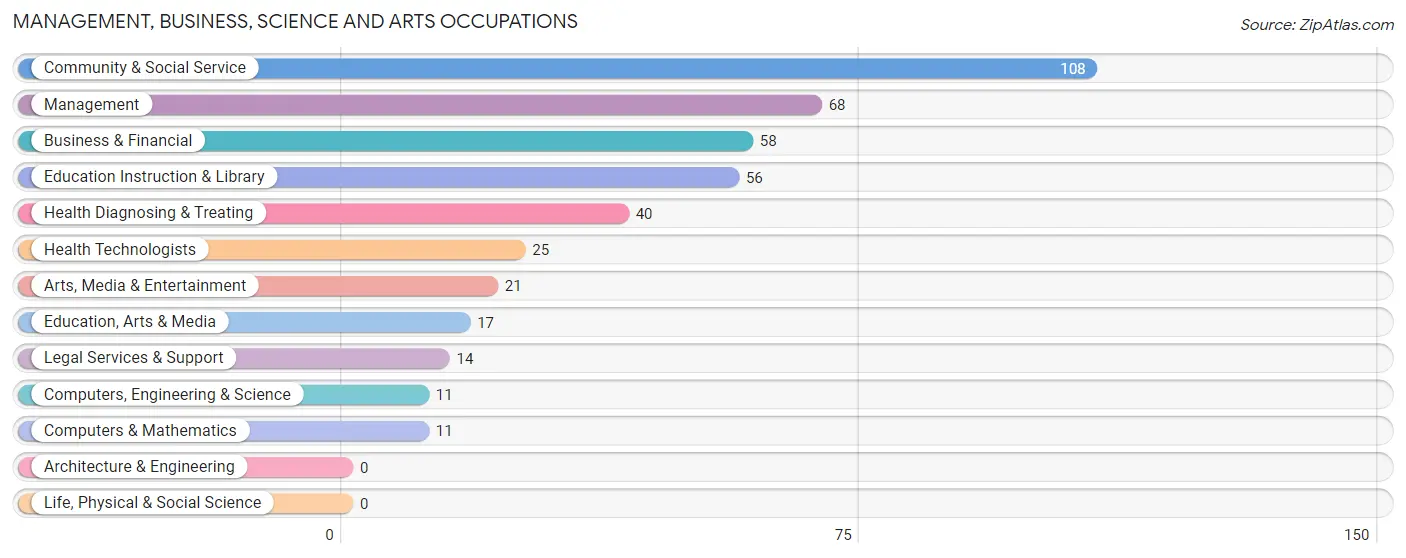
Management, Business, Science and Arts Occupations
The most common Management, Business, Science and Arts occupations in Carlisle are Community & Social Service (108 | 12.3%), Management (68 | 7.7%), Business & Financial (58 | 6.6%), Education Instruction & Library (56 | 6.4%), and Health Diagnosing & Treating (40 | 4.5%).
Management, Business, Science and Arts Occupations by Sex
Within the Management, Business, Science and Arts occupations in Carlisle, the most male-oriented occupations are Computers, Engineering & Science (100.0%), Computers & Mathematics (100.0%), and Management (76.5%), while the most female-oriented occupations are Education, Arts & Media (100.0%), Arts, Media & Entertainment (100.0%), and Health Diagnosing & Treating (100.0%).
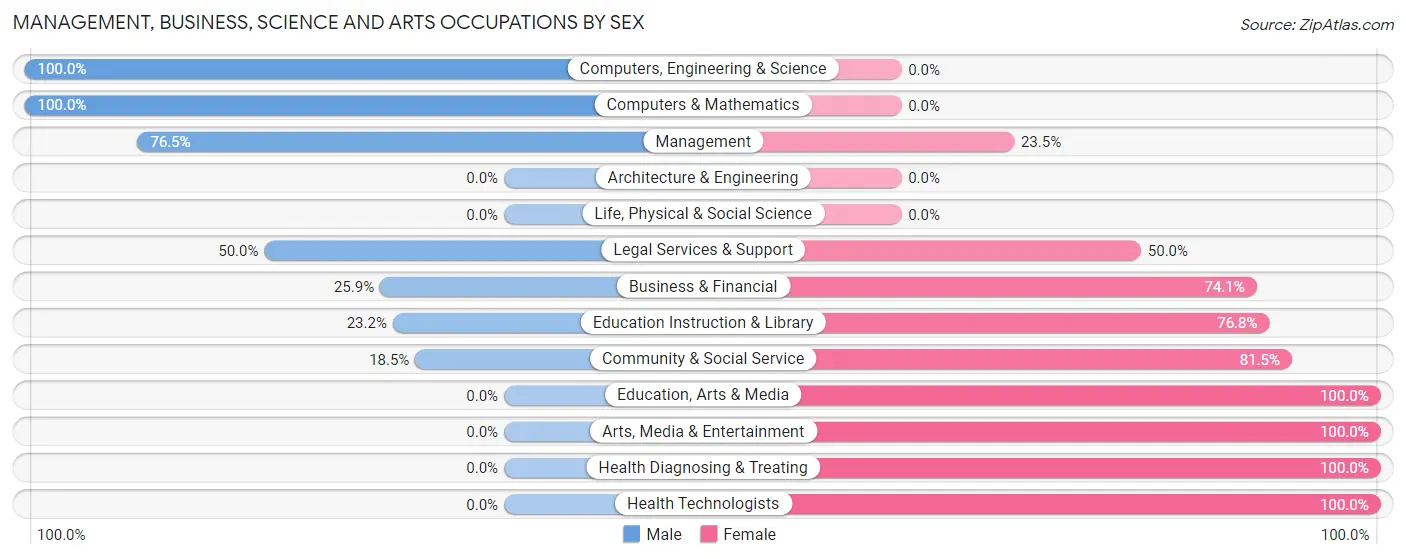
| Occupation | Male | Female |
| Management | 52 (76.5%) | 16 (23.5%) |
| Business & Financial | 15 (25.9%) | 43 (74.1%) |
| Computers, Engineering & Science | 11 (100.0%) | 0 (0.0%) |
| Computers & Mathematics | 11 (100.0%) | 0 (0.0%) |
| Architecture & Engineering | 0 (0.0%) | 0 (0.0%) |
| Life, Physical & Social Science | 0 (0.0%) | 0 (0.0%) |
| Community & Social Service | 20 (18.5%) | 88 (81.5%) |
| Education, Arts & Media | 0 (0.0%) | 17 (100.0%) |
| Legal Services & Support | 7 (50.0%) | 7 (50.0%) |
| Education Instruction & Library | 13 (23.2%) | 43 (76.8%) |
| Arts, Media & Entertainment | 0 (0.0%) | 21 (100.0%) |
| Health Diagnosing & Treating | 0 (0.0%) | 40 (100.0%) |
| Health Technologists | 0 (0.0%) | 25 (100.0%) |
| Total (Category) | 98 (34.4%) | 187 (65.6%) |
| Total (Overall) | 473 (53.7%) | 408 (46.3%) |
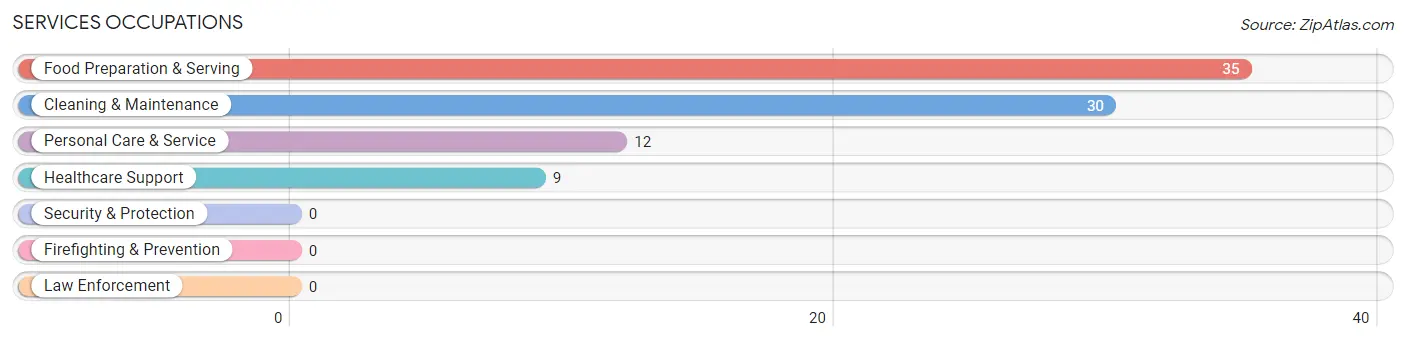
Services Occupations
The most common Services occupations in Carlisle are Food Preparation & Serving (35 | 4.0%), Cleaning & Maintenance (30 | 3.4%), Personal Care & Service (12 | 1.4%), and Healthcare Support (9 | 1.0%).
Services Occupations by Sex
Within the Services occupations in Carlisle, the most male-oriented occupations are Cleaning & Maintenance (100.0%), and Food Preparation & Serving (25.7%), while the most female-oriented occupations are Healthcare Support (100.0%), Personal Care & Service (100.0%), and Food Preparation & Serving (74.3%).
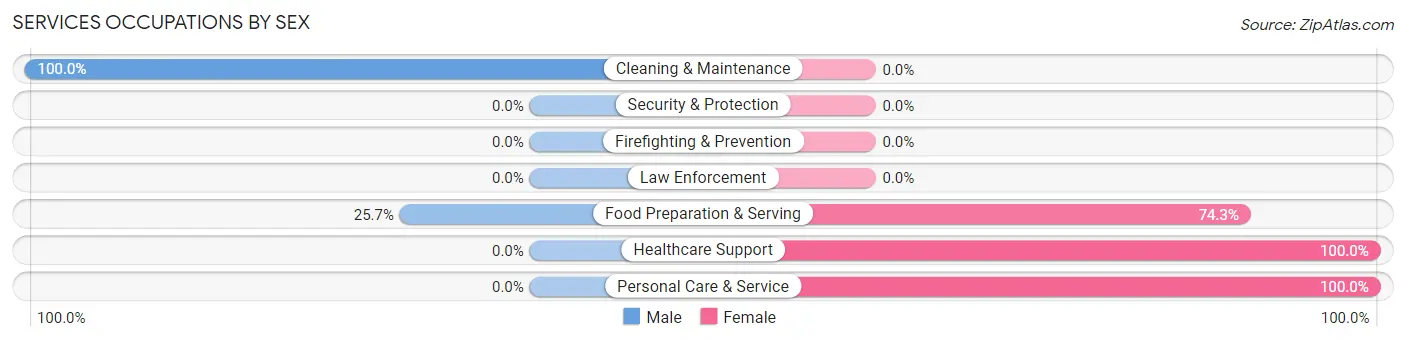
| Occupation | Male | Female |
| Healthcare Support | 0 (0.0%) | 9 (100.0%) |
| Security & Protection | 0 (0.0%) | 0 (0.0%) |
| Firefighting & Prevention | 0 (0.0%) | 0 (0.0%) |
| Law Enforcement | 0 (0.0%) | 0 (0.0%) |
| Food Preparation & Serving | 9 (25.7%) | 26 (74.3%) |
| Cleaning & Maintenance | 30 (100.0%) | 0 (0.0%) |
| Personal Care & Service | 0 (0.0%) | 12 (100.0%) |
| Total (Category) | 39 (45.4%) | 47 (54.6%) |
| Total (Overall) | 473 (53.7%) | 408 (46.3%) |
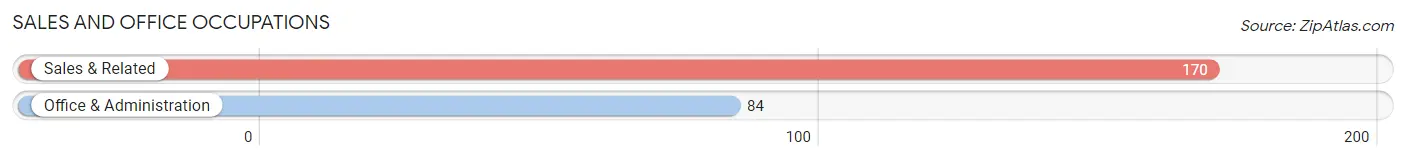
Sales and Office Occupations
The most common Sales and Office occupations in Carlisle are Sales & Related (170 | 19.3%), and Office & Administration (84 | 9.5%).
Sales and Office Occupations by Sex
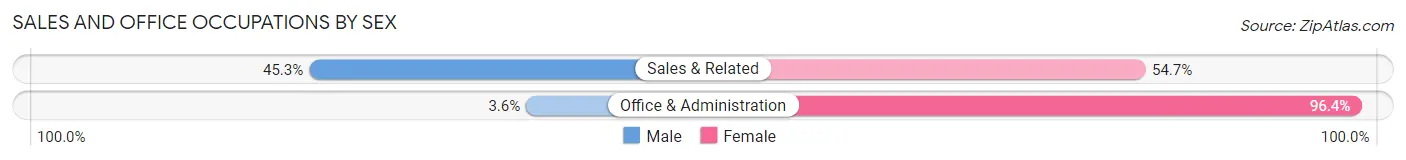
| Occupation | Male | Female |
| Sales & Related | 77 (45.3%) | 93 (54.7%) |
| Office & Administration | 3 (3.6%) | 81 (96.4%) |
| Total (Category) | 80 (31.5%) | 174 (68.5%) |
| Total (Overall) | 473 (53.7%) | 408 (46.3%) |
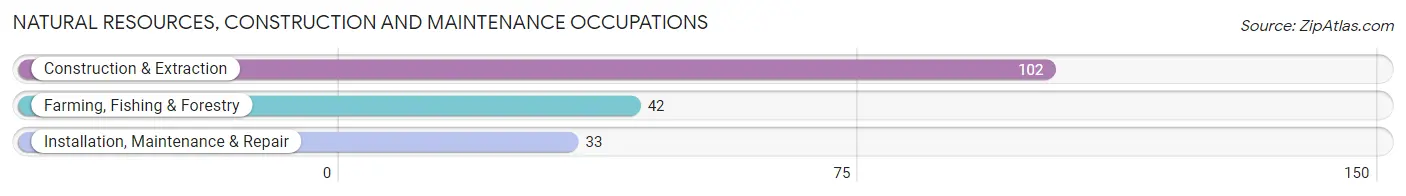
Natural Resources, Construction and Maintenance Occupations
The most common Natural Resources, Construction and Maintenance occupations in Carlisle are Construction & Extraction (102 | 11.6%), Farming, Fishing & Forestry (42 | 4.8%), and Installation, Maintenance & Repair (33 | 3.7%).
Natural Resources, Construction and Maintenance Occupations by Sex
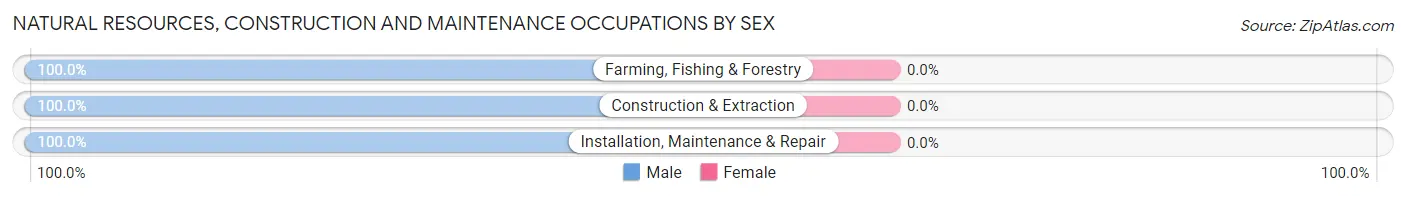
| Occupation | Male | Female |
| Farming, Fishing & Forestry | 42 (100.0%) | 0 (0.0%) |
| Construction & Extraction | 102 (100.0%) | 0 (0.0%) |
| Installation, Maintenance & Repair | 33 (100.0%) | 0 (0.0%) |
| Total (Category) | 177 (100.0%) | 0 (0.0%) |
| Total (Overall) | 473 (53.7%) | 408 (46.3%) |
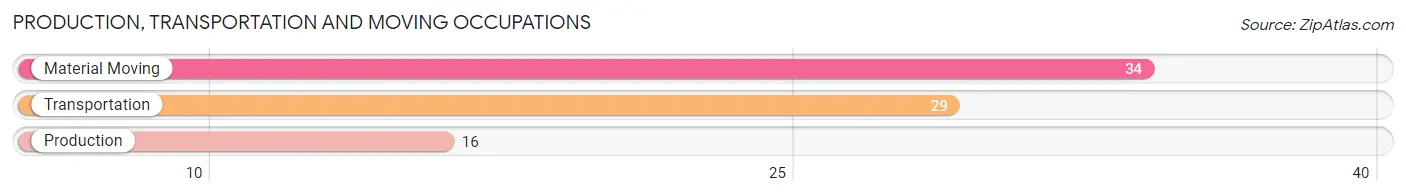
Production, Transportation and Moving Occupations
The most common Production, Transportation and Moving occupations in Carlisle are Material Moving (34 | 3.9%), Transportation (29 | 3.3%), and Production (16 | 1.8%).
Production, Transportation and Moving Occupations by Sex
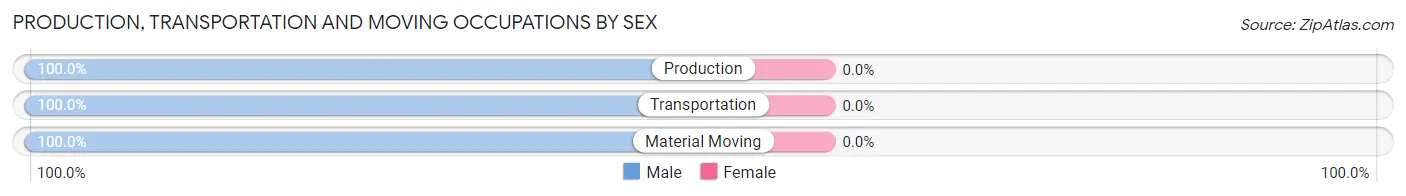
| Occupation | Male | Female |
| Production | 16 (100.0%) | 0 (0.0%) |
| Transportation | 29 (100.0%) | 0 (0.0%) |
| Material Moving | 34 (100.0%) | 0 (0.0%) |
| Total (Category) | 79 (100.0%) | 0 (0.0%) |
| Total (Overall) | 473 (53.7%) | 408 (46.3%) |
Employment Industries by Sex in Carlisle
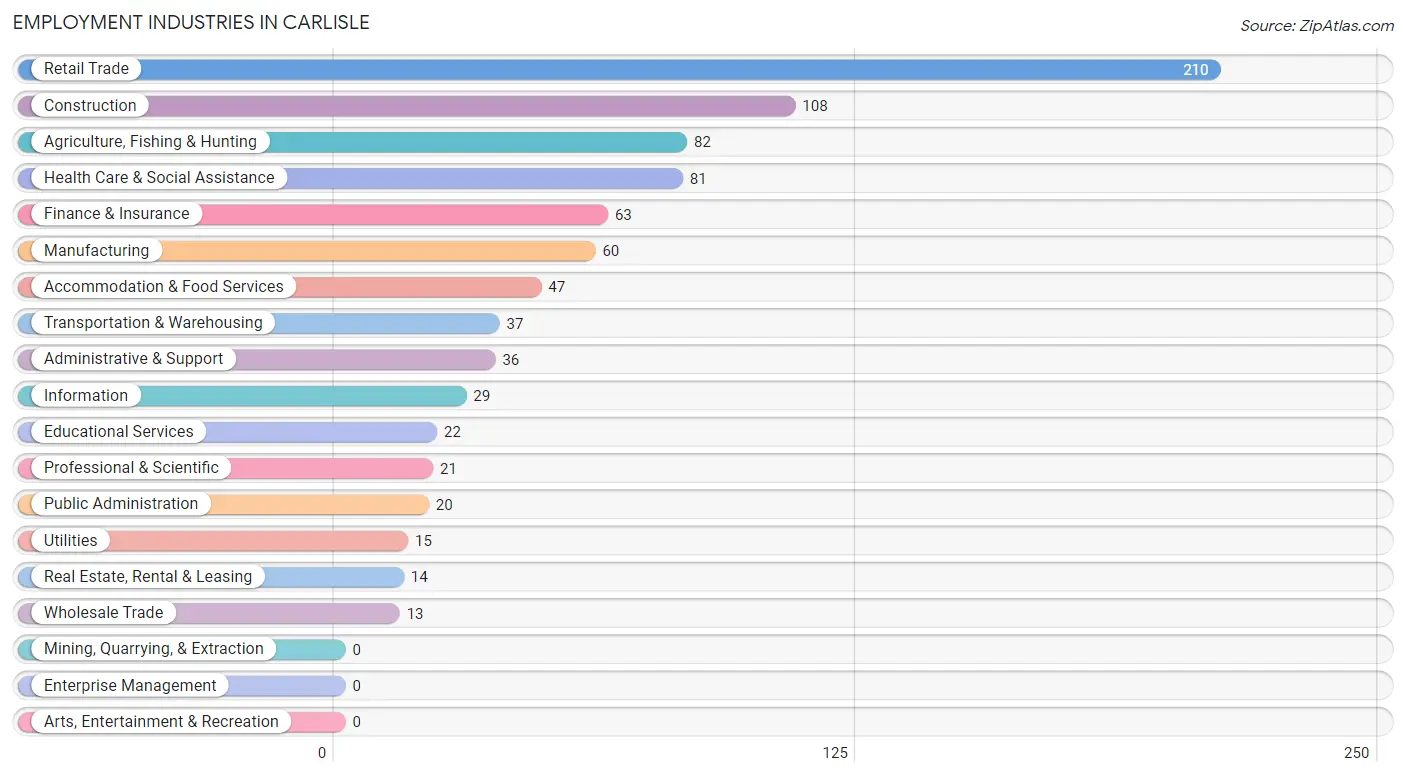
Employment Industries in Carlisle
The major employment industries in Carlisle include Retail Trade (210 | 23.8%), Construction (108 | 12.3%), Agriculture, Fishing & Hunting (82 | 9.3%), Health Care & Social Assistance (81 | 9.2%), and Finance & Insurance (63 | 7.1%).
Employment Industries by Sex in Carlisle
The Carlisle industries that see more men than women are Transportation & Warehousing (100.0%), Utilities (100.0%), and Administrative & Support (100.0%), whereas the industries that tend to have a higher number of women are Wholesale Trade (100.0%), Information (100.0%), and Public Administration (100.0%).
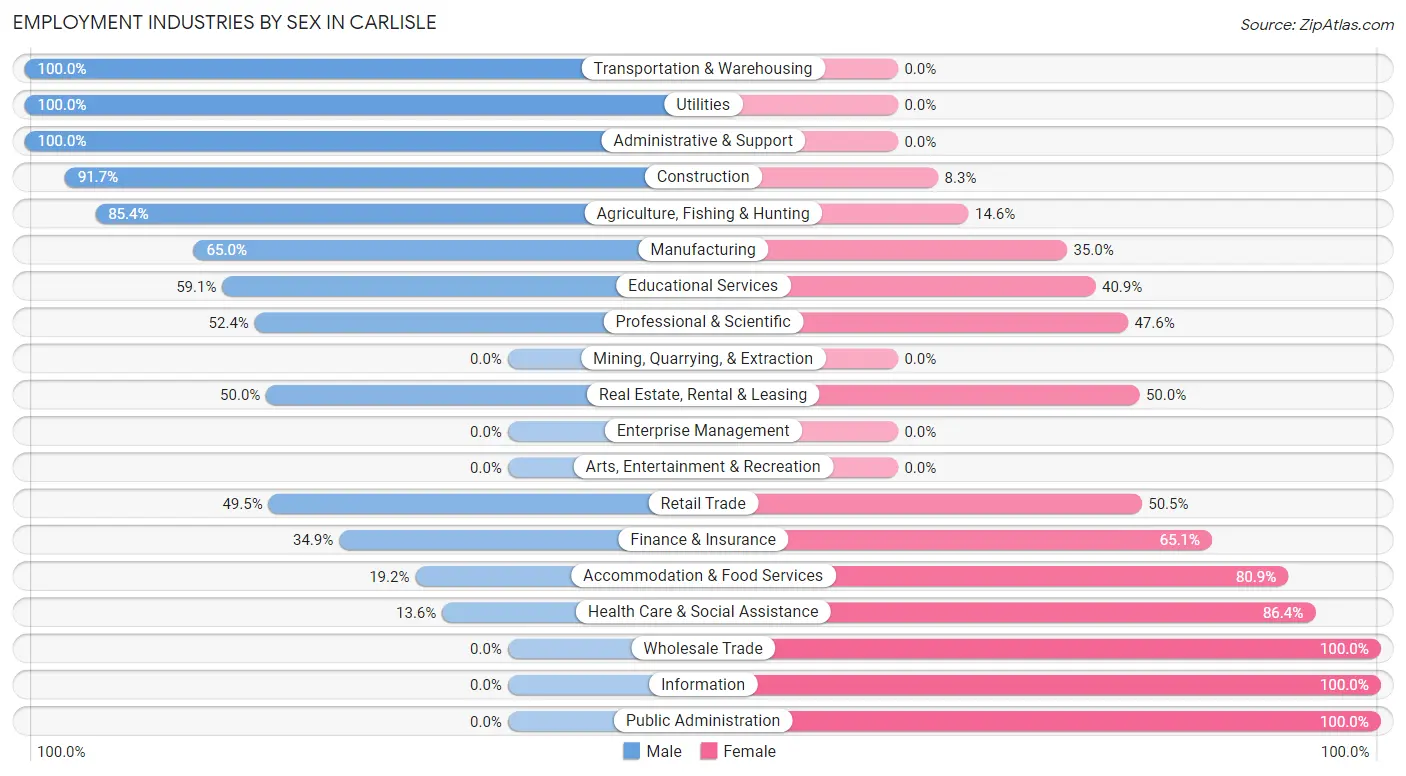
| Industry | Male | Female |
| Agriculture, Fishing & Hunting | 70 (85.4%) | 12 (14.6%) |
| Mining, Quarrying, & Extraction | 0 (0.0%) | 0 (0.0%) |
| Construction | 99 (91.7%) | 9 (8.3%) |
| Manufacturing | 39 (65.0%) | 21 (35.0%) |
| Wholesale Trade | 0 (0.0%) | 13 (100.0%) |
| Retail Trade | 104 (49.5%) | 106 (50.5%) |
| Transportation & Warehousing | 37 (100.0%) | 0 (0.0%) |
| Utilities | 15 (100.0%) | 0 (0.0%) |
| Information | 0 (0.0%) | 29 (100.0%) |
| Finance & Insurance | 22 (34.9%) | 41 (65.1%) |
| Real Estate, Rental & Leasing | 7 (50.0%) | 7 (50.0%) |
| Professional & Scientific | 11 (52.4%) | 10 (47.6%) |
| Enterprise Management | 0 (0.0%) | 0 (0.0%) |
| Administrative & Support | 36 (100.0%) | 0 (0.0%) |
| Educational Services | 13 (59.1%) | 9 (40.9%) |
| Health Care & Social Assistance | 11 (13.6%) | 70 (86.4%) |
| Arts, Entertainment & Recreation | 0 (0.0%) | 0 (0.0%) |
| Accommodation & Food Services | 9 (19.2%) | 38 (80.8%) |
| Public Administration | 0 (0.0%) | 20 (100.0%) |
| Total | 473 (53.7%) | 408 (46.3%) |
Education in Carlisle
School Enrollment in Carlisle
The most common levels of schooling among the 654 students in Carlisle are middle school (214 | 32.7%), high school (110 | 16.8%), and elementary school (90 | 13.8%).
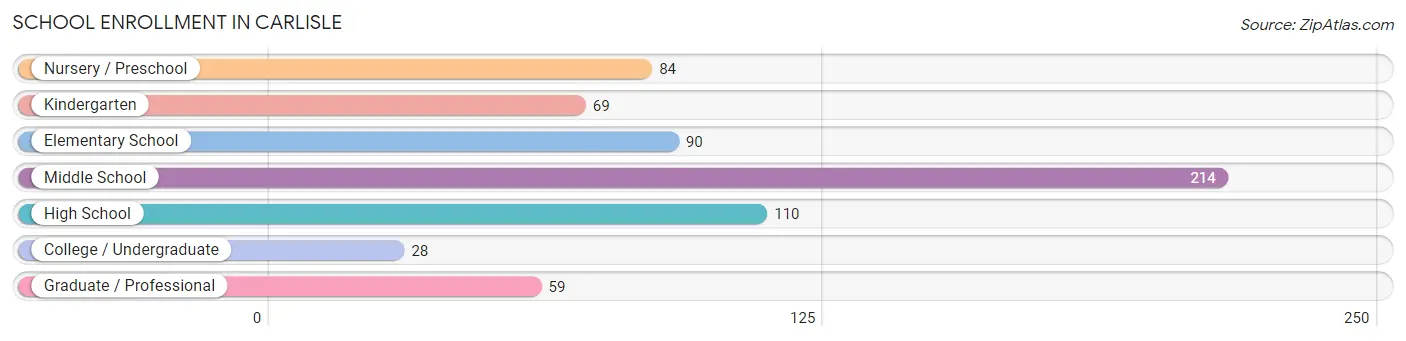
| School Level | # Students | % Students |
| Nursery / Preschool | 84 | 12.8% |
| Kindergarten | 69 | 10.5% |
| Elementary School | 90 | 13.8% |
| Middle School | 214 | 32.7% |
| High School | 110 | 16.8% |
| College / Undergraduate | 28 | 4.3% |
| Graduate / Professional | 59 | 9.0% |
| Total | 654 | 100.0% |
School Enrollment by Age by Funding Source in Carlisle
Out of a total of 654 students who are enrolled in schools in Carlisle, 18 (2.8%) attend a private institution, while the remaining 636 (97.2%) are enrolled in public schools. The age group of 3 to 4 year olds has the highest likelihood of being enrolled in private schools, with 9 (17.0% in the age bracket) enrolled. Conversely, the age group of 5 to 9 year old has the lowest likelihood of being enrolled in a private school, with 188 (100.0% in the age bracket) attending a public institution.
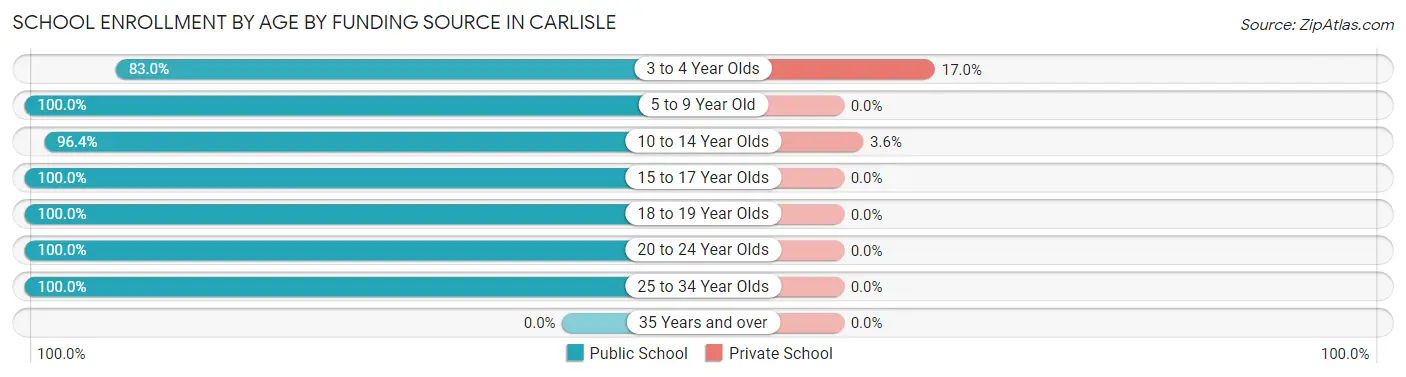
| Age Bracket | Public School | Private School |
| 3 to 4 Year Olds | 44 (83.0%) | 9 (17.0%) |
| 5 to 9 Year Old | 188 (100.0%) | 0 (0.0%) |
| 10 to 14 Year Olds | 239 (96.4%) | 9 (3.6%) |
| 15 to 17 Year Olds | 69 (100.0%) | 0 (0.0%) |
| 18 to 19 Year Olds | 18 (100.0%) | 0 (0.0%) |
| 20 to 24 Year Olds | 6 (100.0%) | 0 (0.0%) |
| 25 to 34 Year Olds | 72 (100.0%) | 0 (0.0%) |
| 35 Years and over | 0 (0.0%) | 0 (0.0%) |
| Total | 636 (97.2%) | 18 (2.8%) |
Educational Attainment by Field of Study in Carlisle
Science & technology (76 | 28.2%), education (47 | 17.5%), communications (31 | 11.5%), bio, nature & agricultural (29 | 10.8%), and arts & humanities (27 | 10.0%) are the most common fields of study among 269 individuals in Carlisle who have obtained a bachelor's degree or higher.
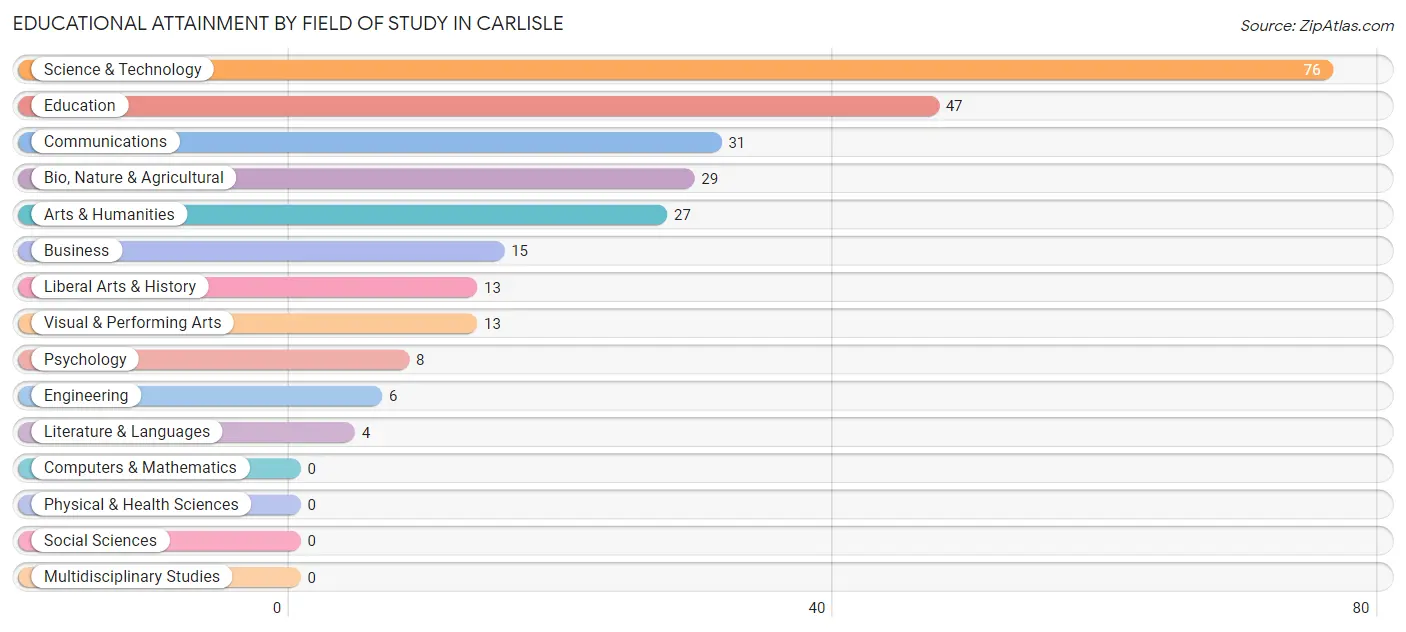
| Field of Study | # Graduates | % Graduates |
| Computers & Mathematics | 0 | 0.0% |
| Bio, Nature & Agricultural | 29 | 10.8% |
| Physical & Health Sciences | 0 | 0.0% |
| Psychology | 8 | 3.0% |
| Social Sciences | 0 | 0.0% |
| Engineering | 6 | 2.2% |
| Multidisciplinary Studies | 0 | 0.0% |
| Science & Technology | 76 | 28.2% |
| Business | 15 | 5.6% |
| Education | 47 | 17.5% |
| Literature & Languages | 4 | 1.5% |
| Liberal Arts & History | 13 | 4.8% |
| Visual & Performing Arts | 13 | 4.8% |
| Communications | 31 | 11.5% |
| Arts & Humanities | 27 | 10.0% |
| Total | 269 | 100.0% |
Transportation & Commute in Carlisle
Vehicle Availability by Sex in Carlisle
The most prevalent vehicle ownership categories in Carlisle are males with 2 vehicles (230, accounting for 48.6%) and females with 2 vehicles (152, making up 56.4%).
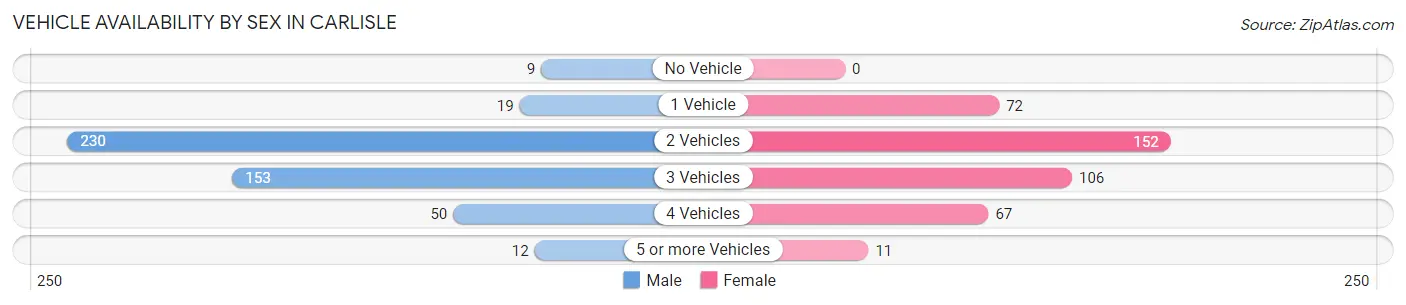
| Vehicles Available | Male | Female |
| No Vehicle | 9 (1.9%) | 0 (0.0%) |
| 1 Vehicle | 19 (4.0%) | 72 (17.6%) |
| 2 Vehicles | 230 (48.6%) | 152 (37.2%) |
| 3 Vehicles | 153 (32.4%) | 106 (26.0%) |
| 4 Vehicles | 50 (10.6%) | 67 (16.4%) |
| 5 or more Vehicles | 12 (2.5%) | 11 (2.7%) |
| Total | 473 (100.0%) | 408 (100.0%) |
Commute Time in Carlisle
The most frequently occuring commute durations in Carlisle are 15 to 19 minutes (147 commuters, 20.1%), 10 to 14 minutes (139 commuters, 19.0%), and 5 to 9 minutes (87 commuters, 11.9%).
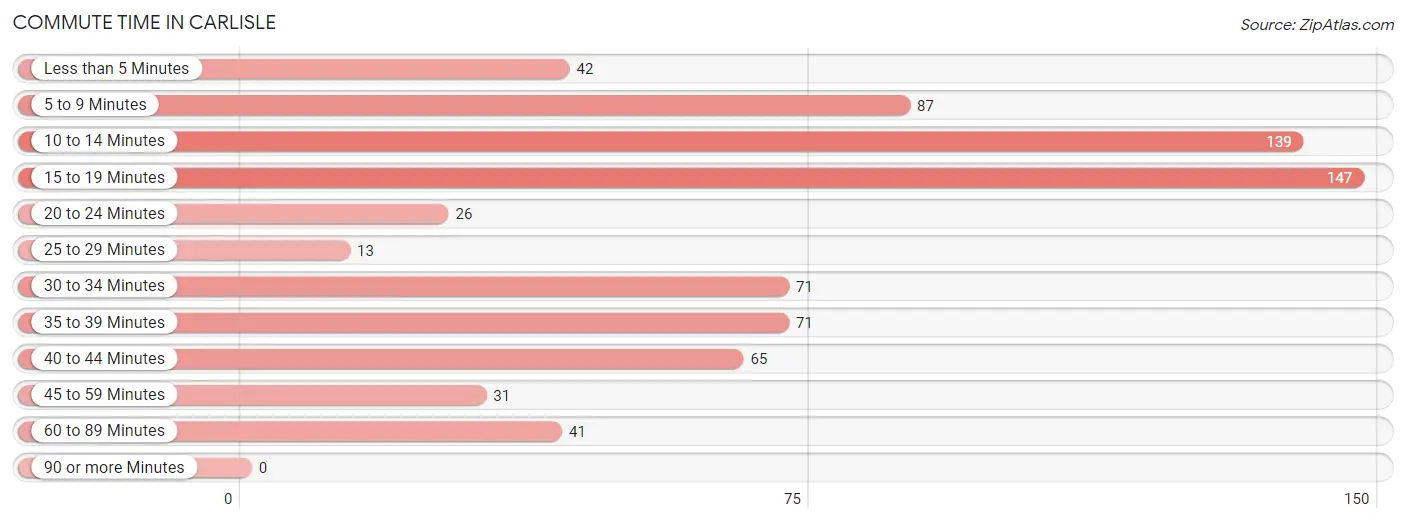
| Commute Time | # Commuters | % Commuters |
| Less than 5 Minutes | 42 | 5.7% |
| 5 to 9 Minutes | 87 | 11.9% |
| 10 to 14 Minutes | 139 | 19.0% |
| 15 to 19 Minutes | 147 | 20.1% |
| 20 to 24 Minutes | 26 | 3.5% |
| 25 to 29 Minutes | 13 | 1.8% |
| 30 to 34 Minutes | 71 | 9.7% |
| 35 to 39 Minutes | 71 | 9.7% |
| 40 to 44 Minutes | 65 | 8.9% |
| 45 to 59 Minutes | 31 | 4.2% |
| 60 to 89 Minutes | 41 | 5.6% |
| 90 or more Minutes | 0 | 0.0% |
Commute Time by Sex in Carlisle
The most common commute times in Carlisle are 15 to 19 minutes (121 commuters, 30.6%) for males and 10 to 14 minutes (97 commuters, 28.8%) for females.
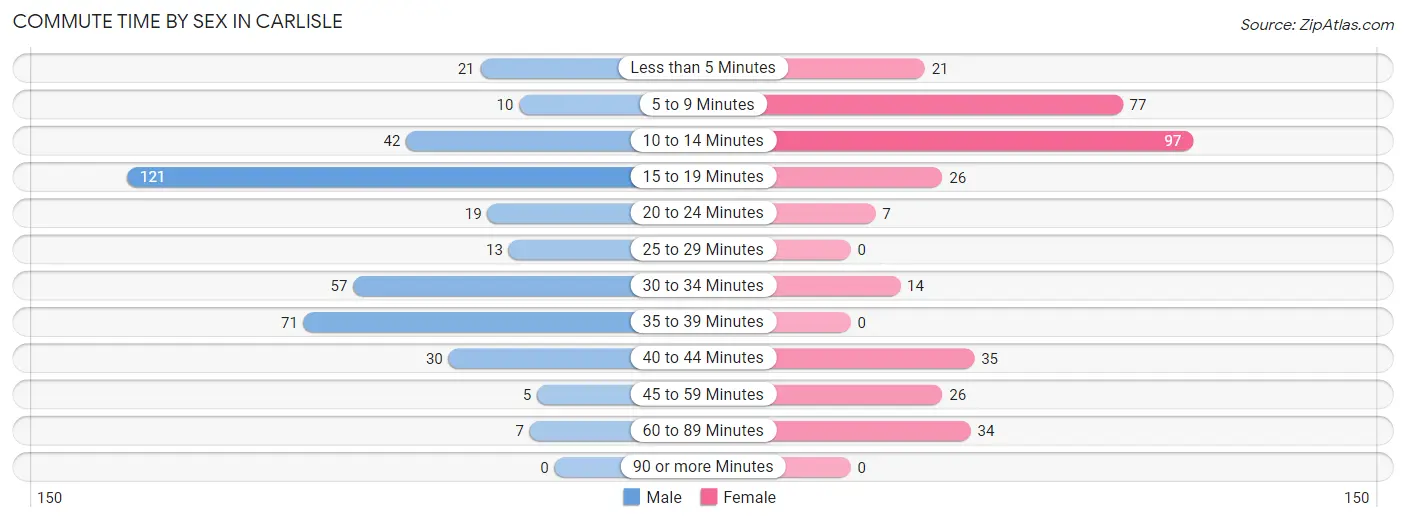
| Commute Time | Male | Female |
| Less than 5 Minutes | 21 (5.3%) | 21 (6.2%) |
| 5 to 9 Minutes | 10 (2.5%) | 77 (22.9%) |
| 10 to 14 Minutes | 42 (10.6%) | 97 (28.8%) |
| 15 to 19 Minutes | 121 (30.6%) | 26 (7.7%) |
| 20 to 24 Minutes | 19 (4.8%) | 7 (2.1%) |
| 25 to 29 Minutes | 13 (3.3%) | 0 (0.0%) |
| 30 to 34 Minutes | 57 (14.4%) | 14 (4.2%) |
| 35 to 39 Minutes | 71 (17.9%) | 0 (0.0%) |
| 40 to 44 Minutes | 30 (7.6%) | 35 (10.4%) |
| 45 to 59 Minutes | 5 (1.3%) | 26 (7.7%) |
| 60 to 89 Minutes | 7 (1.8%) | 34 (10.1%) |
| 90 or more Minutes | 0 (0.0%) | 0 (0.0%) |
Time of Departure to Work by Sex in Carlisle
The most frequent times of departure to work in Carlisle are 7:00 AM to 7:29 AM (68, 17.2%) for males and 7:30 AM to 7:59 AM (107, 31.8%) for females.
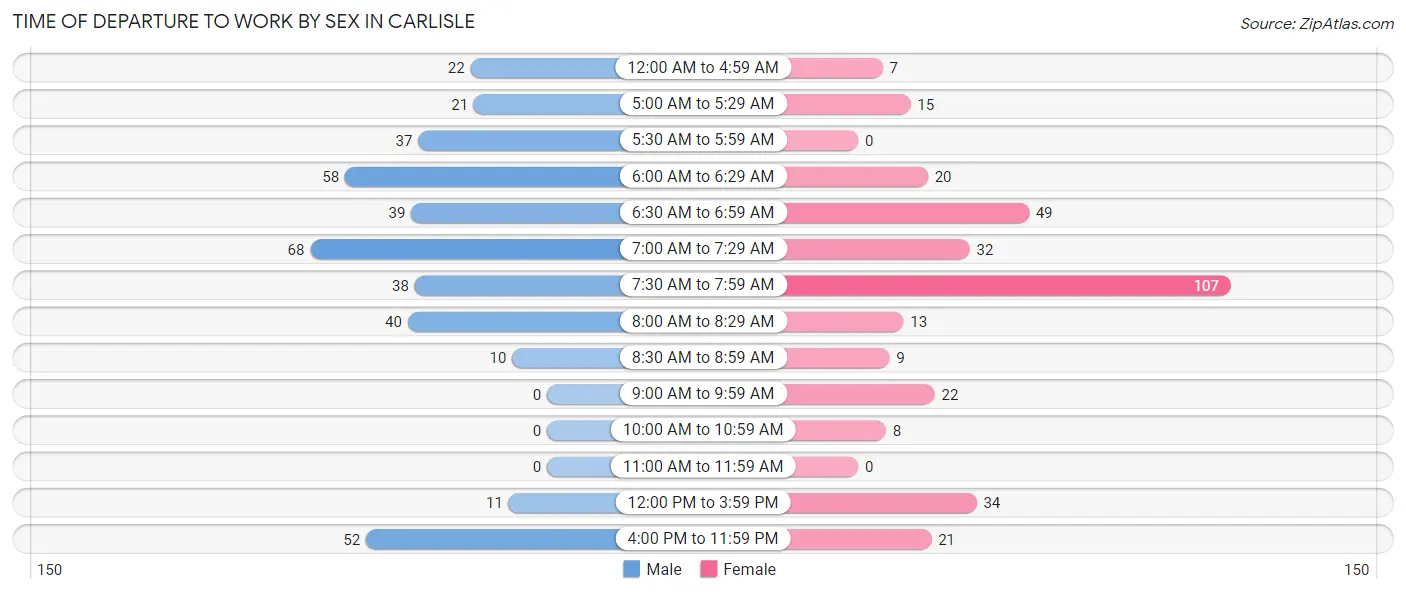
| Time of Departure | Male | Female |
| 12:00 AM to 4:59 AM | 22 (5.6%) | 7 (2.1%) |
| 5:00 AM to 5:29 AM | 21 (5.3%) | 15 (4.4%) |
| 5:30 AM to 5:59 AM | 37 (9.3%) | 0 (0.0%) |
| 6:00 AM to 6:29 AM | 58 (14.6%) | 20 (5.9%) |
| 6:30 AM to 6:59 AM | 39 (9.9%) | 49 (14.5%) |
| 7:00 AM to 7:29 AM | 68 (17.2%) | 32 (9.5%) |
| 7:30 AM to 7:59 AM | 38 (9.6%) | 107 (31.8%) |
| 8:00 AM to 8:29 AM | 40 (10.1%) | 13 (3.9%) |
| 8:30 AM to 8:59 AM | 10 (2.5%) | 9 (2.7%) |
| 9:00 AM to 9:59 AM | 0 (0.0%) | 22 (6.5%) |
| 10:00 AM to 10:59 AM | 0 (0.0%) | 8 (2.4%) |
| 11:00 AM to 11:59 AM | 0 (0.0%) | 0 (0.0%) |
| 12:00 PM to 3:59 PM | 11 (2.8%) | 34 (10.1%) |
| 4:00 PM to 11:59 PM | 52 (13.1%) | 21 (6.2%) |
| Total | 396 (100.0%) | 337 (100.0%) |
Housing Occupancy in Carlisle
Occupancy by Ownership in Carlisle
Of the total 858 dwellings in Carlisle, owner-occupied units account for 655 (76.3%), while renter-occupied units make up 203 (23.7%).
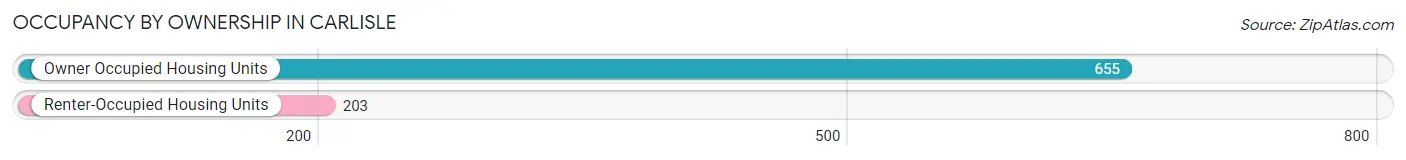
| Occupancy | # Housing Units | % Housing Units |
| Owner Occupied Housing Units | 655 | 76.3% |
| Renter-Occupied Housing Units | 203 | 23.7% |
| Total Occupied Housing Units | 858 | 100.0% |
Occupancy by Household Size in Carlisle
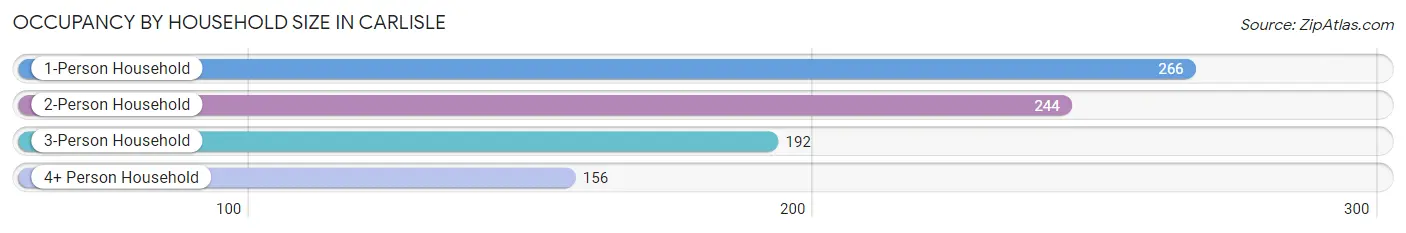
| Household Size | # Housing Units | % Housing Units |
| 1-Person Household | 266 | 31.0% |
| 2-Person Household | 244 | 28.4% |
| 3-Person Household | 192 | 22.4% |
| 4+ Person Household | 156 | 18.2% |
| Total Housing Units | 858 | 100.0% |
Occupancy by Ownership by Household Size in Carlisle
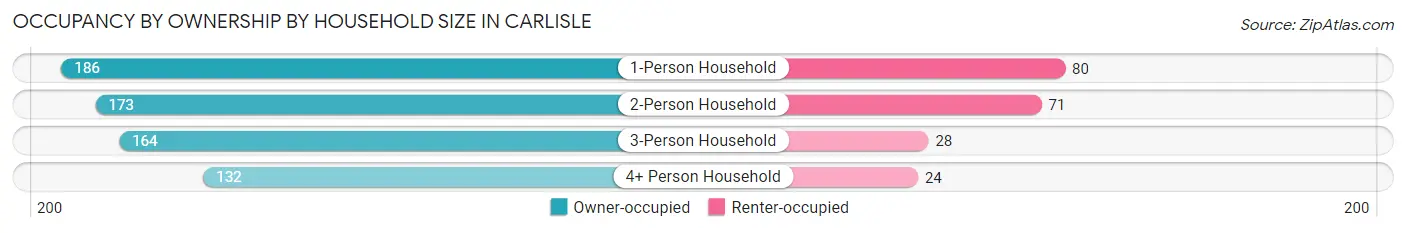
| Household Size | Owner-occupied | Renter-occupied |
| 1-Person Household | 186 (69.9%) | 80 (30.1%) |
| 2-Person Household | 173 (70.9%) | 71 (29.1%) |
| 3-Person Household | 164 (85.4%) | 28 (14.6%) |
| 4+ Person Household | 132 (84.6%) | 24 (15.4%) |
| Total Housing Units | 655 (76.3%) | 203 (23.7%) |
Occupancy by Educational Attainment in Carlisle
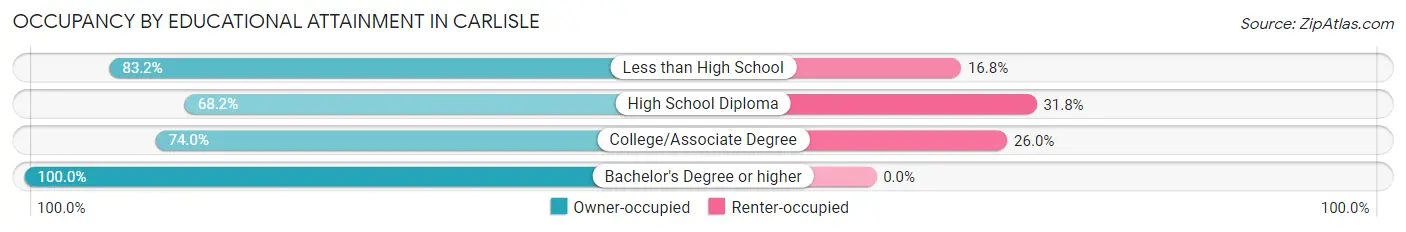
| Household Size | Owner-occupied | Renter-occupied |
| Less than High School | 99 (83.2%) | 20 (16.8%) |
| High School Diploma | 292 (68.2%) | 136 (31.8%) |
| College/Associate Degree | 134 (74.0%) | 47 (26.0%) |
| Bachelor's Degree or higher | 130 (100.0%) | 0 (0.0%) |
Occupancy by Age of Householder in Carlisle
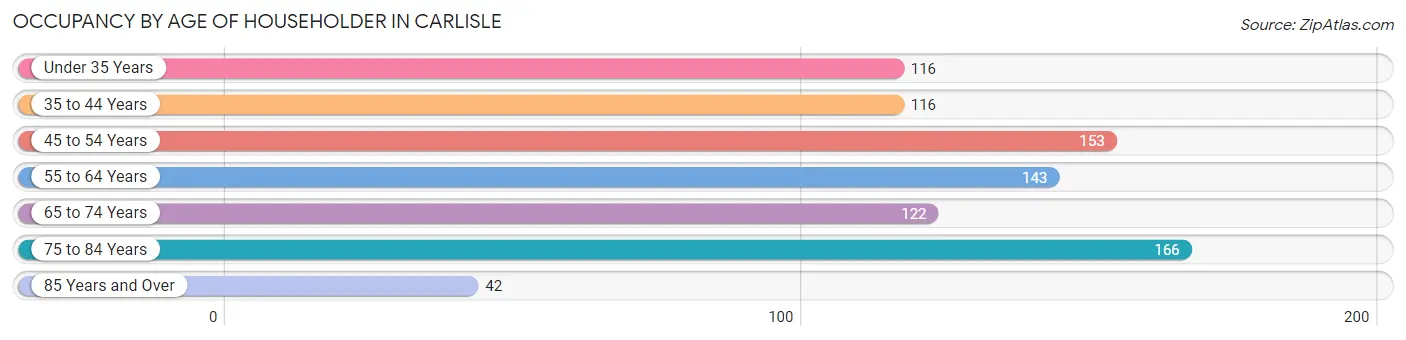
| Age Bracket | # Households | % Households |
| Under 35 Years | 116 | 13.5% |
| 35 to 44 Years | 116 | 13.5% |
| 45 to 54 Years | 153 | 17.8% |
| 55 to 64 Years | 143 | 16.7% |
| 65 to 74 Years | 122 | 14.2% |
| 75 to 84 Years | 166 | 19.4% |
| 85 Years and Over | 42 | 4.9% |
| Total | 858 | 100.0% |
Housing Finances in Carlisle
Median Income by Occupancy in Carlisle
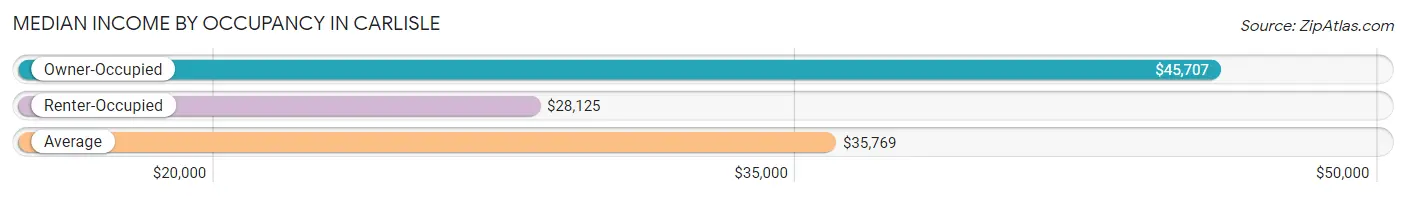
| Occupancy Type | # Households | Median Income |
| Owner-Occupied | 655 (76.3%) | $45,707 |
| Renter-Occupied | 203 (23.7%) | $28,125 |
| Average | 858 (100.0%) | $35,769 |
Occupancy by Householder Income Bracket in Carlisle
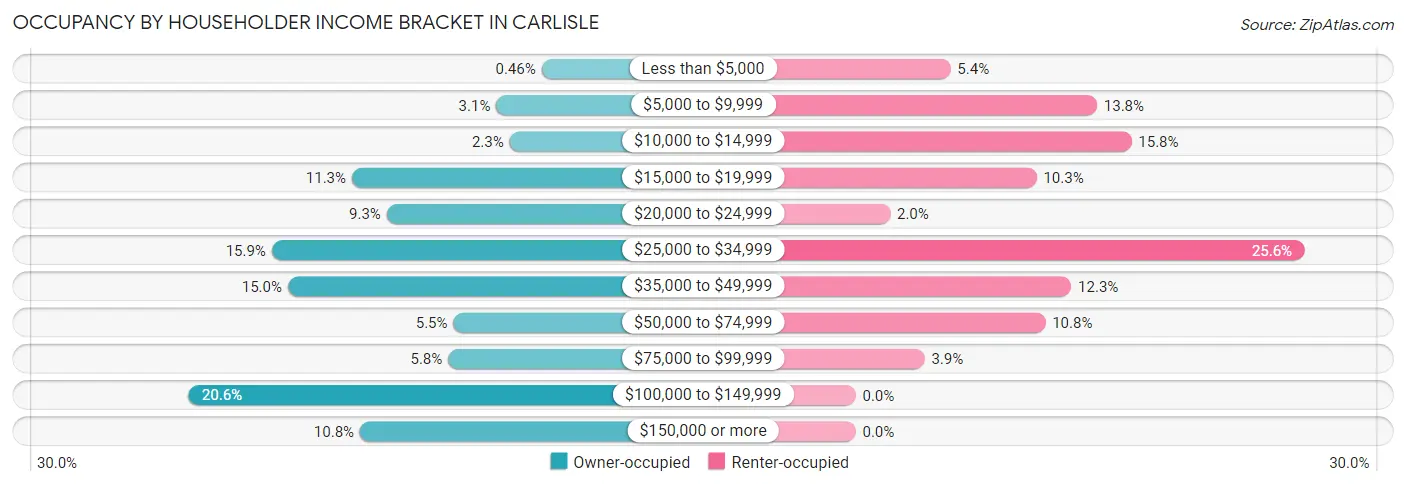
| Income Bracket | Owner-occupied | Renter-occupied |
| Less than $5,000 | 3 (0.5%) | 11 (5.4%) |
| $5,000 to $9,999 | 20 (3.0%) | 28 (13.8%) |
| $10,000 to $14,999 | 15 (2.3%) | 32 (15.8%) |
| $15,000 to $19,999 | 74 (11.3%) | 21 (10.3%) |
| $20,000 to $24,999 | 61 (9.3%) | 4 (2.0%) |
| $25,000 to $34,999 | 104 (15.9%) | 52 (25.6%) |
| $35,000 to $49,999 | 98 (15.0%) | 25 (12.3%) |
| $50,000 to $74,999 | 36 (5.5%) | 22 (10.8%) |
| $75,000 to $99,999 | 38 (5.8%) | 8 (3.9%) |
| $100,000 to $149,999 | 135 (20.6%) | 0 (0.0%) |
| $150,000 or more | 71 (10.8%) | 0 (0.0%) |
| Total | 655 (100.0%) | 203 (100.0%) |
Monthly Housing Cost Tiers in Carlisle
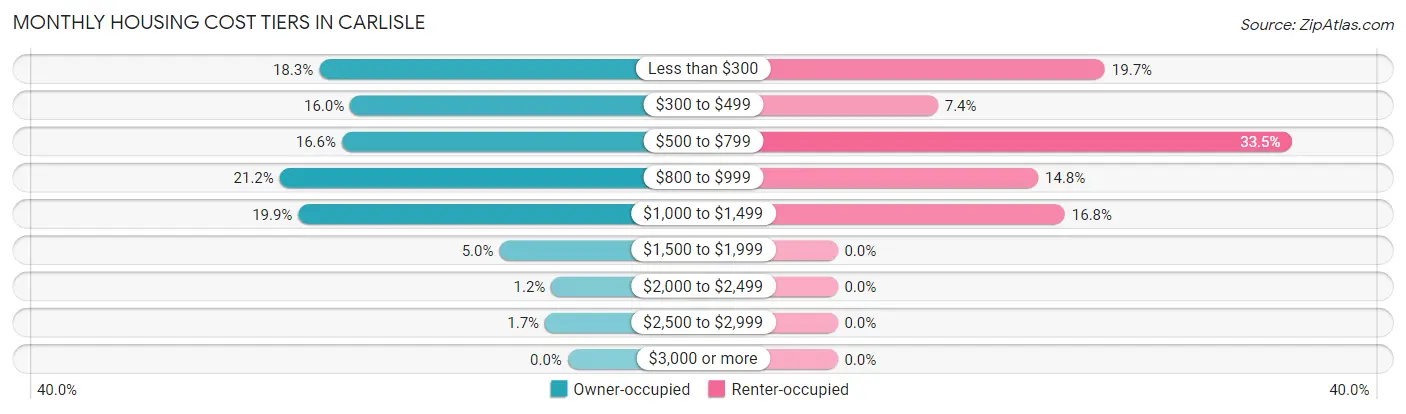
| Monthly Cost | Owner-occupied | Renter-occupied |
| Less than $300 | 120 (18.3%) | 40 (19.7%) |
| $300 to $499 | 105 (16.0%) | 15 (7.4%) |
| $500 to $799 | 109 (16.6%) | 68 (33.5%) |
| $800 to $999 | 139 (21.2%) | 30 (14.8%) |
| $1,000 to $1,499 | 130 (19.9%) | 34 (16.8%) |
| $1,500 to $1,999 | 33 (5.0%) | 0 (0.0%) |
| $2,000 to $2,499 | 8 (1.2%) | 0 (0.0%) |
| $2,500 to $2,999 | 11 (1.7%) | 0 (0.0%) |
| $3,000 or more | 0 (0.0%) | 0 (0.0%) |
| Total | 655 (100.0%) | 203 (100.0%) |
Physical Housing Characteristics in Carlisle
Housing Structures in Carlisle
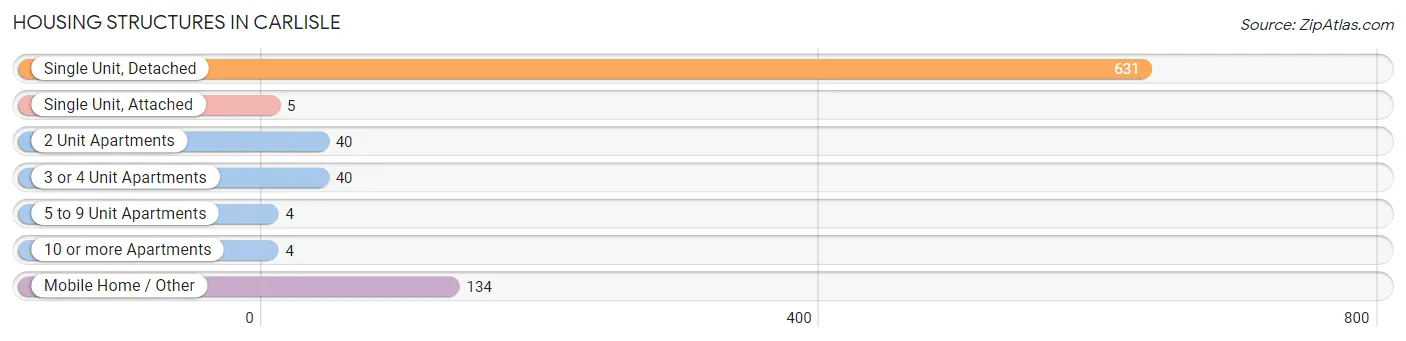
| Structure Type | # Housing Units | % Housing Units |
| Single Unit, Detached | 631 | 73.5% |
| Single Unit, Attached | 5 | 0.6% |
| 2 Unit Apartments | 40 | 4.7% |
| 3 or 4 Unit Apartments | 40 | 4.7% |
| 5 to 9 Unit Apartments | 4 | 0.5% |
| 10 or more Apartments | 4 | 0.5% |
| Mobile Home / Other | 134 | 15.6% |
| Total | 858 | 100.0% |
Housing Structures by Occupancy in Carlisle
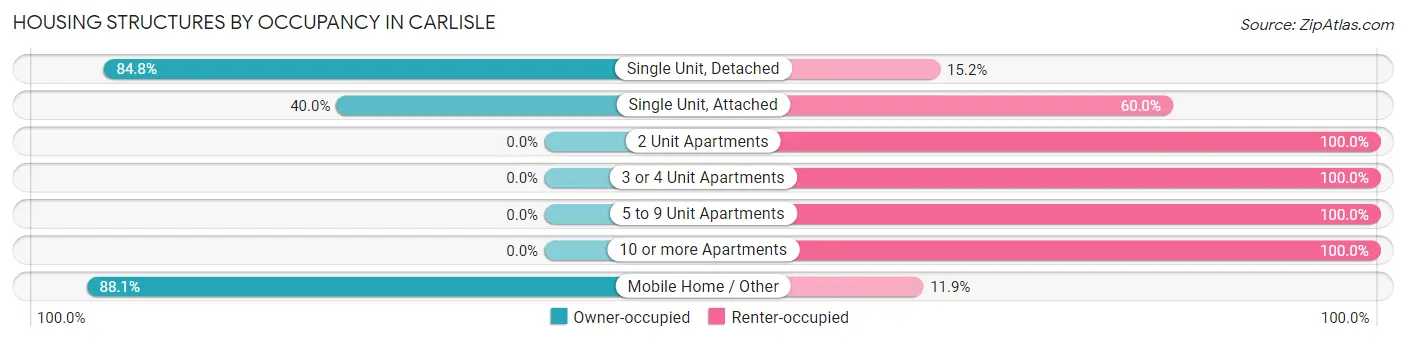
| Structure Type | Owner-occupied | Renter-occupied |
| Single Unit, Detached | 535 (84.8%) | 96 (15.2%) |
| Single Unit, Attached | 2 (40.0%) | 3 (60.0%) |
| 2 Unit Apartments | 0 (0.0%) | 40 (100.0%) |
| 3 or 4 Unit Apartments | 0 (0.0%) | 40 (100.0%) |
| 5 to 9 Unit Apartments | 0 (0.0%) | 4 (100.0%) |
| 10 or more Apartments | 0 (0.0%) | 4 (100.0%) |
| Mobile Home / Other | 118 (88.1%) | 16 (11.9%) |
| Total | 655 (76.3%) | 203 (23.7%) |
Housing Structures by Number of Rooms in Carlisle
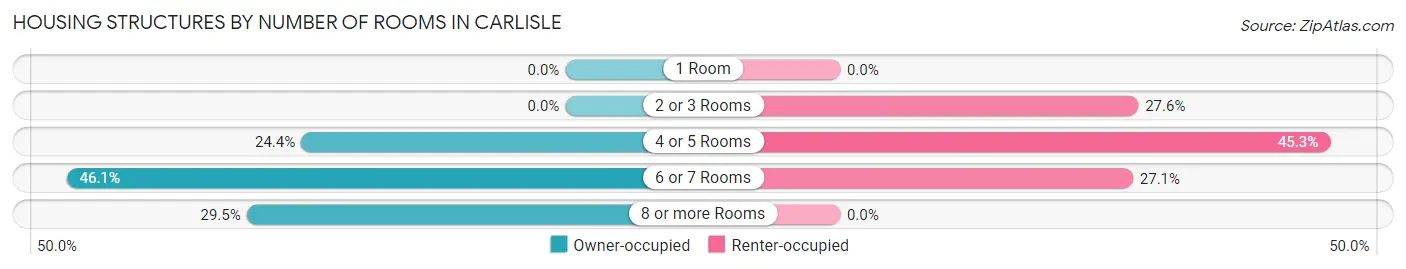
| Number of Rooms | Owner-occupied | Renter-occupied |
| 1 Room | 0 (0.0%) | 0 (0.0%) |
| 2 or 3 Rooms | 0 (0.0%) | 56 (27.6%) |
| 4 or 5 Rooms | 160 (24.4%) | 92 (45.3%) |
| 6 or 7 Rooms | 302 (46.1%) | 55 (27.1%) |
| 8 or more Rooms | 193 (29.5%) | 0 (0.0%) |
| Total | 655 (100.0%) | 203 (100.0%) |
Housing Structure by Heating Type in Carlisle
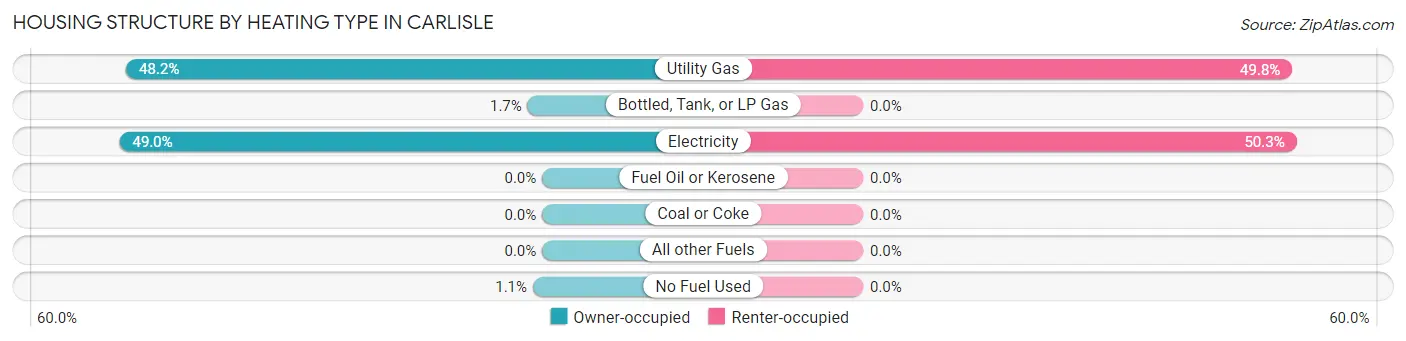
| Heating Type | Owner-occupied | Renter-occupied |
| Utility Gas | 316 (48.2%) | 101 (49.7%) |
| Bottled, Tank, or LP Gas | 11 (1.7%) | 0 (0.0%) |
| Electricity | 321 (49.0%) | 102 (50.2%) |
| Fuel Oil or Kerosene | 0 (0.0%) | 0 (0.0%) |
| Coal or Coke | 0 (0.0%) | 0 (0.0%) |
| All other Fuels | 0 (0.0%) | 0 (0.0%) |
| No Fuel Used | 7 (1.1%) | 0 (0.0%) |
| Total | 655 (100.0%) | 203 (100.0%) |
Household Vehicle Usage in Carlisle
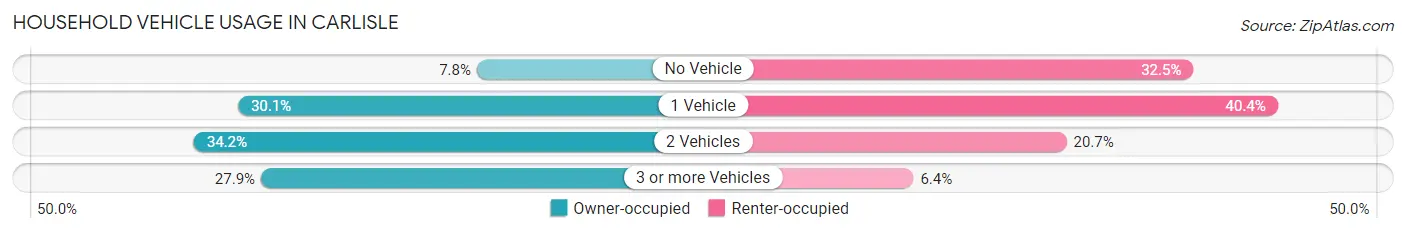
| Vehicles per Household | Owner-occupied | Renter-occupied |
| No Vehicle | 51 (7.8%) | 66 (32.5%) |
| 1 Vehicle | 197 (30.1%) | 82 (40.4%) |
| 2 Vehicles | 224 (34.2%) | 42 (20.7%) |
| 3 or more Vehicles | 183 (27.9%) | 13 (6.4%) |
| Total | 655 (100.0%) | 203 (100.0%) |
Real Estate & Mortgages in Carlisle
Real Estate and Mortgage Overview in Carlisle
| Characteristic | Without Mortgage | With Mortgage |
| Housing Units | 312 | 343 |
| Median Property Value | $92,700 | $130,800 |
| Median Household Income | $26,802 | $55 |
| Monthly Housing Costs | $349 | $0 |
| Real Estate Taxes | - | - |
Property Value by Mortgage Status in Carlisle
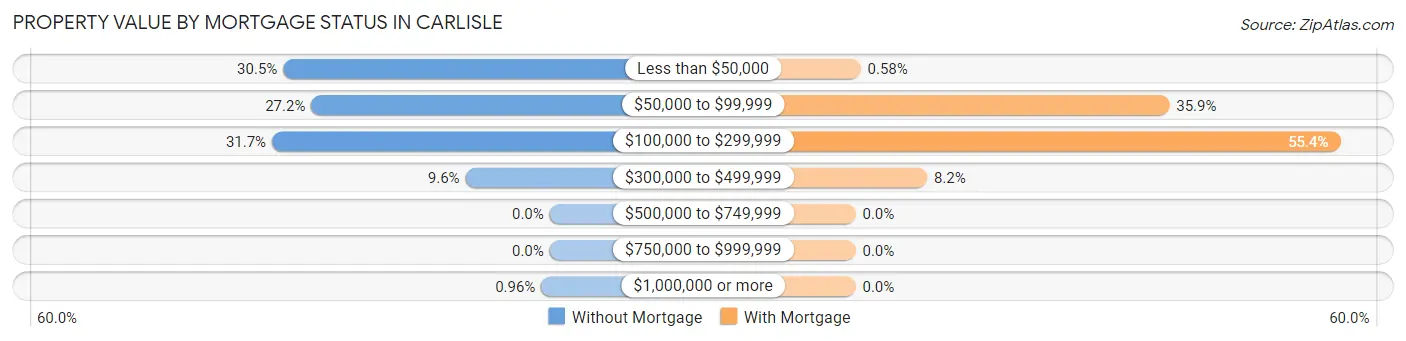
| Property Value | Without Mortgage | With Mortgage |
| Less than $50,000 | 95 (30.4%) | 2 (0.6%) |
| $50,000 to $99,999 | 85 (27.2%) | 123 (35.9%) |
| $100,000 to $299,999 | 99 (31.7%) | 190 (55.4%) |
| $300,000 to $499,999 | 30 (9.6%) | 28 (8.2%) |
| $500,000 to $749,999 | 0 (0.0%) | 0 (0.0%) |
| $750,000 to $999,999 | 0 (0.0%) | 0 (0.0%) |
| $1,000,000 or more | 3 (1.0%) | 0 (0.0%) |
| Total | 312 (100.0%) | 343 (100.0%) |
Household Income by Mortgage Status in Carlisle
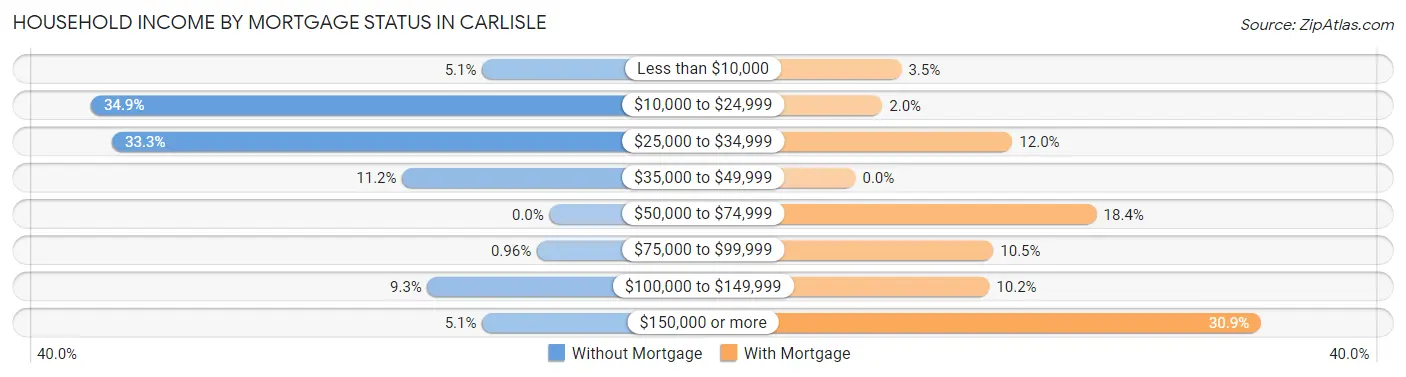
| Household Income | Without Mortgage | With Mortgage |
| Less than $10,000 | 16 (5.1%) | 12 (3.5%) |
| $10,000 to $24,999 | 109 (34.9%) | 7 (2.0%) |
| $25,000 to $34,999 | 104 (33.3%) | 41 (11.9%) |
| $35,000 to $49,999 | 35 (11.2%) | 0 (0.0%) |
| $50,000 to $74,999 | 0 (0.0%) | 63 (18.4%) |
| $75,000 to $99,999 | 3 (1.0%) | 36 (10.5%) |
| $100,000 to $149,999 | 29 (9.3%) | 35 (10.2%) |
| $150,000 or more | 16 (5.1%) | 106 (30.9%) |
| Total | 312 (100.0%) | 343 (100.0%) |
Property Value to Household Income Ratio in Carlisle
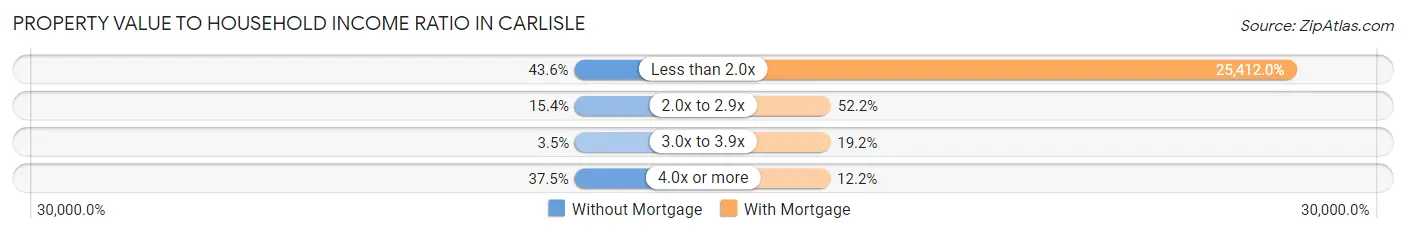
| Value-to-Income Ratio | Without Mortgage | With Mortgage |
| Less than 2.0x | 136 (43.6%) | 87,163 (25,411.9%) |
| 2.0x to 2.9x | 48 (15.4%) | 179 (52.2%) |
| 3.0x to 3.9x | 11 (3.5%) | 66 (19.2%) |
| 4.0x or more | 117 (37.5%) | 42 (12.2%) |
| Total | 312 (100.0%) | 343 (100.0%) |
Real Estate Taxes by Mortgage Status in Carlisle
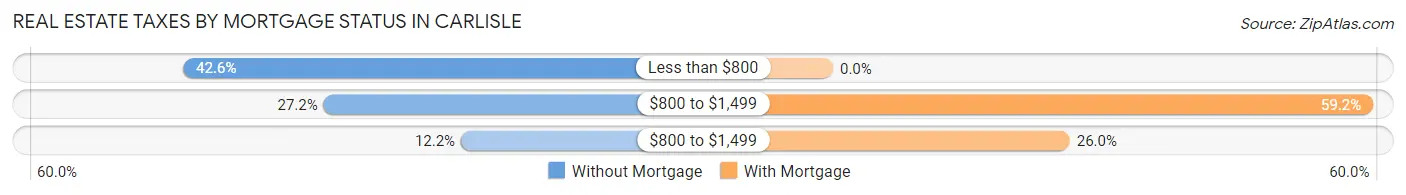
| Property Taxes | Without Mortgage | With Mortgage |
| Less than $800 | 133 (42.6%) | 0 (0.0%) |
| $800 to $1,499 | 85 (27.2%) | 203 (59.2%) |
| $800 to $1,499 | 38 (12.2%) | 89 (26.0%) |
| Total | 312 (100.0%) | 343 (100.0%) |
Health & Disability in Carlisle
Health Insurance Coverage by Age in Carlisle
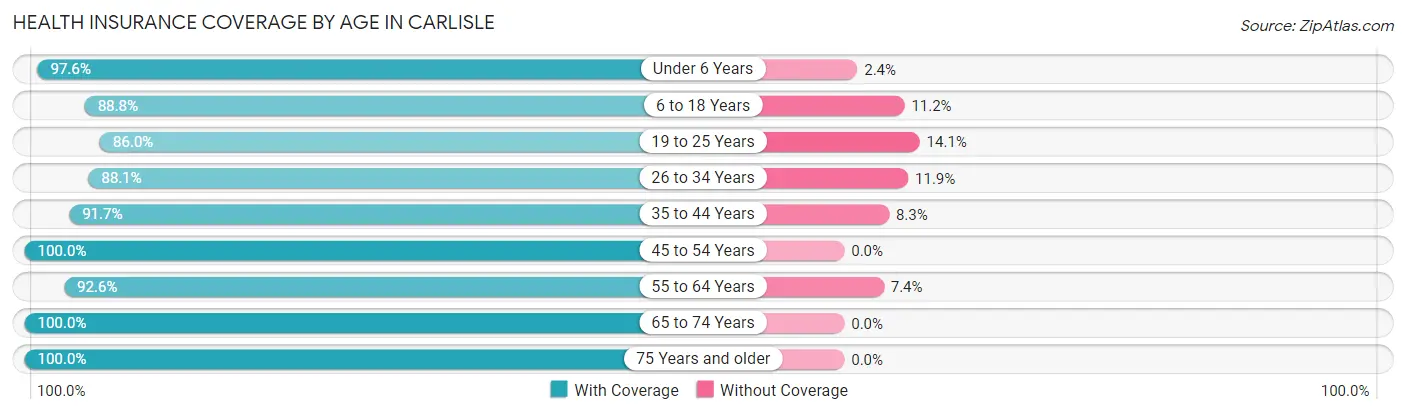
| Age Bracket | With Coverage | Without Coverage |
| Under 6 Years | 161 (97.6%) | 4 (2.4%) |
| 6 to 18 Years | 435 (88.8%) | 55 (11.2%) |
| 19 to 25 Years | 104 (86.0%) | 17 (14.1%) |
| 26 to 34 Years | 185 (88.1%) | 25 (11.9%) |
| 35 to 44 Years | 231 (91.7%) | 21 (8.3%) |
| 45 to 54 Years | 271 (100.0%) | 0 (0.0%) |
| 55 to 64 Years | 239 (92.6%) | 19 (7.4%) |
| 65 to 74 Years | 169 (100.0%) | 0 (0.0%) |
| 75 Years and older | 314 (100.0%) | 0 (0.0%) |
| Total | 2,109 (93.7%) | 141 (6.3%) |
Health Insurance Coverage by Citizenship Status in Carlisle
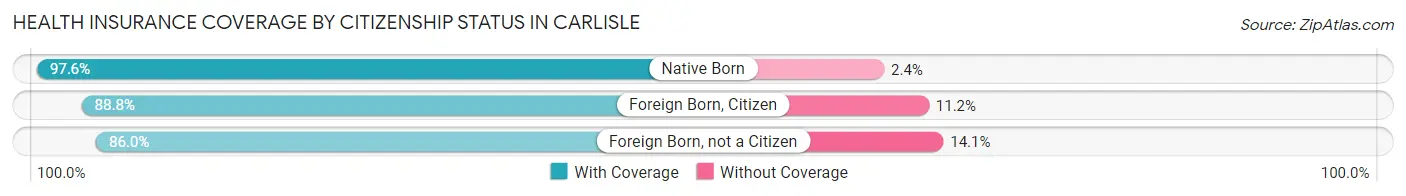
| Citizenship Status | With Coverage | Without Coverage |
| Native Born | 161 (97.6%) | 4 (2.4%) |
| Foreign Born, Citizen | 435 (88.8%) | 55 (11.2%) |
| Foreign Born, not a Citizen | 104 (86.0%) | 17 (14.1%) |
Health Insurance Coverage by Household Income in Carlisle
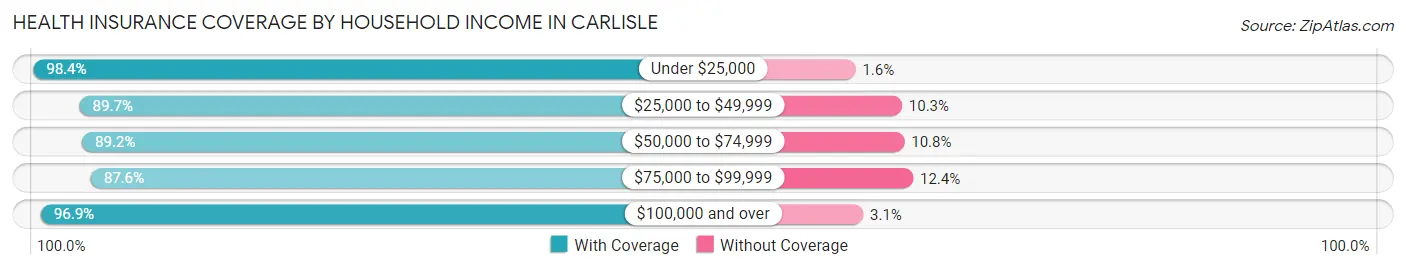
| Household Income | With Coverage | Without Coverage |
| Under $25,000 | 483 (98.4%) | 8 (1.6%) |
| $25,000 to $49,999 | 626 (89.7%) | 72 (10.3%) |
| $50,000 to $74,999 | 182 (89.2%) | 22 (10.8%) |
| $75,000 to $99,999 | 120 (87.6%) | 17 (12.4%) |
| $100,000 and over | 698 (96.9%) | 22 (3.1%) |
Public vs Private Health Insurance Coverage by Age in Carlisle
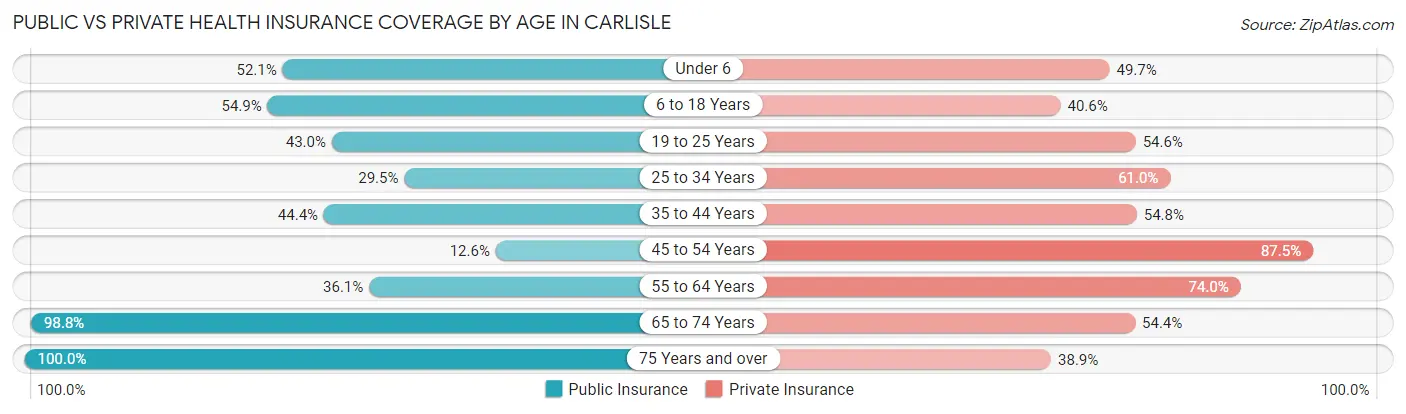
| Age Bracket | Public Insurance | Private Insurance |
| Under 6 | 86 (52.1%) | 82 (49.7%) |
| 6 to 18 Years | 269 (54.9%) | 199 (40.6%) |
| 19 to 25 Years | 52 (43.0%) | 66 (54.5%) |
| 25 to 34 Years | 62 (29.5%) | 128 (61.0%) |
| 35 to 44 Years | 112 (44.4%) | 138 (54.8%) |
| 45 to 54 Years | 34 (12.6%) | 237 (87.5%) |
| 55 to 64 Years | 93 (36.0%) | 191 (74.0%) |
| 65 to 74 Years | 167 (98.8%) | 92 (54.4%) |
| 75 Years and over | 314 (100.0%) | 122 (38.9%) |
| Total | 1,189 (52.8%) | 1,255 (55.8%) |
Disability Status by Sex by Age in Carlisle
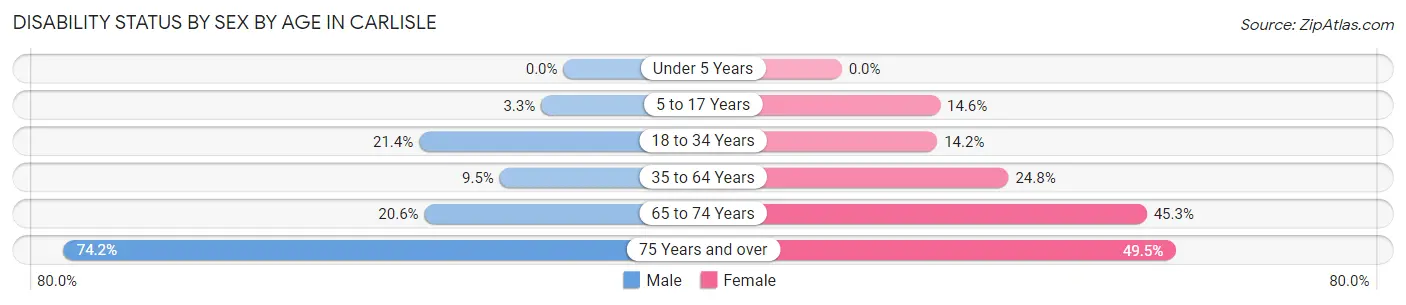
| Age Bracket | Male | Female |
| Under 5 Years | 0 (0.0%) | 0 (0.0%) |
| 5 to 17 Years | 8 (3.3%) | 40 (14.6%) |
| 18 to 34 Years | 21 (21.4%) | 36 (14.2%) |
| 35 to 64 Years | 36 (9.5%) | 99 (24.7%) |
| 65 to 74 Years | 13 (20.6%) | 48 (45.3%) |
| 75 Years and over | 89 (74.2%) | 96 (49.5%) |
Disability Class by Sex by Age in Carlisle
Disability Class: Hearing Difficulty
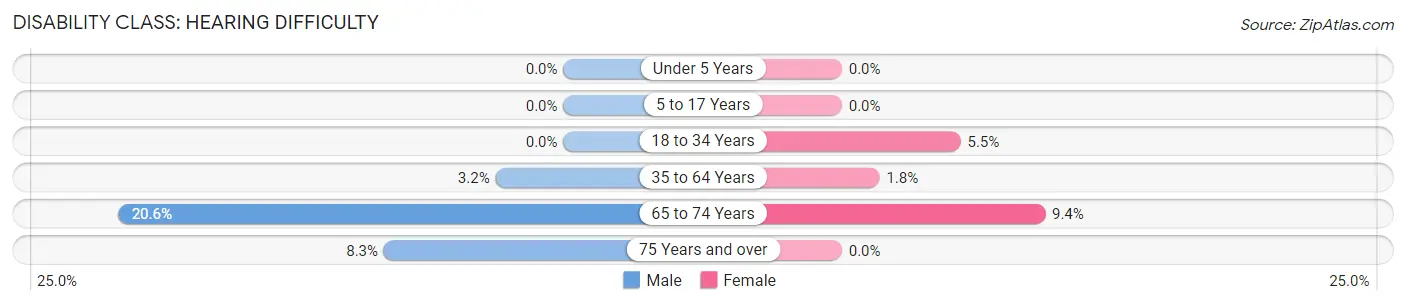
| Age Bracket | Male | Female |
| Under 5 Years | 0 (0.0%) | 0 (0.0%) |
| 5 to 17 Years | 0 (0.0%) | 0 (0.0%) |
| 18 to 34 Years | 0 (0.0%) | 14 (5.5%) |
| 35 to 64 Years | 12 (3.2%) | 7 (1.8%) |
| 65 to 74 Years | 13 (20.6%) | 10 (9.4%) |
| 75 Years and over | 10 (8.3%) | 0 (0.0%) |
Disability Class: Vision Difficulty
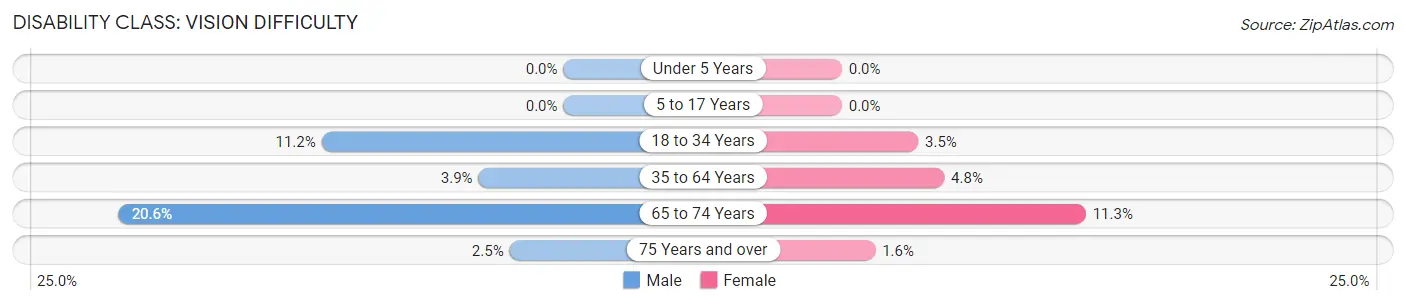
| Age Bracket | Male | Female |
| Under 5 Years | 0 (0.0%) | 0 (0.0%) |
| 5 to 17 Years | 0 (0.0%) | 0 (0.0%) |
| 18 to 34 Years | 11 (11.2%) | 9 (3.5%) |
| 35 to 64 Years | 15 (3.9%) | 19 (4.8%) |
| 65 to 74 Years | 13 (20.6%) | 12 (11.3%) |
| 75 Years and over | 3 (2.5%) | 3 (1.5%) |
Disability Class: Cognitive Difficulty
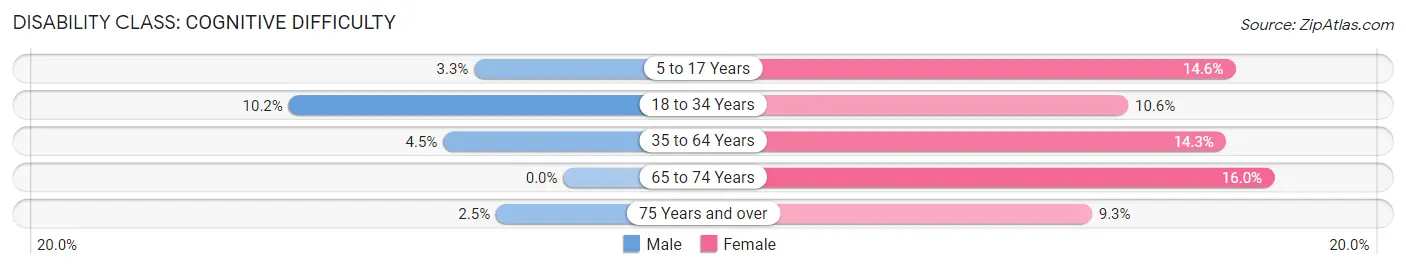
| Age Bracket | Male | Female |
| 5 to 17 Years | 8 (3.3%) | 40 (14.6%) |
| 18 to 34 Years | 10 (10.2%) | 27 (10.6%) |
| 35 to 64 Years | 17 (4.5%) | 57 (14.2%) |
| 65 to 74 Years | 0 (0.0%) | 17 (16.0%) |
| 75 Years and over | 3 (2.5%) | 18 (9.3%) |
Disability Class: Ambulatory Difficulty
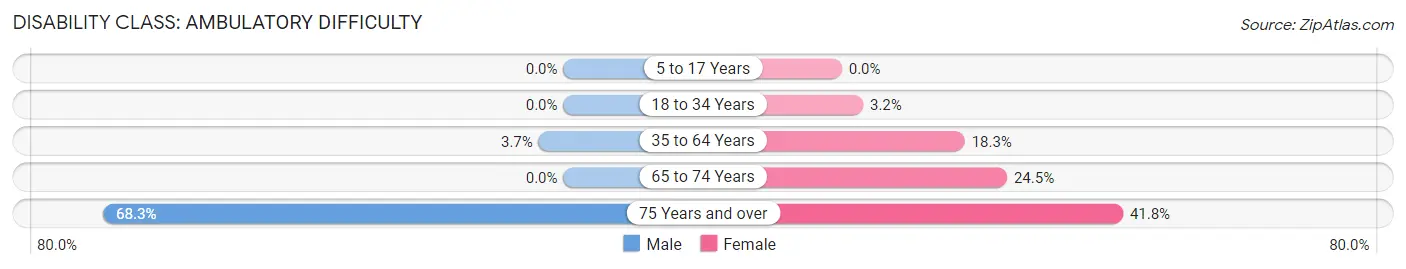
| Age Bracket | Male | Female |
| 5 to 17 Years | 0 (0.0%) | 0 (0.0%) |
| 18 to 34 Years | 0 (0.0%) | 8 (3.2%) |
| 35 to 64 Years | 14 (3.7%) | 73 (18.2%) |
| 65 to 74 Years | 0 (0.0%) | 26 (24.5%) |
| 75 Years and over | 82 (68.3%) | 81 (41.7%) |
Disability Class: Self-Care Difficulty
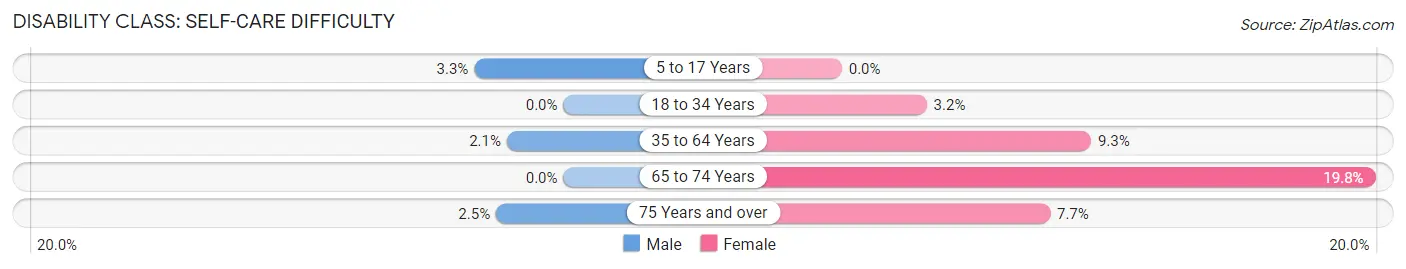
| Age Bracket | Male | Female |
| 5 to 17 Years | 8 (3.3%) | 0 (0.0%) |
| 18 to 34 Years | 0 (0.0%) | 8 (3.2%) |
| 35 to 64 Years | 8 (2.1%) | 37 (9.2%) |
| 65 to 74 Years | 0 (0.0%) | 21 (19.8%) |
| 75 Years and over | 3 (2.5%) | 15 (7.7%) |
Technology Access in Carlisle
Computing Device Access in Carlisle
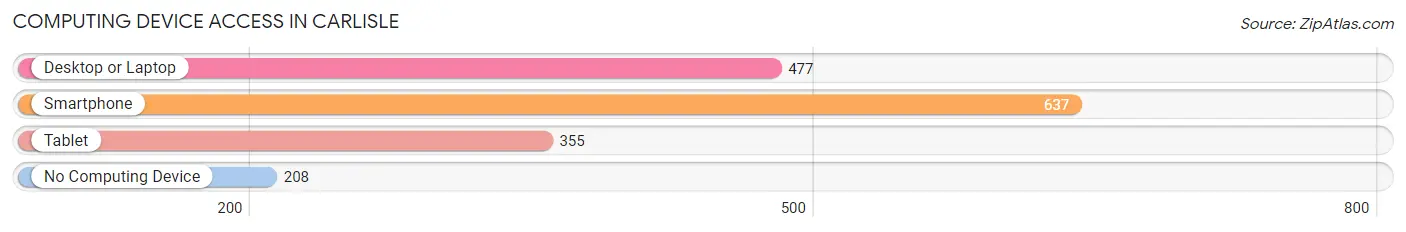
| Device Type | # Households | % Households |
| Desktop or Laptop | 477 | 55.6% |
| Smartphone | 637 | 74.2% |
| Tablet | 355 | 41.4% |
| No Computing Device | 208 | 24.2% |
| Total | 858 | 100.0% |
Internet Access in Carlisle
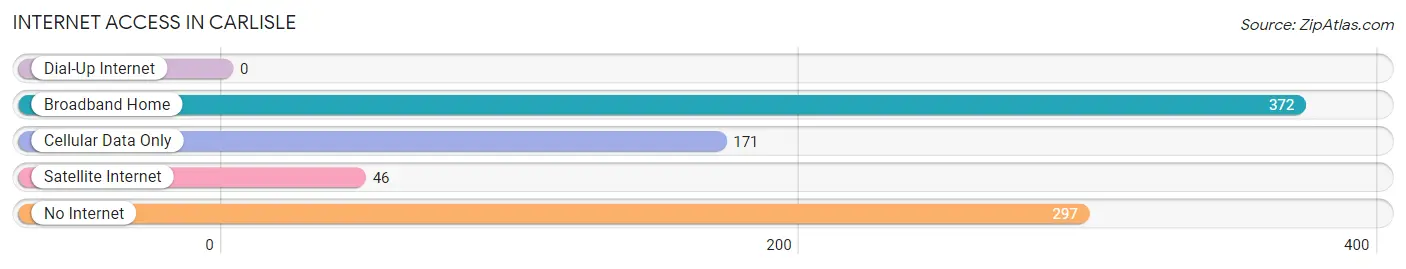
| Internet Type | # Households | % Households |
| Dial-Up Internet | 0 | 0.0% |
| Broadband Home | 372 | 43.4% |
| Cellular Data Only | 171 | 19.9% |
| Satellite Internet | 46 | 5.4% |
| No Internet | 297 | 34.6% |
| Total | 858 | 100.0% |
Carlisle Summary
History
The town of Carlisle, Arkansas is located in Lonoke County, in the central part of the state. It is situated on the banks of the White River, and is part of the Little Rock-North Little Rock-Conway Metropolitan Statistical Area. The town was founded in 1873 by William Carlisle, a former Confederate soldier, and was originally known as Carlisle Station. The town was incorporated in 1876, and the first post office was established in 1877.
The town was a major stop on the St. Louis, Iron Mountain and Southern Railway, and was a popular destination for travelers. The town was also home to a number of businesses, including a cotton gin, a grist mill, a sawmill, and a blacksmith shop. The town was also home to a number of churches, including the First Baptist Church, which was established in 1877.
In the early 1900s, the town began to experience a period of growth and prosperity. The population increased from just over 500 in 1900 to over 1,000 by 1910. The town was home to a number of businesses, including a bank, a hotel, a movie theater, and a number of stores. The town also had a number of schools, including a high school, which was established in 1910.
The town continued to grow and prosper throughout the 20th century. In the 1950s, the town was home to a number of industries, including a cotton mill, a lumber mill, and a canning factory. The town also had a number of stores, restaurants, and other businesses.
Geography
Carlisle is located in Lonoke County, in the central part of Arkansas. It is situated on the banks of the White River, and is part of the Little Rock-North Little Rock-Conway Metropolitan Statistical Area. The town is located approximately 25 miles east of Little Rock, and is situated at an elevation of approximately 300 feet.
The town is located in a region of rolling hills and wooded areas. The climate is humid subtropical, with hot, humid summers and mild winters. The average annual temperature is around 65 degrees Fahrenheit, and the average annual precipitation is around 48 inches.
Economy
The economy of Carlisle is largely based on agriculture and manufacturing. The town is home to a number of farms, which produce a variety of crops, including cotton, soybeans, corn, and wheat. The town is also home to a number of manufacturing companies, which produce a variety of products, including furniture, clothing, and automotive parts.
The town is also home to a number of businesses, including restaurants, stores, and other services. The town is also home to a number of banks, which provide financial services to the local community.
Demographics
As of the 2010 census, the population of Carlisle was 2,845. The racial makeup of the town was 79.3% White, 17.2% African American, 0.3% Native American, 0.3% Asian, 0.1% Pacific Islander, and 2.8% from other races. The median household income was $37,917, and the median family income was $45,938. The per capita income was $17,945.
Conclusion
Carlisle, Arkansas is a small town located in Lonoke County, in the central part of the state. The town was founded in 1873, and has a long history of growth and prosperity. The town is home to a number of businesses, including farms, manufacturing companies, and other services. The town has a population of 2,845, and the median household income is $37,917. The town is a popular destination for travelers, and is home to a number of churches, schools, and other businesses.
Common Questions
What is the Total Population of Carlisle?
Total Population of Carlisle is 2,329.
What is the Total Male Population of Carlisle?
Total Male Population of Carlisle is 990.
What is the Total Female Population of Carlisle?
Total Female Population of Carlisle is 1,339.
What is the Ratio of Males per 100 Females in Carlisle?
There are 73.94 Males per 100 Females in Carlisle.
What is the Ratio of Females per 100 Males in Carlisle?
There are 135.25 Females per 100 Males in Carlisle.
What is the Median Population Age in Carlisle?
Median Population Age in Carlisle is 42.0 Years.
What is the Average Family Size in Carlisle
Average Family Size in Carlisle is 3.4 People.
What is the Average Household Size in Carlisle
Average Household Size in Carlisle is 2.6 People.
What is Per Capita Income in Carlisle?
Per Capita income in Carlisle is $23,460.
What is the Median Family Income in Carlisle?
Median Family Income in Carlisle is $50,000.
What is the Median Household income in Carlisle?
Median Household Income in Carlisle is $35,769.
What is Income or Wage Gap in Carlisle?
Income or Wage Gap in Carlisle is 43.9%.
Women in Carlisle earn 56.1 cents for every dollar earned by a man.
What is Inequality or Gini Index in Carlisle?
Inequality or Gini Index in Carlisle is 0.48.
How Large is the Labor Force in Carlisle?
There are 939 People in the Labor Forcein in Carlisle.
What is the Percentage of People in the Labor Force in Carlisle?
54.2% of People are in the Labor Force in Carlisle.
What is the Unemployment Rate in Carlisle?
Unemployment Rate in Carlisle is 6.2%.