Campbell Station, AR
Campbell Station Map
Campbell Station Overview
311
TOTAL POPULATION
148
MALE POPULATION
163
FEMALE POPULATION
90.80
MALES / 100 FEMALES
110.14
FEMALES / 100 MALES
51.2
MEDIAN AGE
2.3
AVG FAMILY SIZE
1.9
AVG HOUSEHOLD SIZE
$35,923
PER CAPITA INCOME
$65,833
AVG FAMILY INCOME
$72,083
AVG HOUSEHOLD INCOME
0.25
INEQUALITY / GINI INDEX
218
LABOR FORCE [ PEOPLE ]
76.2%
PERCENT IN LABOR FORCE
5.0%
UNEMPLOYMENT RATE
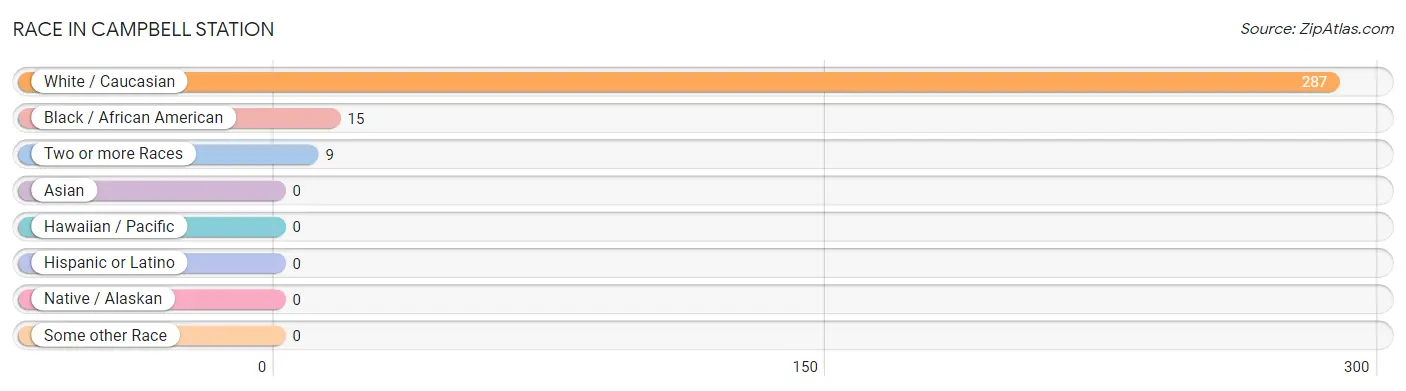
Race in Campbell Station
The most populous races in Campbell Station are White / Caucasian (287 | 92.3%), Black / African American (15 | 4.8%), and Two or more Races (9 | 2.9%).
| Race | # Population | % Population |
| Asian | 0 | 0.0% |
| Black / African American | 15 | 4.8% |
| Hawaiian / Pacific | 0 | 0.0% |
| Hispanic or Latino | 0 | 0.0% |
| Native / Alaskan | 0 | 0.0% |
| White / Caucasian | 287 | 92.3% |
| Two or more Races | 9 | 2.9% |
| Some other Race | 0 | 0.0% |
| Total | 311 | 100.0% |
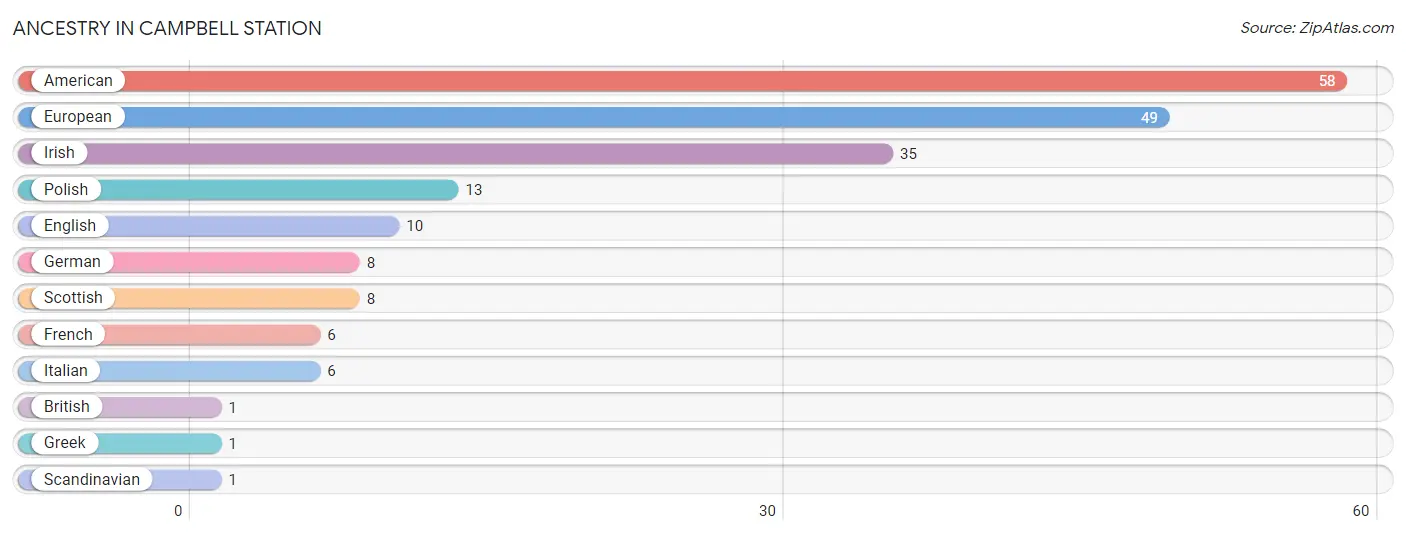
Ancestry in Campbell Station
The most populous ancestries reported in Campbell Station are American (58 | 18.6%), European (49 | 15.8%), Irish (35 | 11.3%), Polish (13 | 4.2%), and English (10 | 3.2%), together accounting for 53.1% of all Campbell Station residents.
| Ancestry | # Population | % Population |
| American | 58 | 18.6% |
| British | 1 | 0.3% |
| English | 10 | 3.2% |
| European | 49 | 15.8% |
| French | 6 | 1.9% |
| German | 8 | 2.6% |
| Greek | 1 | 0.3% |
| Irish | 35 | 11.3% |
| Italian | 6 | 1.9% |
| Polish | 13 | 4.2% |
| Scandinavian | 1 | 0.3% |
| Scottish | 8 | 2.6% | View All 12 Rows |
Immigrants in Campbell Station

| Immigration Origin | # Population | % Population | View All 0 Rows |
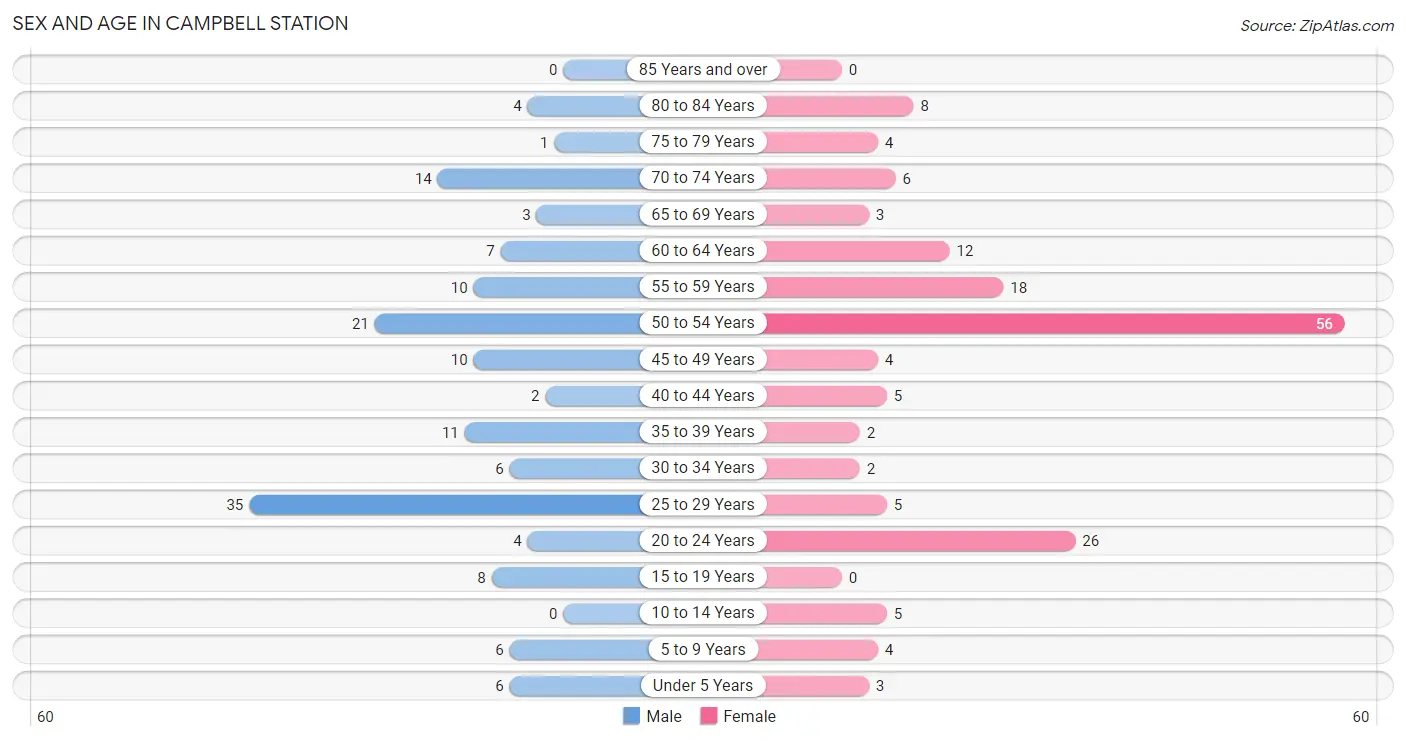
Sex and Age in Campbell Station
Sex and Age in Campbell Station
The most populous age groups in Campbell Station are 25 to 29 Years (35 | 23.6%) for men and 50 to 54 Years (56 | 34.4%) for women.
| Age Bracket | Male | Female |
| Under 5 Years | 6 (4.1%) | 3 (1.8%) |
| 5 to 9 Years | 6 (4.1%) | 4 (2.5%) |
| 10 to 14 Years | 0 (0.0%) | 5 (3.1%) |
| 15 to 19 Years | 8 (5.4%) | 0 (0.0%) |
| 20 to 24 Years | 4 (2.7%) | 26 (16.0%) |
| 25 to 29 Years | 35 (23.6%) | 5 (3.1%) |
| 30 to 34 Years | 6 (4.1%) | 2 (1.2%) |
| 35 to 39 Years | 11 (7.4%) | 2 (1.2%) |
| 40 to 44 Years | 2 (1.3%) | 5 (3.1%) |
| 45 to 49 Years | 10 (6.8%) | 4 (2.5%) |
| 50 to 54 Years | 21 (14.2%) | 56 (34.4%) |
| 55 to 59 Years | 10 (6.8%) | 18 (11.0%) |
| 60 to 64 Years | 7 (4.7%) | 12 (7.4%) |
| 65 to 69 Years | 3 (2.0%) | 3 (1.8%) |
| 70 to 74 Years | 14 (9.5%) | 6 (3.7%) |
| 75 to 79 Years | 1 (0.7%) | 4 (2.5%) |
| 80 to 84 Years | 4 (2.7%) | 8 (4.9%) |
| 85 Years and over | 0 (0.0%) | 0 (0.0%) |
| Total | 148 (100.0%) | 163 (100.0%) |
Families and Households in Campbell Station
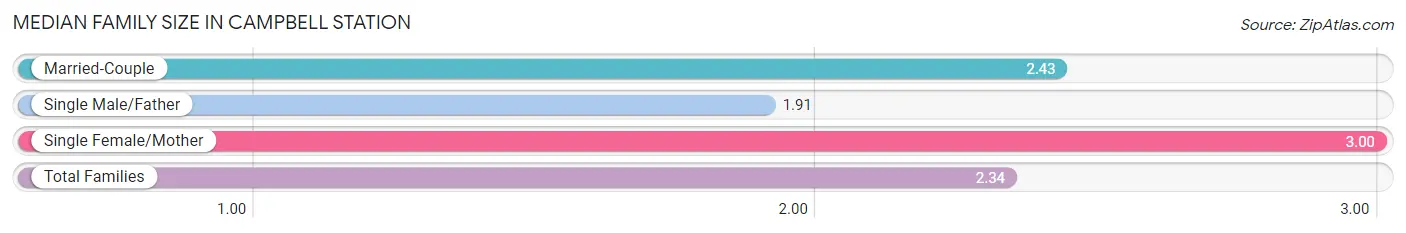
Median Family Size in Campbell Station
The median family size in Campbell Station is 2.34 persons per family, with single female/mother families (6 | 6.2%) accounting for the largest median family size of 3 persons per family. On the other hand, single male/father families (22 | 22.9%) represent the smallest median family size with 1.91 persons per family.
| Family Type | # Families | Family Size |
| Married-Couple | 68 (70.8%) | 2.43 |
| Single Male/Father | 22 (22.9%) | 1.91 |
| Single Female/Mother | 6 (6.2%) | 3.00 |
| Total Families | 96 (100.0%) | 2.34 |
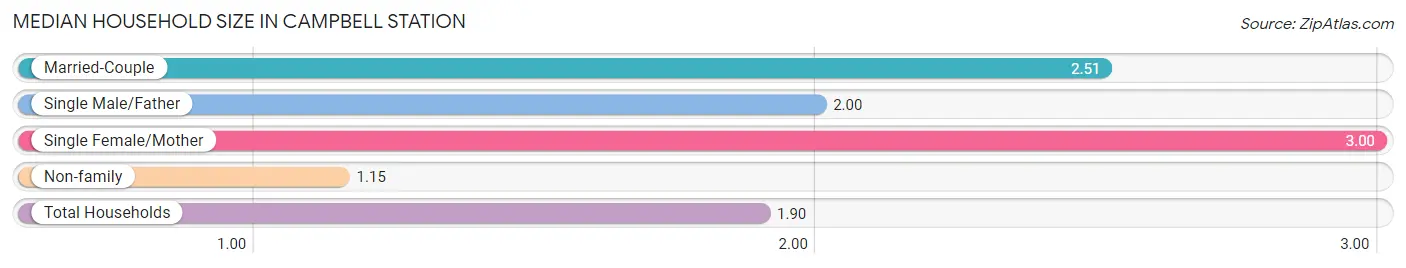
Median Household Size in Campbell Station
The median household size in Campbell Station is 1.90 persons per household, with single female/mother households (6 | 3.7%) accounting for the largest median household size of 3 persons per household. non-family households (68 | 41.5%) represent the smallest median household size with 1.15 persons per household.
| Household Type | # Households | Household Size |
| Married-Couple | 68 (41.5%) | 2.51 |
| Single Male/Father | 22 (13.4%) | 2.00 |
| Single Female/Mother | 6 (3.7%) | 3.00 |
| Non-family | 68 (41.5%) | 1.15 |
| Total Households | 164 (100.0%) | 1.90 |
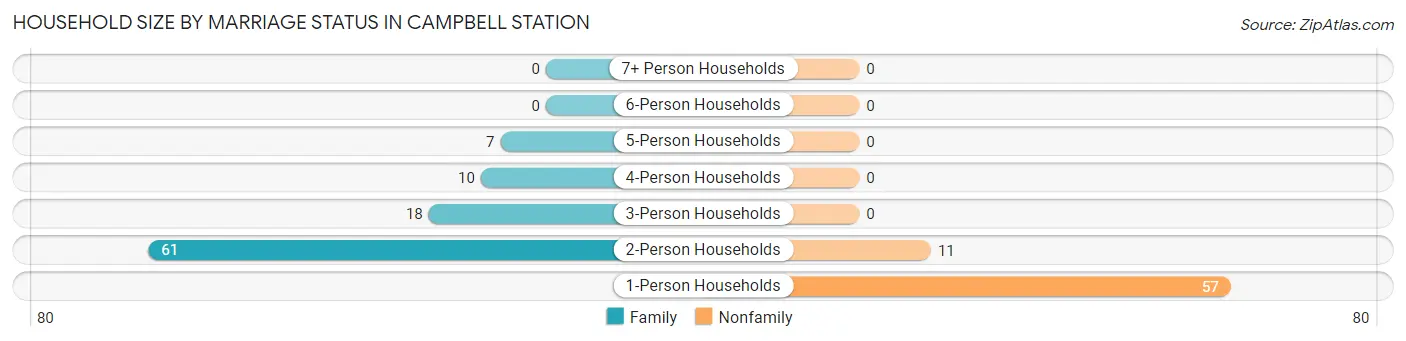
Household Size by Marriage Status in Campbell Station
Out of a total of 164 households in Campbell Station, 96 (58.5%) are family households, while 68 (41.5%) are nonfamily households. The most numerous type of family households are 2-person households, comprising 61, and the most common type of nonfamily households are 1-person households, comprising 57.
| Household Size | Family Households | Nonfamily Households |
| 1-Person Households | - | 57 (34.8%) |
| 2-Person Households | 61 (37.2%) | 11 (6.7%) |
| 3-Person Households | 18 (11.0%) | 0 (0.0%) |
| 4-Person Households | 10 (6.1%) | 0 (0.0%) |
| 5-Person Households | 7 (4.3%) | 0 (0.0%) |
| 6-Person Households | 0 (0.0%) | 0 (0.0%) |
| 7+ Person Households | 0 (0.0%) | 0 (0.0%) |
| Total | 96 (58.5%) | 68 (41.5%) |
Female Fertility in Campbell Station
Fertility by Age in Campbell Station
| Age Bracket | Women with Births | Births / 1,000 Women |
| 15 to 19 years | 0 (0.0%) | 0.0 |
| 20 to 34 years | 0 (0.0%) | 0.0 |
| 35 to 50 years | 0 (0.0%) | 0.0 |
| Total | 0 (0.0%) | 0.0 |
Fertility by Age by Marriage Status in Campbell Station
| Age Bracket | Married | Unmarried |
| 15 to 19 years | 0 (0.0%) | 0 (0.0%) |
| 20 to 34 years | 0 (0.0%) | 0 (0.0%) |
| 35 to 50 years | 0 (0.0%) | 0 (0.0%) |
| Total | 0 (0.0%) | 0 (0.0%) |
Fertility by Education in Campbell Station
| Educational Attainment | Women with Births | Births / 1,000 Women |
| Less than High School | 0 (0.0%) | 0.0 |
| High School Diploma | 0 (0.0%) | 0.0 |
| College or Associate's Degree | 0 (0.0%) | 0.0 |
| Bachelor's Degree | 0 (0.0%) | 0.0 |
| Graduate Degree | 0 (0.0%) | 0.0 |
| Total | 0 (0.0%) | 0.0 |
Fertility by Education by Marriage Status in Campbell Station
| Educational Attainment | Married | Unmarried |
| Less than High School | 0 (0.0%) | 0 (0.0%) |
| High School Diploma | 0 (0.0%) | 0 (0.0%) |
| College or Associate's Degree | 0 (0.0%) | 0 (0.0%) |
| Bachelor's Degree | 0 (0.0%) | 0 (0.0%) |
| Graduate Degree | 0 (0.0%) | 0 (0.0%) |
| Total | 0 (0.0%) | 0 (0.0%) |
Income in Campbell Station
Income Overview in Campbell Station
Per Capita Income in Campbell Station is $35,923, while median incomes of families and households are $65,833 and $72,083 respectively.
| Characteristic | Number | Measure |
| Per Capita Income | 311 | $35,923 |
| Median Family Income | 96 | $65,833 |
| Mean Family Income | 96 | $59,320 |
| Median Household Income | 164 | $72,083 |
| Mean Household Income | 164 | $68,798 |
| Income Deficit | 96 | $0 |
| Wage / Income Gap (%) | 311 | 0.00% |
| Wage / Income Gap ($) | 311 | 100.00¢ per $1 |
| Gini / Inequality Index | 311 | 0.25 |
Earnings by Sex in Campbell Station
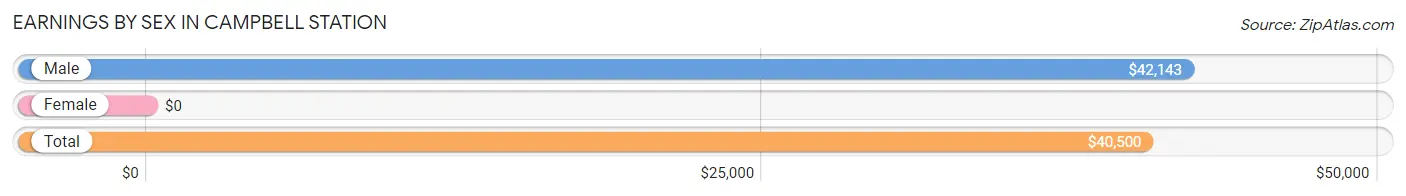
| Sex | Number | Average Earnings |
| Male | 96 (45.3%) | $42,143 |
| Female | 116 (54.7%) | $0 |
| Total | 212 (100.0%) | $40,500 |
Earnings by Sex by Income Bracket in Campbell Station
The most common earnings brackets in Campbell Station are $40,000 to $44,999 for men (18 | 18.8%) and $75,000 to $99,999 for women (45 | 38.8%).
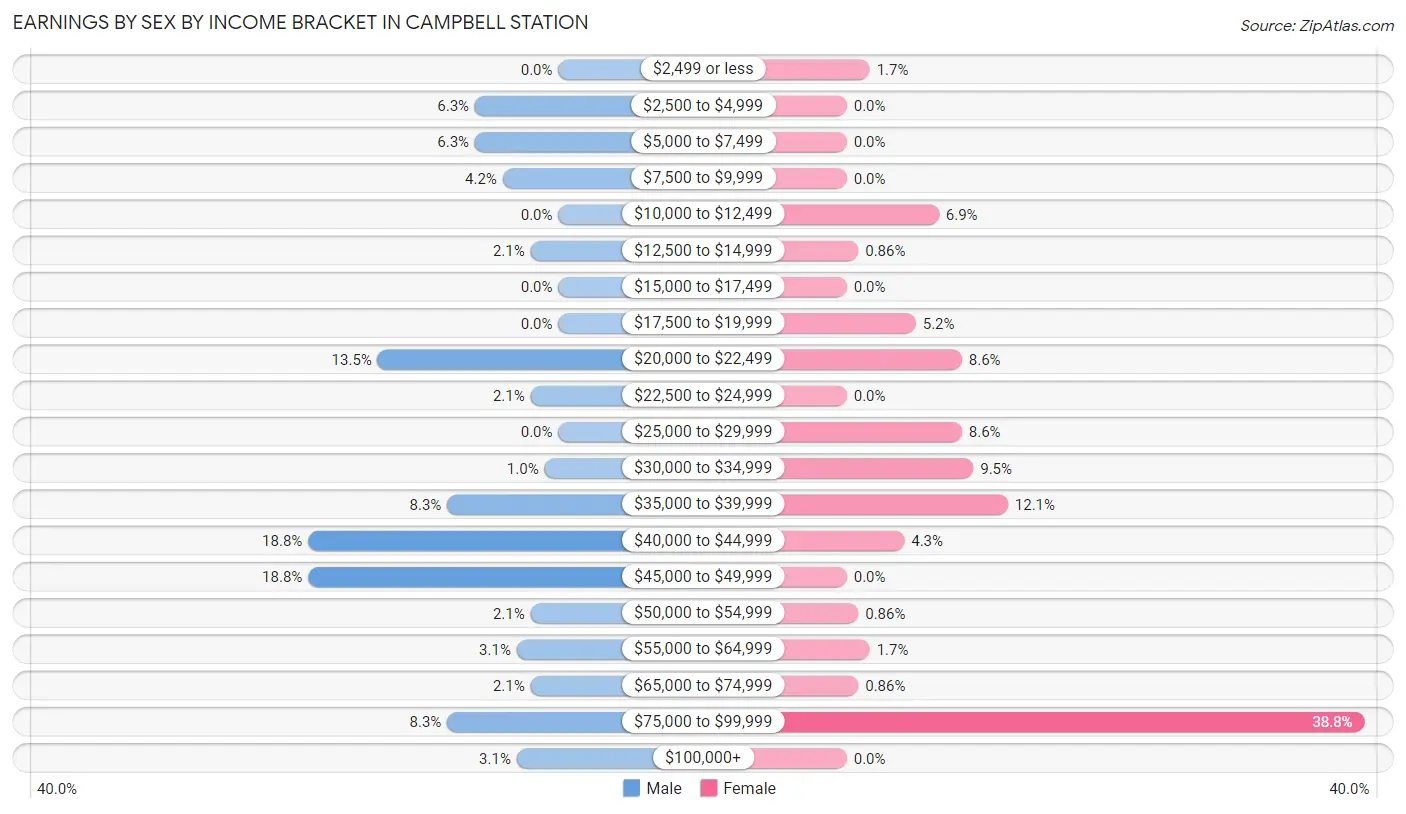
| Income | Male | Female |
| $2,499 or less | 0 (0.0%) | 2 (1.7%) |
| $2,500 to $4,999 | 6 (6.2%) | 0 (0.0%) |
| $5,000 to $7,499 | 6 (6.2%) | 0 (0.0%) |
| $7,500 to $9,999 | 4 (4.2%) | 0 (0.0%) |
| $10,000 to $12,499 | 0 (0.0%) | 8 (6.9%) |
| $12,500 to $14,999 | 2 (2.1%) | 1 (0.9%) |
| $15,000 to $17,499 | 0 (0.0%) | 0 (0.0%) |
| $17,500 to $19,999 | 0 (0.0%) | 6 (5.2%) |
| $20,000 to $22,499 | 13 (13.5%) | 10 (8.6%) |
| $22,500 to $24,999 | 2 (2.1%) | 0 (0.0%) |
| $25,000 to $29,999 | 0 (0.0%) | 10 (8.6%) |
| $30,000 to $34,999 | 1 (1.0%) | 11 (9.5%) |
| $35,000 to $39,999 | 8 (8.3%) | 14 (12.1%) |
| $40,000 to $44,999 | 18 (18.8%) | 5 (4.3%) |
| $45,000 to $49,999 | 18 (18.8%) | 0 (0.0%) |
| $50,000 to $54,999 | 2 (2.1%) | 1 (0.9%) |
| $55,000 to $64,999 | 3 (3.1%) | 2 (1.7%) |
| $65,000 to $74,999 | 2 (2.1%) | 1 (0.9%) |
| $75,000 to $99,999 | 8 (8.3%) | 45 (38.8%) |
| $100,000+ | 3 (3.1%) | 0 (0.0%) |
| Total | 96 (100.0%) | 116 (100.0%) |
Earnings by Sex by Educational Attainment in Campbell Station
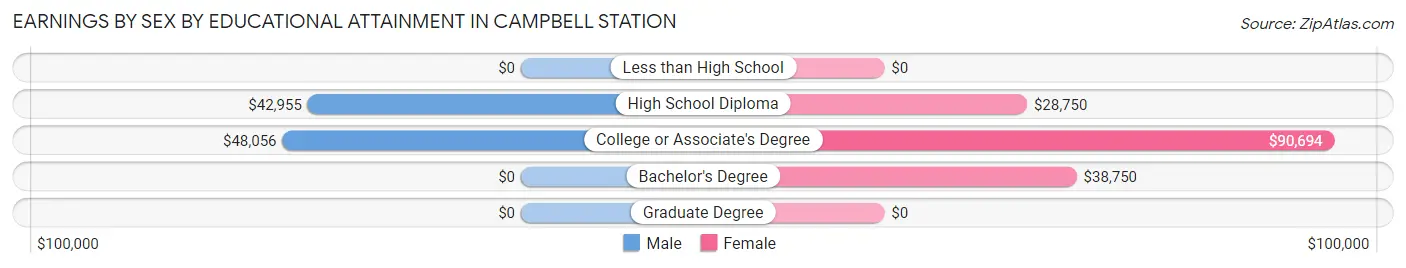
| Educational Attainment | Male Income | Female Income |
| Less than High School | - | - |
| High School Diploma | $42,955 | $28,750 |
| College or Associate's Degree | $48,056 | $90,694 |
| Bachelor's Degree | - | - |
| Graduate Degree | - | - |
| Total | $42,321 | $0 |
Family Income in Campbell Station
Family Income Brackets in Campbell Station
According to the Campbell Station family income data, there are 35 families falling into the $50,000 to $74,999 income range, which is the most common income bracket and makes up 36.5% of all families.
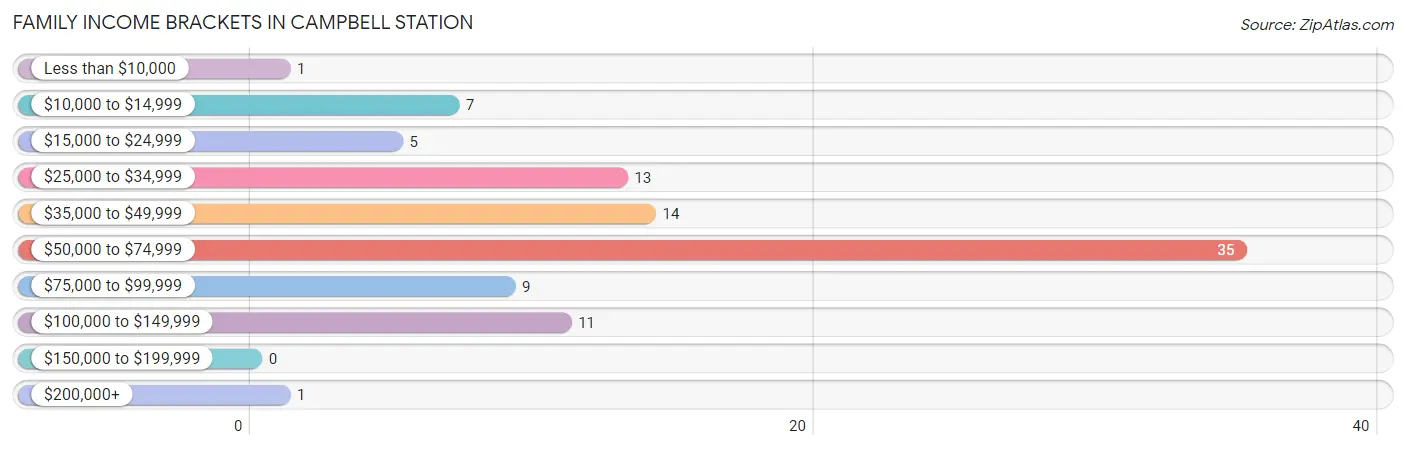
| Income Bracket | # Families | % Families |
| Less than $10,000 | 1 | 1.0% |
| $10,000 to $14,999 | 7 | 7.3% |
| $15,000 to $24,999 | 5 | 5.2% |
| $25,000 to $34,999 | 13 | 13.5% |
| $35,000 to $49,999 | 14 | 14.6% |
| $50,000 to $74,999 | 35 | 36.5% |
| $75,000 to $99,999 | 9 | 9.4% |
| $100,000 to $149,999 | 11 | 11.5% |
| $150,000 to $199,999 | 0 | 0.0% |
| $200,000+ | 1 | 1.0% |
Family Income by Famaliy Size in Campbell Station
3-person families (18 | 18.8%) account for the highest median family income in Campbell Station with $72,500 per family, while 2-person families (65 | 67.7%) have the highest median income of $26,875 per family member.
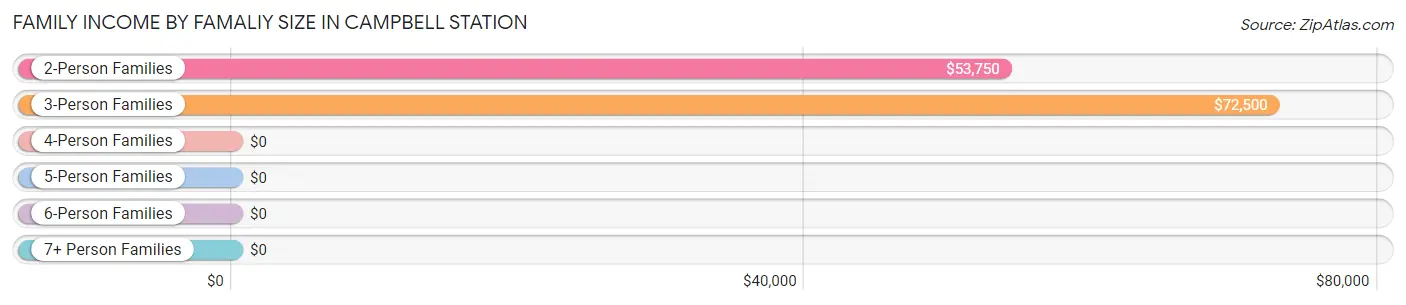
| Income Bracket | # Families | Median Income |
| 2-Person Families | 65 (67.7%) | $53,750 |
| 3-Person Families | 18 (18.8%) | $72,500 |
| 4-Person Families | 11 (11.5%) | $0 |
| 5-Person Families | 2 (2.1%) | $0 |
| 6-Person Families | 0 (0.0%) | $0 |
| 7+ Person Families | 0 (0.0%) | $0 |
| Total | 96 (100.0%) | $65,833 |
Family Income by Number of Earners in Campbell Station
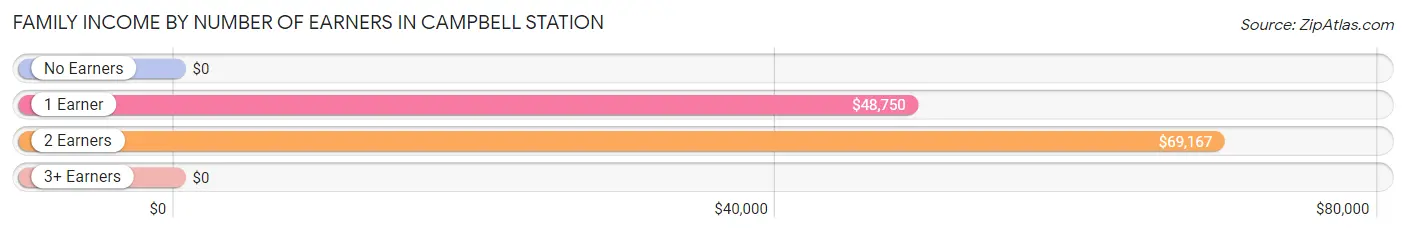
| Number of Earners | # Families | Median Income |
| No Earners | 15 (15.6%) | $0 |
| 1 Earner | 20 (20.8%) | $48,750 |
| 2 Earners | 52 (54.2%) | $69,167 |
| 3+ Earners | 9 (9.4%) | $0 |
| Total | 96 (100.0%) | $65,833 |
Household Income in Campbell Station
Household Income Brackets in Campbell Station
With 54 households falling in the category, the $75,000 to $99,999 income range is the most frequent in Campbell Station, accounting for 32.9% of all households.
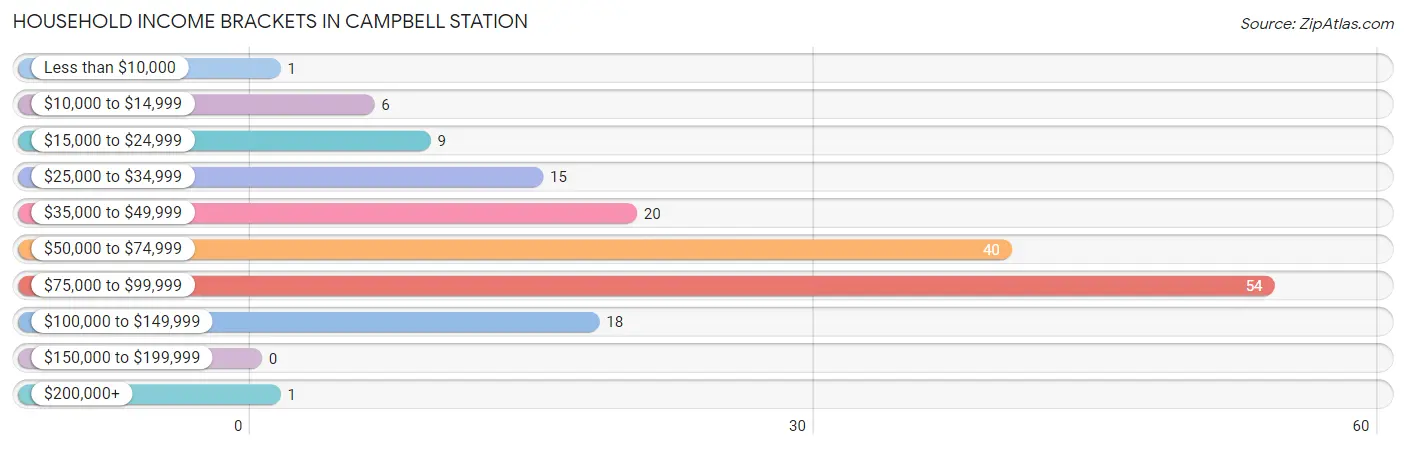
| Income Bracket | # Households | % Households |
| Less than $10,000 | 1 | 0.6% |
| $10,000 to $14,999 | 6 | 3.7% |
| $15,000 to $24,999 | 9 | 5.5% |
| $25,000 to $34,999 | 15 | 9.1% |
| $35,000 to $49,999 | 20 | 12.2% |
| $50,000 to $74,999 | 40 | 24.4% |
| $75,000 to $99,999 | 54 | 32.9% |
| $100,000 to $149,999 | 18 | 11.0% |
| $150,000 to $199,999 | 0 | 0.0% |
| $200,000+ | 1 | 0.6% |
Household Income by Householder Age in Campbell Station
The median household income in Campbell Station is $72,083, with the highest median household income of $90,389 found in the 45 to 64 years age bracket for the primary householder. A total of 96 households (58.5%) fall into this category. Meanwhile, the 15 to 24 years age bracket for the primary householder has the lowest median household income of $0, with 4 households (2.4%) in this group.
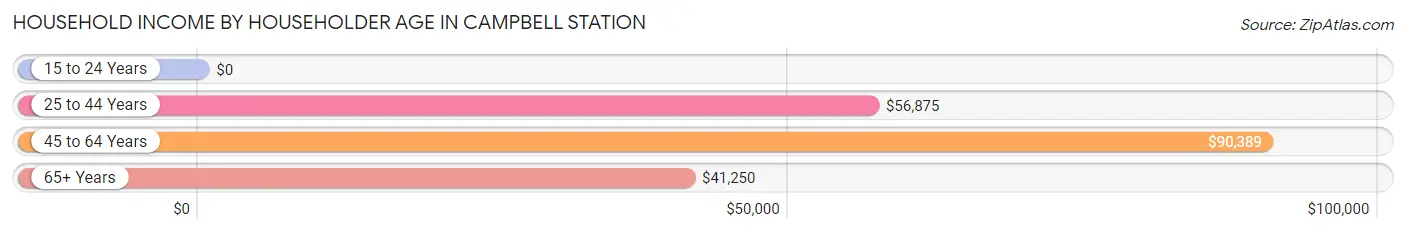
| Income Bracket | # Households | Median Income |
| 15 to 24 Years | 4 (2.4%) | $0 |
| 25 to 44 Years | 39 (23.8%) | $56,875 |
| 45 to 64 Years | 96 (58.5%) | $90,389 |
| 65+ Years | 25 (15.2%) | $41,250 |
| Total | 164 (100.0%) | $72,083 |
Poverty in Campbell Station
Income Below Poverty by Sex and Age in Campbell Station
With 9.5% poverty level for males and 9.8% for females among the residents of Campbell Station, 18 to 24 year old males and under 5 year old females are the most vulnerable to poverty, with 2 males (50.0%) and 2 females (66.7%) in their respective age groups living below the poverty level.
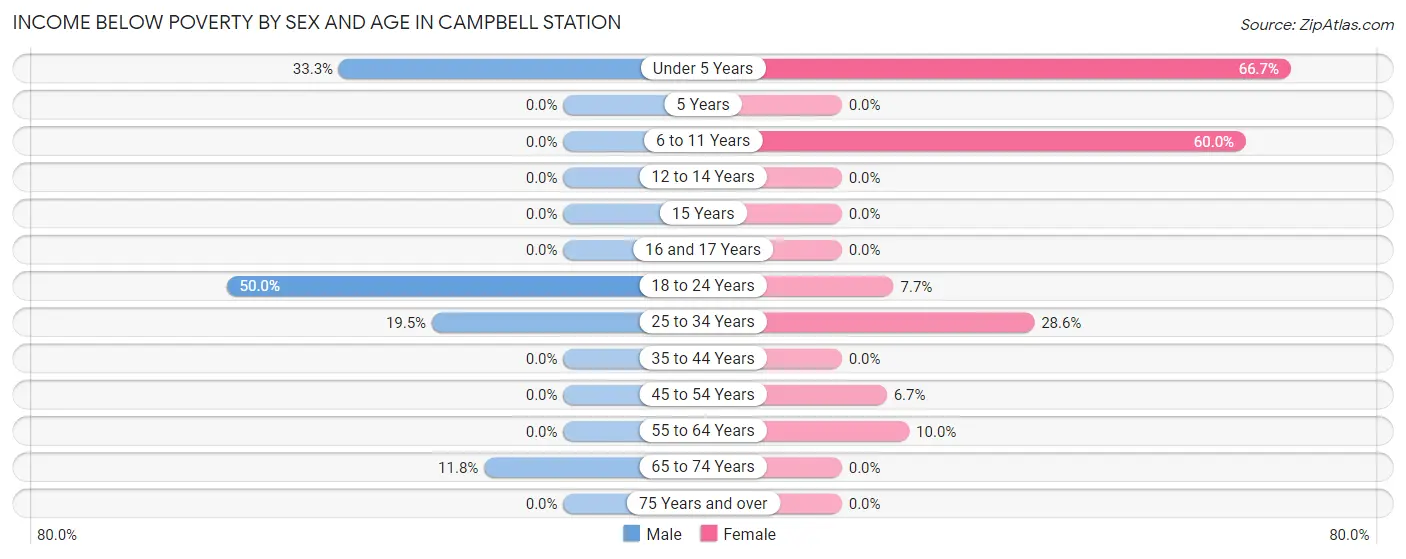
| Age Bracket | Male | Female |
| Under 5 Years | 2 (33.3%) | 2 (66.7%) |
| 5 Years | 0 (0.0%) | 0 (0.0%) |
| 6 to 11 Years | 0 (0.0%) | 3 (60.0%) |
| 12 to 14 Years | 0 (0.0%) | 0 (0.0%) |
| 15 Years | 0 (0.0%) | 0 (0.0%) |
| 16 and 17 Years | 0 (0.0%) | 0 (0.0%) |
| 18 to 24 Years | 2 (50.0%) | 2 (7.7%) |
| 25 to 34 Years | 8 (19.5%) | 2 (28.6%) |
| 35 to 44 Years | 0 (0.0%) | 0 (0.0%) |
| 45 to 54 Years | 0 (0.0%) | 4 (6.7%) |
| 55 to 64 Years | 0 (0.0%) | 3 (10.0%) |
| 65 to 74 Years | 2 (11.8%) | 0 (0.0%) |
| 75 Years and over | 0 (0.0%) | 0 (0.0%) |
| Total | 14 (9.5%) | 16 (9.8%) |
Income Above Poverty by Sex and Age in Campbell Station
According to the poverty statistics in Campbell Station, males aged 5 years and females aged 12 to 14 years are the age groups that are most secure financially, with 100.0% of males and 100.0% of females in these age groups living above the poverty line.
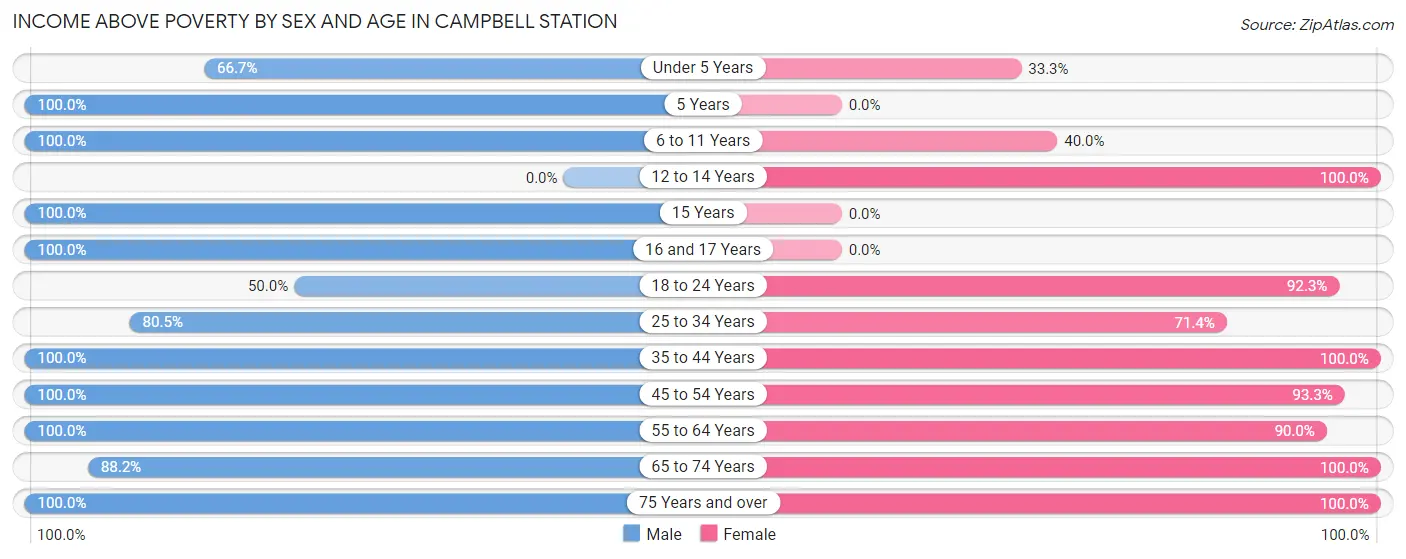
| Age Bracket | Male | Female |
| Under 5 Years | 4 (66.7%) | 1 (33.3%) |
| 5 Years | 2 (100.0%) | 0 (0.0%) |
| 6 to 11 Years | 4 (100.0%) | 2 (40.0%) |
| 12 to 14 Years | 0 (0.0%) | 4 (100.0%) |
| 15 Years | 1 (100.0%) | 0 (0.0%) |
| 16 and 17 Years | 7 (100.0%) | 0 (0.0%) |
| 18 to 24 Years | 2 (50.0%) | 24 (92.3%) |
| 25 to 34 Years | 33 (80.5%) | 5 (71.4%) |
| 35 to 44 Years | 13 (100.0%) | 7 (100.0%) |
| 45 to 54 Years | 31 (100.0%) | 56 (93.3%) |
| 55 to 64 Years | 17 (100.0%) | 27 (90.0%) |
| 65 to 74 Years | 15 (88.2%) | 9 (100.0%) |
| 75 Years and over | 5 (100.0%) | 12 (100.0%) |
| Total | 134 (90.5%) | 147 (90.2%) |
Income Below Poverty Among Married-Couple Families in Campbell Station
The poverty statistics for married-couple families in Campbell Station show that 1.5% or 1 of the total 68 families live below the poverty line. Families with no children have the highest poverty rate of 1.8%, comprising of 1 families. On the other hand, families with 1 or 2 children have the lowest poverty rate of 0.0%, which includes 0 families.
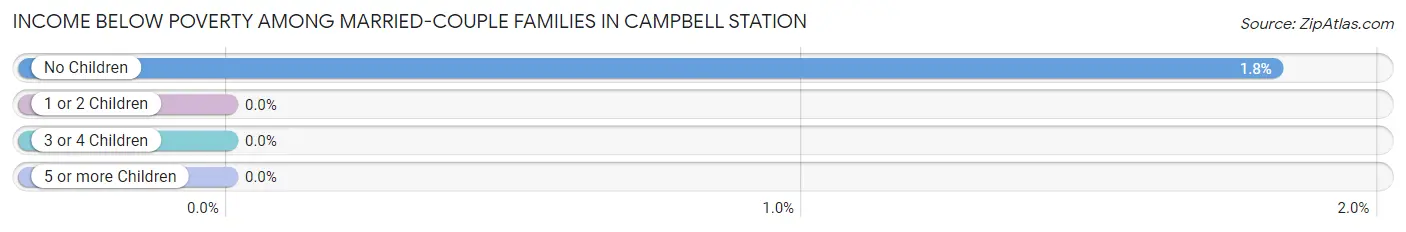
| Children | Above Poverty | Below Poverty |
| No Children | 54 (98.2%) | 1 (1.8%) |
| 1 or 2 Children | 11 (100.0%) | 0 (0.0%) |
| 3 or 4 Children | 2 (100.0%) | 0 (0.0%) |
| 5 or more Children | 0 (0.0%) | 0 (0.0%) |
| Total | 67 (98.5%) | 1 (1.5%) |
Income Below Poverty Among Single-Parent Households in Campbell Station
According to the poverty data in Campbell Station, 22.7% or 5 single-father households and 33.3% or 2 single-mother households are living below the poverty line. Among single-father households, those with 3 or 4 children have the highest poverty rate, with 5 households (100.0%) experiencing poverty. Likewise, among single-mother households, those with no children have the highest poverty rate, with 2 households (40.0%) falling below the poverty line.
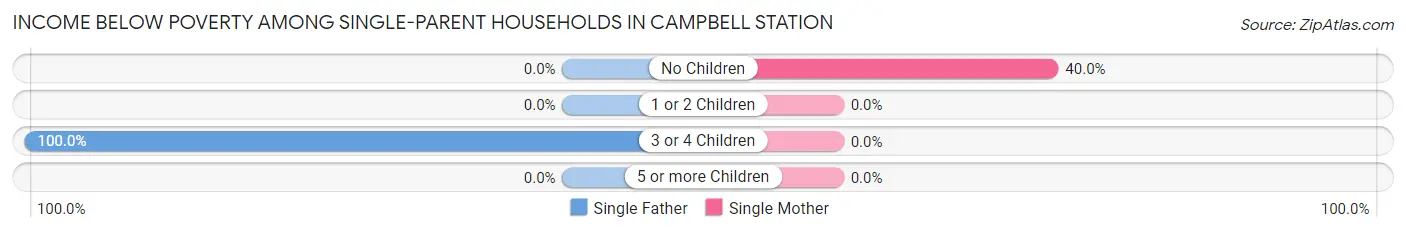
| Children | Single Father | Single Mother |
| No Children | 0 (0.0%) | 2 (40.0%) |
| 1 or 2 Children | 0 (0.0%) | 0 (0.0%) |
| 3 or 4 Children | 5 (100.0%) | 0 (0.0%) |
| 5 or more Children | 0 (0.0%) | 0 (0.0%) |
| Total | 5 (22.7%) | 2 (33.3%) |
Income Below Poverty Among Married-Couple vs Single-Parent Households in Campbell Station
The poverty data for Campbell Station shows that 1 of the married-couple family households (1.5%) and 7 of the single-parent households (25.0%) are living below the poverty level. Within the married-couple family households, those with no children have the highest poverty rate, with 1 households (1.8%) falling below the poverty line. Among the single-parent households, those with 3 or 4 children have the highest poverty rate, with 5 household (100.0%) living below poverty.
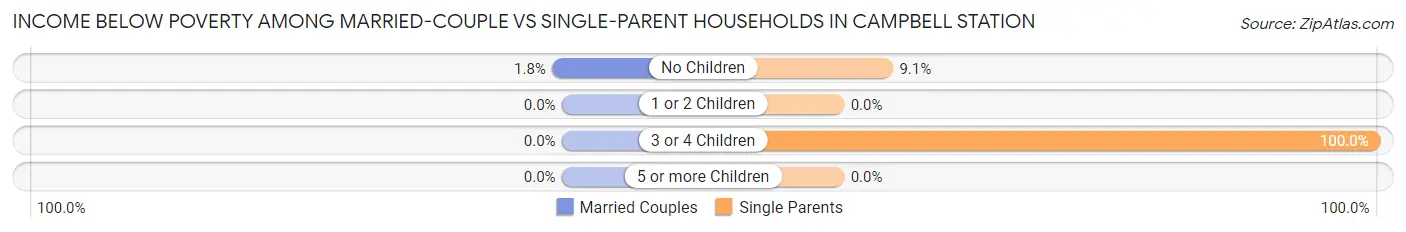
| Children | Married-Couple Families | Single-Parent Households |
| No Children | 1 (1.8%) | 2 (9.1%) |
| 1 or 2 Children | 0 (0.0%) | 0 (0.0%) |
| 3 or 4 Children | 0 (0.0%) | 5 (100.0%) |
| 5 or more Children | 0 (0.0%) | 0 (0.0%) |
| Total | 1 (1.5%) | 7 (25.0%) |
Employment Characteristics in Campbell Station
Employment by Class of Employer in Campbell Station
Among the 207 employed individuals in Campbell Station, private company employees (108 | 52.2%), federal government employees (45 | 21.7%), and self-employed (not incorporated) (22 | 10.6%) make up the most common classes of employment.
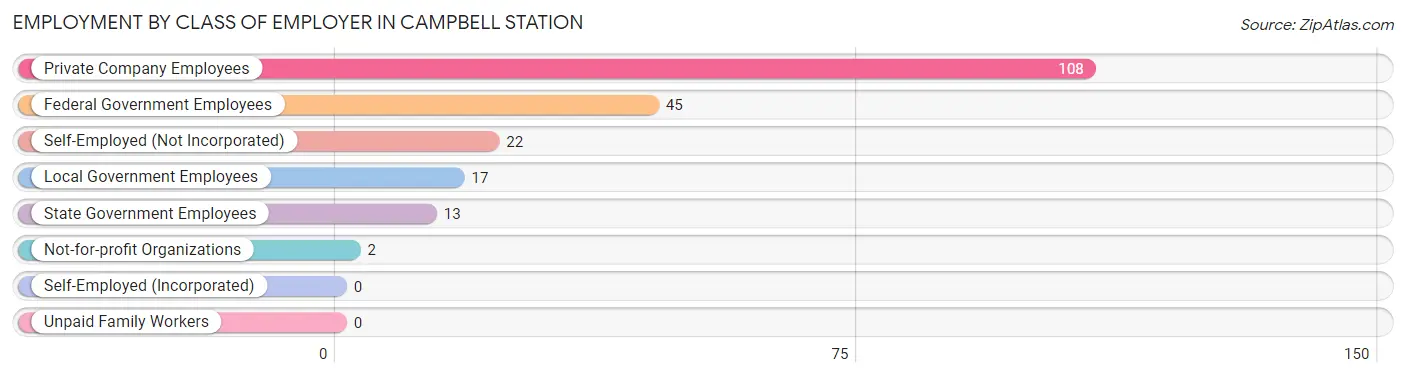
| Employer Class | # Employees | % Employees |
| Private Company Employees | 108 | 52.2% |
| Self-Employed (Incorporated) | 0 | 0.0% |
| Self-Employed (Not Incorporated) | 22 | 10.6% |
| Not-for-profit Organizations | 2 | 1.0% |
| Local Government Employees | 17 | 8.2% |
| State Government Employees | 13 | 6.3% |
| Federal Government Employees | 45 | 21.7% |
| Unpaid Family Workers | 0 | 0.0% |
| Total | 207 | 100.0% |
Employment Status by Age in Campbell Station
According to the labor force statistics for Campbell Station, out of the total population over 16 years of age (286), 76.2% or 218 individuals are in the labor force, with 5.0% or 11 of them unemployed. The age group with the highest labor force participation rate is 55 to 59 years, with 92.9% or 26 individuals in the labor force. Within the labor force, the 16 to 19 years age range has the highest percentage of unemployed individuals, with 100.0% or 1 of them being unemployed.
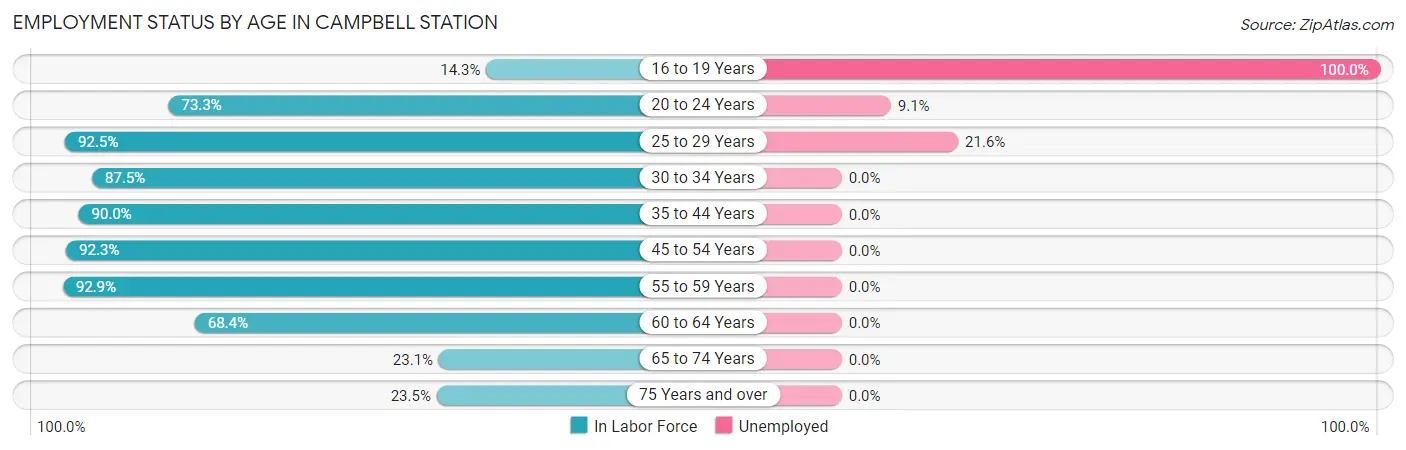
| Age Bracket | In Labor Force | Unemployed |
| 16 to 19 Years | 1 (14.3%) | 1 (100.0%) |
| 20 to 24 Years | 22 (73.3%) | 2 (9.1%) |
| 25 to 29 Years | 37 (92.5%) | 8 (21.6%) |
| 30 to 34 Years | 7 (87.5%) | 0 (0.0%) |
| 35 to 44 Years | 18 (90.0%) | 0 (0.0%) |
| 45 to 54 Years | 84 (92.3%) | 0 (0.0%) |
| 55 to 59 Years | 26 (92.9%) | 0 (0.0%) |
| 60 to 64 Years | 13 (68.4%) | 0 (0.0%) |
| 65 to 74 Years | 6 (23.1%) | 0 (0.0%) |
| 75 Years and over | 4 (23.5%) | 0 (0.0%) |
| Total | 218 (76.2%) | 11 (5.0%) |
Employment Status by Educational Attainment in Campbell Station
According to labor force statistics for Campbell Station, 89.8% of individuals (185) out of the total population between 25 and 64 years of age (206) are in the labor force, with 4.3% or 8 of them being unemployed. The group with the highest labor force participation rate are those with the educational attainment of bachelor's degree or higher, with 100.0% or 14 individuals in the labor force. Within the labor force, individuals with less than high school education have the highest percentage of unemployment, with 23.1% or 3 of them being unemployed.
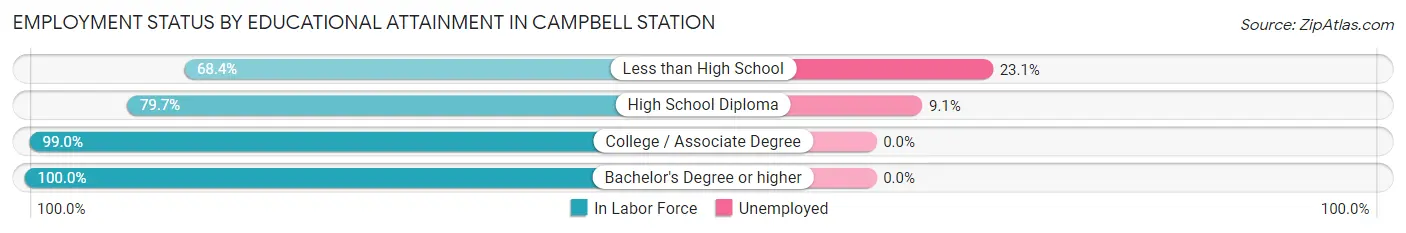
| Educational Attainment | In Labor Force | Unemployed |
| Less than High School | 13 (68.4%) | 4 (23.1%) |
| High School Diploma | 55 (79.7%) | 6 (9.1%) |
| College / Associate Degree | 103 (99.0%) | 0 (0.0%) |
| Bachelor's Degree or higher | 14 (100.0%) | 0 (0.0%) |
| Total | 185 (89.8%) | 9 (4.3%) |
Employment Occupations by Sex in Campbell Station
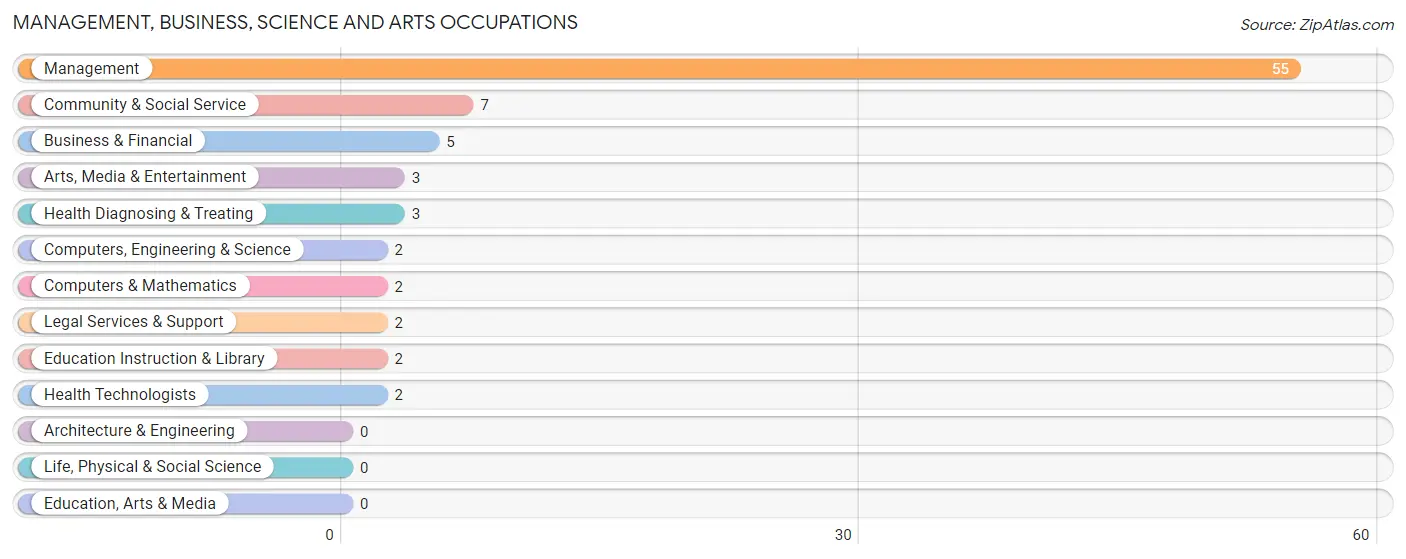
Management, Business, Science and Arts Occupations
The most common Management, Business, Science and Arts occupations in Campbell Station are Management (55 | 26.6%), Community & Social Service (7 | 3.4%), Business & Financial (5 | 2.4%), Arts, Media & Entertainment (3 | 1.5%), and Health Diagnosing & Treating (3 | 1.5%).
Management, Business, Science and Arts Occupations by Sex
Within the Management, Business, Science and Arts occupations in Campbell Station, the most male-oriented occupations are Computers, Engineering & Science (100.0%), Computers & Mathematics (100.0%), and Health Technologists (50.0%), while the most female-oriented occupations are Business & Financial (100.0%), Community & Social Service (100.0%), and Legal Services & Support (100.0%).
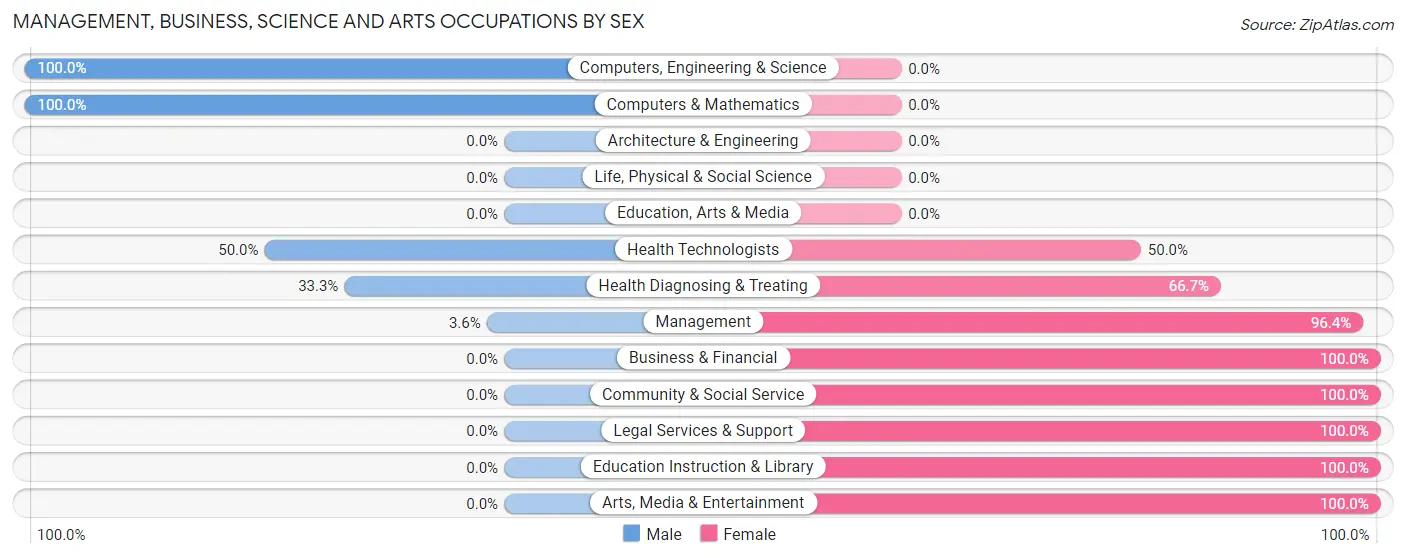
| Occupation | Male | Female |
| Management | 2 (3.6%) | 53 (96.4%) |
| Business & Financial | 0 (0.0%) | 5 (100.0%) |
| Computers, Engineering & Science | 2 (100.0%) | 0 (0.0%) |
| Computers & Mathematics | 2 (100.0%) | 0 (0.0%) |
| Architecture & Engineering | 0 (0.0%) | 0 (0.0%) |
| Life, Physical & Social Science | 0 (0.0%) | 0 (0.0%) |
| Community & Social Service | 0 (0.0%) | 7 (100.0%) |
| Education, Arts & Media | 0 (0.0%) | 0 (0.0%) |
| Legal Services & Support | 0 (0.0%) | 2 (100.0%) |
| Education Instruction & Library | 0 (0.0%) | 2 (100.0%) |
| Arts, Media & Entertainment | 0 (0.0%) | 3 (100.0%) |
| Health Diagnosing & Treating | 1 (33.3%) | 2 (66.7%) |
| Health Technologists | 1 (50.0%) | 1 (50.0%) |
| Total (Category) | 5 (6.9%) | 67 (93.1%) |
| Total (Overall) | 94 (45.4%) | 113 (54.6%) |
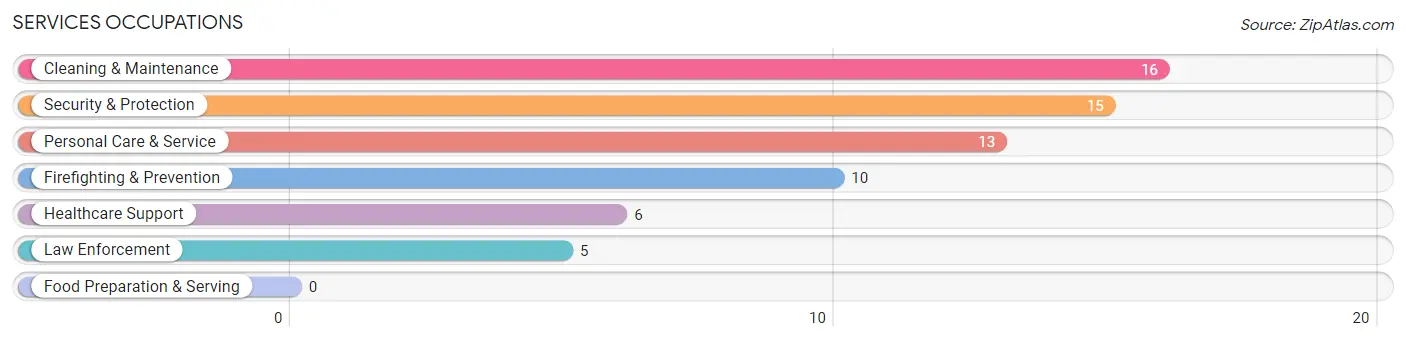
Services Occupations
The most common Services occupations in Campbell Station are Cleaning & Maintenance (16 | 7.7%), Security & Protection (15 | 7.2%), Personal Care & Service (13 | 6.3%), Firefighting & Prevention (10 | 4.8%), and Healthcare Support (6 | 2.9%).
Services Occupations by Sex
Within the Services occupations in Campbell Station, the most male-oriented occupations are Firefighting & Prevention (100.0%), Cleaning & Maintenance (100.0%), and Security & Protection (80.0%), while the most female-oriented occupations are Healthcare Support (100.0%), Personal Care & Service (61.5%), and Law Enforcement (60.0%).
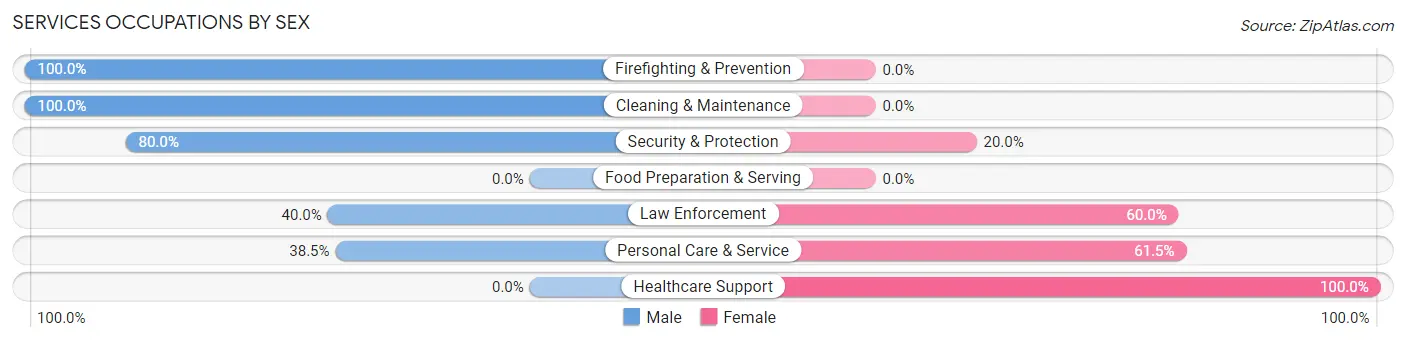
| Occupation | Male | Female |
| Healthcare Support | 0 (0.0%) | 6 (100.0%) |
| Security & Protection | 12 (80.0%) | 3 (20.0%) |
| Firefighting & Prevention | 10 (100.0%) | 0 (0.0%) |
| Law Enforcement | 2 (40.0%) | 3 (60.0%) |
| Food Preparation & Serving | 0 (0.0%) | 0 (0.0%) |
| Cleaning & Maintenance | 16 (100.0%) | 0 (0.0%) |
| Personal Care & Service | 5 (38.5%) | 8 (61.5%) |
| Total (Category) | 33 (66.0%) | 17 (34.0%) |
| Total (Overall) | 94 (45.4%) | 113 (54.6%) |
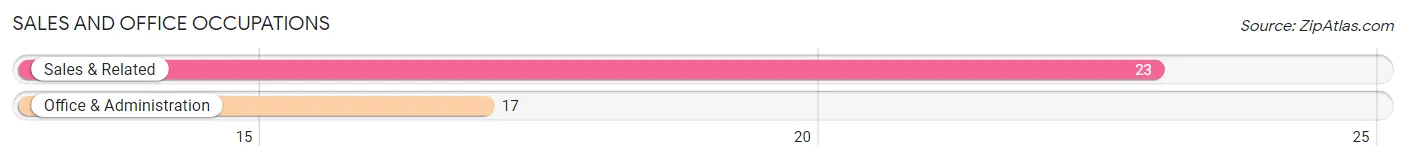
Sales and Office Occupations
The most common Sales and Office occupations in Campbell Station are Sales & Related (23 | 11.1%), and Office & Administration (17 | 8.2%).
Sales and Office Occupations by Sex
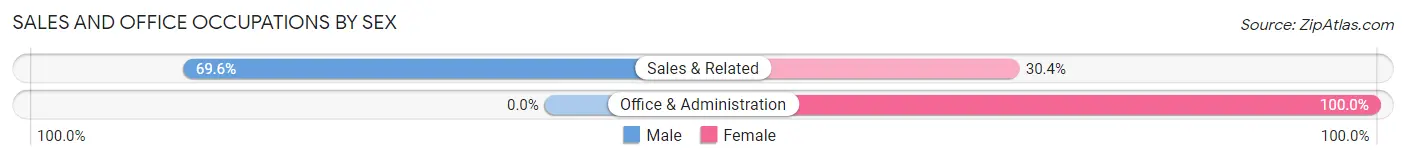
| Occupation | Male | Female |
| Sales & Related | 16 (69.6%) | 7 (30.4%) |
| Office & Administration | 0 (0.0%) | 17 (100.0%) |
| Total (Category) | 16 (40.0%) | 24 (60.0%) |
| Total (Overall) | 94 (45.4%) | 113 (54.6%) |
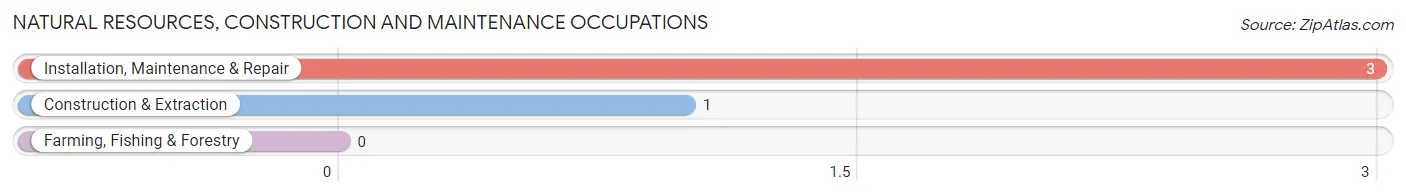
Natural Resources, Construction and Maintenance Occupations
The most common Natural Resources, Construction and Maintenance occupations in Campbell Station are Installation, Maintenance & Repair (3 | 1.5%), and Construction & Extraction (1 | 0.5%).
Natural Resources, Construction and Maintenance Occupations by Sex
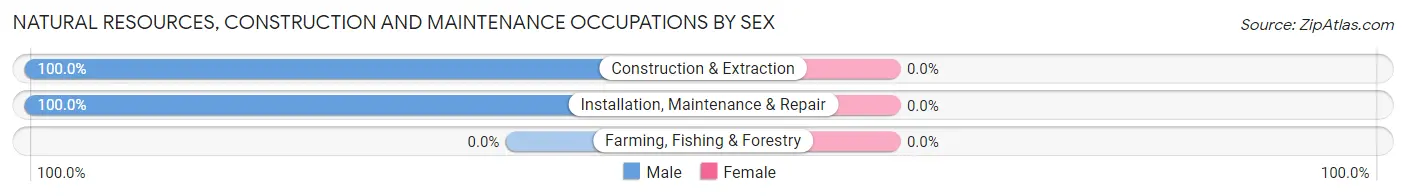
| Occupation | Male | Female |
| Farming, Fishing & Forestry | 0 (0.0%) | 0 (0.0%) |
| Construction & Extraction | 1 (100.0%) | 0 (0.0%) |
| Installation, Maintenance & Repair | 3 (100.0%) | 0 (0.0%) |
| Total (Category) | 4 (100.0%) | 0 (0.0%) |
| Total (Overall) | 94 (45.4%) | 113 (54.6%) |
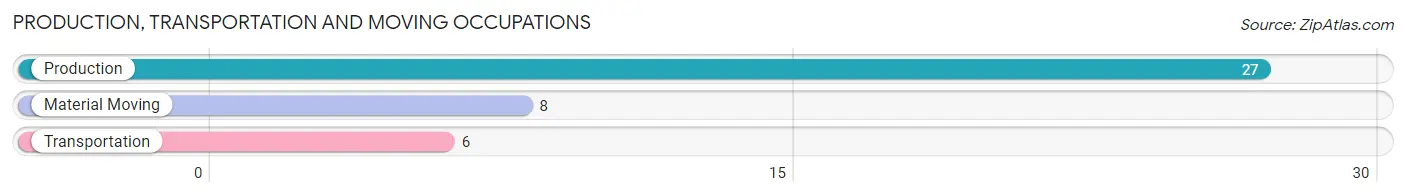
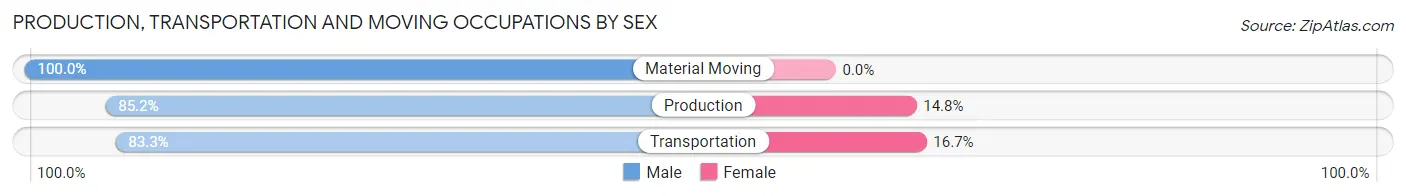
Production, Transportation and Moving Occupations
The most common Production, Transportation and Moving occupations in Campbell Station are Production (27 | 13.0%), Material Moving (8 | 3.9%), and Transportation (6 | 2.9%).
Production, Transportation and Moving Occupations by Sex
| Occupation | Male | Female |
| Production | 23 (85.2%) | 4 (14.8%) |
| Transportation | 5 (83.3%) | 1 (16.7%) |
| Material Moving | 8 (100.0%) | 0 (0.0%) |
| Total (Category) | 36 (87.8%) | 5 (12.2%) |
| Total (Overall) | 94 (45.4%) | 113 (54.6%) |
Employment Industries by Sex in Campbell Station
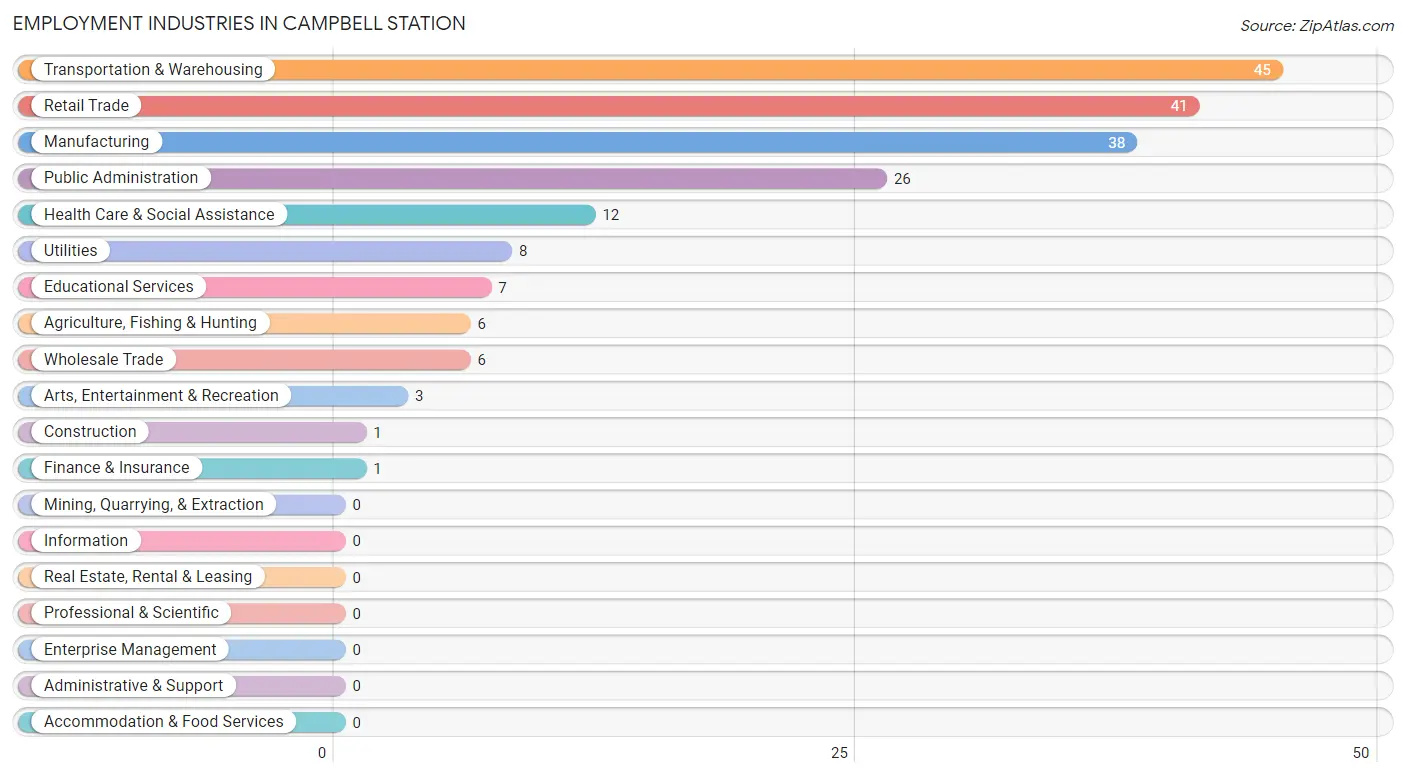
Employment Industries in Campbell Station
The major employment industries in Campbell Station include Transportation & Warehousing (45 | 21.7%), Retail Trade (41 | 19.8%), Manufacturing (38 | 18.4%), Public Administration (26 | 12.6%), and Health Care & Social Assistance (12 | 5.8%).
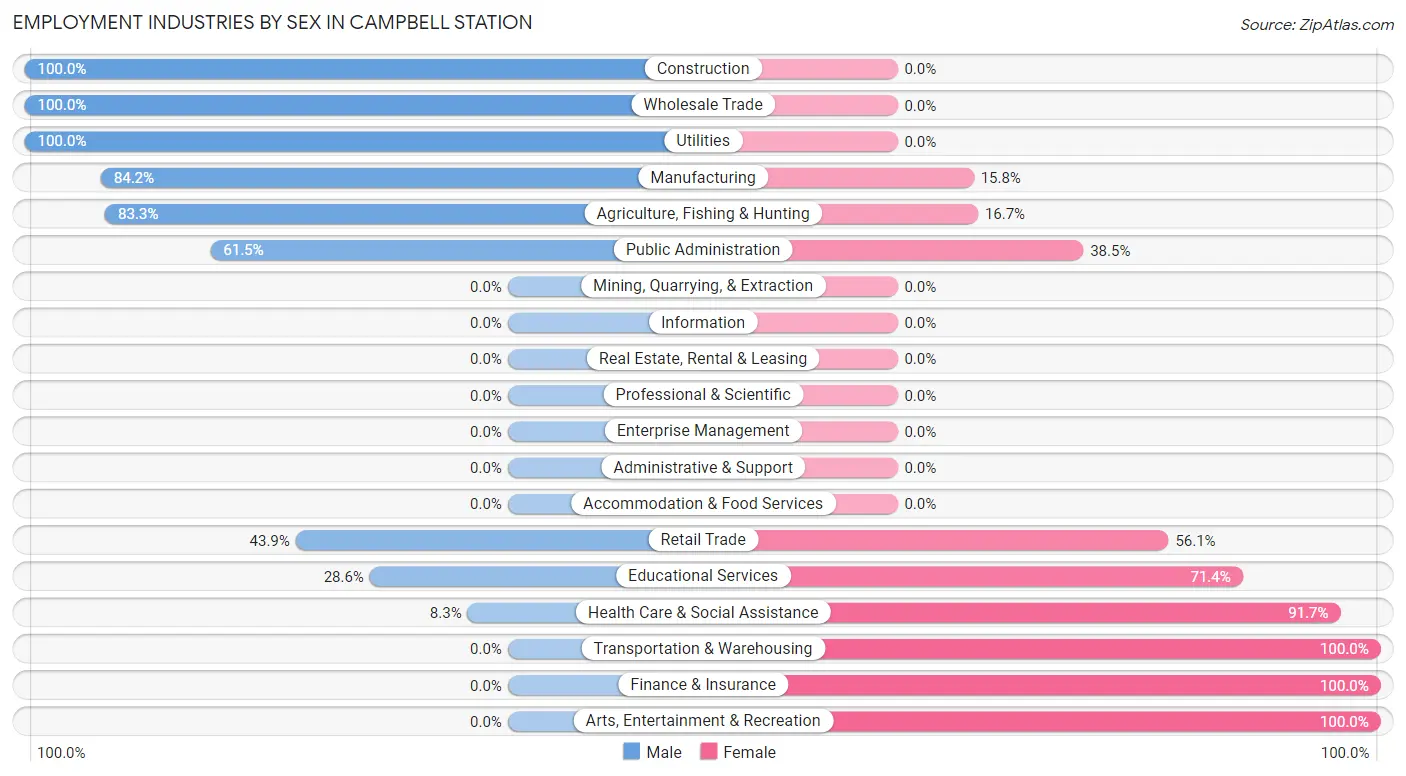
Employment Industries by Sex in Campbell Station
The Campbell Station industries that see more men than women are Construction (100.0%), Wholesale Trade (100.0%), and Utilities (100.0%), whereas the industries that tend to have a higher number of women are Transportation & Warehousing (100.0%), Finance & Insurance (100.0%), and Arts, Entertainment & Recreation (100.0%).
| Industry | Male | Female |
| Agriculture, Fishing & Hunting | 5 (83.3%) | 1 (16.7%) |
| Mining, Quarrying, & Extraction | 0 (0.0%) | 0 (0.0%) |
| Construction | 1 (100.0%) | 0 (0.0%) |
| Manufacturing | 32 (84.2%) | 6 (15.8%) |
| Wholesale Trade | 6 (100.0%) | 0 (0.0%) |
| Retail Trade | 18 (43.9%) | 23 (56.1%) |
| Transportation & Warehousing | 0 (0.0%) | 45 (100.0%) |
| Utilities | 8 (100.0%) | 0 (0.0%) |
| Information | 0 (0.0%) | 0 (0.0%) |
| Finance & Insurance | 0 (0.0%) | 1 (100.0%) |
| Real Estate, Rental & Leasing | 0 (0.0%) | 0 (0.0%) |
| Professional & Scientific | 0 (0.0%) | 0 (0.0%) |
| Enterprise Management | 0 (0.0%) | 0 (0.0%) |
| Administrative & Support | 0 (0.0%) | 0 (0.0%) |
| Educational Services | 2 (28.6%) | 5 (71.4%) |
| Health Care & Social Assistance | 1 (8.3%) | 11 (91.7%) |
| Arts, Entertainment & Recreation | 0 (0.0%) | 3 (100.0%) |
| Accommodation & Food Services | 0 (0.0%) | 0 (0.0%) |
| Public Administration | 16 (61.5%) | 10 (38.5%) |
| Total | 94 (45.4%) | 113 (54.6%) |
Education in Campbell Station
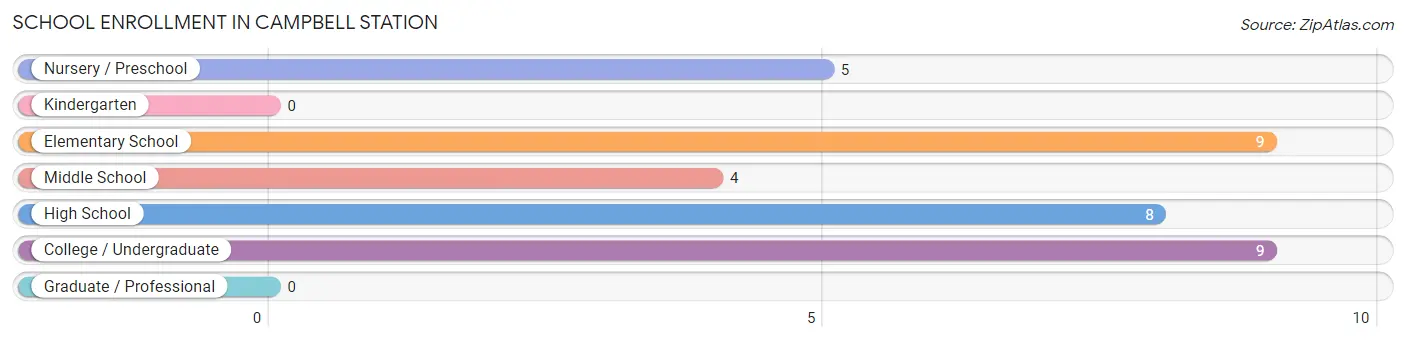
School Enrollment in Campbell Station
The most common levels of schooling among the 35 students in Campbell Station are elementary school (9 | 25.7%), college / undergraduate (9 | 25.7%), and high school (8 | 22.9%).
| School Level | # Students | % Students |
| Nursery / Preschool | 5 | 14.3% |
| Kindergarten | 0 | 0.0% |
| Elementary School | 9 | 25.7% |
| Middle School | 4 | 11.4% |
| High School | 8 | 22.9% |
| College / Undergraduate | 9 | 25.7% |
| Graduate / Professional | 0 | 0.0% |
| Total | 35 | 100.0% |
School Enrollment by Age by Funding Source in Campbell Station
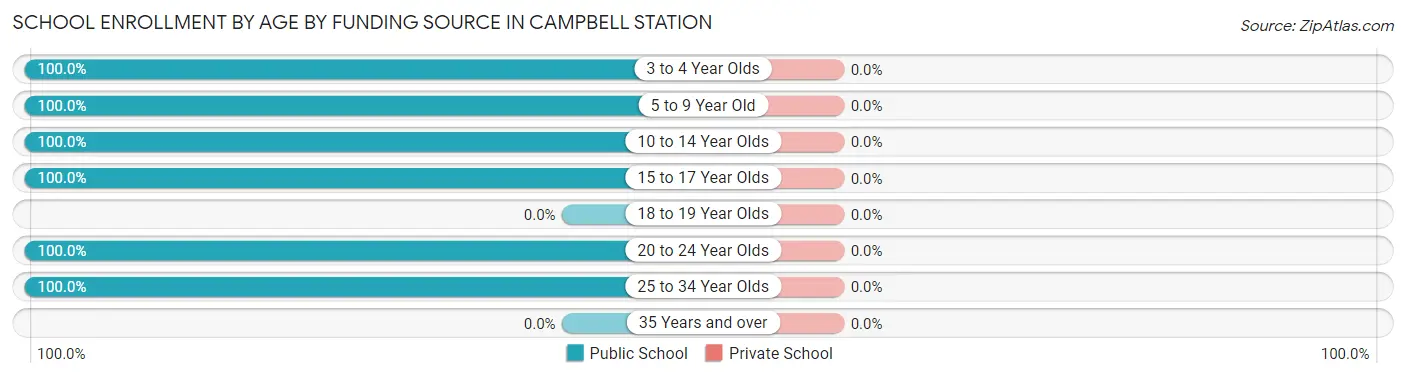
| Age Bracket | Public School | Private School |
| 3 to 4 Year Olds | 3 (100.0%) | 0 (0.0%) |
| 5 to 9 Year Old | 10 (100.0%) | 0 (0.0%) |
| 10 to 14 Year Olds | 5 (100.0%) | 0 (0.0%) |
| 15 to 17 Year Olds | 8 (100.0%) | 0 (0.0%) |
| 18 to 19 Year Olds | 0 (0.0%) | 0 (0.0%) |
| 20 to 24 Year Olds | 8 (100.0%) | 0 (0.0%) |
| 25 to 34 Year Olds | 1 (100.0%) | 0 (0.0%) |
| 35 Years and over | 0 (0.0%) | 0 (0.0%) |
| Total | 35 (100.0%) | 0 (0.0%) |
Educational Attainment by Field of Study in Campbell Station
Business (12 | 57.1%), psychology (3 | 14.3%), education (3 | 14.3%), computers & mathematics (2 | 9.5%), and arts & humanities (1 | 4.8%) are the most common fields of study among 21 individuals in Campbell Station who have obtained a bachelor's degree or higher.
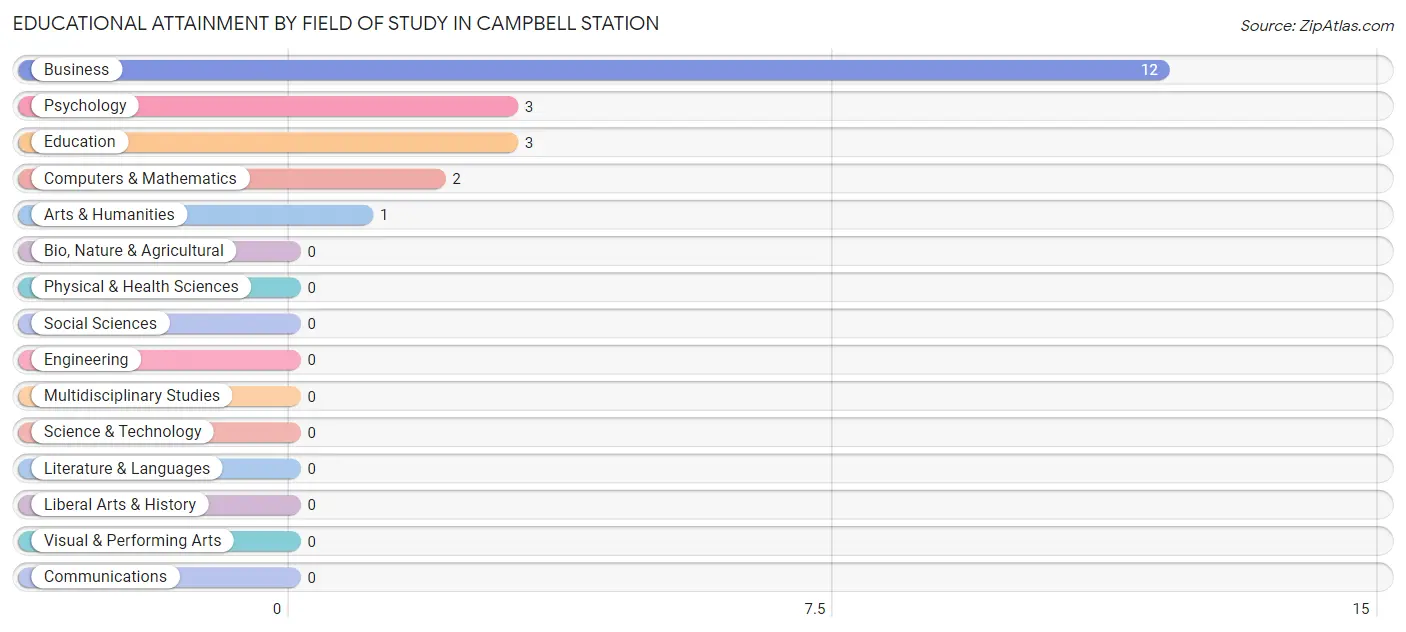
| Field of Study | # Graduates | % Graduates |
| Computers & Mathematics | 2 | 9.5% |
| Bio, Nature & Agricultural | 0 | 0.0% |
| Physical & Health Sciences | 0 | 0.0% |
| Psychology | 3 | 14.3% |
| Social Sciences | 0 | 0.0% |
| Engineering | 0 | 0.0% |
| Multidisciplinary Studies | 0 | 0.0% |
| Science & Technology | 0 | 0.0% |
| Business | 12 | 57.1% |
| Education | 3 | 14.3% |
| Literature & Languages | 0 | 0.0% |
| Liberal Arts & History | 0 | 0.0% |
| Visual & Performing Arts | 0 | 0.0% |
| Communications | 0 | 0.0% |
| Arts & Humanities | 1 | 4.8% |
| Total | 21 | 100.0% |
Transportation & Commute in Campbell Station
Vehicle Availability by Sex in Campbell Station
The most prevalent vehicle ownership categories in Campbell Station are males with 2 vehicles (64, accounting for 68.1%) and females with 2 vehicles (84, making up 56.6%).
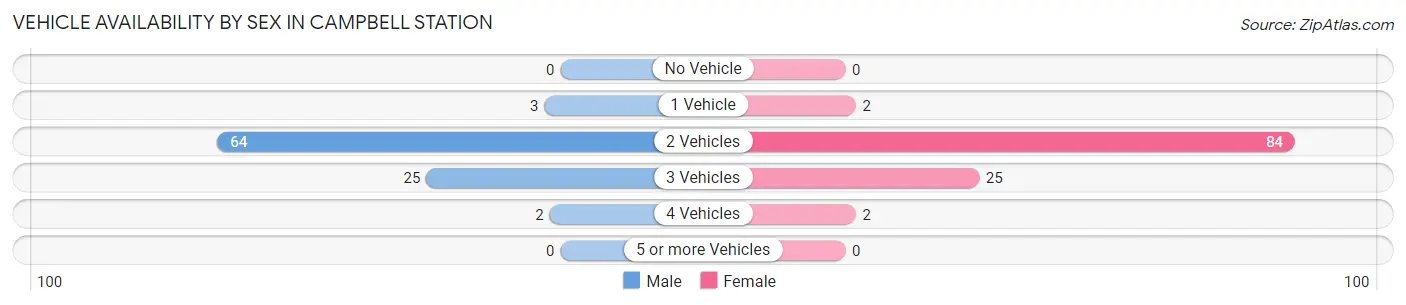
| Vehicles Available | Male | Female |
| No Vehicle | 0 (0.0%) | 0 (0.0%) |
| 1 Vehicle | 3 (3.2%) | 2 (1.8%) |
| 2 Vehicles | 64 (68.1%) | 84 (74.3%) |
| 3 Vehicles | 25 (26.6%) | 25 (22.1%) |
| 4 Vehicles | 2 (2.1%) | 2 (1.8%) |
| 5 or more Vehicles | 0 (0.0%) | 0 (0.0%) |
| Total | 94 (100.0%) | 113 (100.0%) |
Commute Time in Campbell Station
The most frequently occuring commute durations in Campbell Station are 10 to 14 minutes (56 commuters, 27.5%), 30 to 34 minutes (45 commuters, 22.1%), and 5 to 9 minutes (44 commuters, 21.6%).
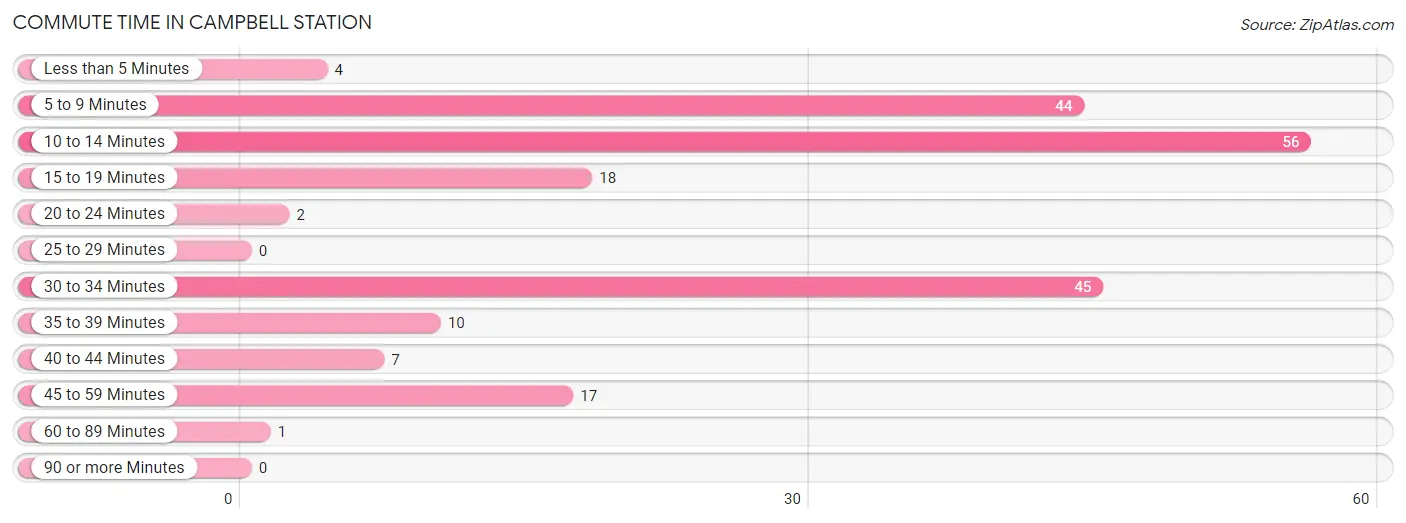
| Commute Time | # Commuters | % Commuters |
| Less than 5 Minutes | 4 | 2.0% |
| 5 to 9 Minutes | 44 | 21.6% |
| 10 to 14 Minutes | 56 | 27.5% |
| 15 to 19 Minutes | 18 | 8.8% |
| 20 to 24 Minutes | 2 | 1.0% |
| 25 to 29 Minutes | 0 | 0.0% |
| 30 to 34 Minutes | 45 | 22.1% |
| 35 to 39 Minutes | 10 | 4.9% |
| 40 to 44 Minutes | 7 | 3.4% |
| 45 to 59 Minutes | 17 | 8.3% |
| 60 to 89 Minutes | 1 | 0.5% |
| 90 or more Minutes | 0 | 0.0% |
Commute Time by Sex in Campbell Station
The most common commute times in Campbell Station are 10 to 14 minutes (38 commuters, 40.4%) for males and 30 to 34 minutes (45 commuters, 40.9%) for females.
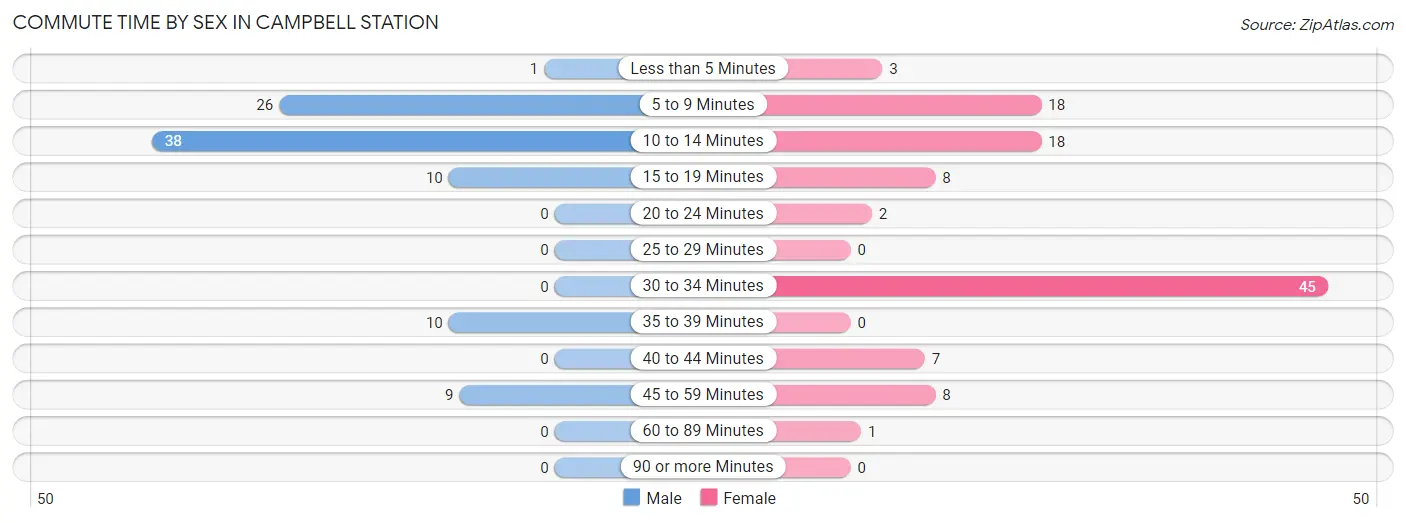
| Commute Time | Male | Female |
| Less than 5 Minutes | 1 (1.1%) | 3 (2.7%) |
| 5 to 9 Minutes | 26 (27.7%) | 18 (16.4%) |
| 10 to 14 Minutes | 38 (40.4%) | 18 (16.4%) |
| 15 to 19 Minutes | 10 (10.6%) | 8 (7.3%) |
| 20 to 24 Minutes | 0 (0.0%) | 2 (1.8%) |
| 25 to 29 Minutes | 0 (0.0%) | 0 (0.0%) |
| 30 to 34 Minutes | 0 (0.0%) | 45 (40.9%) |
| 35 to 39 Minutes | 10 (10.6%) | 0 (0.0%) |
| 40 to 44 Minutes | 0 (0.0%) | 7 (6.4%) |
| 45 to 59 Minutes | 9 (9.6%) | 8 (7.3%) |
| 60 to 89 Minutes | 0 (0.0%) | 1 (0.9%) |
| 90 or more Minutes | 0 (0.0%) | 0 (0.0%) |
Time of Departure to Work by Sex in Campbell Station
The most frequent times of departure to work in Campbell Station are 7:30 AM to 7:59 AM (18, 19.2%) for males and 9:00 AM to 9:59 AM (45, 40.9%) for females.
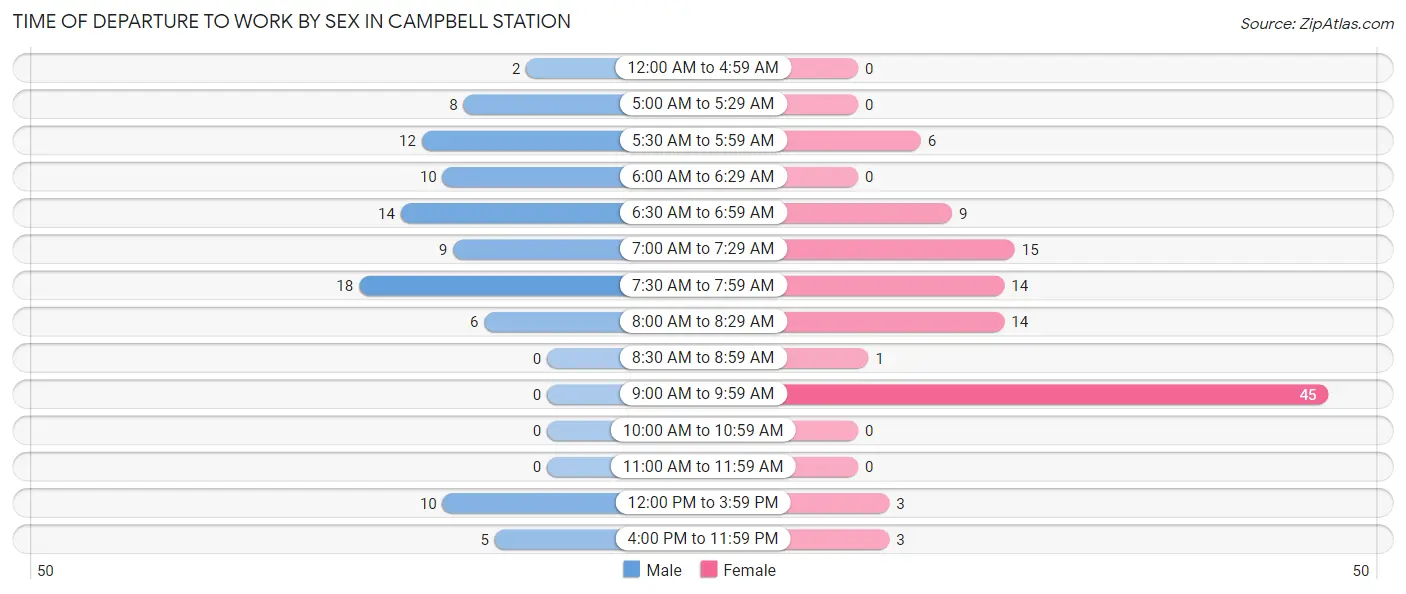
| Time of Departure | Male | Female |
| 12:00 AM to 4:59 AM | 2 (2.1%) | 0 (0.0%) |
| 5:00 AM to 5:29 AM | 8 (8.5%) | 0 (0.0%) |
| 5:30 AM to 5:59 AM | 12 (12.8%) | 6 (5.4%) |
| 6:00 AM to 6:29 AM | 10 (10.6%) | 0 (0.0%) |
| 6:30 AM to 6:59 AM | 14 (14.9%) | 9 (8.2%) |
| 7:00 AM to 7:29 AM | 9 (9.6%) | 15 (13.6%) |
| 7:30 AM to 7:59 AM | 18 (19.2%) | 14 (12.7%) |
| 8:00 AM to 8:29 AM | 6 (6.4%) | 14 (12.7%) |
| 8:30 AM to 8:59 AM | 0 (0.0%) | 1 (0.9%) |
| 9:00 AM to 9:59 AM | 0 (0.0%) | 45 (40.9%) |
| 10:00 AM to 10:59 AM | 0 (0.0%) | 0 (0.0%) |
| 11:00 AM to 11:59 AM | 0 (0.0%) | 0 (0.0%) |
| 12:00 PM to 3:59 PM | 10 (10.6%) | 3 (2.7%) |
| 4:00 PM to 11:59 PM | 5 (5.3%) | 3 (2.7%) |
| Total | 94 (100.0%) | 110 (100.0%) |
Housing Occupancy in Campbell Station
Occupancy by Ownership in Campbell Station
Of the total 164 dwellings in Campbell Station, owner-occupied units account for 157 (95.7%), while renter-occupied units make up 7 (4.3%).
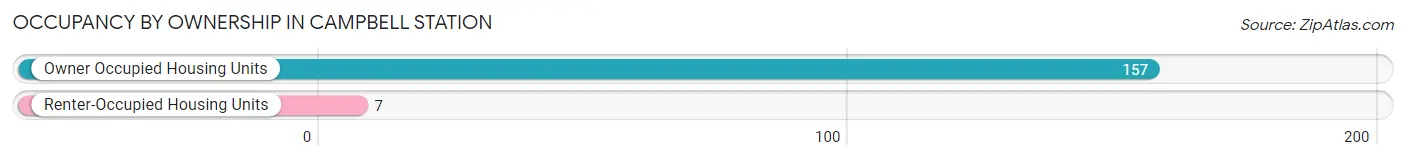
| Occupancy | # Housing Units | % Housing Units |
| Owner Occupied Housing Units | 157 | 95.7% |
| Renter-Occupied Housing Units | 7 | 4.3% |
| Total Occupied Housing Units | 164 | 100.0% |
Occupancy by Household Size in Campbell Station
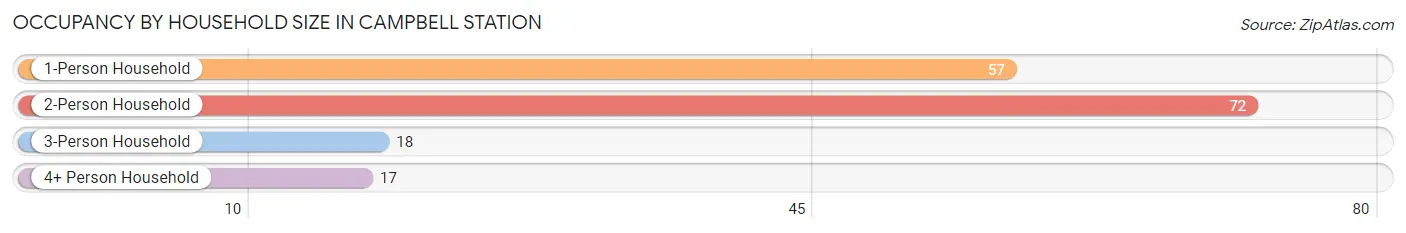
| Household Size | # Housing Units | % Housing Units |
| 1-Person Household | 57 | 34.8% |
| 2-Person Household | 72 | 43.9% |
| 3-Person Household | 18 | 11.0% |
| 4+ Person Household | 17 | 10.4% |
| Total Housing Units | 164 | 100.0% |
Occupancy by Ownership by Household Size in Campbell Station
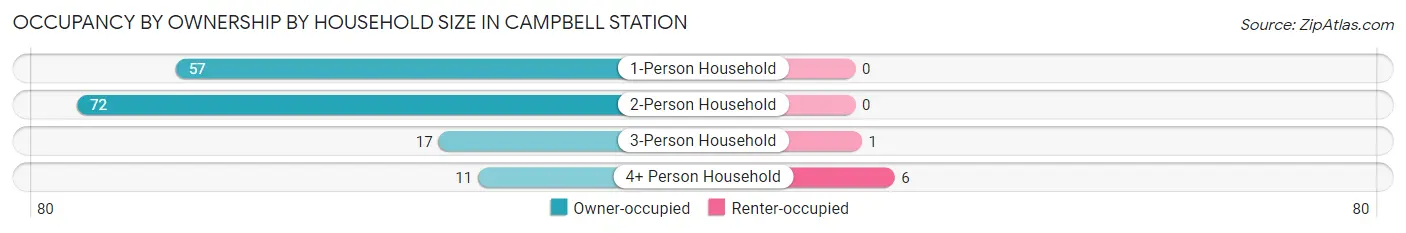
| Household Size | Owner-occupied | Renter-occupied |
| 1-Person Household | 57 (100.0%) | 0 (0.0%) |
| 2-Person Household | 72 (100.0%) | 0 (0.0%) |
| 3-Person Household | 17 (94.4%) | 1 (5.6%) |
| 4+ Person Household | 11 (64.7%) | 6 (35.3%) |
| Total Housing Units | 157 (95.7%) | 7 (4.3%) |
Occupancy by Educational Attainment in Campbell Station
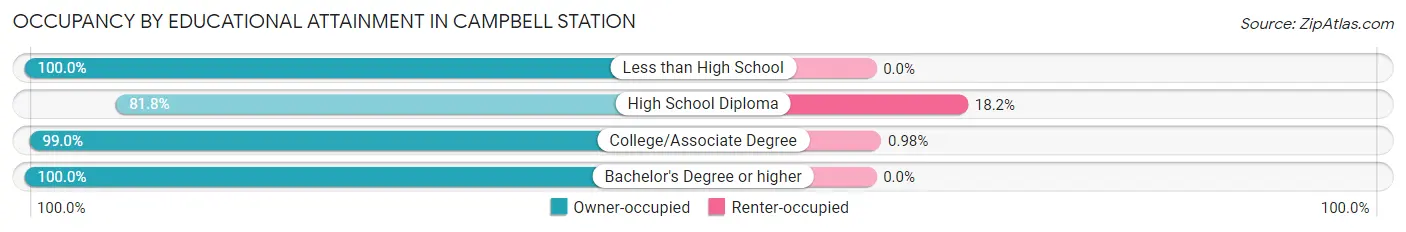
| Household Size | Owner-occupied | Renter-occupied |
| Less than High School | 13 (100.0%) | 0 (0.0%) |
| High School Diploma | 27 (81.8%) | 6 (18.2%) |
| College/Associate Degree | 101 (99.0%) | 1 (1.0%) |
| Bachelor's Degree or higher | 16 (100.0%) | 0 (0.0%) |
Occupancy by Age of Householder in Campbell Station
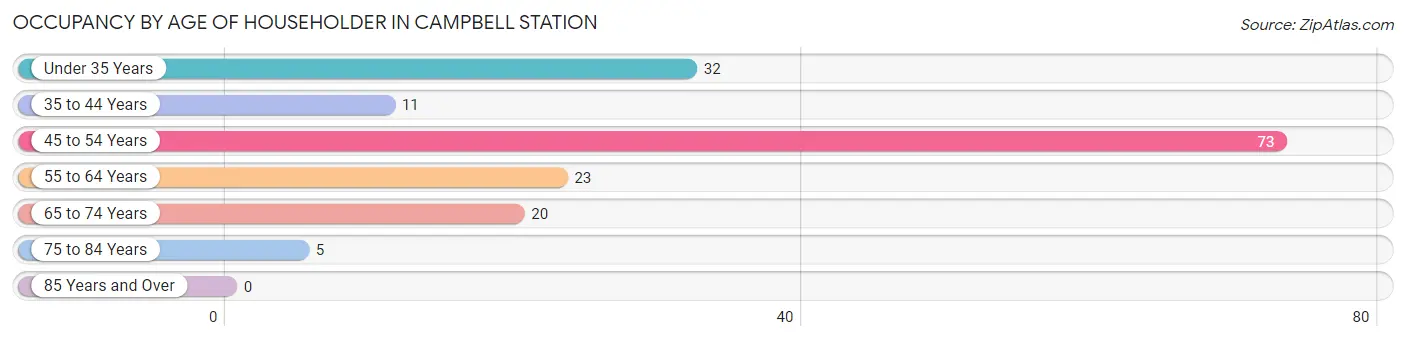
| Age Bracket | # Households | % Households |
| Under 35 Years | 32 | 19.5% |
| 35 to 44 Years | 11 | 6.7% |
| 45 to 54 Years | 73 | 44.5% |
| 55 to 64 Years | 23 | 14.0% |
| 65 to 74 Years | 20 | 12.2% |
| 75 to 84 Years | 5 | 3.0% |
| 85 Years and Over | 0 | 0.0% |
| Total | 164 | 100.0% |
Housing Finances in Campbell Station
Median Income by Occupancy in Campbell Station
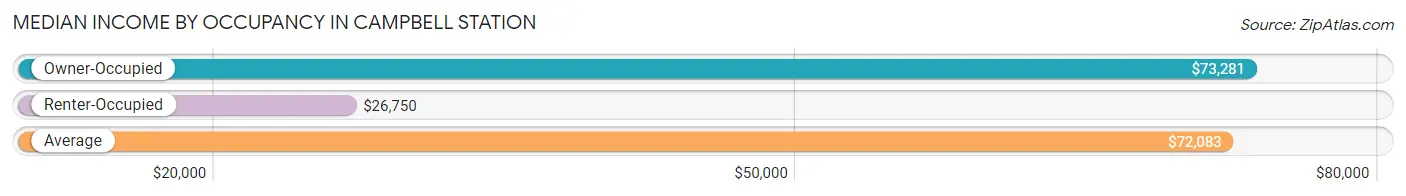
| Occupancy Type | # Households | Median Income |
| Owner-Occupied | 157 (95.7%) | $73,281 |
| Renter-Occupied | 7 (4.3%) | $26,750 |
| Average | 164 (100.0%) | $72,083 |
Occupancy by Householder Income Bracket in Campbell Station
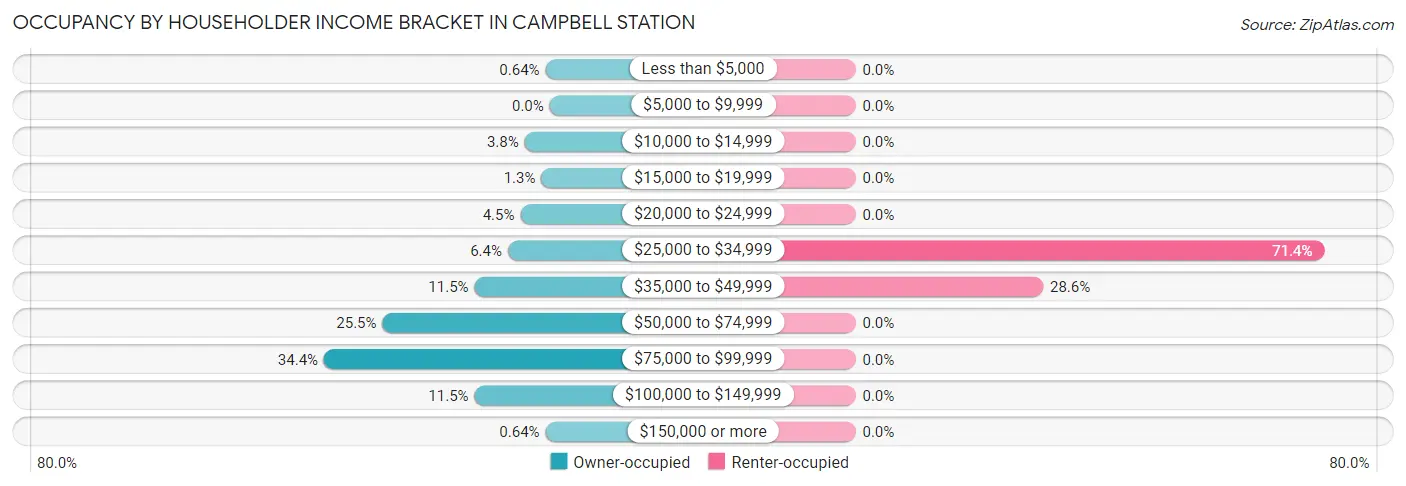
| Income Bracket | Owner-occupied | Renter-occupied |
| Less than $5,000 | 1 (0.6%) | 0 (0.0%) |
| $5,000 to $9,999 | 0 (0.0%) | 0 (0.0%) |
| $10,000 to $14,999 | 6 (3.8%) | 0 (0.0%) |
| $15,000 to $19,999 | 2 (1.3%) | 0 (0.0%) |
| $20,000 to $24,999 | 7 (4.5%) | 0 (0.0%) |
| $25,000 to $34,999 | 10 (6.4%) | 5 (71.4%) |
| $35,000 to $49,999 | 18 (11.5%) | 2 (28.6%) |
| $50,000 to $74,999 | 40 (25.5%) | 0 (0.0%) |
| $75,000 to $99,999 | 54 (34.4%) | 0 (0.0%) |
| $100,000 to $149,999 | 18 (11.5%) | 0 (0.0%) |
| $150,000 or more | 1 (0.6%) | 0 (0.0%) |
| Total | 157 (100.0%) | 7 (100.0%) |
Monthly Housing Cost Tiers in Campbell Station
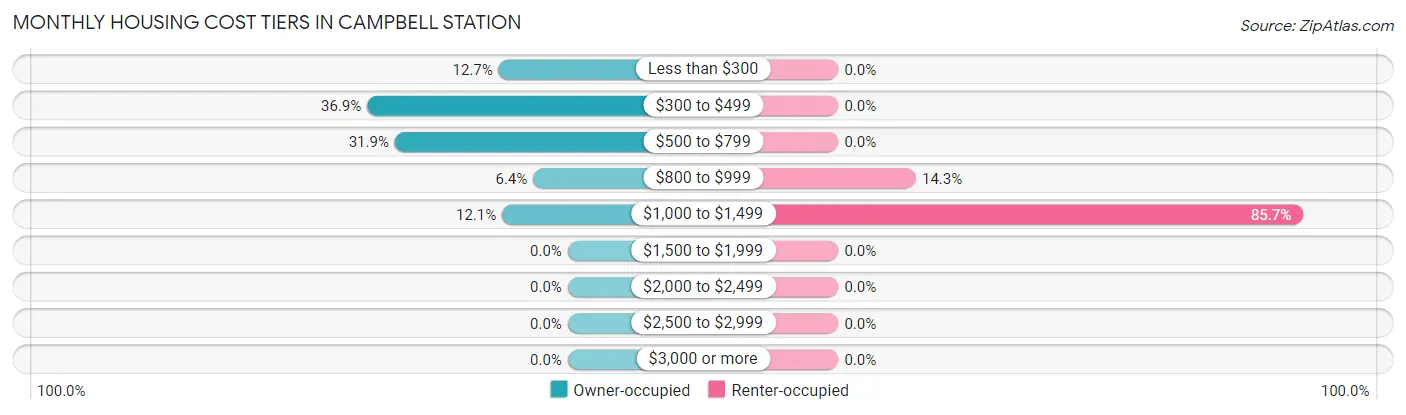
| Monthly Cost | Owner-occupied | Renter-occupied |
| Less than $300 | 20 (12.7%) | 0 (0.0%) |
| $300 to $499 | 58 (36.9%) | 0 (0.0%) |
| $500 to $799 | 50 (31.9%) | 0 (0.0%) |
| $800 to $999 | 10 (6.4%) | 1 (14.3%) |
| $1,000 to $1,499 | 19 (12.1%) | 6 (85.7%) |
| $1,500 to $1,999 | 0 (0.0%) | 0 (0.0%) |
| $2,000 to $2,499 | 0 (0.0%) | 0 (0.0%) |
| $2,500 to $2,999 | 0 (0.0%) | 0 (0.0%) |
| $3,000 or more | 0 (0.0%) | 0 (0.0%) |
| Total | 157 (100.0%) | 7 (100.0%) |
Physical Housing Characteristics in Campbell Station
Housing Structures in Campbell Station
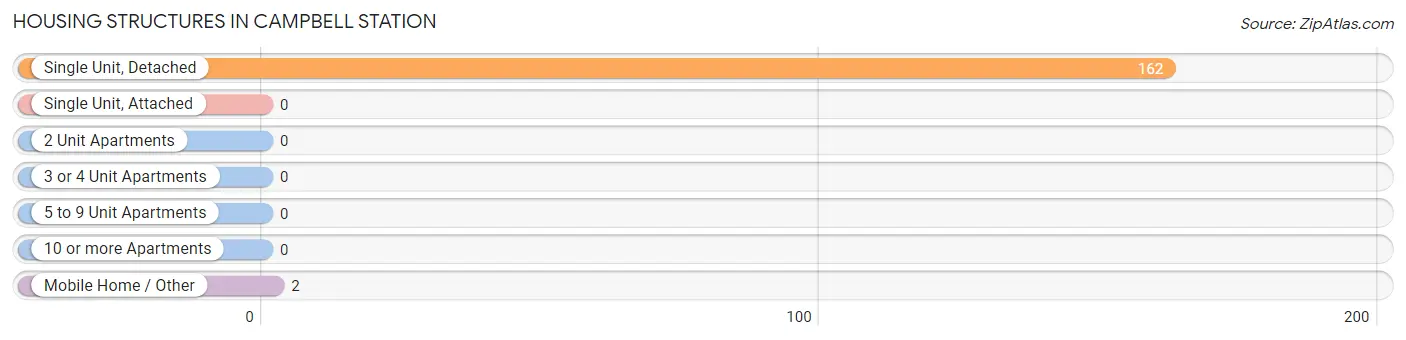
| Structure Type | # Housing Units | % Housing Units |
| Single Unit, Detached | 162 | 98.8% |
| Single Unit, Attached | 0 | 0.0% |
| 2 Unit Apartments | 0 | 0.0% |
| 3 or 4 Unit Apartments | 0 | 0.0% |
| 5 to 9 Unit Apartments | 0 | 0.0% |
| 10 or more Apartments | 0 | 0.0% |
| Mobile Home / Other | 2 | 1.2% |
| Total | 164 | 100.0% |
Housing Structures by Occupancy in Campbell Station
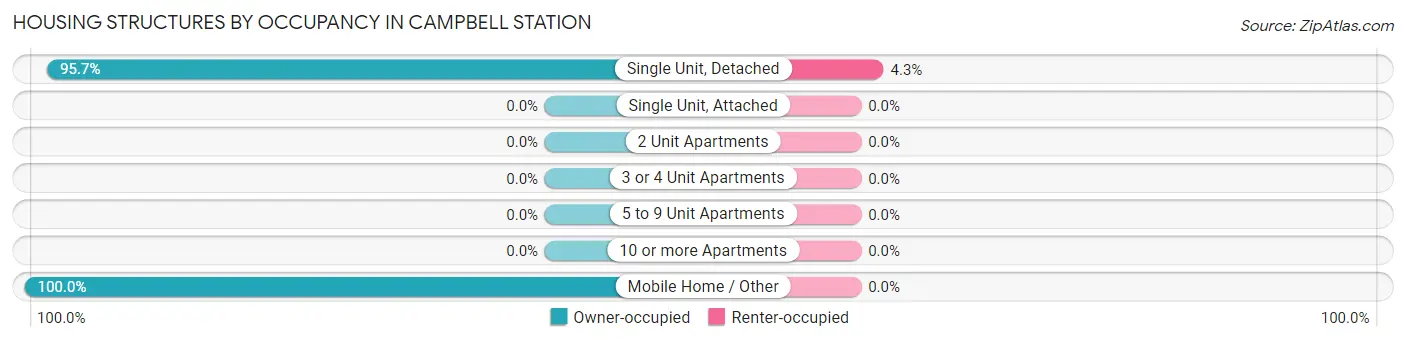
| Structure Type | Owner-occupied | Renter-occupied |
| Single Unit, Detached | 155 (95.7%) | 7 (4.3%) |
| Single Unit, Attached | 0 (0.0%) | 0 (0.0%) |
| 2 Unit Apartments | 0 (0.0%) | 0 (0.0%) |
| 3 or 4 Unit Apartments | 0 (0.0%) | 0 (0.0%) |
| 5 to 9 Unit Apartments | 0 (0.0%) | 0 (0.0%) |
| 10 or more Apartments | 0 (0.0%) | 0 (0.0%) |
| Mobile Home / Other | 2 (100.0%) | 0 (0.0%) |
| Total | 157 (95.7%) | 7 (4.3%) |
Housing Structures by Number of Rooms in Campbell Station
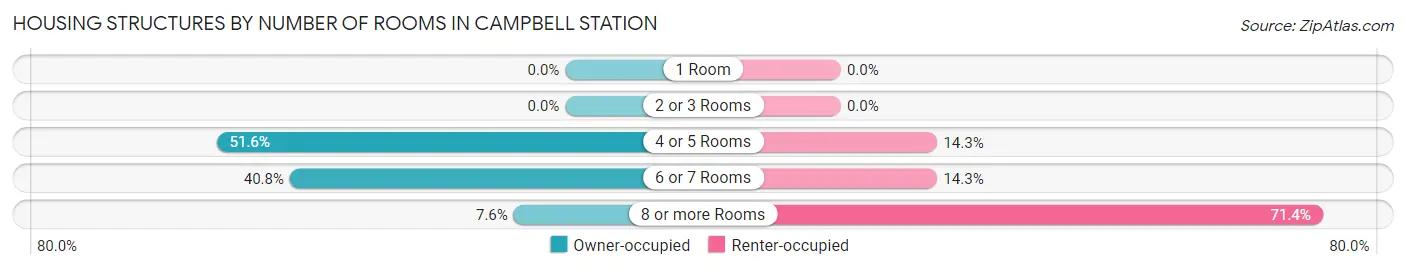
| Number of Rooms | Owner-occupied | Renter-occupied |
| 1 Room | 0 (0.0%) | 0 (0.0%) |
| 2 or 3 Rooms | 0 (0.0%) | 0 (0.0%) |
| 4 or 5 Rooms | 81 (51.6%) | 1 (14.3%) |
| 6 or 7 Rooms | 64 (40.8%) | 1 (14.3%) |
| 8 or more Rooms | 12 (7.6%) | 5 (71.4%) |
| Total | 157 (100.0%) | 7 (100.0%) |
Housing Structure by Heating Type in Campbell Station
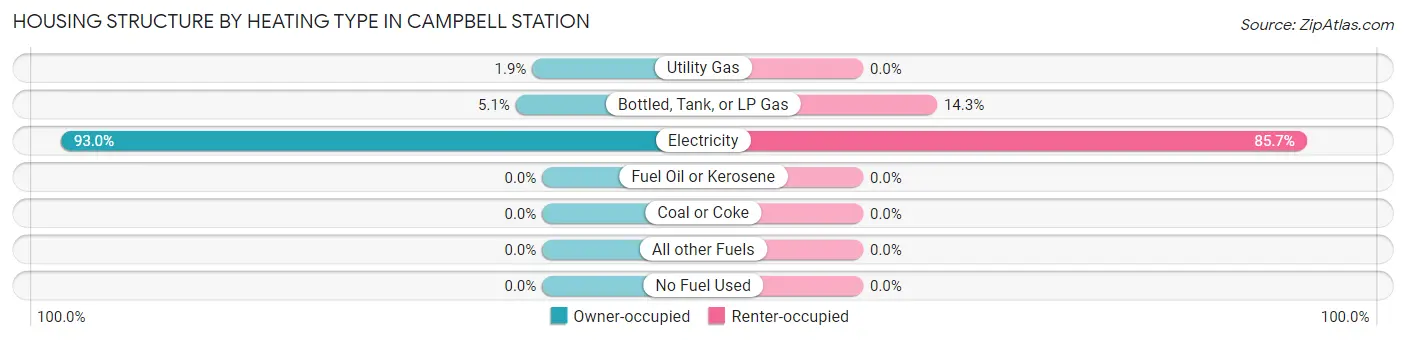
| Heating Type | Owner-occupied | Renter-occupied |
| Utility Gas | 3 (1.9%) | 0 (0.0%) |
| Bottled, Tank, or LP Gas | 8 (5.1%) | 1 (14.3%) |
| Electricity | 146 (93.0%) | 6 (85.7%) |
| Fuel Oil or Kerosene | 0 (0.0%) | 0 (0.0%) |
| Coal or Coke | 0 (0.0%) | 0 (0.0%) |
| All other Fuels | 0 (0.0%) | 0 (0.0%) |
| No Fuel Used | 0 (0.0%) | 0 (0.0%) |
| Total | 157 (100.0%) | 7 (100.0%) |
Household Vehicle Usage in Campbell Station
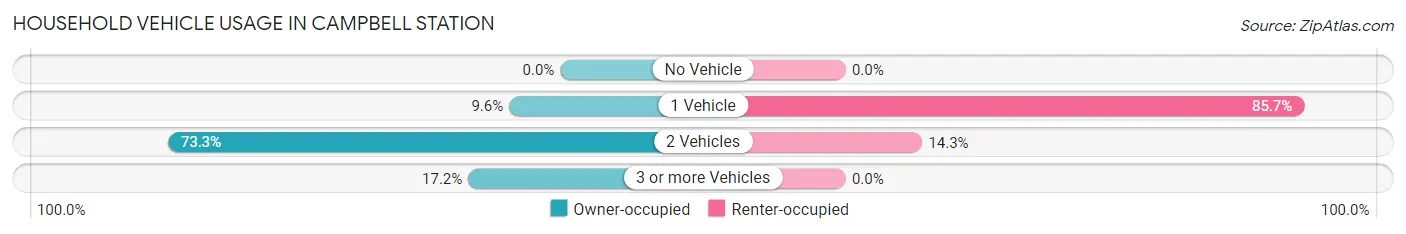
| Vehicles per Household | Owner-occupied | Renter-occupied |
| No Vehicle | 0 (0.0%) | 0 (0.0%) |
| 1 Vehicle | 15 (9.6%) | 6 (85.7%) |
| 2 Vehicles | 115 (73.3%) | 1 (14.3%) |
| 3 or more Vehicles | 27 (17.2%) | 0 (0.0%) |
| Total | 157 (100.0%) | 7 (100.0%) |
Real Estate & Mortgages in Campbell Station
Real Estate and Mortgage Overview in Campbell Station
| Characteristic | Without Mortgage | With Mortgage |
| Housing Units | 89 | 68 |
| Median Property Value | $84,900 | $90,000 |
| Median Household Income | $90,083 | $0 |
| Monthly Housing Costs | $374 | $0 |
| Real Estate Taxes | $472 | $7 |
Property Value by Mortgage Status in Campbell Station
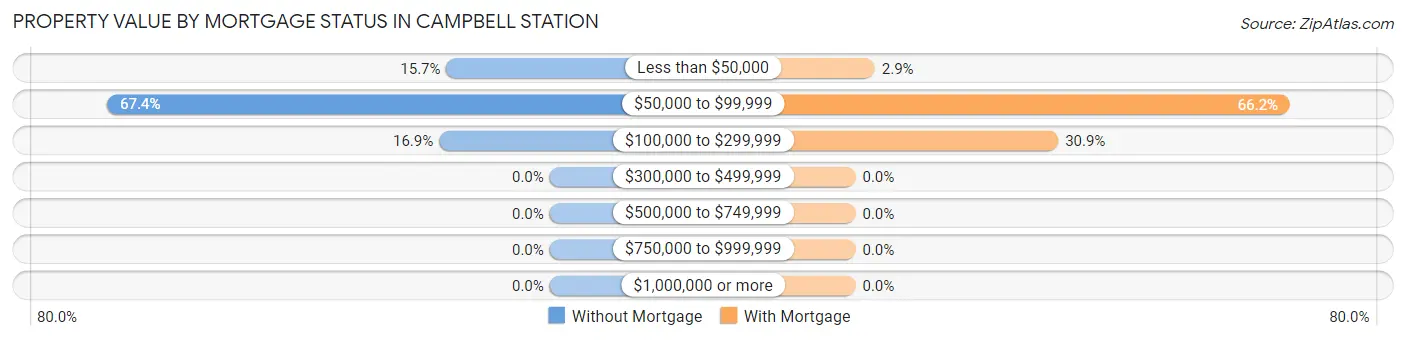
| Property Value | Without Mortgage | With Mortgage |
| Less than $50,000 | 14 (15.7%) | 2 (2.9%) |
| $50,000 to $99,999 | 60 (67.4%) | 45 (66.2%) |
| $100,000 to $299,999 | 15 (16.9%) | 21 (30.9%) |
| $300,000 to $499,999 | 0 (0.0%) | 0 (0.0%) |
| $500,000 to $749,999 | 0 (0.0%) | 0 (0.0%) |
| $750,000 to $999,999 | 0 (0.0%) | 0 (0.0%) |
| $1,000,000 or more | 0 (0.0%) | 0 (0.0%) |
| Total | 89 (100.0%) | 68 (100.0%) |
Household Income by Mortgage Status in Campbell Station
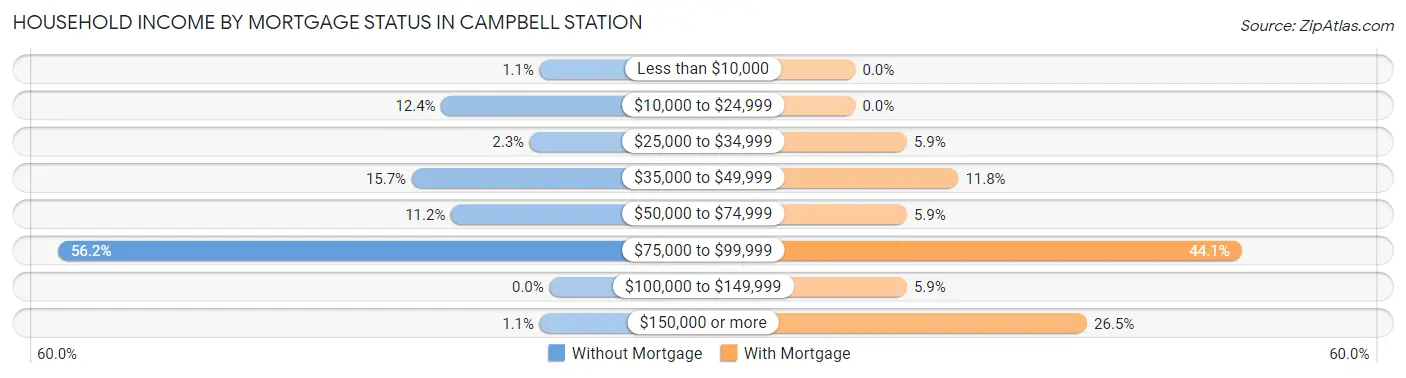
| Household Income | Without Mortgage | With Mortgage |
| Less than $10,000 | 1 (1.1%) | 0 (0.0%) |
| $10,000 to $24,999 | 11 (12.4%) | 0 (0.0%) |
| $25,000 to $34,999 | 2 (2.2%) | 4 (5.9%) |
| $35,000 to $49,999 | 14 (15.7%) | 8 (11.8%) |
| $50,000 to $74,999 | 10 (11.2%) | 4 (5.9%) |
| $75,000 to $99,999 | 50 (56.2%) | 30 (44.1%) |
| $100,000 to $149,999 | 0 (0.0%) | 4 (5.9%) |
| $150,000 or more | 1 (1.1%) | 18 (26.5%) |
| Total | 89 (100.0%) | 68 (100.0%) |
Property Value to Household Income Ratio in Campbell Station
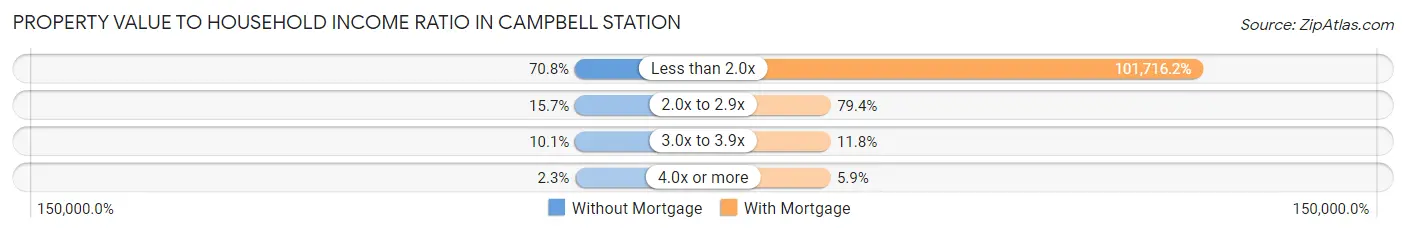
| Value-to-Income Ratio | Without Mortgage | With Mortgage |
| Less than 2.0x | 63 (70.8%) | 69,167 (101,716.2%) |
| 2.0x to 2.9x | 14 (15.7%) | 54 (79.4%) |
| 3.0x to 3.9x | 9 (10.1%) | 8 (11.8%) |
| 4.0x or more | 2 (2.2%) | 4 (5.9%) |
| Total | 89 (100.0%) | 68 (100.0%) |
Real Estate Taxes by Mortgage Status in Campbell Station
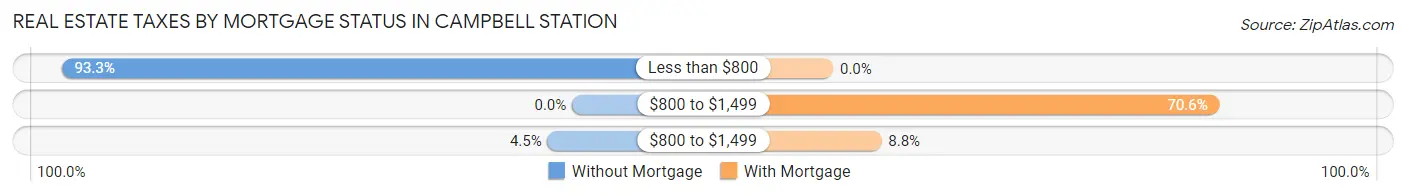
| Property Taxes | Without Mortgage | With Mortgage |
| Less than $800 | 83 (93.3%) | 0 (0.0%) |
| $800 to $1,499 | 0 (0.0%) | 48 (70.6%) |
| $800 to $1,499 | 4 (4.5%) | 6 (8.8%) |
| Total | 89 (100.0%) | 68 (100.0%) |
Health & Disability in Campbell Station
Health Insurance Coverage by Age in Campbell Station
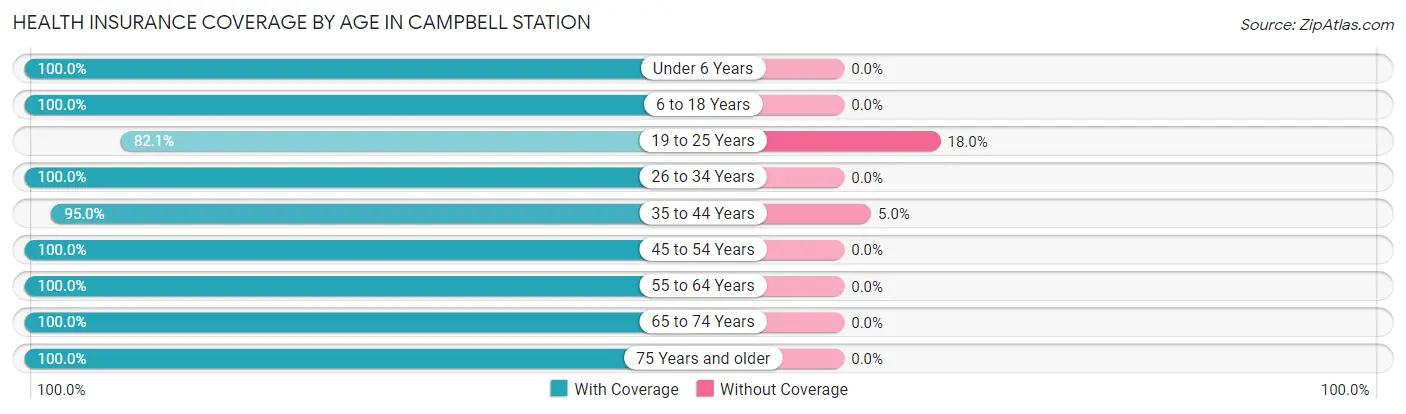
| Age Bracket | With Coverage | Without Coverage |
| Under 6 Years | 11 (100.0%) | 0 (0.0%) |
| 6 to 18 Years | 21 (100.0%) | 0 (0.0%) |
| 19 to 25 Years | 32 (82.1%) | 7 (17.9%) |
| 26 to 34 Years | 39 (100.0%) | 0 (0.0%) |
| 35 to 44 Years | 19 (95.0%) | 1 (5.0%) |
| 45 to 54 Years | 91 (100.0%) | 0 (0.0%) |
| 55 to 64 Years | 47 (100.0%) | 0 (0.0%) |
| 65 to 74 Years | 26 (100.0%) | 0 (0.0%) |
| 75 Years and older | 17 (100.0%) | 0 (0.0%) |
| Total | 303 (97.4%) | 8 (2.6%) |
Health Insurance Coverage by Citizenship Status in Campbell Station
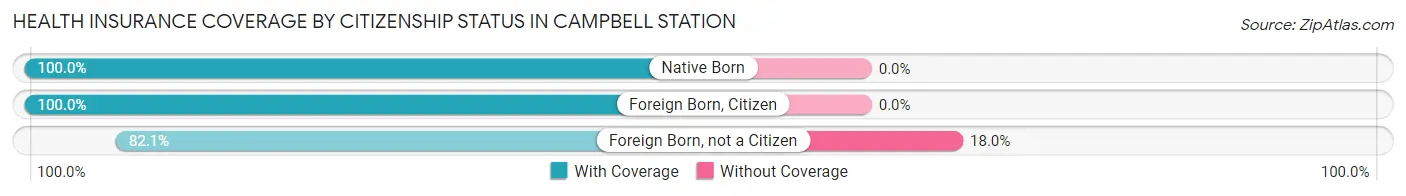
| Citizenship Status | With Coverage | Without Coverage |
| Native Born | 11 (100.0%) | 0 (0.0%) |
| Foreign Born, Citizen | 21 (100.0%) | 0 (0.0%) |
| Foreign Born, not a Citizen | 32 (82.1%) | 7 (17.9%) |
Health Insurance Coverage by Household Income in Campbell Station
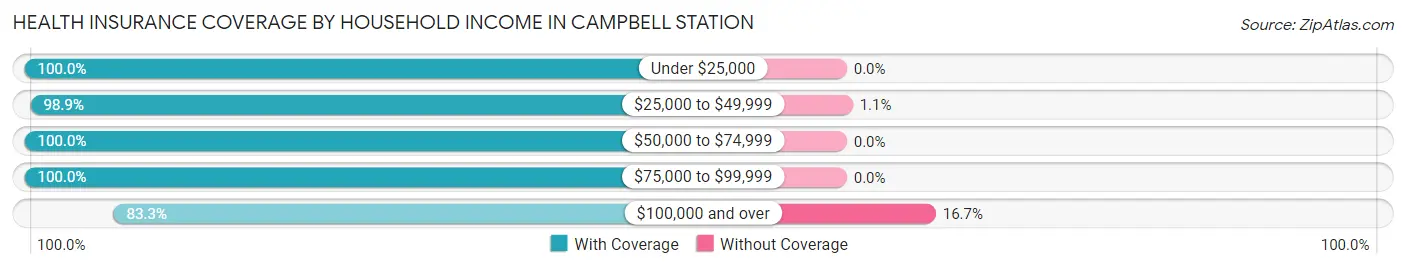
| Household Income | With Coverage | Without Coverage |
| Under $25,000 | 24 (100.0%) | 0 (0.0%) |
| $25,000 to $49,999 | 89 (98.9%) | 1 (1.1%) |
| $50,000 to $74,999 | 80 (100.0%) | 0 (0.0%) |
| $75,000 to $99,999 | 75 (100.0%) | 0 (0.0%) |
| $100,000 and over | 35 (83.3%) | 7 (16.7%) |
Public vs Private Health Insurance Coverage by Age in Campbell Station
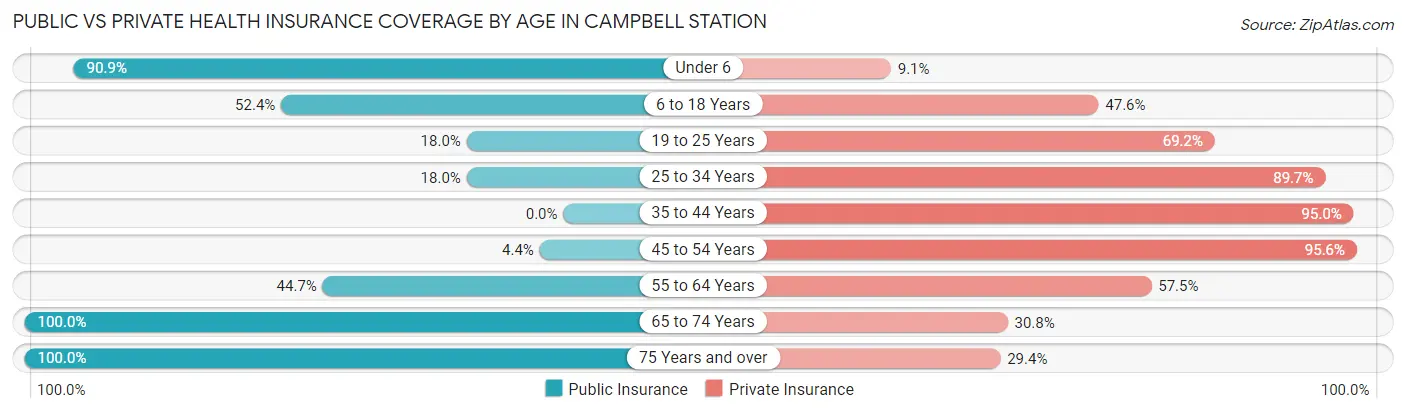
| Age Bracket | Public Insurance | Private Insurance |
| Under 6 | 10 (90.9%) | 1 (9.1%) |
| 6 to 18 Years | 11 (52.4%) | 10 (47.6%) |
| 19 to 25 Years | 7 (17.9%) | 27 (69.2%) |
| 25 to 34 Years | 7 (17.9%) | 35 (89.7%) |
| 35 to 44 Years | 0 (0.0%) | 19 (95.0%) |
| 45 to 54 Years | 4 (4.4%) | 87 (95.6%) |
| 55 to 64 Years | 21 (44.7%) | 27 (57.5%) |
| 65 to 74 Years | 26 (100.0%) | 8 (30.8%) |
| 75 Years and over | 17 (100.0%) | 5 (29.4%) |
| Total | 103 (33.1%) | 219 (70.4%) |
Disability Status by Sex by Age in Campbell Station
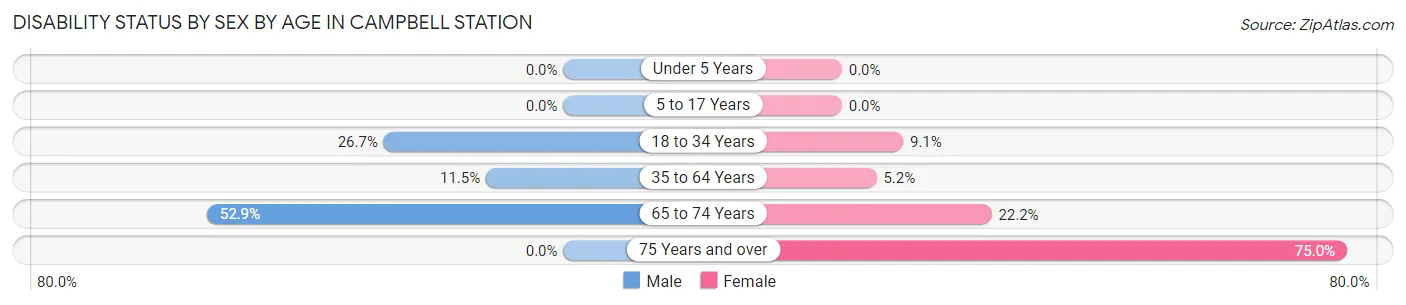
| Age Bracket | Male | Female |
| Under 5 Years | 0 (0.0%) | 0 (0.0%) |
| 5 to 17 Years | 0 (0.0%) | 0 (0.0%) |
| 18 to 34 Years | 12 (26.7%) | 3 (9.1%) |
| 35 to 64 Years | 7 (11.5%) | 5 (5.1%) |
| 65 to 74 Years | 9 (52.9%) | 2 (22.2%) |
| 75 Years and over | 0 (0.0%) | 9 (75.0%) |
Disability Class by Sex by Age in Campbell Station
Disability Class: Hearing Difficulty
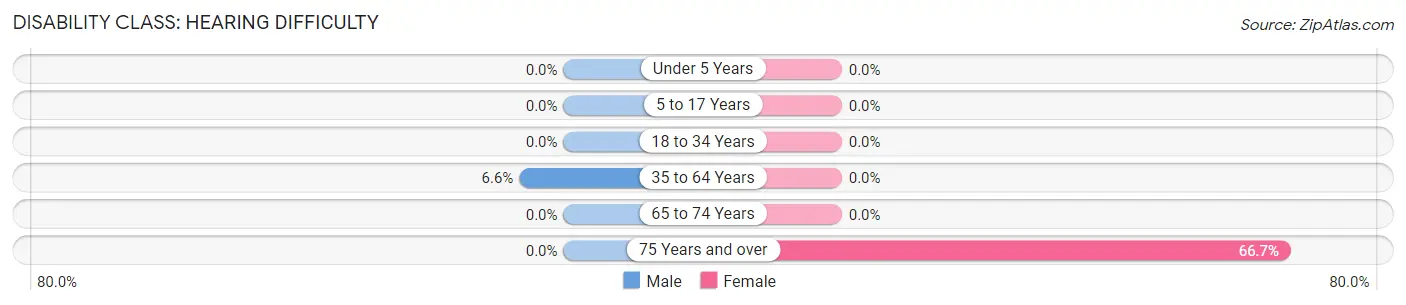
| Age Bracket | Male | Female |
| Under 5 Years | 0 (0.0%) | 0 (0.0%) |
| 5 to 17 Years | 0 (0.0%) | 0 (0.0%) |
| 18 to 34 Years | 0 (0.0%) | 0 (0.0%) |
| 35 to 64 Years | 4 (6.6%) | 0 (0.0%) |
| 65 to 74 Years | 0 (0.0%) | 0 (0.0%) |
| 75 Years and over | 0 (0.0%) | 8 (66.7%) |
Disability Class: Vision Difficulty
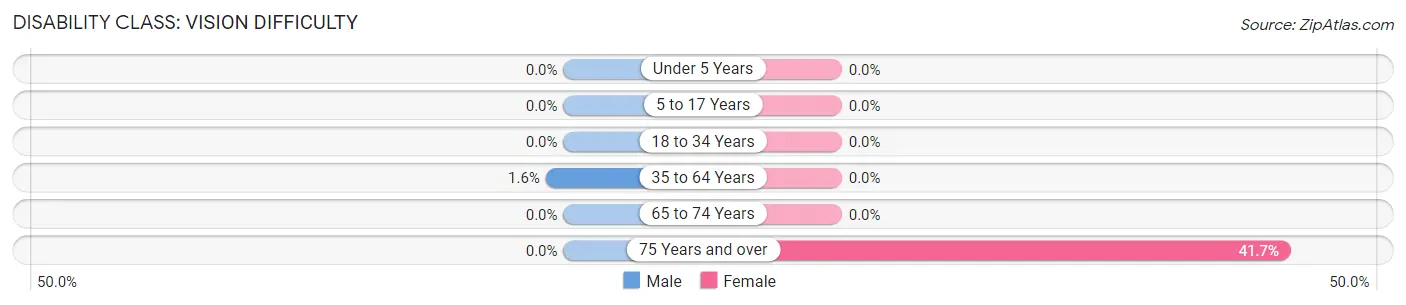
| Age Bracket | Male | Female |
| Under 5 Years | 0 (0.0%) | 0 (0.0%) |
| 5 to 17 Years | 0 (0.0%) | 0 (0.0%) |
| 18 to 34 Years | 0 (0.0%) | 0 (0.0%) |
| 35 to 64 Years | 1 (1.6%) | 0 (0.0%) |
| 65 to 74 Years | 0 (0.0%) | 0 (0.0%) |
| 75 Years and over | 0 (0.0%) | 5 (41.7%) |
Disability Class: Cognitive Difficulty
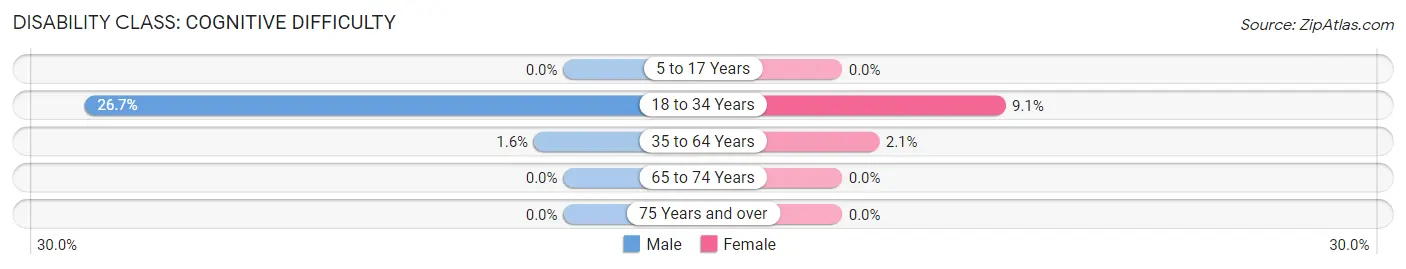
| Age Bracket | Male | Female |
| 5 to 17 Years | 0 (0.0%) | 0 (0.0%) |
| 18 to 34 Years | 12 (26.7%) | 3 (9.1%) |
| 35 to 64 Years | 1 (1.6%) | 2 (2.1%) |
| 65 to 74 Years | 0 (0.0%) | 0 (0.0%) |
| 75 Years and over | 0 (0.0%) | 0 (0.0%) |
Disability Class: Ambulatory Difficulty
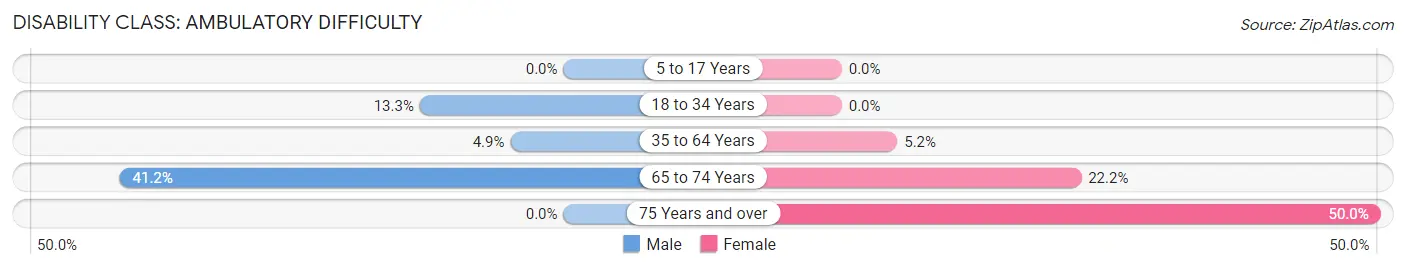
| Age Bracket | Male | Female |
| 5 to 17 Years | 0 (0.0%) | 0 (0.0%) |
| 18 to 34 Years | 6 (13.3%) | 0 (0.0%) |
| 35 to 64 Years | 3 (4.9%) | 5 (5.1%) |
| 65 to 74 Years | 7 (41.2%) | 2 (22.2%) |
| 75 Years and over | 0 (0.0%) | 6 (50.0%) |
Disability Class: Self-Care Difficulty
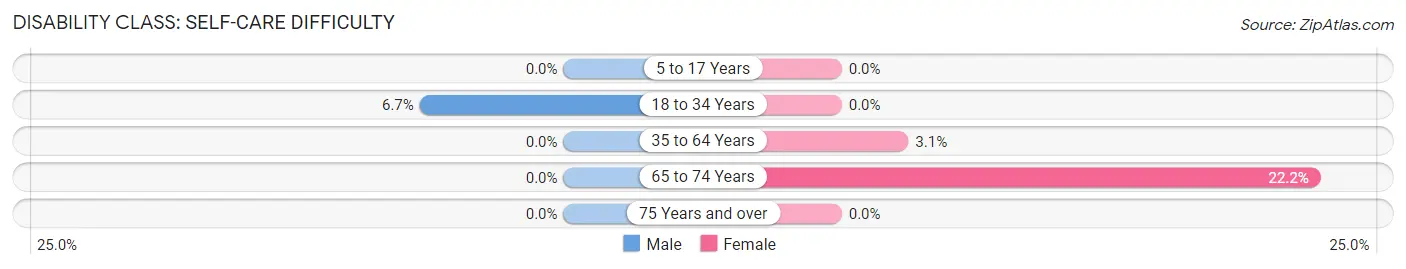
| Age Bracket | Male | Female |
| 5 to 17 Years | 0 (0.0%) | 0 (0.0%) |
| 18 to 34 Years | 3 (6.7%) | 0 (0.0%) |
| 35 to 64 Years | 0 (0.0%) | 3 (3.1%) |
| 65 to 74 Years | 0 (0.0%) | 2 (22.2%) |
| 75 Years and over | 0 (0.0%) | 0 (0.0%) |
Technology Access in Campbell Station
Computing Device Access in Campbell Station
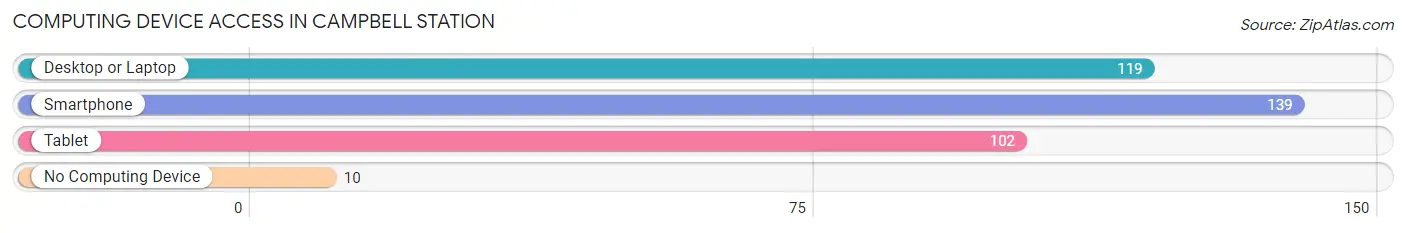
| Device Type | # Households | % Households |
| Desktop or Laptop | 119 | 72.6% |
| Smartphone | 139 | 84.8% |
| Tablet | 102 | 62.2% |
| No Computing Device | 10 | 6.1% |
| Total | 164 | 100.0% |
Internet Access in Campbell Station
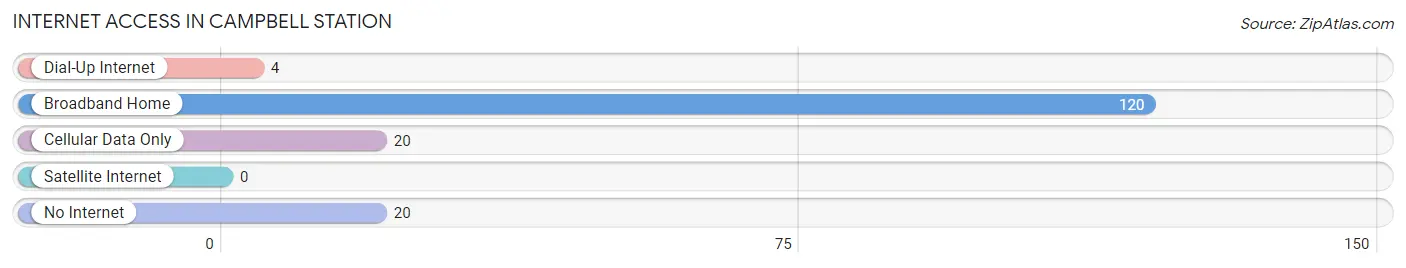
| Internet Type | # Households | % Households |
| Dial-Up Internet | 4 | 2.4% |
| Broadband Home | 120 | 73.2% |
| Cellular Data Only | 20 | 12.2% |
| Satellite Internet | 0 | 0.0% |
| No Internet | 20 | 12.2% |
| Total | 164 | 100.0% |
Campbell Station Summary
Campbell Station is a small unincorporated community located in the northern part of Arkansas, in the United States. It is situated in the Ozark Mountains, in the foothills of the Boston Mountains, and is part of the Fayetteville–Springdale–Rogers Metropolitan Statistical Area. The community is located in Washington County, and is approximately 10 miles south of the city of Fayetteville.
History
The area that is now Campbell Station was first settled in the early 1800s by a group of settlers from Tennessee. The settlement was originally known as “Campbell’s Station”, after the family of William Campbell, who was one of the first settlers in the area. The settlement was later shortened to “Campbell Station”.
The community was officially established in 1836, when the first post office was opened. The post office was named after the Campbell family, and the community was officially incorporated in 1837.
The community was originally a farming community, and the main crops grown were cotton, corn, and wheat. The area was also known for its timber industry, and the local sawmill was a major employer in the area.
In the late 1800s, the railroad was built through the area, and the community became a stop on the St. Louis–San Francisco Railway. This allowed the community to become a shipping center for the surrounding area, and the population began to grow.
Geography
Campbell Station is located in the northern part of Arkansas, in the Ozark Mountains. It is situated in the foothills of the Boston Mountains, and is part of the Fayetteville–Springdale–Rogers Metropolitan Statistical Area. The community is located in Washington County, and is approximately 10 miles south of the city of Fayetteville.
The community is located at an elevation of 1,072 feet above sea level. The area is mostly forested, with a mix of deciduous and coniferous trees. The climate in the area is humid subtropical, with hot summers and mild winters.
Economy
The economy of Campbell Station is largely based on agriculture and forestry. The main crops grown in the area are cotton, corn, and wheat. The area is also known for its timber industry, and the local sawmill is a major employer in the area.
The community is also home to several small businesses, including a grocery store, a hardware store, and a few restaurants. There is also a small airport located in the area, which serves the local community.
Demographics
As of the 2010 census, the population of Campbell Station was 1,072. The racial makeup of the community was 97.3% White, 0.7% African American, 0.3% Native American, 0.2% Asian, and 1.5% from other races. The median household income in the area was $37,917, and the median age was 40.7 years.
Conclusion
Campbell Station is a small unincorporated community located in the northern part of Arkansas, in the United States. It is situated in the Ozark Mountains, in the foothills of the Boston Mountains, and is part of the Fayetteville–Springdale–Rogers Metropolitan Statistical Area. The community was first settled in the early 1800s, and was officially established in 1836. The economy of the area is largely based on agriculture and forestry, and the main crops grown in the area are cotton, corn, and wheat. As of the 2010 census, the population of Campbell Station was 1,072.
Common Questions
What is the Total Population of Campbell Station?
Total Population of Campbell Station is 311.
What is the Total Male Population of Campbell Station?
Total Male Population of Campbell Station is 148.
What is the Total Female Population of Campbell Station?
Total Female Population of Campbell Station is 163.
What is the Ratio of Males per 100 Females in Campbell Station?
There are 90.80 Males per 100 Females in Campbell Station.
What is the Ratio of Females per 100 Males in Campbell Station?
There are 110.14 Females per 100 Males in Campbell Station.
What is the Median Population Age in Campbell Station?
Median Population Age in Campbell Station is 51.2 Years.
What is the Average Family Size in Campbell Station
Average Family Size in Campbell Station is 2.3 People.
What is the Average Household Size in Campbell Station
Average Household Size in Campbell Station is 1.9 People.
What is Per Capita Income in Campbell Station?
Per Capita income in Campbell Station is $35,923.
What is the Median Family Income in Campbell Station?
Median Family Income in Campbell Station is $65,833.
What is the Median Household income in Campbell Station?
Median Household Income in Campbell Station is $72,083.
What is Inequality or Gini Index in Campbell Station?
Inequality or Gini Index in Campbell Station is 0.25.
How Large is the Labor Force in Campbell Station?
There are 218 People in the Labor Forcein in Campbell Station.
What is the Percentage of People in the Labor Force in Campbell Station?
76.2% of People are in the Labor Force in Campbell Station.
What is the Unemployment Rate in Campbell Station?
Unemployment Rate in Campbell Station is 5.0%.