Woodruff County, AR
Woodruff County Map
Woodruff County Overview
6,259
TOTAL POPULATION
3,105
MALE POPULATION
3,154
FEMALE POPULATION
98.45
MALES / 100 FEMALES
101.58
FEMALES / 100 MALES
45.2
MEDIAN AGE
3.0
AVG FAMILY SIZE
2.3
AVG HOUSEHOLD SIZE
$29,216
PER CAPITA INCOME
$63,850
AVG FAMILY INCOME
$49,608
AVG HOUSEHOLD INCOME
34.9%
WAGE / INCOME GAP [ % ]
65.1¢/ $1
WAGE / INCOME GAP [ $ ]
$9,743
FAMILY INCOME DEFICIT
0.48
INEQUALITY / GINI INDEX
2,818
LABOR FORCE [ PEOPLE ]
55.5%
PERCENT IN LABOR FORCE
6.7%
UNEMPLOYMENT RATE
Woodruff County Area Codes
Race in Woodruff County
The most populous races in Woodruff County are White / Caucasian (4,352 | 69.5%), Black / African American (1,721 | 27.5%), and Two or more Races (150 | 2.4%).

| Race | # Population | % Population |
| Asian | 0 | 0.0% |
| Black / African American | 1,721 | 27.5% |
| Hawaiian / Pacific | 17 | 0.3% |
| Hispanic or Latino | 31 | 0.5% |
| Native / Alaskan | 1 | 0.0% |
| White / Caucasian | 4,352 | 69.5% |
| Two or more Races | 150 | 2.4% |
| Some other Race | 18 | 0.3% |
| Total | 6,259 | 100.0% |
Ancestry in Woodruff County
The most populous ancestries reported in Woodruff County are American (539 | 8.6%), Irish (355 | 5.7%), English (291 | 4.6%), German (266 | 4.3%), and Subsaharan African (56 | 0.9%), together accounting for 24.1% of all Woodruff County residents.

| Ancestry | # Population | % Population |
| African | 49 | 0.8% |
| American | 539 | 8.6% |
| Cherokee | 24 | 0.4% |
| Choctaw | 9 | 0.1% |
| Dutch | 5 | 0.1% |
| English | 291 | 4.6% |
| European | 20 | 0.3% |
| Fijian | 17 | 0.3% |
| French | 13 | 0.2% |
| German | 266 | 4.3% |
| Irish | 355 | 5.7% |
| Iroquois | 17 | 0.3% |
| Italian | 38 | 0.6% |
| Jamaican | 3 | 0.1% |
| Mexican | 27 | 0.4% |
| Polish | 22 | 0.4% |
| Portuguese | 3 | 0.1% |
| Puerto Rican | 3 | 0.1% |
| Samoan | 17 | 0.3% |
| Scotch-Irish | 6 | 0.1% |
| Scottish | 18 | 0.3% |
| South African | 7 | 0.1% |
| Subsaharan African | 56 | 0.9% |
| Ukrainian | 4 | 0.1% |
| Welsh | 17 | 0.3% | View All 25 Rows |
Immigrants in Woodruff County
The most numerous immigrant groups reported in Woodruff County came from , and Oceania (25 | 0.4%), together accounting for 0.4% of all Woodruff County residents.

| Immigration Origin | # Population | % Population |
| Oceania | 25 | 0.4% | View All 1 Rows |
Sex and Age in Woodruff County
Sex and Age in Woodruff County
The most populous age groups in Woodruff County are 15 to 19 Years (315 | 10.1%) for men and 60 to 64 Years (285 | 9.0%) for women.

| Age Bracket | Male | Female |
| Under 5 Years | 236 (7.6%) | 128 (4.1%) |
| 5 to 9 Years | 164 (5.3%) | 129 (4.1%) |
| 10 to 14 Years | 217 (7.0%) | 178 (5.6%) |
| 15 to 19 Years | 315 (10.1%) | 215 (6.8%) |
| 20 to 24 Years | 75 (2.4%) | 215 (6.8%) |
| 25 to 29 Years | 145 (4.7%) | 128 (4.1%) |
| 30 to 34 Years | 137 (4.4%) | 129 (4.1%) |
| 35 to 39 Years | 145 (4.7%) | 99 (3.1%) |
| 40 to 44 Years | 185 (6.0%) | 278 (8.8%) |
| 45 to 49 Years | 159 (5.1%) | 172 (5.4%) |
| 50 to 54 Years | 232 (7.5%) | 196 (6.2%) |
| 55 to 59 Years | 289 (9.3%) | 162 (5.1%) |
| 60 to 64 Years | 144 (4.6%) | 285 (9.0%) |
| 65 to 69 Years | 248 (8.0%) | 193 (6.1%) |
| 70 to 74 Years | 195 (6.3%) | 257 (8.2%) |
| 75 to 79 Years | 119 (3.8%) | 176 (5.6%) |
| 80 to 84 Years | 75 (2.4%) | 83 (2.6%) |
| 85 Years and over | 25 (0.8%) | 131 (4.2%) |
| Total | 3,105 (100.0%) | 3,154 (100.0%) |
Families and Households in Woodruff County
Median Family Size in Woodruff County
The median family size in Woodruff County is 2.95 persons per family, with single female/mother families (319 | 19.7%) accounting for the largest median family size of 3.74 persons per family. On the other hand, single male/father families (79 | 4.9%) represent the smallest median family size with 2.43 persons per family.

| Family Type | # Families | Family Size |
| Married-Couple | 1,223 (75.4%) | 2.78 |
| Single Male/Father | 79 (4.9%) | 2.43 |
| Single Female/Mother | 319 (19.7%) | 3.74 |
| Total Families | 1,621 (100.0%) | 2.95 |
Median Household Size in Woodruff County
The median household size in Woodruff County is 2.34 persons per household, with single female/mother households (319 | 12.1%) accounting for the largest median household size of 4.03 persons per household. non-family households (1,005 | 38.3%) represent the smallest median household size with 1.16 persons per household.

| Household Type | # Households | Household Size |
| Married-Couple | 1,223 (46.6%) | 2.83 |
| Single Male/Father | 79 (3.0%) | 2.90 |
| Single Female/Mother | 319 (12.1%) | 4.03 |
| Non-family | 1,005 (38.3%) | 1.16 |
| Total Households | 2,626 (100.0%) | 2.34 |
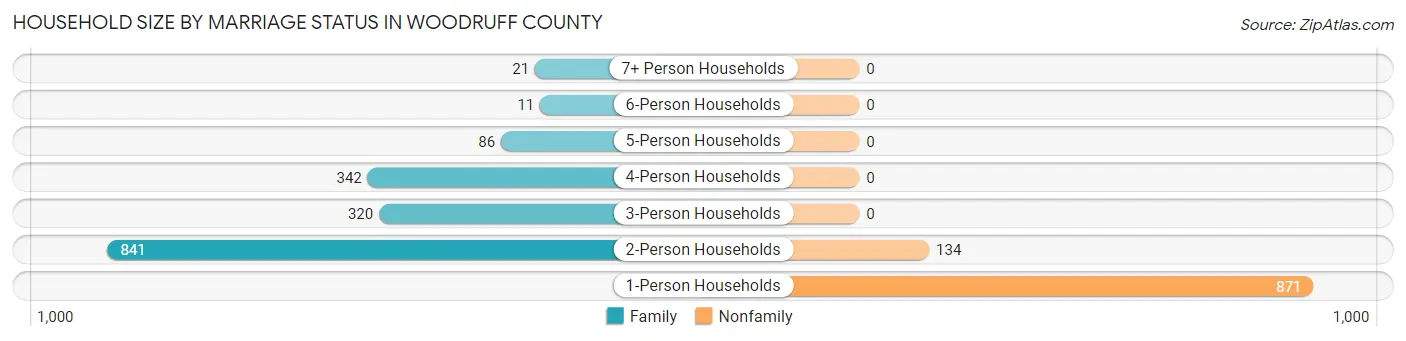
Household Size by Marriage Status in Woodruff County
Out of a total of 2,626 households in Woodruff County, 1,621 (61.7%) are family households, while 1,005 (38.3%) are nonfamily households. The most numerous type of family households are 2-person households, comprising 841, and the most common type of nonfamily households are 1-person households, comprising 871.
| Household Size | Family Households | Nonfamily Households |
| 1-Person Households | - | 871 (33.2%) |
| 2-Person Households | 841 (32.0%) | 134 (5.1%) |
| 3-Person Households | 320 (12.2%) | 0 (0.0%) |
| 4-Person Households | 342 (13.0%) | 0 (0.0%) |
| 5-Person Households | 86 (3.3%) | 0 (0.0%) |
| 6-Person Households | 11 (0.4%) | 0 (0.0%) |
| 7+ Person Households | 21 (0.8%) | 0 (0.0%) |
| Total | 1,621 (61.7%) | 1,005 (38.3%) |
Female Fertility in Woodruff County
Fertility by Age in Woodruff County
Average fertility rate in Woodruff County is 39.0 births per 1,000 women. Women in the age bracket of 20 to 34 years have the highest fertility rate with 83.0 births per 1,000 women. Women in the age bracket of 20 to 34 years acount for 78.0% of all women with births.

| Age Bracket | Women with Births | Births / 1,000 Women |
| 15 to 19 years | 0 (0.0%) | 0.0 |
| 20 to 34 years | 39 (78.0%) | 83.0 |
| 35 to 50 years | 11 (22.0%) | 18.0 |
| Total | 50 (100.0%) | 39.0 |
Fertility by Age by Marriage Status in Woodruff County
42.0% of women with births (50) in Woodruff County are married. The highest percentage of unmarried women with births falls into 35 to 50 years age bracket with 72.7% of them unmarried at the time of birth, while the lowest percentage of unmarried women with births belong to 20 to 34 years age bracket with 53.8% of them unmarried.

| Age Bracket | Married | Unmarried |
| 15 to 19 years | 0 (0.0%) | 0 (0.0%) |
| 20 to 34 years | 18 (46.2%) | 21 (53.8%) |
| 35 to 50 years | 3 (27.3%) | 8 (72.7%) |
| Total | 21 (42.0%) | 29 (58.0%) |
Fertility by Education in Woodruff County

| Educational Attainment | Women with Births | Births / 1,000 Women |
| Less than High School | 0 (0.0%) | 0.0 |
| High School Diploma | 33 (66.0%) | 63.0 |
| College or Associate's Degree | 17 (34.0%) | 50.0 |
| Bachelor's Degree | 0 (0.0%) | 0.0 |
| Graduate Degree | 0 (0.0%) | 0.0 |
| Total | 50 (100.0%) | 39.0 |
Fertility by Education by Marriage Status in Woodruff County
58.0% of women with births in Woodruff County are unmarried. Women with the educational attainment of high school diploma are most likely to be married with 63.6% of them married at childbirth, while women with the educational attainment of college or associate's degree are least likely to be married with 100.0% of them unmarried at childbirth.

| Educational Attainment | Married | Unmarried |
| Less than High School | 0 (0.0%) | 0 (0.0%) |
| High School Diploma | 21 (63.6%) | 12 (36.4%) |
| College or Associate's Degree | 0 (0.0%) | 17 (100.0%) |
| Bachelor's Degree | 0 (0.0%) | 0 (0.0%) |
| Graduate Degree | 0 (0.0%) | 0 (0.0%) |
| Total | 21 (42.0%) | 29 (58.0%) |
Income in Woodruff County
Income Overview in Woodruff County
Per Capita Income in Woodruff County is $29,216, while median incomes of families and households are $63,850 and $49,608 respectively.
| Characteristic | Number | Measure |
| Per Capita Income | 6,259 | $29,216 |
| Median Family Income | 1,621 | $63,850 |
| Mean Family Income | 1,621 | $82,437 |
| Median Household Income | 2,626 | $49,608 |
| Mean Household Income | 2,626 | $66,258 |
| Income Deficit | 1,621 | $9,743 |
| Wage / Income Gap (%) | 6,259 | 34.87% |
| Wage / Income Gap ($) | 6,259 | 65.13¢ per $1 |
| Gini / Inequality Index | 6,259 | 0.48 |
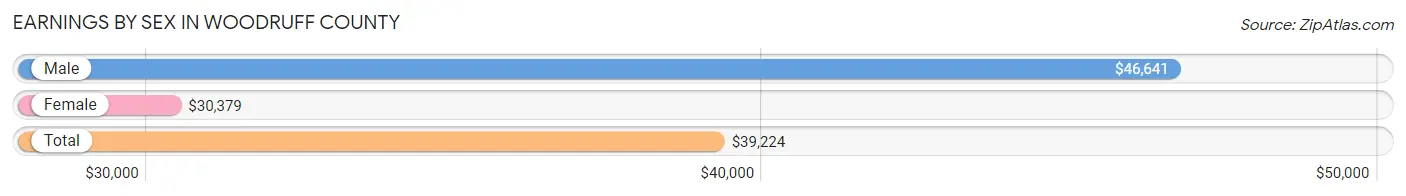
Earnings by Sex in Woodruff County
Average Earnings in Woodruff County are $39,224, $46,641 for men and $30,379 for women, a difference of 34.9%.
| Sex | Number | Average Earnings |
| Male | 1,494 (53.4%) | $46,641 |
| Female | 1,302 (46.6%) | $30,379 |
| Total | 2,796 (100.0%) | $39,224 |
Earnings by Sex by Income Bracket in Woodruff County
The most common earnings brackets in Woodruff County are $55,000 to $64,999 for men (337 | 22.6%) and $25,000 to $29,999 for women (180 | 13.8%).

| Income | Male | Female |
| $2,499 or less | 31 (2.1%) | 68 (5.2%) |
| $2,500 to $4,999 | 7 (0.5%) | 22 (1.7%) |
| $5,000 to $7,499 | 59 (4.0%) | 66 (5.1%) |
| $7,500 to $9,999 | 38 (2.5%) | 17 (1.3%) |
| $10,000 to $12,499 | 40 (2.7%) | 76 (5.8%) |
| $12,500 to $14,999 | 22 (1.5%) | 41 (3.2%) |
| $15,000 to $17,499 | 0 (0.0%) | 29 (2.2%) |
| $17,500 to $19,999 | 47 (3.2%) | 26 (2.0%) |
| $20,000 to $22,499 | 40 (2.7%) | 57 (4.4%) |
| $22,500 to $24,999 | 48 (3.2%) | 59 (4.5%) |
| $25,000 to $29,999 | 78 (5.2%) | 180 (13.8%) |
| $30,000 to $34,999 | 128 (8.6%) | 75 (5.8%) |
| $35,000 to $39,999 | 47 (3.2%) | 124 (9.5%) |
| $40,000 to $44,999 | 78 (5.2%) | 59 (4.5%) |
| $45,000 to $49,999 | 156 (10.4%) | 67 (5.1%) |
| $50,000 to $54,999 | 79 (5.3%) | 81 (6.2%) |
| $55,000 to $64,999 | 337 (22.6%) | 54 (4.2%) |
| $65,000 to $74,999 | 85 (5.7%) | 27 (2.1%) |
| $75,000 to $99,999 | 98 (6.6%) | 11 (0.8%) |
| $100,000+ | 76 (5.1%) | 163 (12.5%) |
| Total | 1,494 (100.0%) | 1,302 (100.0%) |
Earnings by Sex by Educational Attainment in Woodruff County
Average earnings in Woodruff County are $48,661 for men and $35,640 for women, a difference of 26.8%. Men with an educational attainment of graduate degree enjoy the highest average annual earnings of $55,500, while those with less than high school education earn the least with $30,714. Women with an educational attainment of bachelor's degree earn the most with the average annual earnings of $45,234, while those with less than high school education have the smallest earnings of $17,303.

| Educational Attainment | Male Income | Female Income |
| Less than High School | $30,714 | $17,303 |
| High School Diploma | $50,096 | $29,225 |
| College or Associate's Degree | $51,792 | $39,190 |
| Bachelor's Degree | $52,625 | $45,234 |
| Graduate Degree | $55,500 | $0 |
| Total | $48,661 | $35,640 |
Family Income in Woodruff County
Family Income Brackets in Woodruff County
According to the Woodruff County family income data, there are 405 families falling into the $75,000 to $99,999 income range, which is the most common income bracket and makes up 25.0% of all families. Conversely, the less than $10,000 income bracket is the least frequent group with only 45 families (2.8%) belonging to this category.

| Income Bracket | # Families | % Families |
| Less than $10,000 | 45 | 2.8% |
| $10,000 to $14,999 | 99 | 6.1% |
| $15,000 to $24,999 | 204 | 12.6% |
| $25,000 to $34,999 | 101 | 6.2% |
| $35,000 to $49,999 | 160 | 9.9% |
| $50,000 to $74,999 | 254 | 15.7% |
| $75,000 to $99,999 | 405 | 25.0% |
| $100,000 to $149,999 | 185 | 11.4% |
| $150,000 to $199,999 | 50 | 3.1% |
| $200,000+ | 115 | 7.1% |
Family Income by Famaliy Size in Woodruff County
4-person families (348 | 21.5%) account for the highest median family income in Woodruff County with $97,640 per family, while 2-person families (903 | 55.7%) have the highest median income of $29,284 per family member.

| Income Bracket | # Families | Median Income |
| 2-Person Families | 903 (55.7%) | $58,567 |
| 3-Person Families | 284 (17.5%) | $60,536 |
| 4-Person Families | 348 (21.5%) | $97,640 |
| 5-Person Families | 68 (4.2%) | $0 |
| 6-Person Families | 6 (0.4%) | $0 |
| 7+ Person Families | 12 (0.7%) | $0 |
| Total | 1,621 (100.0%) | $63,850 |
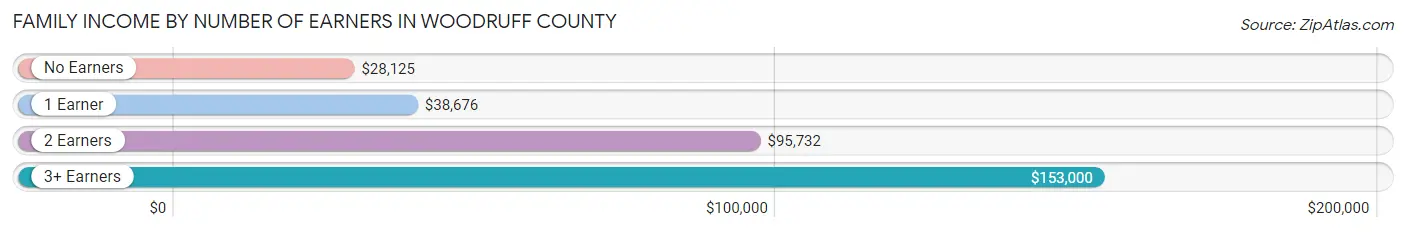
Family Income by Number of Earners in Woodruff County
The median family income in Woodruff County is $63,850, with families comprising 3+ earners (56) having the highest median family income of $153,000, while families with no earners (377) have the lowest median family income of $28,125, accounting for 3.5% and 23.3% of families, respectively.
| Number of Earners | # Families | Median Income |
| No Earners | 377 (23.3%) | $28,125 |
| 1 Earner | 482 (29.7%) | $38,676 |
| 2 Earners | 706 (43.5%) | $95,732 |
| 3+ Earners | 56 (3.5%) | $153,000 |
| Total | 1,621 (100.0%) | $63,850 |
Household Income in Woodruff County
Household Income Brackets in Woodruff County
With 460 households falling in the category, the $75,000 to $99,999 income range is the most frequent in Woodruff County, accounting for 17.5% of all households. In contrast, only 92 households (3.5%) fall into the $150,000 to $199,999 income bracket, making it the least populous group.

| Income Bracket | # Households | % Households |
| Less than $10,000 | 147 | 5.6% |
| $10,000 to $14,999 | 273 | 10.4% |
| $15,000 to $24,999 | 394 | 15.0% |
| $25,000 to $34,999 | 268 | 10.2% |
| $35,000 to $49,999 | 244 | 9.3% |
| $50,000 to $74,999 | 433 | 16.5% |
| $75,000 to $99,999 | 460 | 17.5% |
| $100,000 to $149,999 | 192 | 7.3% |
| $150,000 to $199,999 | 92 | 3.5% |
| $200,000+ | 123 | 4.7% |
Household Income by Householder Age in Woodruff County
The median household income in Woodruff County is $49,608, with the highest median household income of $60,000 found in the 45 to 64 years age bracket for the primary householder. A total of 980 households (37.3%) fall into this category. Meanwhile, the 65+ years age bracket for the primary householder has the lowest median household income of $28,750, with 975 households (37.1%) in this group.

| Income Bracket | # Households | Median Income |
| 15 to 24 Years | 86 (3.3%) | $29,886 |
| 25 to 44 Years | 585 (22.3%) | $54,531 |
| 45 to 64 Years | 980 (37.3%) | $60,000 |
| 65+ Years | 975 (37.1%) | $28,750 |
| Total | 2,626 (100.0%) | $49,608 |
Poverty in Woodruff County
Income Below Poverty by Sex and Age in Woodruff County
With 15.6% poverty level for males and 22.4% for females among the residents of Woodruff County, 16 and 17 year old males and 5 year old females are the most vulnerable to poverty, with 11 males (50.0%) and 18 females (100.0%) in their respective age groups living below the poverty level.

| Age Bracket | Male | Female |
| Under 5 Years | 87 (36.9%) | 34 (39.5%) |
| 5 Years | 12 (35.3%) | 18 (100.0%) |
| 6 to 11 Years | 33 (17.0%) | 62 (31.3%) |
| 12 to 14 Years | 42 (36.2%) | 24 (36.9%) |
| 15 Years | 10 (9.4%) | 2 (8.7%) |
| 16 and 17 Years | 11 (50.0%) | 0 (0.0%) |
| 18 to 24 Years | 33 (12.6%) | 89 (33.8%) |
| 25 to 34 Years | 70 (24.8%) | 82 (31.9%) |
| 35 to 44 Years | 39 (12.6%) | 61 (16.3%) |
| 45 to 54 Years | 33 (8.5%) | 82 (22.3%) |
| 55 to 64 Years | 39 (9.1%) | 115 (25.7%) |
| 65 to 74 Years | 36 (8.2%) | 70 (15.8%) |
| 75 Years and over | 24 (12.1%) | 38 (11.5%) |
| Total | 469 (15.6%) | 677 (22.4%) |
Income Above Poverty by Sex and Age in Woodruff County
According to the poverty statistics in Woodruff County, males aged 65 to 74 years and females aged 16 and 17 years are the age groups that are most secure financially, with 91.8% of males and 100.0% of females in these age groups living above the poverty line.

| Age Bracket | Male | Female |
| Under 5 Years | 149 (63.1%) | 52 (60.5%) |
| 5 Years | 22 (64.7%) | 0 (0.0%) |
| 6 to 11 Years | 161 (83.0%) | 136 (68.7%) |
| 12 to 14 Years | 74 (63.8%) | 41 (63.1%) |
| 15 Years | 96 (90.6%) | 21 (91.3%) |
| 16 and 17 Years | 11 (50.0%) | 144 (100.0%) |
| 18 to 24 Years | 228 (87.4%) | 174 (66.2%) |
| 25 to 34 Years | 212 (75.2%) | 175 (68.1%) |
| 35 to 44 Years | 271 (87.4%) | 314 (83.7%) |
| 45 to 54 Years | 356 (91.5%) | 286 (77.7%) |
| 55 to 64 Years | 389 (90.9%) | 332 (74.3%) |
| 65 to 74 Years | 401 (91.8%) | 372 (84.2%) |
| 75 Years and over | 174 (87.9%) | 293 (88.5%) |
| Total | 2,544 (84.4%) | 2,340 (77.6%) |
Income Below Poverty Among Married-Couple Families in Woodruff County
The poverty statistics for married-couple families in Woodruff County show that 6.5% or 79 of the total 1,223 families live below the poverty line. Families with 3 or 4 children have the highest poverty rate of 37.9%, comprising of 11 families. On the other hand, families with 1 or 2 children have the lowest poverty rate of 0.0%, which includes 0 families.
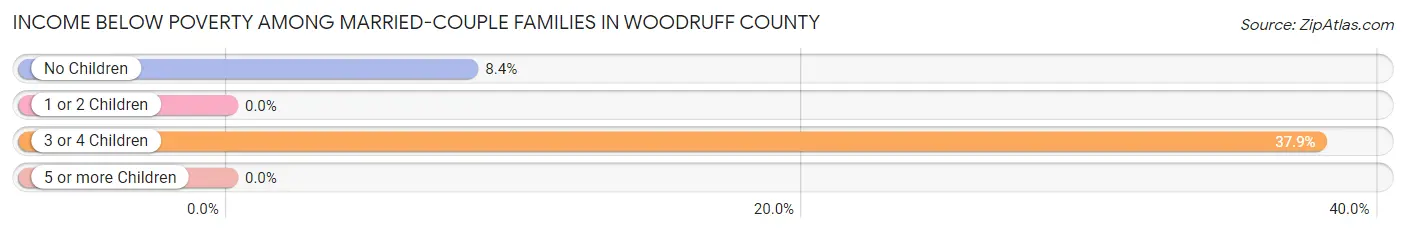
| Children | Above Poverty | Below Poverty |
| No Children | 744 (91.6%) | 68 (8.4%) |
| 1 or 2 Children | 382 (100.0%) | 0 (0.0%) |
| 3 or 4 Children | 18 (62.1%) | 11 (37.9%) |
| 5 or more Children | 0 (0.0%) | 0 (0.0%) |
| Total | 1,144 (93.5%) | 79 (6.5%) |
Income Below Poverty Among Single-Parent Households in Woodruff County

| Children | Single Father | Single Mother |
| No Children | 0 (0.0%) | 35 (34.3%) |
| 1 or 2 Children | 0 (0.0%) | 60 (35.5%) |
| 3 or 4 Children | 0 (0.0%) | 40 (100.0%) |
| 5 or more Children | 0 (0.0%) | 8 (100.0%) |
| Total | 0 (0.0%) | 143 (44.8%) |
Income Below Poverty Among Married-Couple vs Single-Parent Households in Woodruff County
The poverty data for Woodruff County shows that 79 of the married-couple family households (6.5%) and 143 of the single-parent households (35.9%) are living below the poverty level. Within the married-couple family households, those with 3 or 4 children have the highest poverty rate, with 11 households (37.9%) falling below the poverty line. Among the single-parent households, those with 3 or 4 children have the highest poverty rate, with 40 household (100.0%) living below poverty.
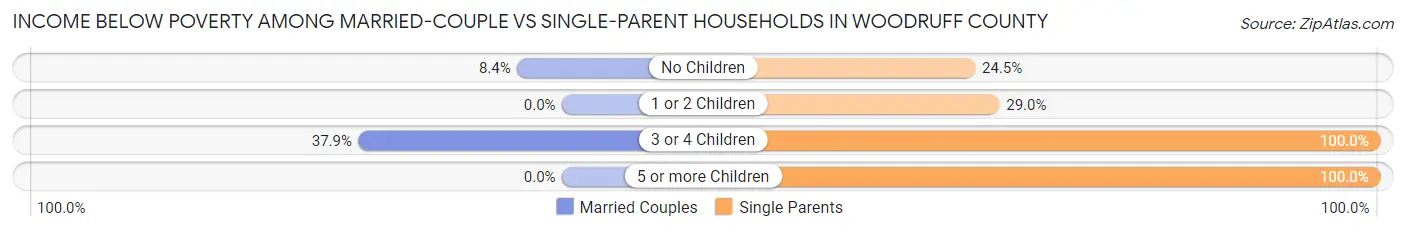
| Children | Married-Couple Families | Single-Parent Households |
| No Children | 68 (8.4%) | 35 (24.5%) |
| 1 or 2 Children | 0 (0.0%) | 60 (29.0%) |
| 3 or 4 Children | 11 (37.9%) | 40 (100.0%) |
| 5 or more Children | 0 (0.0%) | 8 (100.0%) |
| Total | 79 (6.5%) | 143 (35.9%) |
Employment Characteristics in Woodruff County
Employment by Class of Employer in Woodruff County
Among the 2,625 employed individuals in Woodruff County, private company employees (1,766 | 67.3%), self-employed (not incorporated) (260 | 9.9%), and local government employees (189 | 7.2%) make up the most common classes of employment.

| Employer Class | # Employees | % Employees |
| Private Company Employees | 1,766 | 67.3% |
| Self-Employed (Incorporated) | 91 | 3.5% |
| Self-Employed (Not Incorporated) | 260 | 9.9% |
| Not-for-profit Organizations | 83 | 3.2% |
| Local Government Employees | 189 | 7.2% |
| State Government Employees | 179 | 6.8% |
| Federal Government Employees | 57 | 2.2% |
| Unpaid Family Workers | 0 | 0.0% |
| Total | 2,625 | 100.0% |
Employment Status by Age in Woodruff County
According to the labor force statistics for Woodruff County, out of the total population over 16 years of age (5,078), 55.5% or 2,818 individuals are in the labor force, with 6.7% or 189 of them unemployed. The age group with the highest labor force participation rate is 35 to 44 years, with 88.1% or 623 individuals in the labor force. Within the labor force, the 16 to 19 years age range has the highest percentage of unemployed individuals, with 49.5% or 50 of them being unemployed.

| Age Bracket | In Labor Force | Unemployed |
| 16 to 19 Years | 101 (25.2%) | 50 (49.5%) |
| 20 to 24 Years | 236 (81.4%) | 31 (13.1%) |
| 25 to 29 Years | 220 (80.6%) | 11 (5.0%) |
| 30 to 34 Years | 226 (85.0%) | 8 (3.5%) |
| 35 to 44 Years | 623 (88.1%) | 42 (6.7%) |
| 45 to 54 Years | 597 (78.7%) | 36 (6.0%) |
| 55 to 59 Years | 332 (73.6%) | 0 (0.0%) |
| 60 to 64 Years | 212 (49.4%) | 5 (2.4%) |
| 65 to 74 Years | 230 (25.8%) | 7 (3.0%) |
| 75 Years and over | 43 (7.1%) | 0 (0.0%) |
| Total | 2,818 (55.5%) | 189 (6.7%) |
Employment Status by Educational Attainment in Woodruff County
According to labor force statistics for Woodruff County, 76.6% of individuals (2,210) out of the total population between 25 and 64 years of age (2,885) are in the labor force, with 4.6% or 102 of them being unemployed. The group with the highest labor force participation rate are those with the educational attainment of college / associate degree, with 89.3% or 575 individuals in the labor force. Within the labor force, individuals with less than high school education have the highest percentage of unemployment, with 10.1% or 14 of them being unemployed.

| Educational Attainment | In Labor Force | Unemployed |
| Less than High School | 139 (51.3%) | 27 (10.1%) |
| High School Diploma | 1,179 (74.4%) | 86 (5.4%) |
| College / Associate Degree | 575 (89.3%) | 20 (3.1%) |
| Bachelor's Degree or higher | 316 (82.1%) | 7 (1.9%) |
| Total | 2,210 (76.6%) | 133 (4.6%) |
Employment Occupations by Sex in Woodruff County
Management, Business, Science and Arts Occupations
The most common Management, Business, Science and Arts occupations in Woodruff County are Management (334 | 12.7%), Health Diagnosing & Treating (256 | 9.7%), Health Technologists (146 | 5.6%), Community & Social Service (143 | 5.4%), and Education Instruction & Library (97 | 3.7%).

Management, Business, Science and Arts Occupations by Sex
Within the Management, Business, Science and Arts occupations in Woodruff County, the most male-oriented occupations are Computers, Engineering & Science (100.0%), Computers & Mathematics (100.0%), and Life, Physical & Social Science (100.0%), while the most female-oriented occupations are Education, Arts & Media (100.0%), Legal Services & Support (100.0%), and Health Technologists (100.0%).

| Occupation | Male | Female |
| Management | 199 (59.6%) | 135 (40.4%) |
| Business & Financial | 49 (55.1%) | 40 (44.9%) |
| Computers, Engineering & Science | 17 (100.0%) | 0 (0.0%) |
| Computers & Mathematics | 12 (100.0%) | 0 (0.0%) |
| Architecture & Engineering | 0 (0.0%) | 0 (0.0%) |
| Life, Physical & Social Science | 5 (100.0%) | 0 (0.0%) |
| Community & Social Service | 28 (19.6%) | 115 (80.4%) |
| Education, Arts & Media | 0 (0.0%) | 14 (100.0%) |
| Legal Services & Support | 0 (0.0%) | 19 (100.0%) |
| Education Instruction & Library | 22 (22.7%) | 75 (77.3%) |
| Arts, Media & Entertainment | 6 (46.2%) | 7 (53.8%) |
| Health Diagnosing & Treating | 14 (5.5%) | 242 (94.5%) |
| Health Technologists | 0 (0.0%) | 146 (100.0%) |
| Total (Category) | 307 (36.6%) | 532 (63.4%) |
| Total (Overall) | 1,395 (53.0%) | 1,235 (47.0%) |
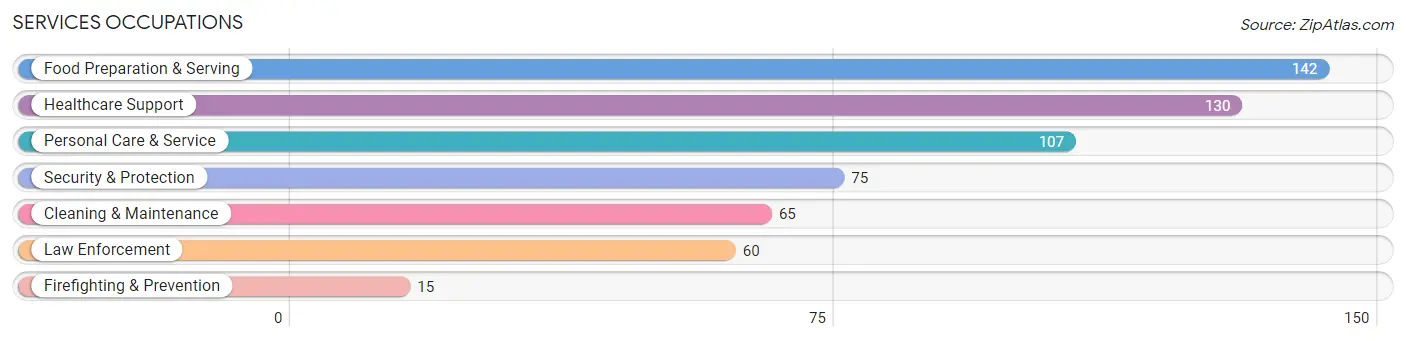
Services Occupations
The most common Services occupations in Woodruff County are Food Preparation & Serving (142 | 5.4%), Healthcare Support (130 | 4.9%), Personal Care & Service (107 | 4.1%), Security & Protection (75 | 2.9%), and Cleaning & Maintenance (65 | 2.5%).
Services Occupations by Sex
Within the Services occupations in Woodruff County, the most male-oriented occupations are Firefighting & Prevention (100.0%), Security & Protection (98.7%), and Law Enforcement (98.3%), while the most female-oriented occupations are Healthcare Support (93.9%), Food Preparation & Serving (76.1%), and Cleaning & Maintenance (53.8%).
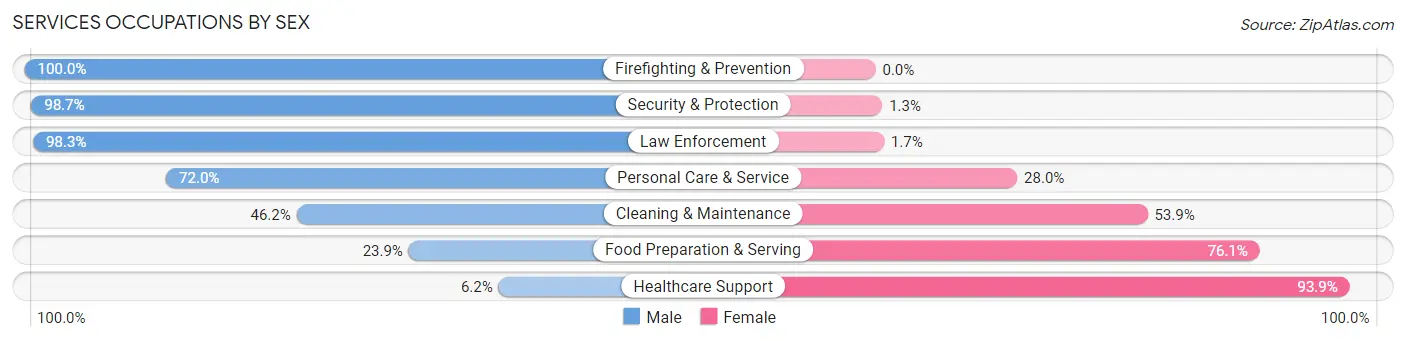
| Occupation | Male | Female |
| Healthcare Support | 8 (6.1%) | 122 (93.9%) |
| Security & Protection | 74 (98.7%) | 1 (1.3%) |
| Firefighting & Prevention | 15 (100.0%) | 0 (0.0%) |
| Law Enforcement | 59 (98.3%) | 1 (1.7%) |
| Food Preparation & Serving | 34 (23.9%) | 108 (76.1%) |
| Cleaning & Maintenance | 30 (46.2%) | 35 (53.8%) |
| Personal Care & Service | 77 (72.0%) | 30 (28.0%) |
| Total (Category) | 223 (43.0%) | 296 (57.0%) |
| Total (Overall) | 1,395 (53.0%) | 1,235 (47.0%) |
Sales and Office Occupations
The most common Sales and Office occupations in Woodruff County are Office & Administration (303 | 11.5%), and Sales & Related (262 | 10.0%).

Sales and Office Occupations by Sex

| Occupation | Male | Female |
| Sales & Related | 181 (69.1%) | 81 (30.9%) |
| Office & Administration | 22 (7.3%) | 281 (92.7%) |
| Total (Category) | 203 (35.9%) | 362 (64.1%) |
| Total (Overall) | 1,395 (53.0%) | 1,235 (47.0%) |
Natural Resources, Construction and Maintenance Occupations
The most common Natural Resources, Construction and Maintenance occupations in Woodruff County are Installation, Maintenance & Repair (127 | 4.8%), Farming, Fishing & Forestry (53 | 2.0%), and Construction & Extraction (32 | 1.2%).

Natural Resources, Construction and Maintenance Occupations by Sex
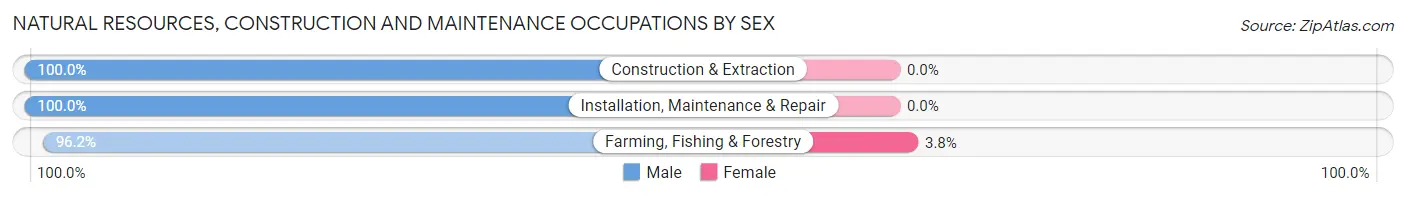
| Occupation | Male | Female |
| Farming, Fishing & Forestry | 51 (96.2%) | 2 (3.8%) |
| Construction & Extraction | 32 (100.0%) | 0 (0.0%) |
| Installation, Maintenance & Repair | 127 (100.0%) | 0 (0.0%) |
| Total (Category) | 210 (99.1%) | 2 (0.9%) |
| Total (Overall) | 1,395 (53.0%) | 1,235 (47.0%) |
Production, Transportation and Moving Occupations
The most common Production, Transportation and Moving occupations in Woodruff County are Production (255 | 9.7%), Transportation (143 | 5.4%), and Material Moving (97 | 3.7%).

Production, Transportation and Moving Occupations by Sex

| Occupation | Male | Female |
| Production | 214 (83.9%) | 41 (16.1%) |
| Transportation | 143 (100.0%) | 0 (0.0%) |
| Material Moving | 95 (97.9%) | 2 (2.1%) |
| Total (Category) | 452 (91.3%) | 43 (8.7%) |
| Total (Overall) | 1,395 (53.0%) | 1,235 (47.0%) |
Employment Industries by Sex in Woodruff County
Employment Industries in Woodruff County
The major employment industries in Woodruff County include Health Care & Social Assistance (478 | 18.2%), Manufacturing (310 | 11.8%), Retail Trade (287 | 10.9%), Agriculture, Fishing & Hunting (228 | 8.7%), and Educational Services (162 | 6.2%).

Employment Industries by Sex in Woodruff County
The Woodruff County industries that see more men than women are Mining, Quarrying, & Extraction (100.0%), Utilities (100.0%), and Professional & Scientific (100.0%), whereas the industries that tend to have a higher number of women are Information (100.0%), Real Estate, Rental & Leasing (100.0%), and Enterprise Management (100.0%).
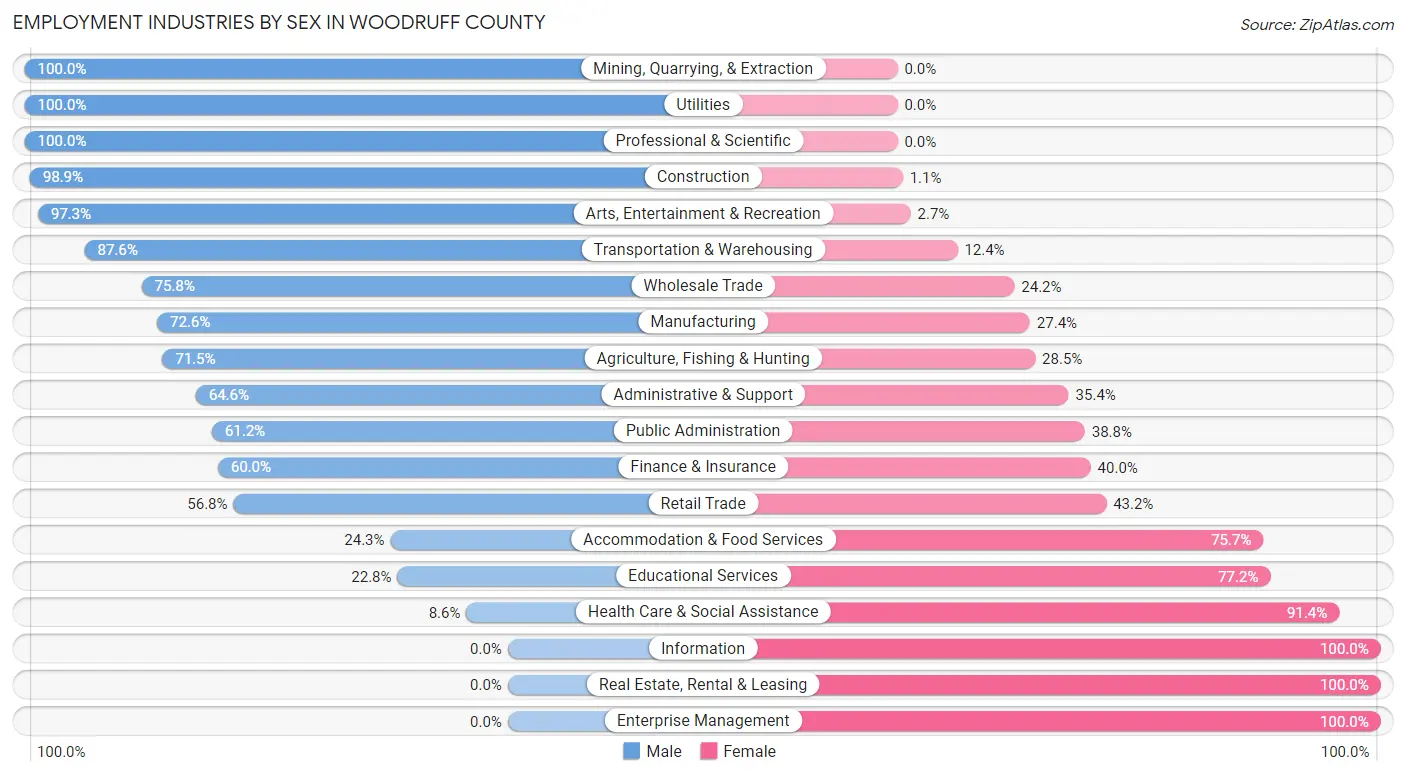
| Industry | Male | Female |
| Agriculture, Fishing & Hunting | 163 (71.5%) | 65 (28.5%) |
| Mining, Quarrying, & Extraction | 4 (100.0%) | 0 (0.0%) |
| Construction | 91 (98.9%) | 1 (1.1%) |
| Manufacturing | 225 (72.6%) | 85 (27.4%) |
| Wholesale Trade | 72 (75.8%) | 23 (24.2%) |
| Retail Trade | 163 (56.8%) | 124 (43.2%) |
| Transportation & Warehousing | 141 (87.6%) | 20 (12.4%) |
| Utilities | 47 (100.0%) | 0 (0.0%) |
| Information | 0 (0.0%) | 13 (100.0%) |
| Finance & Insurance | 90 (60.0%) | 60 (40.0%) |
| Real Estate, Rental & Leasing | 0 (0.0%) | 40 (100.0%) |
| Professional & Scientific | 15 (100.0%) | 0 (0.0%) |
| Enterprise Management | 0 (0.0%) | 4 (100.0%) |
| Administrative & Support | 51 (64.6%) | 28 (35.4%) |
| Educational Services | 37 (22.8%) | 125 (77.2%) |
| Health Care & Social Assistance | 41 (8.6%) | 437 (91.4%) |
| Arts, Entertainment & Recreation | 107 (97.3%) | 3 (2.7%) |
| Accommodation & Food Services | 34 (24.3%) | 106 (75.7%) |
| Public Administration | 90 (61.2%) | 57 (38.8%) |
| Total | 1,395 (53.0%) | 1,235 (47.0%) |
Education in Woodruff County
School Enrollment in Woodruff County
The most common levels of schooling among the 1,214 students in Woodruff County are high school (389 | 32.0%), elementary school (330 | 27.2%), and middle school (263 | 21.7%).

| School Level | # Students | % Students |
| Nursery / Preschool | 50 | 4.1% |
| Kindergarten | 36 | 3.0% |
| Elementary School | 330 | 27.2% |
| Middle School | 263 | 21.7% |
| High School | 389 | 32.0% |
| College / Undergraduate | 139 | 11.5% |
| Graduate / Professional | 7 | 0.6% |
| Total | 1,214 | 100.0% |
School Enrollment by Age by Funding Source in Woodruff County
Out of a total of 1,214 students who are enrolled in schools in Woodruff County, 61 (5.0%) attend a private institution, while the remaining 1,153 (95.0%) are enrolled in public schools. The age group of 20 to 24 year olds has the highest likelihood of being enrolled in private schools, with 52 (65.0% in the age bracket) enrolled. Conversely, the age group of 3 to 4 year olds has the lowest likelihood of being enrolled in a private school, with 50 (100.0% in the age bracket) attending a public institution.

| Age Bracket | Public School | Private School |
| 3 to 4 Year Olds | 50 (100.0%) | 0 (0.0%) |
| 5 to 9 Year Old | 268 (100.0%) | 0 (0.0%) |
| 10 to 14 Year Olds | 387 (100.0%) | 0 (0.0%) |
| 15 to 17 Year Olds | 293 (100.0%) | 0 (0.0%) |
| 18 to 19 Year Olds | 94 (91.3%) | 9 (8.7%) |
| 20 to 24 Year Olds | 28 (35.0%) | 52 (65.0%) |
| 25 to 34 Year Olds | 26 (100.0%) | 0 (0.0%) |
| 35 Years and over | 7 (100.0%) | 0 (0.0%) |
| Total | 1,153 (95.0%) | 61 (5.0%) |
Educational Attainment by Field of Study in Woodruff County
Education (228 | 31.4%), science & technology (137 | 18.8%), business (78 | 10.7%), bio, nature & agricultural (77 | 10.6%), and arts & humanities (76 | 10.4%) are the most common fields of study among 727 individuals in Woodruff County who have obtained a bachelor's degree or higher.

| Field of Study | # Graduates | % Graduates |
| Computers & Mathematics | 15 | 2.1% |
| Bio, Nature & Agricultural | 77 | 10.6% |
| Physical & Health Sciences | 35 | 4.8% |
| Psychology | 2 | 0.3% |
| Social Sciences | 0 | 0.0% |
| Engineering | 22 | 3.0% |
| Multidisciplinary Studies | 7 | 1.0% |
| Science & Technology | 137 | 18.8% |
| Business | 78 | 10.7% |
| Education | 228 | 31.4% |
| Literature & Languages | 24 | 3.3% |
| Liberal Arts & History | 19 | 2.6% |
| Visual & Performing Arts | 0 | 0.0% |
| Communications | 7 | 1.0% |
| Arts & Humanities | 76 | 10.4% |
| Total | 727 | 100.0% |
Transportation & Commute in Woodruff County
Vehicle Availability by Sex in Woodruff County
The most prevalent vehicle ownership categories in Woodruff County are males with 2 vehicles (678, accounting for 48.7%) and females with 2 vehicles (535, making up 55.0%).

| Vehicles Available | Male | Female |
| No Vehicle | 36 (2.6%) | 21 (1.7%) |
| 1 Vehicle | 184 (13.2%) | 265 (21.5%) |
| 2 Vehicles | 678 (48.7%) | 535 (43.4%) |
| 3 Vehicles | 307 (22.1%) | 241 (19.6%) |
| 4 Vehicles | 101 (7.3%) | 82 (6.7%) |
| 5 or more Vehicles | 86 (6.2%) | 89 (7.2%) |
| Total | 1,392 (100.0%) | 1,233 (100.0%) |
Commute Time in Woodruff County
The most frequently occuring commute durations in Woodruff County are less than 5 minutes (655 commuters, 26.0%), 10 to 14 minutes (353 commuters, 14.0%), and 5 to 9 minutes (352 commuters, 14.0%).

| Commute Time | # Commuters | % Commuters |
| Less than 5 Minutes | 655 | 26.0% |
| 5 to 9 Minutes | 352 | 14.0% |
| 10 to 14 Minutes | 353 | 14.0% |
| 15 to 19 Minutes | 305 | 12.1% |
| 20 to 24 Minutes | 54 | 2.1% |
| 25 to 29 Minutes | 72 | 2.9% |
| 30 to 34 Minutes | 214 | 8.5% |
| 35 to 39 Minutes | 34 | 1.3% |
| 40 to 44 Minutes | 58 | 2.3% |
| 45 to 59 Minutes | 308 | 12.2% |
| 60 to 89 Minutes | 55 | 2.2% |
| 90 or more Minutes | 58 | 2.3% |
Commute Time by Sex in Woodruff County
The most common commute times in Woodruff County are less than 5 minutes (374 commuters, 27.4%) for males and less than 5 minutes (281 commuters, 24.4%) for females.
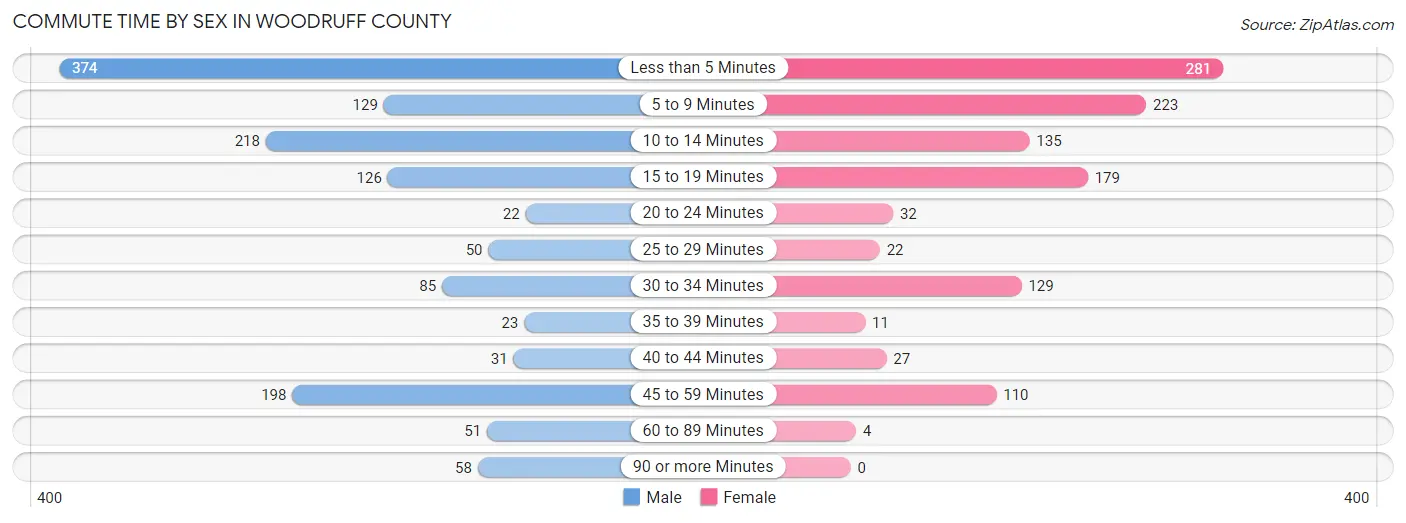
| Commute Time | Male | Female |
| Less than 5 Minutes | 374 (27.4%) | 281 (24.4%) |
| 5 to 9 Minutes | 129 (9.5%) | 223 (19.3%) |
| 10 to 14 Minutes | 218 (16.0%) | 135 (11.7%) |
| 15 to 19 Minutes | 126 (9.2%) | 179 (15.5%) |
| 20 to 24 Minutes | 22 (1.6%) | 32 (2.8%) |
| 25 to 29 Minutes | 50 (3.7%) | 22 (1.9%) |
| 30 to 34 Minutes | 85 (6.2%) | 129 (11.2%) |
| 35 to 39 Minutes | 23 (1.7%) | 11 (0.9%) |
| 40 to 44 Minutes | 31 (2.3%) | 27 (2.3%) |
| 45 to 59 Minutes | 198 (14.5%) | 110 (9.5%) |
| 60 to 89 Minutes | 51 (3.7%) | 4 (0.4%) |
| 90 or more Minutes | 58 (4.3%) | 0 (0.0%) |
Time of Departure to Work by Sex in Woodruff County
The most frequent times of departure to work in Woodruff County are 6:00 AM to 6:29 AM (336, 24.6%) for males and 7:30 AM to 7:59 AM (273, 23.7%) for females.
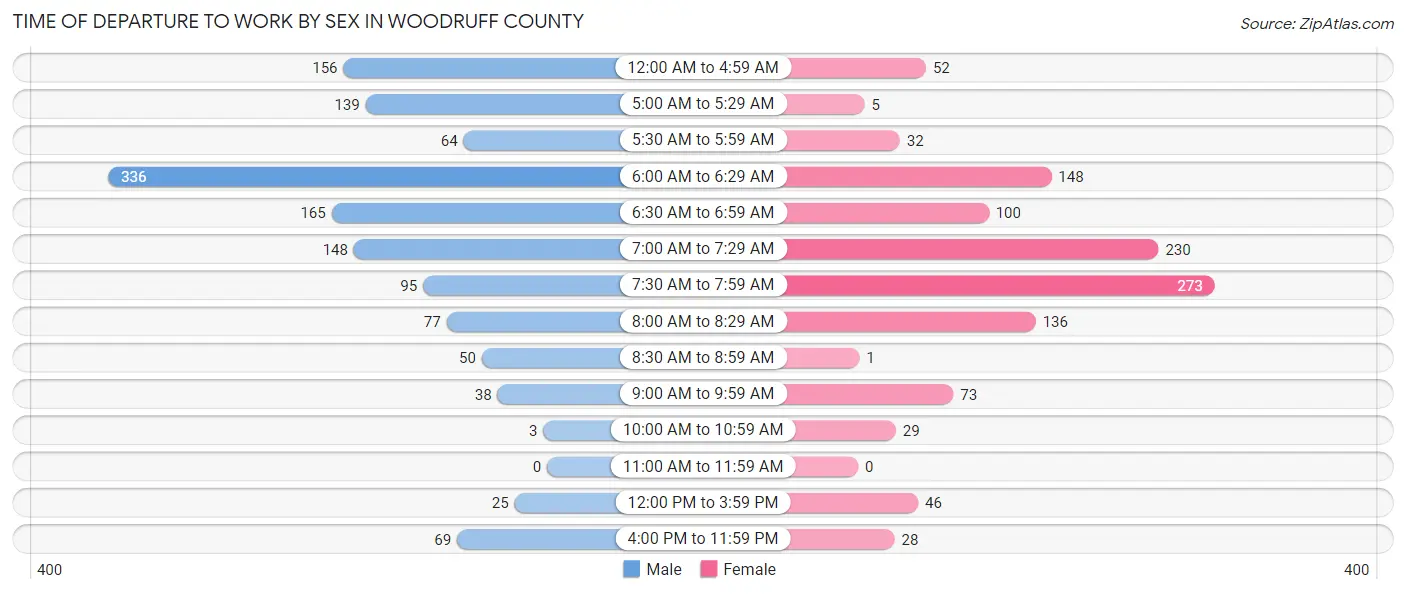
| Time of Departure | Male | Female |
| 12:00 AM to 4:59 AM | 156 (11.4%) | 52 (4.5%) |
| 5:00 AM to 5:29 AM | 139 (10.2%) | 5 (0.4%) |
| 5:30 AM to 5:59 AM | 64 (4.7%) | 32 (2.8%) |
| 6:00 AM to 6:29 AM | 336 (24.6%) | 148 (12.8%) |
| 6:30 AM to 6:59 AM | 165 (12.1%) | 100 (8.7%) |
| 7:00 AM to 7:29 AM | 148 (10.8%) | 230 (20.0%) |
| 7:30 AM to 7:59 AM | 95 (7.0%) | 273 (23.7%) |
| 8:00 AM to 8:29 AM | 77 (5.6%) | 136 (11.8%) |
| 8:30 AM to 8:59 AM | 50 (3.7%) | 1 (0.1%) |
| 9:00 AM to 9:59 AM | 38 (2.8%) | 73 (6.3%) |
| 10:00 AM to 10:59 AM | 3 (0.2%) | 29 (2.5%) |
| 11:00 AM to 11:59 AM | 0 (0.0%) | 0 (0.0%) |
| 12:00 PM to 3:59 PM | 25 (1.8%) | 46 (4.0%) |
| 4:00 PM to 11:59 PM | 69 (5.1%) | 28 (2.4%) |
| Total | 1,365 (100.0%) | 1,153 (100.0%) |
Housing Occupancy in Woodruff County
Occupancy by Ownership in Woodruff County
Of the total 2,626 dwellings in Woodruff County, owner-occupied units account for 1,814 (69.1%), while renter-occupied units make up 812 (30.9%).
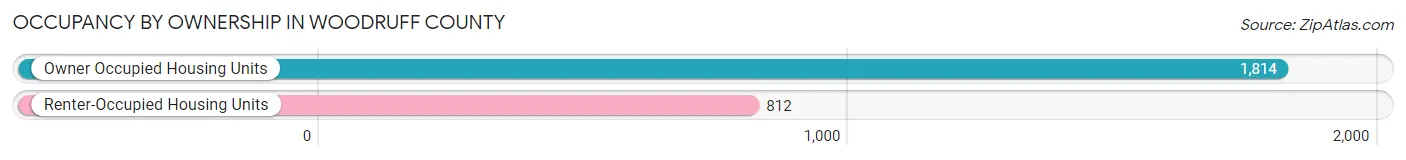
| Occupancy | # Housing Units | % Housing Units |
| Owner Occupied Housing Units | 1,814 | 69.1% |
| Renter-Occupied Housing Units | 812 | 30.9% |
| Total Occupied Housing Units | 2,626 | 100.0% |
Occupancy by Household Size in Woodruff County

| Household Size | # Housing Units | % Housing Units |
| 1-Person Household | 871 | 33.2% |
| 2-Person Household | 975 | 37.1% |
| 3-Person Household | 320 | 12.2% |
| 4+ Person Household | 460 | 17.5% |
| Total Housing Units | 2,626 | 100.0% |
Occupancy by Ownership by Household Size in Woodruff County
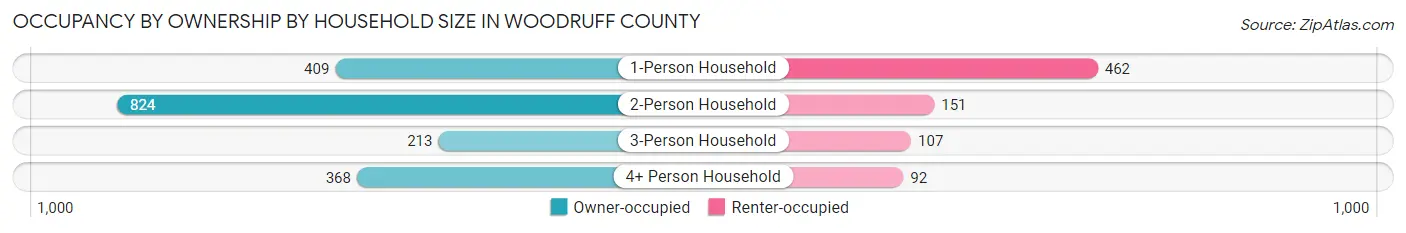
| Household Size | Owner-occupied | Renter-occupied |
| 1-Person Household | 409 (47.0%) | 462 (53.0%) |
| 2-Person Household | 824 (84.5%) | 151 (15.5%) |
| 3-Person Household | 213 (66.6%) | 107 (33.4%) |
| 4+ Person Household | 368 (80.0%) | 92 (20.0%) |
| Total Housing Units | 1,814 (69.1%) | 812 (30.9%) |
Occupancy by Educational Attainment in Woodruff County

| Household Size | Owner-occupied | Renter-occupied |
| Less than High School | 214 (58.5%) | 152 (41.5%) |
| High School Diploma | 845 (69.2%) | 376 (30.8%) |
| College/Associate Degree | 403 (62.4%) | 243 (37.6%) |
| Bachelor's Degree or higher | 352 (89.6%) | 41 (10.4%) |
Occupancy by Age of Householder in Woodruff County

| Age Bracket | # Households | % Households |
| Under 35 Years | 331 | 12.6% |
| 35 to 44 Years | 340 | 13.0% |
| 45 to 54 Years | 497 | 18.9% |
| 55 to 64 Years | 483 | 18.4% |
| 65 to 74 Years | 592 | 22.5% |
| 75 to 84 Years | 299 | 11.4% |
| 85 Years and Over | 84 | 3.2% |
| Total | 2,626 | 100.0% |
Housing Finances in Woodruff County
Median Income by Occupancy in Woodruff County

| Occupancy Type | # Households | Median Income |
| Owner-Occupied | 1,814 (69.1%) | $59,716 |
| Renter-Occupied | 812 (30.9%) | $22,006 |
| Average | 2,626 (100.0%) | $49,608 |
Occupancy by Householder Income Bracket in Woodruff County

| Income Bracket | Owner-occupied | Renter-occupied |
| Less than $5,000 | 12 (0.7%) | 56 (6.9%) |
| $5,000 to $9,999 | 16 (0.9%) | 64 (7.9%) |
| $10,000 to $14,999 | 133 (7.3%) | 139 (17.1%) |
| $15,000 to $19,999 | 88 (4.9%) | 78 (9.6%) |
| $20,000 to $24,999 | 123 (6.8%) | 105 (12.9%) |
| $25,000 to $34,999 | 160 (8.8%) | 107 (13.2%) |
| $35,000 to $49,999 | 180 (9.9%) | 65 (8.0%) |
| $50,000 to $74,999 | 308 (17.0%) | 125 (15.4%) |
| $75,000 to $99,999 | 398 (21.9%) | 61 (7.5%) |
| $100,000 to $149,999 | 181 (10.0%) | 12 (1.5%) |
| $150,000 or more | 215 (11.8%) | 0 (0.0%) |
| Total | 1,814 (100.0%) | 812 (100.0%) |
Monthly Housing Cost Tiers in Woodruff County

| Monthly Cost | Owner-occupied | Renter-occupied |
| Less than $300 | 334 (18.4%) | 164 (20.2%) |
| $300 to $499 | 546 (30.1%) | 119 (14.7%) |
| $500 to $799 | 278 (15.3%) | 325 (40.0%) |
| $800 to $999 | 145 (8.0%) | 68 (8.4%) |
| $1,000 to $1,499 | 463 (25.5%) | 35 (4.3%) |
| $1,500 to $1,999 | 31 (1.7%) | 0 (0.0%) |
| $2,000 to $2,499 | 11 (0.6%) | 0 (0.0%) |
| $2,500 to $2,999 | 5 (0.3%) | 0 (0.0%) |
| $3,000 or more | 1 (0.1%) | 0 (0.0%) |
| Total | 1,814 (100.0%) | 812 (100.0%) |
Physical Housing Characteristics in Woodruff County
Housing Structures in Woodruff County

| Structure Type | # Housing Units | % Housing Units |
| Single Unit, Detached | 1,827 | 69.6% |
| Single Unit, Attached | 17 | 0.6% |
| 2 Unit Apartments | 151 | 5.8% |
| 3 or 4 Unit Apartments | 97 | 3.7% |
| 5 to 9 Unit Apartments | 102 | 3.9% |
| 10 or more Apartments | 53 | 2.0% |
| Mobile Home / Other | 379 | 14.4% |
| Total | 2,626 | 100.0% |
Housing Structures by Occupancy in Woodruff County
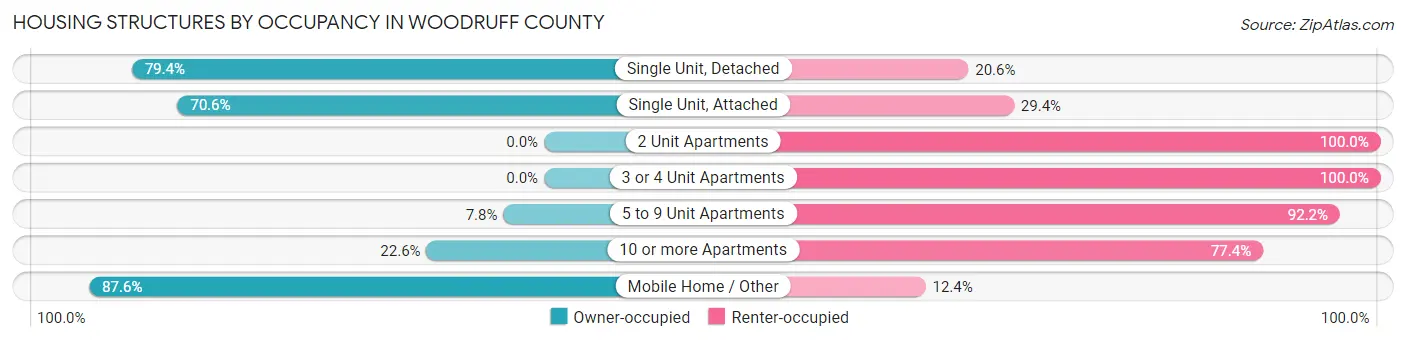
| Structure Type | Owner-occupied | Renter-occupied |
| Single Unit, Detached | 1,450 (79.4%) | 377 (20.6%) |
| Single Unit, Attached | 12 (70.6%) | 5 (29.4%) |
| 2 Unit Apartments | 0 (0.0%) | 151 (100.0%) |
| 3 or 4 Unit Apartments | 0 (0.0%) | 97 (100.0%) |
| 5 to 9 Unit Apartments | 8 (7.8%) | 94 (92.2%) |
| 10 or more Apartments | 12 (22.6%) | 41 (77.4%) |
| Mobile Home / Other | 332 (87.6%) | 47 (12.4%) |
| Total | 1,814 (69.1%) | 812 (30.9%) |
Housing Structures by Number of Rooms in Woodruff County

| Number of Rooms | Owner-occupied | Renter-occupied |
| 1 Room | 8 (0.4%) | 20 (2.5%) |
| 2 or 3 Rooms | 38 (2.1%) | 198 (24.4%) |
| 4 or 5 Rooms | 650 (35.8%) | 423 (52.1%) |
| 6 or 7 Rooms | 646 (35.6%) | 157 (19.3%) |
| 8 or more Rooms | 472 (26.0%) | 14 (1.7%) |
| Total | 1,814 (100.0%) | 812 (100.0%) |
Housing Structure by Heating Type in Woodruff County

| Heating Type | Owner-occupied | Renter-occupied |
| Utility Gas | 745 (41.1%) | 235 (28.9%) |
| Bottled, Tank, or LP Gas | 170 (9.4%) | 11 (1.3%) |
| Electricity | 857 (47.2%) | 558 (68.7%) |
| Fuel Oil or Kerosene | 13 (0.7%) | 0 (0.0%) |
| Coal or Coke | 0 (0.0%) | 0 (0.0%) |
| All other Fuels | 29 (1.6%) | 0 (0.0%) |
| No Fuel Used | 0 (0.0%) | 8 (1.0%) |
| Total | 1,814 (100.0%) | 812 (100.0%) |
Household Vehicle Usage in Woodruff County

| Vehicles per Household | Owner-occupied | Renter-occupied |
| No Vehicle | 55 (3.0%) | 232 (28.6%) |
| 1 Vehicle | 374 (20.6%) | 389 (47.9%) |
| 2 Vehicles | 890 (49.1%) | 150 (18.5%) |
| 3 or more Vehicles | 495 (27.3%) | 41 (5.1%) |
| Total | 1,814 (100.0%) | 812 (100.0%) |
Real Estate & Mortgages in Woodruff County
Real Estate and Mortgage Overview in Woodruff County
| Characteristic | Without Mortgage | With Mortgage |
| Housing Units | 1,080 | 734 |
| Median Property Value | $69,300 | $109,100 |
| Median Household Income | $48,281 | $125 |
| Monthly Housing Costs | $365 | $0 |
| Real Estate Taxes | $556 | $41 |
Property Value by Mortgage Status in Woodruff County

| Property Value | Without Mortgage | With Mortgage |
| Less than $50,000 | 415 (38.4%) | 70 (9.5%) |
| $50,000 to $99,999 | 245 (22.7%) | 223 (30.4%) |
| $100,000 to $299,999 | 350 (32.4%) | 413 (56.3%) |
| $300,000 to $499,999 | 62 (5.7%) | 18 (2.5%) |
| $500,000 to $749,999 | 1 (0.1%) | 0 (0.0%) |
| $750,000 to $999,999 | 7 (0.6%) | 0 (0.0%) |
| $1,000,000 or more | 0 (0.0%) | 10 (1.4%) |
| Total | 1,080 (100.0%) | 734 (100.0%) |
Household Income by Mortgage Status in Woodruff County

| Household Income | Without Mortgage | With Mortgage |
| Less than $10,000 | 28 (2.6%) | 0 (0.0%) |
| $10,000 to $24,999 | 280 (25.9%) | 0 (0.0%) |
| $25,000 to $34,999 | 119 (11.0%) | 64 (8.7%) |
| $35,000 to $49,999 | 135 (12.5%) | 41 (5.6%) |
| $50,000 to $74,999 | 208 (19.3%) | 45 (6.1%) |
| $75,000 to $99,999 | 126 (11.7%) | 100 (13.6%) |
| $100,000 to $149,999 | 94 (8.7%) | 272 (37.1%) |
| $150,000 or more | 90 (8.3%) | 87 (11.8%) |
| Total | 1,080 (100.0%) | 734 (100.0%) |
Property Value to Household Income Ratio in Woodruff County

| Value-to-Income Ratio | Without Mortgage | With Mortgage |
| Less than 2.0x | 651 (60.3%) | 90,714 (12,358.9%) |
| 2.0x to 2.9x | 77 (7.1%) | 541 (73.7%) |
| 3.0x to 3.9x | 104 (9.6%) | 49 (6.7%) |
| 4.0x or more | 236 (21.8%) | 68 (9.3%) |
| Total | 1,080 (100.0%) | 734 (100.0%) |
Real Estate Taxes by Mortgage Status in Woodruff County
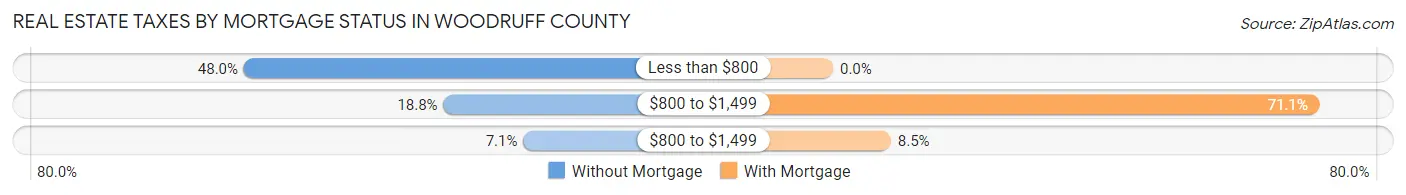
| Property Taxes | Without Mortgage | With Mortgage |
| Less than $800 | 518 (48.0%) | 0 (0.0%) |
| $800 to $1,499 | 203 (18.8%) | 522 (71.1%) |
| $800 to $1,499 | 77 (7.1%) | 62 (8.5%) |
| Total | 1,080 (100.0%) | 734 (100.0%) |
Health & Disability in Woodruff County
Health Insurance Coverage by Age in Woodruff County

| Age Bracket | With Coverage | Without Coverage |
| Under 6 Years | 416 (100.0%) | 0 (0.0%) |
| 6 to 18 Years | 1,051 (96.3%) | 40 (3.7%) |
| 19 to 25 Years | 465 (93.0%) | 35 (7.0%) |
| 26 to 34 Years | 331 (82.1%) | 72 (17.9%) |
| 35 to 44 Years | 573 (83.7%) | 112 (16.4%) |
| 45 to 54 Years | 689 (91.0%) | 68 (9.0%) |
| 55 to 64 Years | 781 (89.3%) | 94 (10.7%) |
| 65 to 74 Years | 879 (100.0%) | 0 (0.0%) |
| 75 Years and older | 529 (100.0%) | 0 (0.0%) |
| Total | 5,714 (93.1%) | 421 (6.9%) |
Health Insurance Coverage by Citizenship Status in Woodruff County
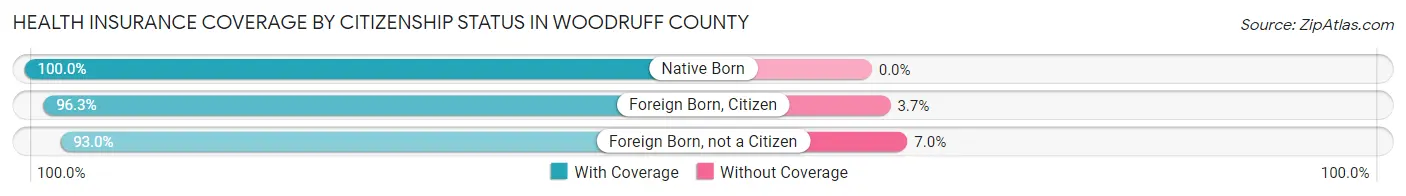
| Citizenship Status | With Coverage | Without Coverage |
| Native Born | 416 (100.0%) | 0 (0.0%) |
| Foreign Born, Citizen | 1,051 (96.3%) | 40 (3.7%) |
| Foreign Born, not a Citizen | 465 (93.0%) | 35 (7.0%) |
Health Insurance Coverage by Household Income in Woodruff County

| Household Income | With Coverage | Without Coverage |
| Under $25,000 | 1,196 (90.9%) | 119 (9.0%) |
| $25,000 to $49,999 | 1,140 (87.3%) | 166 (12.7%) |
| $50,000 to $74,999 | 1,074 (98.0%) | 22 (2.0%) |
| $75,000 to $99,999 | 1,226 (95.1%) | 63 (4.9%) |
| $100,000 and over | 1,078 (95.5%) | 51 (4.5%) |
Public vs Private Health Insurance Coverage by Age in Woodruff County

| Age Bracket | Public Insurance | Private Insurance |
| Under 6 | 357 (85.8%) | 61 (14.7%) |
| 6 to 18 Years | 597 (54.7%) | 497 (45.6%) |
| 19 to 25 Years | 144 (28.8%) | 343 (68.6%) |
| 25 to 34 Years | 86 (21.3%) | 264 (65.5%) |
| 35 to 44 Years | 111 (16.2%) | 462 (67.4%) |
| 45 to 54 Years | 181 (23.9%) | 518 (68.4%) |
| 55 to 64 Years | 288 (32.9%) | 507 (57.9%) |
| 65 to 74 Years | 845 (96.1%) | 345 (39.3%) |
| 75 Years and over | 529 (100.0%) | 175 (33.1%) |
| Total | 3,138 (51.1%) | 3,172 (51.7%) |
Disability Status by Sex by Age in Woodruff County

| Age Bracket | Male | Female |
| Under 5 Years | 0 (0.0%) | 0 (0.0%) |
| 5 to 17 Years | 23 (4.5%) | 35 (7.4%) |
| 18 to 34 Years | 121 (22.3%) | 18 (3.5%) |
| 35 to 64 Years | 163 (14.5%) | 203 (17.1%) |
| 65 to 74 Years | 127 (29.1%) | 144 (32.6%) |
| 75 Years and over | 153 (77.3%) | 122 (36.9%) |
Disability Class by Sex by Age in Woodruff County
Disability Class: Hearing Difficulty

| Age Bracket | Male | Female |
| Under 5 Years | 0 (0.0%) | 0 (0.0%) |
| 5 to 17 Years | 2 (0.4%) | 0 (0.0%) |
| 18 to 34 Years | 18 (3.3%) | 0 (0.0%) |
| 35 to 64 Years | 36 (3.2%) | 23 (1.9%) |
| 65 to 74 Years | 31 (7.1%) | 30 (6.8%) |
| 75 Years and over | 96 (48.5%) | 78 (23.6%) |
Disability Class: Vision Difficulty

| Age Bracket | Male | Female |
| Under 5 Years | 0 (0.0%) | 0 (0.0%) |
| 5 to 17 Years | 7 (1.4%) | 3 (0.6%) |
| 18 to 34 Years | 22 (4.1%) | 7 (1.3%) |
| 35 to 64 Years | 80 (7.1%) | 47 (4.0%) |
| 65 to 74 Years | 31 (7.1%) | 33 (7.5%) |
| 75 Years and over | 10 (5.1%) | 64 (19.3%) |
Disability Class: Cognitive Difficulty
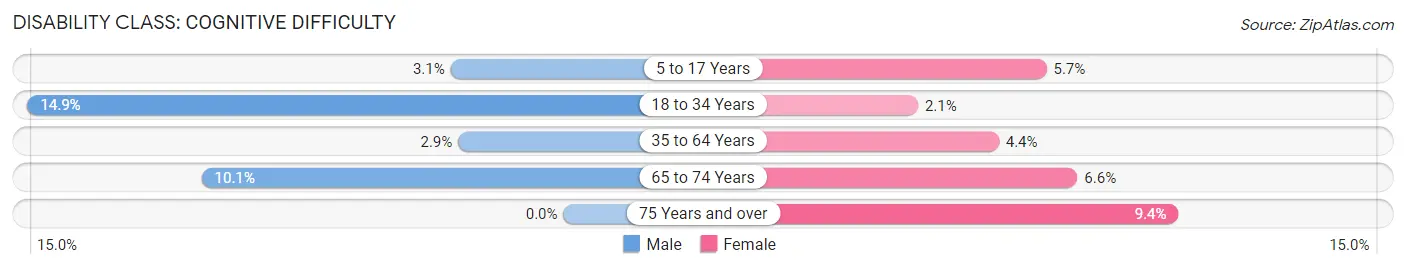
| Age Bracket | Male | Female |
| 5 to 17 Years | 16 (3.1%) | 27 (5.7%) |
| 18 to 34 Years | 81 (14.9%) | 11 (2.1%) |
| 35 to 64 Years | 33 (2.9%) | 52 (4.4%) |
| 65 to 74 Years | 44 (10.1%) | 29 (6.6%) |
| 75 Years and over | 0 (0.0%) | 31 (9.4%) |
Disability Class: Ambulatory Difficulty

| Age Bracket | Male | Female |
| 5 to 17 Years | 2 (0.4%) | 5 (1.1%) |
| 18 to 34 Years | 10 (1.8%) | 0 (0.0%) |
| 35 to 64 Years | 113 (10.0%) | 144 (12.1%) |
| 65 to 74 Years | 87 (19.9%) | 112 (25.3%) |
| 75 Years and over | 98 (49.5%) | 78 (23.6%) |
Disability Class: Self-Care Difficulty

| Age Bracket | Male | Female |
| 5 to 17 Years | 3 (0.6%) | 7 (1.5%) |
| 18 to 34 Years | 10 (1.8%) | 0 (0.0%) |
| 35 to 64 Years | 31 (2.8%) | 22 (1.8%) |
| 65 to 74 Years | 15 (3.4%) | 34 (7.7%) |
| 75 Years and over | 11 (5.6%) | 38 (11.5%) |
Technology Access in Woodruff County
Computing Device Access in Woodruff County

| Device Type | # Households | % Households |
| Desktop or Laptop | 1,394 | 53.1% |
| Smartphone | 1,889 | 71.9% |
| Tablet | 953 | 36.3% |
| No Computing Device | 632 | 24.1% |
| Total | 2,626 | 100.0% |
Internet Access in Woodruff County
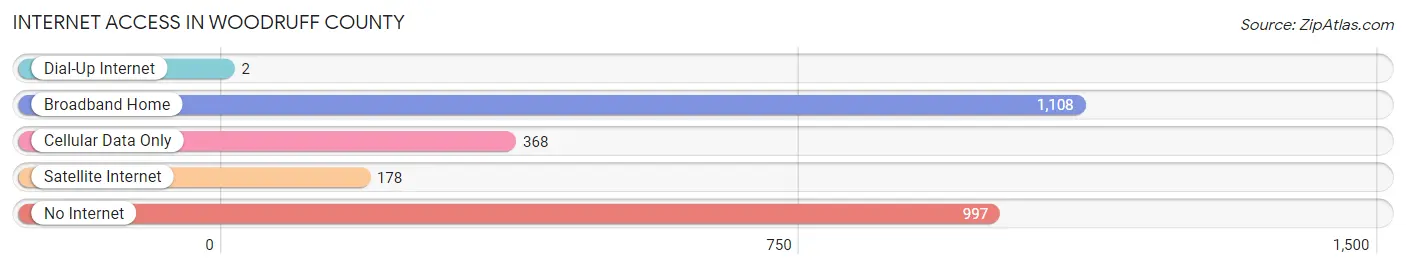
| Internet Type | # Households | % Households |
| Dial-Up Internet | 2 | 0.1% |
| Broadband Home | 1,108 | 42.2% |
| Cellular Data Only | 368 | 14.0% |
| Satellite Internet | 178 | 6.8% |
| No Internet | 997 | 38.0% |
| Total | 2,626 | 100.0% |
Woodruff County Summary
Introduction
Located in the Arkansas Delta region of the state, Woodruff County is a rural county with a population of just over 7,000 people. The county is home to a variety of industries, including agriculture, manufacturing, and tourism. The county is also home to a number of historical sites, including the historic town of Augusta, which was founded in 1837.
Geography
Woodruff County is located in the Arkansas Delta region of the state, and is bordered by Monroe County to the north, St. Francis County to the east, Cross County to the south, and Poinsett County to the west. The county covers an area of 576 square miles, and is mostly flat, with some rolling hills in the northern part of the county. The Cache River runs through the county, and is a popular destination for fishing and boating.
Demographics
As of the 2010 census, Woodruff County had a population of 7,260 people. The population is spread out, with the largest population centers being Augusta, Cotton Plant, and McCrory. The racial makeup of the county is 79.3% White, 18.3% Black or African American, 0.3% Native American, 0.2% Asian, 0.1% Pacific Islander, 0.7% from other races, and 1.2% from two or more races. The median household income in the county is $30,945, and the median age is 38.
Economy
Woodruff County is a rural county, and the economy is largely based on agriculture. The county is home to a variety of crops, including cotton, soybeans, corn, and rice. The county is also home to a number of manufacturing companies, including a furniture factory, a wood products plant, and a plastics plant. Tourism is also an important part of the economy, with a number of historical sites, such as the historic town of Augusta, and the Cache River National Wildlife Refuge.
Conclusion
Woodruff County is a rural county located in the Arkansas Delta region of the state. The county is home to a variety of industries, including agriculture, manufacturing, and tourism. The county is also home to a number of historical sites, including the historic town of Augusta. The population of the county is just over 7,000 people, and the median household income is $30,945. The economy of the county is largely based on agriculture, manufacturing, and tourism.
Common Questions
What is the Total Population of Woodruff County?
Total Population of Woodruff County is 6,259.
What is the Total Male Population of Woodruff County?
Total Male Population of Woodruff County is 3,105.
What is the Total Female Population of Woodruff County?
Total Female Population of Woodruff County is 3,154.
What is the Ratio of Males per 100 Females in Woodruff County?
There are 98.45 Males per 100 Females in Woodruff County.
What is the Ratio of Females per 100 Males in Woodruff County?
There are 101.58 Females per 100 Males in Woodruff County.
What is the Median Population Age in Woodruff County?
Median Population Age in Woodruff County is 45.2 Years.
What is the Average Family Size in Woodruff County
Average Family Size in Woodruff County is 3.0 People.
What is the Average Household Size in Woodruff County
Average Household Size in Woodruff County is 2.3 People.
What is Per Capita Income in Woodruff County?
Per Capita income in Woodruff County is $29,216.
What is the Median Family Income in Woodruff County?
Median Family Income in Woodruff County is $63,850.
What is the Median Household income in Woodruff County?
Median Household Income in Woodruff County is $49,608.
What is Income or Wage Gap in Woodruff County?
Income or Wage Gap in Woodruff County is 34.9%.
Women in Woodruff County earn 65.1 cents for every dollar earned by a man.
What is Family Income Deficit in Woodruff County?
Family Income Deficit in Woodruff County is $9,743.
Families that are below poverty line in Woodruff County earn $9,743 less on average than the poverty threshold level.
What is Inequality or Gini Index in Woodruff County?
Inequality or Gini Index in Woodruff County is 0.48.
How Large is the Labor Force in Woodruff County?
There are 2,818 People in the Labor Forcein in Woodruff County.
What is the Percentage of People in the Labor Force in Woodruff County?
55.5% of People are in the Labor Force in Woodruff County.
What is the Unemployment Rate in Woodruff County?
Unemployment Rate in Woodruff County is 6.7%.