Van Buren County, AR
Van Buren County Map

Van Buren County Overview
15,900
TOTAL POPULATION
7,814
MALE POPULATION
8,086
FEMALE POPULATION
96.64
MALES / 100 FEMALES
103.48
FEMALES / 100 MALES
49.7
MEDIAN AGE
2.8
AVG FAMILY SIZE
2.3
AVG HOUSEHOLD SIZE
$26,183
PER CAPITA INCOME
$59,654
AVG FAMILY INCOME
$45,768
AVG HOUSEHOLD INCOME
23.8%
WAGE / INCOME GAP [ % ]
76.2¢/ $1
WAGE / INCOME GAP [ $ ]
$8,610
FAMILY INCOME DEFICIT
0.44
INEQUALITY / GINI INDEX
5,691
LABOR FORCE [ PEOPLE ]
43.0%
PERCENT IN LABOR FORCE
4.7%
UNEMPLOYMENT RATE
Van Buren County Area Codes
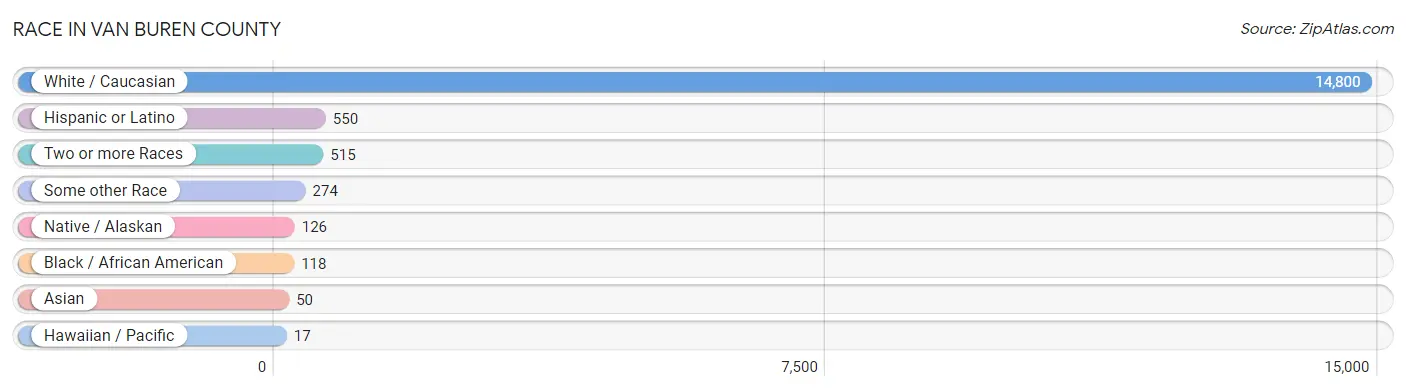
Race in Van Buren County
The most populous races in Van Buren County are White / Caucasian (14,800 | 93.1%), Hispanic or Latino (550 | 3.5%), and Two or more Races (515 | 3.2%).
| Race | # Population | % Population |
| Asian | 50 | 0.3% |
| Black / African American | 118 | 0.7% |
| Hawaiian / Pacific | 17 | 0.1% |
| Hispanic or Latino | 550 | 3.5% |
| Native / Alaskan | 126 | 0.8% |
| White / Caucasian | 14,800 | 93.1% |
| Two or more Races | 515 | 3.2% |
| Some other Race | 274 | 1.7% |
| Total | 15,900 | 100.0% |
Ancestry in Van Buren County
The most populous ancestries reported in Van Buren County are Irish (2,864 | 18.0%), American (2,808 | 17.7%), German (1,992 | 12.5%), English (1,949 | 12.3%), and French (481 | 3.0%), together accounting for 63.5% of all Van Buren County residents.

| Ancestry | # Population | % Population |
| African | 1 | 0.0% |
| American | 2,808 | 17.7% |
| Austrian | 16 | 0.1% |
| Bhutanese | 70 | 0.4% |
| British | 71 | 0.4% |
| Cajun | 17 | 0.1% |
| Canadian | 25 | 0.2% |
| Central American | 9 | 0.1% |
| Cherokee | 134 | 0.8% |
| Cheyenne | 19 | 0.1% |
| Choctaw | 36 | 0.2% |
| Creek | 70 | 0.4% |
| Czech | 81 | 0.5% |
| Danish | 25 | 0.2% |
| Dutch | 275 | 1.7% |
| English | 1,949 | 12.3% |
| European | 304 | 1.9% |
| Finnish | 20 | 0.1% |
| French | 481 | 3.0% |
| French Canadian | 9 | 0.1% |
| German | 1,992 | 12.5% |
| Greek | 5 | 0.0% |
| Guamanian / Chamorro | 17 | 0.1% |
| Hungarian | 8 | 0.1% |
| Irish | 2,864 | 18.0% |
| Italian | 384 | 2.4% |
| Korean | 32 | 0.2% |
| Mexican | 474 | 3.0% |
| Nicaraguan | 9 | 0.1% |
| Norwegian | 104 | 0.6% |
| Polish | 193 | 1.2% |
| Portuguese | 14 | 0.1% |
| Puerto Rican | 25 | 0.2% |
| Scandinavian | 77 | 0.5% |
| Scotch-Irish | 273 | 1.7% |
| Scottish | 394 | 2.5% |
| Spanish | 27 | 0.2% |
| Sri Lankan | 6 | 0.0% |
| Subsaharan African | 1 | 0.0% |
| Swedish | 65 | 0.4% |
| Swiss | 12 | 0.1% |
| Turkish | 6 | 0.0% |
| Welsh | 111 | 0.7% | View All 43 Rows |
Immigrants in Van Buren County
The most numerous immigrant groups reported in Van Buren County came from Latin America (110 | 0.7%), Central America (82 | 0.5%), Europe (78 | 0.5%), Asia (43 | 0.3%), and Guatemala (38 | 0.2%), together accounting for 2.2% of all Van Buren County residents.

| Immigration Origin | # Population | % Population |
| Argentina | 8 | 0.1% |
| Asia | 43 | 0.3% |
| Canada | 8 | 0.1% |
| Central America | 82 | 0.5% |
| Denmark | 13 | 0.1% |
| Eastern Asia | 11 | 0.1% |
| Eastern Europe | 16 | 0.1% |
| England | 7 | 0.0% |
| Europe | 78 | 0.5% |
| Germany | 15 | 0.1% |
| Guatemala | 38 | 0.2% |
| Japan | 11 | 0.1% |
| Latin America | 110 | 0.7% |
| Lithuania | 8 | 0.1% |
| Mexico | 35 | 0.2% |
| Nicaragua | 9 | 0.1% |
| Northern Europe | 20 | 0.1% |
| Peru | 20 | 0.1% |
| Philippines | 32 | 0.2% |
| Poland | 8 | 0.1% |
| South America | 28 | 0.2% |
| South Eastern Asia | 32 | 0.2% |
| Southern Europe | 27 | 0.2% |
| Spain | 27 | 0.2% |
| Western Europe | 15 | 0.1% | View All 25 Rows |
Sex and Age in Van Buren County
Sex and Age in Van Buren County
The most populous age groups in Van Buren County are 55 to 59 Years (649 | 8.3%) for men and 55 to 59 Years (757 | 9.4%) for women.

| Age Bracket | Male | Female |
| Under 5 Years | 389 (5.0%) | 305 (3.8%) |
| 5 to 9 Years | 400 (5.1%) | 596 (7.4%) |
| 10 to 14 Years | 455 (5.8%) | 249 (3.1%) |
| 15 to 19 Years | 498 (6.4%) | 578 (7.1%) |
| 20 to 24 Years | 373 (4.8%) | 288 (3.6%) |
| 25 to 29 Years | 385 (4.9%) | 300 (3.7%) |
| 30 to 34 Years | 316 (4.0%) | 366 (4.5%) |
| 35 to 39 Years | 272 (3.5%) | 404 (5.0%) |
| 40 to 44 Years | 494 (6.3%) | 429 (5.3%) |
| 45 to 49 Years | 514 (6.6%) | 417 (5.2%) |
| 50 to 54 Years | 517 (6.6%) | 470 (5.8%) |
| 55 to 59 Years | 649 (8.3%) | 757 (9.4%) |
| 60 to 64 Years | 632 (8.1%) | 590 (7.3%) |
| 65 to 69 Years | 628 (8.0%) | 637 (7.9%) |
| 70 to 74 Years | 506 (6.5%) | 541 (6.7%) |
| 75 to 79 Years | 415 (5.3%) | 430 (5.3%) |
| 80 to 84 Years | 175 (2.2%) | 389 (4.8%) |
| 85 Years and over | 196 (2.5%) | 340 (4.2%) |
| Total | 7,814 (100.0%) | 8,086 (100.0%) |
Families and Households in Van Buren County
Median Family Size in Van Buren County
The median family size in Van Buren County is 2.83 persons per family, with married-couple families (3,231 | 73.1%) accounting for the largest median family size of 2.87 persons per family. On the other hand, single male/father families (335 | 7.6%) represent the smallest median family size with 2.47 persons per family.

| Family Type | # Families | Family Size |
| Married-Couple | 3,231 (73.1%) | 2.87 |
| Single Male/Father | 335 (7.6%) | 2.47 |
| Single Female/Mother | 852 (19.3%) | 2.86 |
| Total Families | 4,418 (100.0%) | 2.83 |
Median Household Size in Van Buren County
The median household size in Van Buren County is 2.30 persons per household, with single female/mother households (852 | 12.5%) accounting for the largest median household size of 3.16 persons per household. non-family households (2,415 | 35.3%) represent the smallest median household size with 1.13 persons per household.

| Household Type | # Households | Household Size |
| Married-Couple | 3,231 (47.3%) | 2.90 |
| Single Male/Father | 335 (4.9%) | 2.75 |
| Single Female/Mother | 852 (12.5%) | 3.16 |
| Non-family | 2,415 (35.3%) | 1.13 |
| Total Households | 6,833 (100.0%) | 2.30 |
Household Size by Marriage Status in Van Buren County
Out of a total of 6,833 households in Van Buren County, 4,418 (64.7%) are family households, while 2,415 (35.3%) are nonfamily households. The most numerous type of family households are 2-person households, comprising 2,541, and the most common type of nonfamily households are 1-person households, comprising 2,131.

| Household Size | Family Households | Nonfamily Households |
| 1-Person Households | - | 2,131 (31.2%) |
| 2-Person Households | 2,541 (37.2%) | 249 (3.6%) |
| 3-Person Households | 833 (12.2%) | 14 (0.2%) |
| 4-Person Households | 710 (10.4%) | 21 (0.3%) |
| 5-Person Households | 181 (2.6%) | 0 (0.0%) |
| 6-Person Households | 98 (1.4%) | 0 (0.0%) |
| 7+ Person Households | 55 (0.8%) | 0 (0.0%) |
| Total | 4,418 (64.7%) | 2,415 (35.3%) |
Female Fertility in Van Buren County
Fertility by Age in Van Buren County
Average fertility rate in Van Buren County is 74.0 births per 1,000 women. Women in the age bracket of 20 to 34 years have the highest fertility rate with 182.0 births per 1,000 women. Women in the age bracket of 20 to 34 years acount for 81.7% of all women with births.

| Age Bracket | Women with Births | Births / 1,000 Women |
| 15 to 19 years | 0 (0.0%) | 0.0 |
| 20 to 34 years | 174 (81.7%) | 182.0 |
| 35 to 50 years | 39 (18.3%) | 29.0 |
| Total | 213 (100.0%) | 74.0 |
Fertility by Age by Marriage Status in Van Buren County
77.5% of women with births (213) in Van Buren County are married. The highest percentage of unmarried women with births falls into 20 to 34 years age bracket with 27.6% of them unmarried at the time of birth, while the lowest percentage of unmarried women with births belong to 35 to 50 years age bracket with 0.0% of them unmarried.

| Age Bracket | Married | Unmarried |
| 15 to 19 years | 0 (0.0%) | 0 (0.0%) |
| 20 to 34 years | 126 (72.4%) | 48 (27.6%) |
| 35 to 50 years | 39 (100.0%) | 0 (0.0%) |
| Total | 165 (77.5%) | 48 (22.5%) |
Fertility by Education in Van Buren County

| Educational Attainment | Women with Births | Births / 1,000 Women |
| Less than High School | 37 (17.4%) | 46.0 |
| High School Diploma | 65 (30.5%) | 76.0 |
| College or Associate's Degree | 83 (39.0%) | 98.0 |
| Bachelor's Degree | 0 (0.0%) | 0.0 |
| Graduate Degree | 28 (13.2%) | 286.0 |
| Total | 213 (100.0%) | 74.0 |
Fertility by Education by Marriage Status in Van Buren County
22.5% of women with births in Van Buren County are unmarried. Women with the educational attainment of high school diploma are most likely to be married with 100.0% of them married at childbirth, while women with the educational attainment of less than high school are least likely to be married with 75.7% of them unmarried at childbirth.

| Educational Attainment | Married | Unmarried |
| Less than High School | 9 (24.3%) | 28 (75.7%) |
| High School Diploma | 65 (100.0%) | 0 (0.0%) |
| College or Associate's Degree | 63 (75.9%) | 20 (24.1%) |
| Bachelor's Degree | 0 (0.0%) | 0 (0.0%) |
| Graduate Degree | 28 (100.0%) | 0 (0.0%) |
| Total | 165 (77.5%) | 48 (22.5%) |
Income in Van Buren County
Income Overview in Van Buren County
Per Capita Income in Van Buren County is $26,183, while median incomes of families and households are $59,654 and $45,768 respectively.
| Characteristic | Number | Measure |
| Per Capita Income | 15,900 | $26,183 |
| Median Family Income | 4,418 | $59,654 |
| Mean Family Income | 4,418 | $70,334 |
| Median Household Income | 6,833 | $45,768 |
| Mean Household Income | 6,833 | $59,684 |
| Income Deficit | 4,418 | $8,610 |
| Wage / Income Gap (%) | 15,900 | 23.80% |
| Wage / Income Gap ($) | 15,900 | 76.20¢ per $1 |
| Gini / Inequality Index | 15,900 | 0.44 |
Earnings by Sex in Van Buren County
Average Earnings in Van Buren County are $28,411, $33,424 for men and $25,470 for women, a difference of 23.8%.

| Sex | Number | Average Earnings |
| Male | 3,178 (50.7%) | $33,424 |
| Female | 3,090 (49.3%) | $25,470 |
| Total | 6,268 (100.0%) | $28,411 |
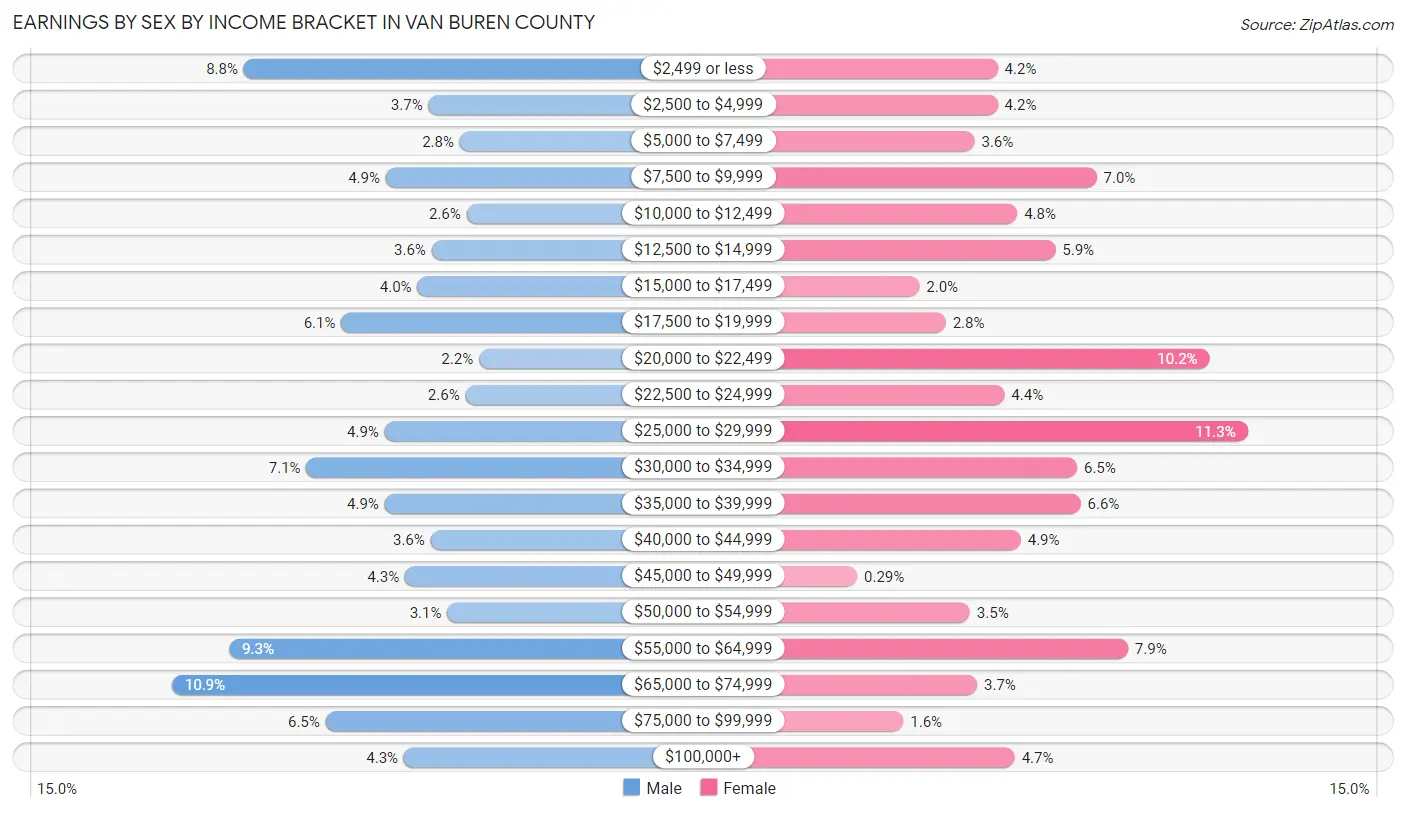
Earnings by Sex by Income Bracket in Van Buren County
The most common earnings brackets in Van Buren County are $65,000 to $74,999 for men (345 | 10.9%) and $25,000 to $29,999 for women (348 | 11.3%).
| Income | Male | Female |
| $2,499 or less | 281 (8.8%) | 131 (4.2%) |
| $2,500 to $4,999 | 116 (3.6%) | 131 (4.2%) |
| $5,000 to $7,499 | 88 (2.8%) | 111 (3.6%) |
| $7,500 to $9,999 | 154 (4.9%) | 217 (7.0%) |
| $10,000 to $12,499 | 82 (2.6%) | 148 (4.8%) |
| $12,500 to $14,999 | 113 (3.6%) | 181 (5.9%) |
| $15,000 to $17,499 | 126 (4.0%) | 63 (2.0%) |
| $17,500 to $19,999 | 194 (6.1%) | 86 (2.8%) |
| $20,000 to $22,499 | 71 (2.2%) | 315 (10.2%) |
| $22,500 to $24,999 | 83 (2.6%) | 137 (4.4%) |
| $25,000 to $29,999 | 155 (4.9%) | 348 (11.3%) |
| $30,000 to $34,999 | 225 (7.1%) | 200 (6.5%) |
| $35,000 to $39,999 | 155 (4.9%) | 203 (6.6%) |
| $40,000 to $44,999 | 114 (3.6%) | 151 (4.9%) |
| $45,000 to $49,999 | 137 (4.3%) | 9 (0.3%) |
| $50,000 to $54,999 | 99 (3.1%) | 107 (3.5%) |
| $55,000 to $64,999 | 294 (9.2%) | 244 (7.9%) |
| $65,000 to $74,999 | 345 (10.9%) | 113 (3.7%) |
| $75,000 to $99,999 | 208 (6.5%) | 49 (1.6%) |
| $100,000+ | 138 (4.3%) | 146 (4.7%) |
| Total | 3,178 (100.0%) | 3,090 (100.0%) |
Earnings by Sex by Educational Attainment in Van Buren County
Average earnings in Van Buren County are $37,319 for men and $28,081 for women, a difference of 24.7%. Men with an educational attainment of college or associate's degree enjoy the highest average annual earnings of $55,865, while those with less than high school education earn the least with $19,147. Women with an educational attainment of graduate degree earn the most with the average annual earnings of $59,821, while those with less than high school education have the smallest earnings of $21,213.

| Educational Attainment | Male Income | Female Income |
| Less than High School | $19,147 | $21,213 |
| High School Diploma | $42,097 | $24,980 |
| College or Associate's Degree | $55,865 | $32,188 |
| Bachelor's Degree | $34,657 | $50,326 |
| Graduate Degree | - | - |
| Total | $37,319 | $28,081 |
Family Income in Van Buren County
Family Income Brackets in Van Buren County
According to the Van Buren County family income data, there are 1,047 families falling into the $50,000 to $74,999 income range, which is the most common income bracket and makes up 23.7% of all families. Conversely, the $200,000+ income bracket is the least frequent group with only 93 families (2.1%) belonging to this category.

| Income Bracket | # Families | % Families |
| Less than $10,000 | 203 | 4.6% |
| $10,000 to $14,999 | 146 | 3.3% |
| $15,000 to $24,999 | 393 | 8.9% |
| $25,000 to $34,999 | 406 | 9.2% |
| $35,000 to $49,999 | 676 | 15.3% |
| $50,000 to $74,999 | 1,047 | 23.7% |
| $75,000 to $99,999 | 729 | 16.5% |
| $100,000 to $149,999 | 486 | 11.0% |
| $150,000 to $199,999 | 234 | 5.3% |
| $200,000+ | 93 | 2.1% |
Family Income by Famaliy Size in Van Buren County
7+ person families (42 | 0.9%) account for the highest median family income in Van Buren County with $183,306 per family, while 2-person families (2,662 | 60.3%) have the highest median income of $29,054 per family member.

| Income Bracket | # Families | Median Income |
| 2-Person Families | 2,662 (60.3%) | $58,108 |
| 3-Person Families | 882 (20.0%) | $64,200 |
| 4-Person Families | 545 (12.3%) | $44,821 |
| 5-Person Families | 199 (4.5%) | $60,813 |
| 6-Person Families | 88 (2.0%) | $84,000 |
| 7+ Person Families | 42 (0.9%) | $183,306 |
| Total | 4,418 (100.0%) | $59,654 |
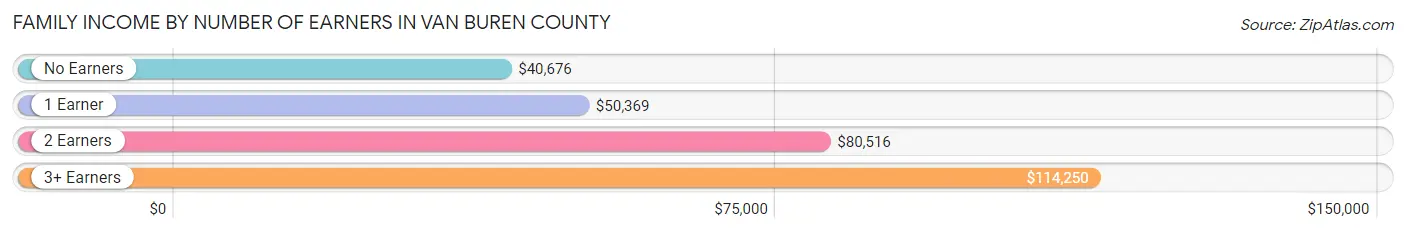
Family Income by Number of Earners in Van Buren County
The median family income in Van Buren County is $59,654, with families comprising 3+ earners (208) having the highest median family income of $114,250, while families with no earners (1,370) have the lowest median family income of $40,676, accounting for 4.7% and 31.0% of families, respectively.
| Number of Earners | # Families | Median Income |
| No Earners | 1,370 (31.0%) | $40,676 |
| 1 Earner | 1,310 (29.6%) | $50,369 |
| 2 Earners | 1,530 (34.6%) | $80,516 |
| 3+ Earners | 208 (4.7%) | $114,250 |
| Total | 4,418 (100.0%) | $59,654 |
Household Income in Van Buren County
Household Income Brackets in Van Buren County
With 1,196 households falling in the category, the $50,000 to $74,999 income range is the most frequent in Van Buren County, accounting for 17.5% of all households. In contrast, only 96 households (1.4%) fall into the $200,000+ income bracket, making it the least populous group.

| Income Bracket | # Households | % Households |
| Less than $10,000 | 526 | 7.7% |
| $10,000 to $14,999 | 458 | 6.7% |
| $15,000 to $24,999 | 854 | 12.5% |
| $25,000 to $34,999 | 827 | 12.1% |
| $35,000 to $49,999 | 1,025 | 15.0% |
| $50,000 to $74,999 | 1,196 | 17.5% |
| $75,000 to $99,999 | 861 | 12.6% |
| $100,000 to $149,999 | 752 | 11.0% |
| $150,000 to $199,999 | 232 | 3.4% |
| $200,000+ | 96 | 1.4% |
Household Income by Householder Age in Van Buren County
The median household income in Van Buren County is $45,768, with the highest median household income of $54,167 found in the 25 to 44 years age bracket for the primary householder. A total of 1,416 households (20.7%) fall into this category. Meanwhile, the 15 to 24 years age bracket for the primary householder has the lowest median household income of $0, with 111 households (1.6%) in this group.

| Income Bracket | # Households | Median Income |
| 15 to 24 Years | 111 (1.6%) | $0 |
| 25 to 44 Years | 1,416 (20.7%) | $54,167 |
| 45 to 64 Years | 2,623 (38.4%) | $51,671 |
| 65+ Years | 2,683 (39.3%) | $37,842 |
| Total | 6,833 (100.0%) | $45,768 |
Poverty in Van Buren County
Income Below Poverty by Sex and Age in Van Buren County
With 17.7% poverty level for males and 20.0% for females among the residents of Van Buren County, under 5 year old males and 18 to 24 year old females are the most vulnerable to poverty, with 139 males (36.8%) and 203 females (40.4%) in their respective age groups living below the poverty level.

| Age Bracket | Male | Female |
| Under 5 Years | 139 (36.8%) | 123 (40.3%) |
| 5 Years | 0 (0.0%) | 16 (28.6%) |
| 6 to 11 Years | 87 (17.8%) | 118 (18.6%) |
| 12 to 14 Years | 7 (2.5%) | 60 (39.0%) |
| 15 Years | 0 (0.0%) | 14 (6.0%) |
| 16 and 17 Years | 51 (17.5%) | 49 (37.1%) |
| 18 to 24 Years | 90 (16.7%) | 203 (40.4%) |
| 25 to 34 Years | 193 (28.5%) | 109 (16.4%) |
| 35 to 44 Years | 80 (10.5%) | 175 (21.0%) |
| 45 to 54 Years | 166 (16.3%) | 238 (26.8%) |
| 55 to 64 Years | 278 (22.2%) | 208 (15.4%) |
| 65 to 74 Years | 165 (14.8%) | 191 (16.5%) |
| 75 Years and over | 109 (14.1%) | 102 (9.2%) |
| Total | 1,365 (17.7%) | 1,606 (20.0%) |
Income Above Poverty by Sex and Age in Van Buren County
According to the poverty statistics in Van Buren County, males aged 5 years and females aged 15 years are the age groups that are most secure financially, with 100.0% of males and 94.0% of females in these age groups living above the poverty line.

| Age Bracket | Male | Female |
| Under 5 Years | 239 (63.2%) | 182 (59.7%) |
| 5 Years | 74 (100.0%) | 40 (71.4%) |
| 6 to 11 Years | 403 (82.2%) | 517 (81.4%) |
| 12 to 14 Years | 269 (97.5%) | 94 (61.0%) |
| 15 Years | 40 (100.0%) | 218 (94.0%) |
| 16 and 17 Years | 240 (82.5%) | 83 (62.9%) |
| 18 to 24 Years | 450 (83.3%) | 299 (59.6%) |
| 25 to 34 Years | 483 (71.5%) | 557 (83.6%) |
| 35 to 44 Years | 685 (89.5%) | 658 (79.0%) |
| 45 to 54 Years | 853 (83.7%) | 649 (73.2%) |
| 55 to 64 Years | 975 (77.8%) | 1,139 (84.6%) |
| 65 to 74 Years | 951 (85.2%) | 970 (83.6%) |
| 75 Years and over | 662 (85.9%) | 1,006 (90.8%) |
| Total | 6,324 (82.3%) | 6,412 (80.0%) |
Income Below Poverty Among Married-Couple Families in Van Buren County
The poverty statistics for married-couple families in Van Buren County show that 7.9% or 255 of the total 3,231 families live below the poverty line. Families with 3 or 4 children have the highest poverty rate of 30.5%, comprising of 29 families. On the other hand, families with 5 or more children have the lowest poverty rate of 0.0%, which includes 0 families.

| Children | Above Poverty | Below Poverty |
| No Children | 1,946 (92.0%) | 168 (8.0%) |
| 1 or 2 Children | 929 (94.1%) | 58 (5.9%) |
| 3 or 4 Children | 66 (69.5%) | 29 (30.5%) |
| 5 or more Children | 35 (100.0%) | 0 (0.0%) |
| Total | 2,976 (92.1%) | 255 (7.9%) |
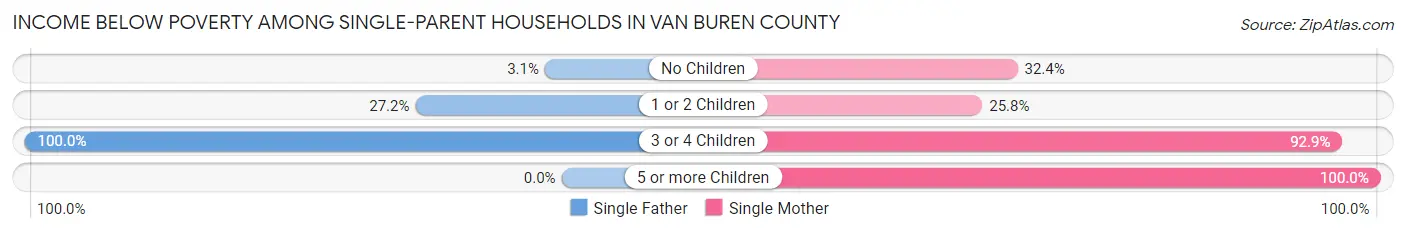
Income Below Poverty Among Single-Parent Households in Van Buren County
According to the poverty data in Van Buren County, 16.7% or 56 single-father households and 34.4% or 293 single-mother households are living below the poverty line. Among single-father households, those with 3 or 4 children have the highest poverty rate, with 5 households (100.0%) experiencing poverty. Likewise, among single-mother households, those with 5 or more children have the highest poverty rate, with 7 households (100.0%) falling below the poverty line.
| Children | Single Father | Single Mother |
| No Children | 5 (3.1%) | 103 (32.4%) |
| 1 or 2 Children | 46 (27.2%) | 118 (25.8%) |
| 3 or 4 Children | 5 (100.0%) | 65 (92.9%) |
| 5 or more Children | 0 (0.0%) | 7 (100.0%) |
| Total | 56 (16.7%) | 293 (34.4%) |
Income Below Poverty Among Married-Couple vs Single-Parent Households in Van Buren County
The poverty data for Van Buren County shows that 255 of the married-couple family households (7.9%) and 349 of the single-parent households (29.4%) are living below the poverty level. Within the married-couple family households, those with 3 or 4 children have the highest poverty rate, with 29 households (30.5%) falling below the poverty line. Among the single-parent households, those with 5 or more children have the highest poverty rate, with 7 household (100.0%) living below poverty.

| Children | Married-Couple Families | Single-Parent Households |
| No Children | 168 (8.0%) | 108 (22.6%) |
| 1 or 2 Children | 58 (5.9%) | 164 (26.2%) |
| 3 or 4 Children | 29 (30.5%) | 70 (93.3%) |
| 5 or more Children | 0 (0.0%) | 7 (100.0%) |
| Total | 255 (7.9%) | 349 (29.4%) |
Employment Characteristics in Van Buren County
Employment by Class of Employer in Van Buren County
Among the 5,364 employed individuals in Van Buren County, private company employees (3,610 | 67.3%), local government employees (449 | 8.4%), and self-employed (not incorporated) (396 | 7.4%) make up the most common classes of employment.

| Employer Class | # Employees | % Employees |
| Private Company Employees | 3,610 | 67.3% |
| Self-Employed (Incorporated) | 210 | 3.9% |
| Self-Employed (Not Incorporated) | 396 | 7.4% |
| Not-for-profit Organizations | 342 | 6.4% |
| Local Government Employees | 449 | 8.4% |
| State Government Employees | 254 | 4.7% |
| Federal Government Employees | 18 | 0.3% |
| Unpaid Family Workers | 85 | 1.6% |
| Total | 5,364 | 100.0% |
Employment Status by Age in Van Buren County
According to the labor force statistics for Van Buren County, out of the total population over 16 years of age (13,234), 43.0% or 5,691 individuals are in the labor force, with 4.7% or 267 of them unemployed. The age group with the highest labor force participation rate is 35 to 44 years, with 79.2% or 1,266 individuals in the labor force. Within the labor force, the 16 to 19 years age range has the highest percentage of unemployed individuals, with 13.2% or 40 of them being unemployed.

| Age Bracket | In Labor Force | Unemployed |
| 16 to 19 Years | 303 (37.7%) | 40 (13.2%) |
| 20 to 24 Years | 477 (72.2%) | 18 (3.8%) |
| 25 to 29 Years | 395 (57.7%) | 25 (6.3%) |
| 30 to 34 Years | 528 (77.4%) | 63 (11.9%) |
| 35 to 44 Years | 1,266 (79.2%) | 33 (2.6%) |
| 45 to 54 Years | 1,235 (64.4%) | 48 (3.9%) |
| 55 to 59 Years | 707 (50.3%) | 0 (0.0%) |
| 60 to 64 Years | 357 (29.2%) | 15 (4.2%) |
| 65 to 74 Years | 331 (14.3%) | 18 (5.4%) |
| 75 Years and over | 93 (4.8%) | 5 (5.4%) |
| Total | 5,691 (43.0%) | 267 (4.7%) |
Employment Status by Educational Attainment in Van Buren County
According to labor force statistics for Van Buren County, 59.7% of individuals (4,485) out of the total population between 25 and 64 years of age (7,512) are in the labor force, with 4.1% or 184 of them being unemployed. The group with the highest labor force participation rate are those with the educational attainment of bachelor's degree or higher, with 77.1% or 758 individuals in the labor force. Within the labor force, individuals with college / associate degree education have the highest percentage of unemployment, with 5.0% or 72 of them being unemployed.

| Educational Attainment | In Labor Force | Unemployed |
| Less than High School | 582 (48.1%) | 41 (3.4%) |
| High School Diploma | 1,697 (54.4%) | 147 (4.7%) |
| College / Associate Degree | 1,449 (65.9%) | 110 (5.0%) |
| Bachelor's Degree or higher | 758 (77.1%) | 16 (1.6%) |
| Total | 4,485 (59.7%) | 308 (4.1%) |
Employment Occupations by Sex in Van Buren County
Management, Business, Science and Arts Occupations
The most common Management, Business, Science and Arts occupations in Van Buren County are Community & Social Service (435 | 8.0%), Education Instruction & Library (373 | 6.9%), Health Diagnosing & Treating (344 | 6.3%), Management (279 | 5.1%), and Business & Financial (196 | 3.6%).

Management, Business, Science and Arts Occupations by Sex
Within the Management, Business, Science and Arts occupations in Van Buren County, the most male-oriented occupations are Life, Physical & Social Science (93.3%), Computers, Engineering & Science (70.3%), and Architecture & Engineering (68.8%), while the most female-oriented occupations are Legal Services & Support (100.0%), Arts, Media & Entertainment (100.0%), and Business & Financial (92.3%).

| Occupation | Male | Female |
| Management | 171 (61.3%) | 108 (38.7%) |
| Business & Financial | 15 (7.6%) | 181 (92.3%) |
| Computers, Engineering & Science | 111 (70.3%) | 47 (29.7%) |
| Computers & Mathematics | 42 (66.7%) | 21 (33.3%) |
| Architecture & Engineering | 55 (68.8%) | 25 (31.2%) |
| Life, Physical & Social Science | 14 (93.3%) | 1 (6.7%) |
| Community & Social Service | 86 (19.8%) | 349 (80.2%) |
| Education, Arts & Media | 14 (41.2%) | 20 (58.8%) |
| Legal Services & Support | 0 (0.0%) | 6 (100.0%) |
| Education Instruction & Library | 72 (19.3%) | 301 (80.7%) |
| Arts, Media & Entertainment | 0 (0.0%) | 22 (100.0%) |
| Health Diagnosing & Treating | 59 (17.2%) | 285 (82.9%) |
| Health Technologists | 41 (24.4%) | 127 (75.6%) |
| Total (Category) | 442 (31.3%) | 970 (68.7%) |
| Total (Overall) | 2,727 (50.2%) | 2,700 (49.7%) |
Services Occupations
The most common Services occupations in Van Buren County are Cleaning & Maintenance (433 | 8.0%), Food Preparation & Serving (286 | 5.3%), Healthcare Support (230 | 4.2%), Personal Care & Service (95 | 1.8%), and Security & Protection (87 | 1.6%).

Services Occupations by Sex
Within the Services occupations in Van Buren County, the most male-oriented occupations are Firefighting & Prevention (100.0%), Security & Protection (88.5%), and Law Enforcement (87.2%), while the most female-oriented occupations are Healthcare Support (93.5%), Personal Care & Service (77.9%), and Food Preparation & Serving (61.9%).

| Occupation | Male | Female |
| Healthcare Support | 15 (6.5%) | 215 (93.5%) |
| Security & Protection | 77 (88.5%) | 10 (11.5%) |
| Firefighting & Prevention | 9 (100.0%) | 0 (0.0%) |
| Law Enforcement | 68 (87.2%) | 10 (12.8%) |
| Food Preparation & Serving | 109 (38.1%) | 177 (61.9%) |
| Cleaning & Maintenance | 322 (74.4%) | 111 (25.6%) |
| Personal Care & Service | 21 (22.1%) | 74 (77.9%) |
| Total (Category) | 544 (48.1%) | 587 (51.9%) |
| Total (Overall) | 2,727 (50.2%) | 2,700 (49.7%) |
Sales and Office Occupations
The most common Sales and Office occupations in Van Buren County are Sales & Related (522 | 9.6%), and Office & Administration (471 | 8.7%).

Sales and Office Occupations by Sex
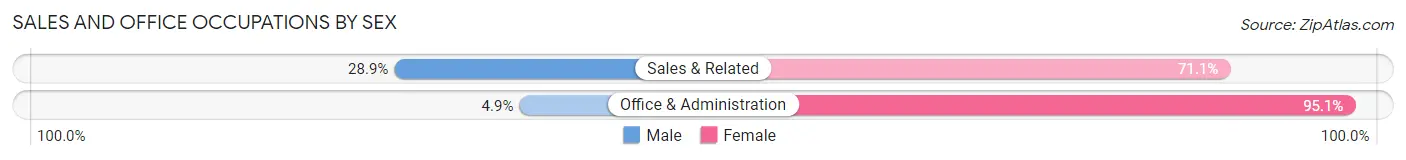
| Occupation | Male | Female |
| Sales & Related | 151 (28.9%) | 371 (71.1%) |
| Office & Administration | 23 (4.9%) | 448 (95.1%) |
| Total (Category) | 174 (17.5%) | 819 (82.5%) |
| Total (Overall) | 2,727 (50.2%) | 2,700 (49.7%) |
Natural Resources, Construction and Maintenance Occupations
The most common Natural Resources, Construction and Maintenance occupations in Van Buren County are Installation, Maintenance & Repair (394 | 7.3%), Construction & Extraction (240 | 4.4%), and Farming, Fishing & Forestry (26 | 0.5%).
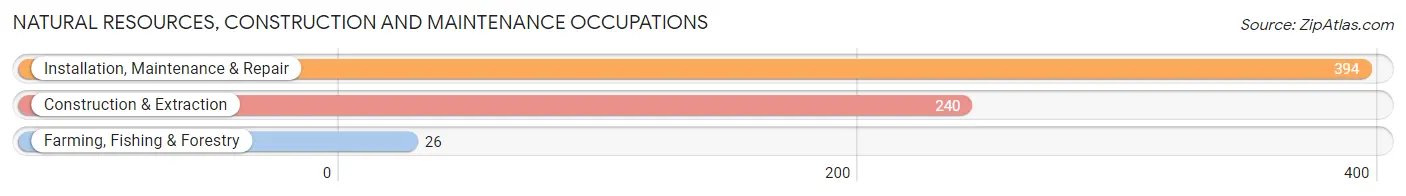
Natural Resources, Construction and Maintenance Occupations by Sex

| Occupation | Male | Female |
| Farming, Fishing & Forestry | 4 (15.4%) | 22 (84.6%) |
| Construction & Extraction | 240 (100.0%) | 0 (0.0%) |
| Installation, Maintenance & Repair | 389 (98.7%) | 5 (1.3%) |
| Total (Category) | 633 (95.9%) | 27 (4.1%) |
| Total (Overall) | 2,727 (50.2%) | 2,700 (49.7%) |
Production, Transportation and Moving Occupations
The most common Production, Transportation and Moving occupations in Van Buren County are Production (558 | 10.3%), Transportation (447 | 8.2%), and Material Moving (226 | 4.2%).

Production, Transportation and Moving Occupations by Sex

| Occupation | Male | Female |
| Production | 340 (60.9%) | 218 (39.1%) |
| Transportation | 415 (92.8%) | 32 (7.2%) |
| Material Moving | 179 (79.2%) | 47 (20.8%) |
| Total (Category) | 934 (75.9%) | 297 (24.1%) |
| Total (Overall) | 2,727 (50.2%) | 2,700 (49.7%) |
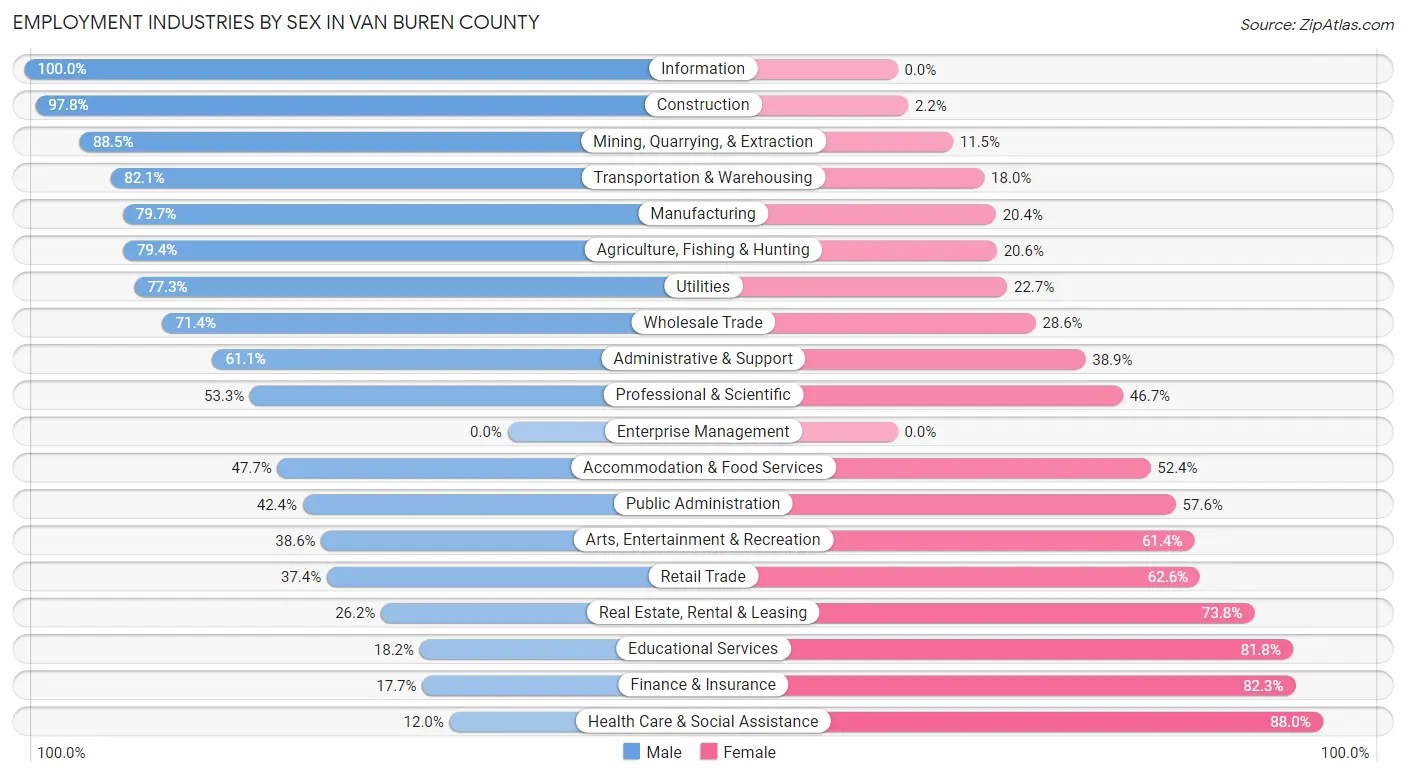
Employment Industries by Sex in Van Buren County
Employment Industries in Van Buren County
The major employment industries in Van Buren County include Health Care & Social Assistance (906 | 16.7%), Retail Trade (623 | 11.5%), Manufacturing (565 | 10.4%), Accommodation & Food Services (447 | 8.2%), and Construction (410 | 7.5%).

Employment Industries by Sex in Van Buren County
The Van Buren County industries that see more men than women are Information (100.0%), Construction (97.8%), and Mining, Quarrying, & Extraction (88.5%), whereas the industries that tend to have a higher number of women are Health Care & Social Assistance (88.0%), Finance & Insurance (82.3%), and Educational Services (81.8%).
| Industry | Male | Female |
| Agriculture, Fishing & Hunting | 85 (79.4%) | 22 (20.6%) |
| Mining, Quarrying, & Extraction | 108 (88.5%) | 14 (11.5%) |
| Construction | 401 (97.8%) | 9 (2.2%) |
| Manufacturing | 450 (79.6%) | 115 (20.3%) |
| Wholesale Trade | 30 (71.4%) | 12 (28.6%) |
| Retail Trade | 233 (37.4%) | 390 (62.6%) |
| Transportation & Warehousing | 288 (82.1%) | 63 (17.9%) |
| Utilities | 167 (77.3%) | 49 (22.7%) |
| Information | 27 (100.0%) | 0 (0.0%) |
| Finance & Insurance | 38 (17.7%) | 177 (82.3%) |
| Real Estate, Rental & Leasing | 33 (26.2%) | 93 (73.8%) |
| Professional & Scientific | 72 (53.3%) | 63 (46.7%) |
| Enterprise Management | 0 (0.0%) | 0 (0.0%) |
| Administrative & Support | 121 (61.1%) | 77 (38.9%) |
| Educational Services | 72 (18.2%) | 324 (81.8%) |
| Health Care & Social Assistance | 109 (12.0%) | 797 (88.0%) |
| Arts, Entertainment & Recreation | 27 (38.6%) | 43 (61.4%) |
| Accommodation & Food Services | 213 (47.6%) | 234 (52.3%) |
| Public Administration | 95 (42.4%) | 129 (57.6%) |
| Total | 2,727 (50.2%) | 2,700 (49.7%) |
Education in Van Buren County
School Enrollment in Van Buren County
The most common levels of schooling among the 2,876 students in Van Buren County are high school (827 | 28.8%), elementary school (747 | 26.0%), and middle school (565 | 19.7%).

| School Level | # Students | % Students |
| Nursery / Preschool | 113 | 3.9% |
| Kindergarten | 272 | 9.5% |
| Elementary School | 747 | 26.0% |
| Middle School | 565 | 19.7% |
| High School | 827 | 28.8% |
| College / Undergraduate | 292 | 10.2% |
| Graduate / Professional | 60 | 2.1% |
| Total | 2,876 | 100.0% |
School Enrollment by Age by Funding Source in Van Buren County
Out of a total of 2,876 students who are enrolled in schools in Van Buren County, 362 (12.6%) attend a private institution, while the remaining 2,514 (87.4%) are enrolled in public schools. The age group of 3 to 4 year olds has the highest likelihood of being enrolled in private schools, with 37 (39.0% in the age bracket) enrolled. Conversely, the age group of 18 to 19 year olds has the lowest likelihood of being enrolled in a private school, with 172 (100.0% in the age bracket) attending a public institution.

| Age Bracket | Public School | Private School |
| 3 to 4 Year Olds | 58 (61.1%) | 37 (39.0%) |
| 5 to 9 Year Old | 834 (88.3%) | 110 (11.7%) |
| 10 to 14 Year Olds | 549 (78.0%) | 155 (22.0%) |
| 15 to 17 Year Olds | 652 (93.8%) | 43 (6.2%) |
| 18 to 19 Year Olds | 172 (100.0%) | 0 (0.0%) |
| 20 to 24 Year Olds | 106 (87.6%) | 15 (12.4%) |
| 25 to 34 Year Olds | 62 (100.0%) | 0 (0.0%) |
| 35 Years and over | 82 (98.8%) | 1 (1.2%) |
| Total | 2,514 (87.4%) | 362 (12.6%) |
Educational Attainment by Field of Study in Van Buren County
Education (515 | 25.4%), business (430 | 21.2%), science & technology (239 | 11.8%), bio, nature & agricultural (142 | 7.0%), and arts & humanities (127 | 6.3%) are the most common fields of study among 2,028 individuals in Van Buren County who have obtained a bachelor's degree or higher.

| Field of Study | # Graduates | % Graduates |
| Computers & Mathematics | 55 | 2.7% |
| Bio, Nature & Agricultural | 142 | 7.0% |
| Physical & Health Sciences | 95 | 4.7% |
| Psychology | 69 | 3.4% |
| Social Sciences | 102 | 5.0% |
| Engineering | 67 | 3.3% |
| Multidisciplinary Studies | 0 | 0.0% |
| Science & Technology | 239 | 11.8% |
| Business | 430 | 21.2% |
| Education | 515 | 25.4% |
| Literature & Languages | 62 | 3.1% |
| Liberal Arts & History | 77 | 3.8% |
| Visual & Performing Arts | 38 | 1.9% |
| Communications | 10 | 0.5% |
| Arts & Humanities | 127 | 6.3% |
| Total | 2,028 | 100.0% |
Transportation & Commute in Van Buren County
Vehicle Availability by Sex in Van Buren County
The most prevalent vehicle ownership categories in Van Buren County are males with 2 vehicles (902, accounting for 33.6%) and females with 2 vehicles (968, making up 33.7%).

| Vehicles Available | Male | Female |
| No Vehicle | 83 (3.1%) | 68 (2.5%) |
| 1 Vehicle | 398 (14.8%) | 435 (16.3%) |
| 2 Vehicles | 902 (33.6%) | 968 (36.2%) |
| 3 Vehicles | 818 (30.4%) | 802 (30.0%) |
| 4 Vehicles | 313 (11.7%) | 247 (9.2%) |
| 5 or more Vehicles | 173 (6.4%) | 153 (5.7%) |
| Total | 2,687 (100.0%) | 2,673 (100.0%) |
Commute Time in Van Buren County
The most frequently occuring commute durations in Van Buren County are 15 to 19 minutes (889 commuters, 17.6%), 5 to 9 minutes (758 commuters, 15.0%), and 10 to 14 minutes (604 commuters, 12.0%).

| Commute Time | # Commuters | % Commuters |
| Less than 5 Minutes | 311 | 6.2% |
| 5 to 9 Minutes | 758 | 15.0% |
| 10 to 14 Minutes | 604 | 12.0% |
| 15 to 19 Minutes | 889 | 17.6% |
| 20 to 24 Minutes | 522 | 10.3% |
| 25 to 29 Minutes | 169 | 3.4% |
| 30 to 34 Minutes | 568 | 11.3% |
| 35 to 39 Minutes | 76 | 1.5% |
| 40 to 44 Minutes | 26 | 0.5% |
| 45 to 59 Minutes | 393 | 7.8% |
| 60 to 89 Minutes | 355 | 7.0% |
| 90 or more Minutes | 376 | 7.4% |
Commute Time by Sex in Van Buren County
The most common commute times in Van Buren County are 30 to 34 minutes (446 commuters, 17.3%) for males and 15 to 19 minutes (551 commuters, 22.3%) for females.

| Commute Time | Male | Female |
| Less than 5 Minutes | 144 (5.6%) | 167 (6.8%) |
| 5 to 9 Minutes | 347 (13.5%) | 411 (16.7%) |
| 10 to 14 Minutes | 221 (8.6%) | 383 (15.5%) |
| 15 to 19 Minutes | 338 (13.1%) | 551 (22.3%) |
| 20 to 24 Minutes | 258 (10.0%) | 264 (10.7%) |
| 25 to 29 Minutes | 74 (2.9%) | 95 (3.8%) |
| 30 to 34 Minutes | 446 (17.3%) | 122 (4.9%) |
| 35 to 39 Minutes | 76 (2.9%) | 0 (0.0%) |
| 40 to 44 Minutes | 25 (1.0%) | 1 (0.0%) |
| 45 to 59 Minutes | 154 (6.0%) | 239 (9.7%) |
| 60 to 89 Minutes | 177 (6.9%) | 178 (7.2%) |
| 90 or more Minutes | 319 (12.4%) | 57 (2.3%) |
Time of Departure to Work by Sex in Van Buren County
The most frequent times of departure to work in Van Buren County are 5:30 AM to 5:59 AM (416, 16.1%) for males and 7:00 AM to 7:29 AM (562, 22.8%) for females.

| Time of Departure | Male | Female |
| 12:00 AM to 4:59 AM | 185 (7.2%) | 93 (3.8%) |
| 5:00 AM to 5:29 AM | 205 (8.0%) | 110 (4.5%) |
| 5:30 AM to 5:59 AM | 416 (16.1%) | 310 (12.6%) |
| 6:00 AM to 6:29 AM | 124 (4.8%) | 140 (5.7%) |
| 6:30 AM to 6:59 AM | 368 (14.3%) | 257 (10.4%) |
| 7:00 AM to 7:29 AM | 262 (10.2%) | 562 (22.8%) |
| 7:30 AM to 7:59 AM | 160 (6.2%) | 348 (14.1%) |
| 8:00 AM to 8:29 AM | 230 (8.9%) | 91 (3.7%) |
| 8:30 AM to 8:59 AM | 34 (1.3%) | 111 (4.5%) |
| 9:00 AM to 9:59 AM | 142 (5.5%) | 167 (6.8%) |
| 10:00 AM to 10:59 AM | 8 (0.3%) | 141 (5.7%) |
| 11:00 AM to 11:59 AM | 0 (0.0%) | 6 (0.2%) |
| 12:00 PM to 3:59 PM | 292 (11.3%) | 110 (4.5%) |
| 4:00 PM to 11:59 PM | 153 (5.9%) | 22 (0.9%) |
| Total | 2,579 (100.0%) | 2,468 (100.0%) |
Housing Occupancy in Van Buren County
Occupancy by Ownership in Van Buren County
Of the total 6,833 dwellings in Van Buren County, owner-occupied units account for 5,405 (79.1%), while renter-occupied units make up 1,428 (20.9%).

| Occupancy | # Housing Units | % Housing Units |
| Owner Occupied Housing Units | 5,405 | 79.1% |
| Renter-Occupied Housing Units | 1,428 | 20.9% |
| Total Occupied Housing Units | 6,833 | 100.0% |
Occupancy by Household Size in Van Buren County
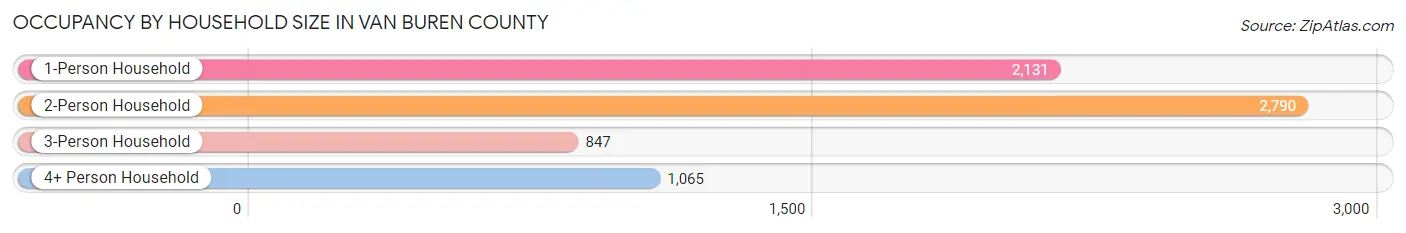
| Household Size | # Housing Units | % Housing Units |
| 1-Person Household | 2,131 | 31.2% |
| 2-Person Household | 2,790 | 40.8% |
| 3-Person Household | 847 | 12.4% |
| 4+ Person Household | 1,065 | 15.6% |
| Total Housing Units | 6,833 | 100.0% |
Occupancy by Ownership by Household Size in Van Buren County

| Household Size | Owner-occupied | Renter-occupied |
| 1-Person Household | 1,448 (67.9%) | 683 (32.1%) |
| 2-Person Household | 2,407 (86.3%) | 383 (13.7%) |
| 3-Person Household | 632 (74.6%) | 215 (25.4%) |
| 4+ Person Household | 918 (86.2%) | 147 (13.8%) |
| Total Housing Units | 5,405 (79.1%) | 1,428 (20.9%) |
Occupancy by Educational Attainment in Van Buren County

| Household Size | Owner-occupied | Renter-occupied |
| Less than High School | 681 (81.8%) | 152 (18.2%) |
| High School Diploma | 1,841 (69.6%) | 803 (30.4%) |
| College/Associate Degree | 1,705 (83.1%) | 348 (17.0%) |
| Bachelor's Degree or higher | 1,178 (90.4%) | 125 (9.6%) |
Occupancy by Age of Householder in Van Buren County

| Age Bracket | # Households | % Households |
| Under 35 Years | 735 | 10.8% |
| 35 to 44 Years | 792 | 11.6% |
| 45 to 54 Years | 1,057 | 15.5% |
| 55 to 64 Years | 1,566 | 22.9% |
| 65 to 74 Years | 1,327 | 19.4% |
| 75 to 84 Years | 994 | 14.5% |
| 85 Years and Over | 362 | 5.3% |
| Total | 6,833 | 100.0% |
Housing Finances in Van Buren County
Median Income by Occupancy in Van Buren County

| Occupancy Type | # Households | Median Income |
| Owner-Occupied | 5,405 (79.1%) | $50,310 |
| Renter-Occupied | 1,428 (20.9%) | $24,844 |
| Average | 6,833 (100.0%) | $45,768 |
Occupancy by Householder Income Bracket in Van Buren County
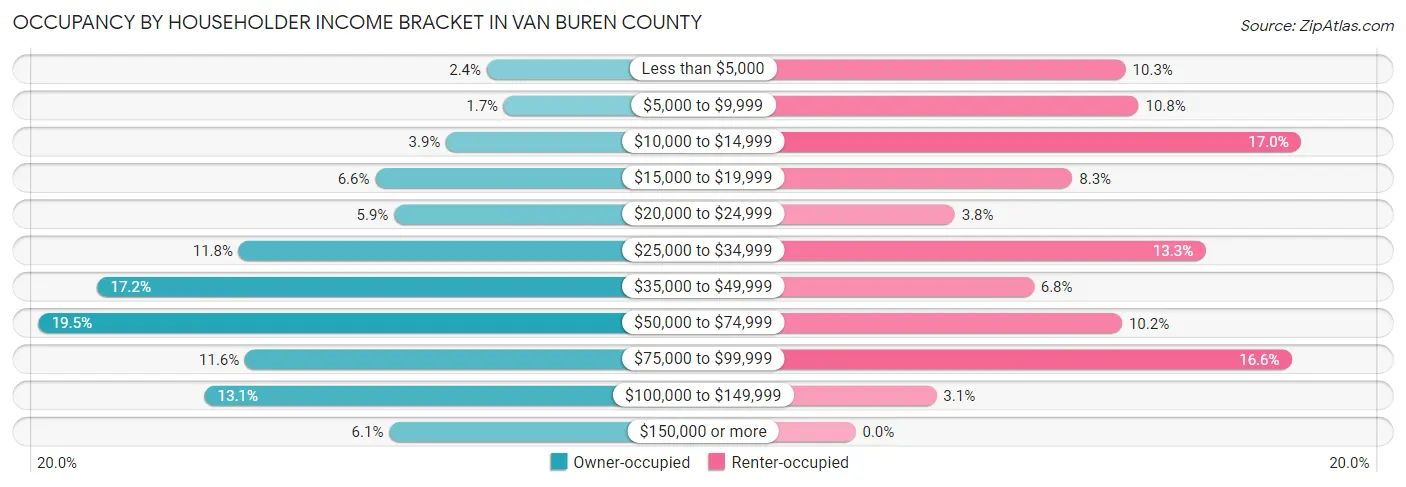
| Income Bracket | Owner-occupied | Renter-occupied |
| Less than $5,000 | 129 (2.4%) | 147 (10.3%) |
| $5,000 to $9,999 | 94 (1.7%) | 154 (10.8%) |
| $10,000 to $14,999 | 213 (3.9%) | 242 (17.0%) |
| $15,000 to $19,999 | 359 (6.6%) | 118 (8.3%) |
| $20,000 to $24,999 | 320 (5.9%) | 54 (3.8%) |
| $25,000 to $34,999 | 640 (11.8%) | 190 (13.3%) |
| $35,000 to $49,999 | 931 (17.2%) | 97 (6.8%) |
| $50,000 to $74,999 | 1,052 (19.5%) | 145 (10.2%) |
| $75,000 to $99,999 | 627 (11.6%) | 237 (16.6%) |
| $100,000 to $149,999 | 710 (13.1%) | 44 (3.1%) |
| $150,000 or more | 330 (6.1%) | 0 (0.0%) |
| Total | 5,405 (100.0%) | 1,428 (100.0%) |
Monthly Housing Cost Tiers in Van Buren County
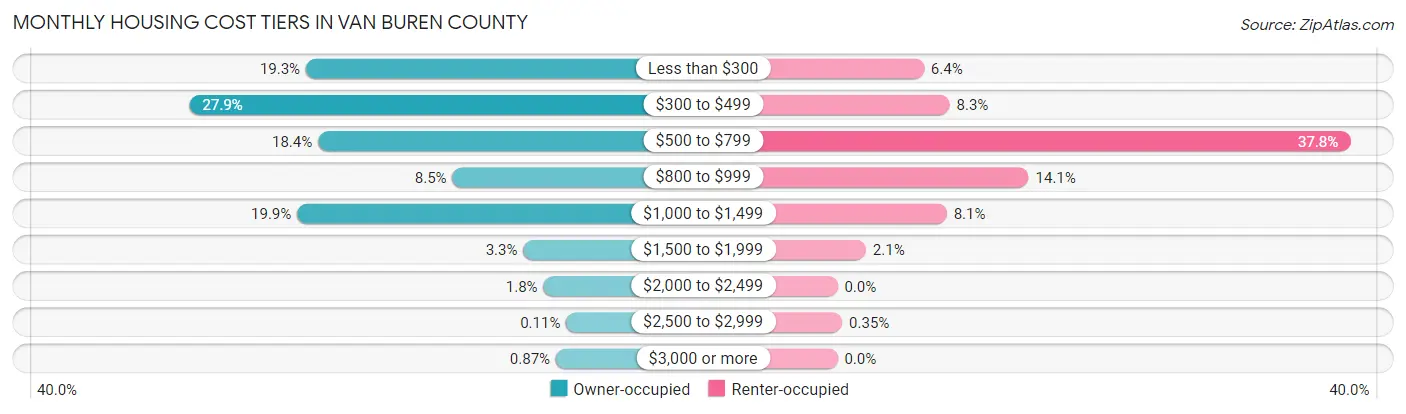
| Monthly Cost | Owner-occupied | Renter-occupied |
| Less than $300 | 1,042 (19.3%) | 91 (6.4%) |
| $300 to $499 | 1,506 (27.9%) | 118 (8.3%) |
| $500 to $799 | 994 (18.4%) | 539 (37.8%) |
| $800 to $999 | 459 (8.5%) | 201 (14.1%) |
| $1,000 to $1,499 | 1,077 (19.9%) | 115 (8.1%) |
| $1,500 to $1,999 | 177 (3.3%) | 30 (2.1%) |
| $2,000 to $2,499 | 97 (1.8%) | 0 (0.0%) |
| $2,500 to $2,999 | 6 (0.1%) | 5 (0.4%) |
| $3,000 or more | 47 (0.9%) | 0 (0.0%) |
| Total | 5,405 (100.0%) | 1,428 (100.0%) |
Physical Housing Characteristics in Van Buren County
Housing Structures in Van Buren County
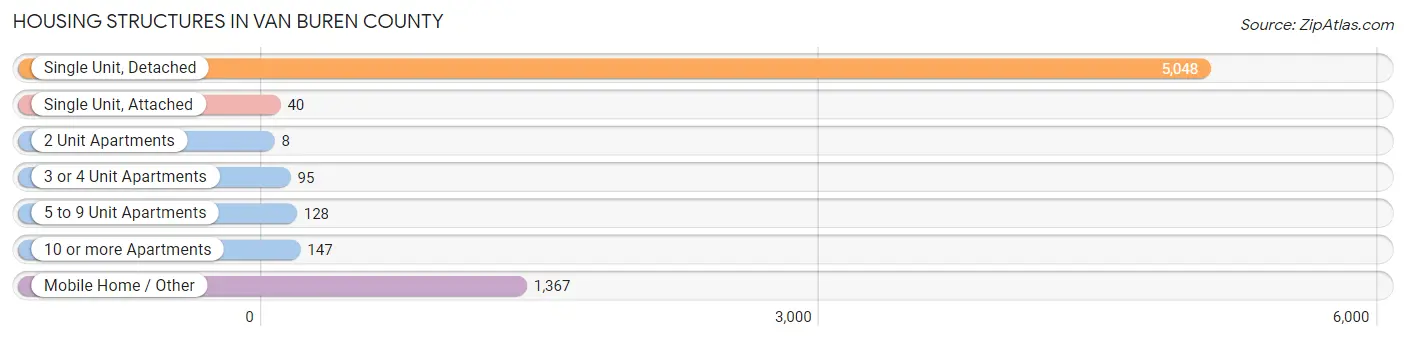
| Structure Type | # Housing Units | % Housing Units |
| Single Unit, Detached | 5,048 | 73.9% |
| Single Unit, Attached | 40 | 0.6% |
| 2 Unit Apartments | 8 | 0.1% |
| 3 or 4 Unit Apartments | 95 | 1.4% |
| 5 to 9 Unit Apartments | 128 | 1.9% |
| 10 or more Apartments | 147 | 2.1% |
| Mobile Home / Other | 1,367 | 20.0% |
| Total | 6,833 | 100.0% |
Housing Structures by Occupancy in Van Buren County
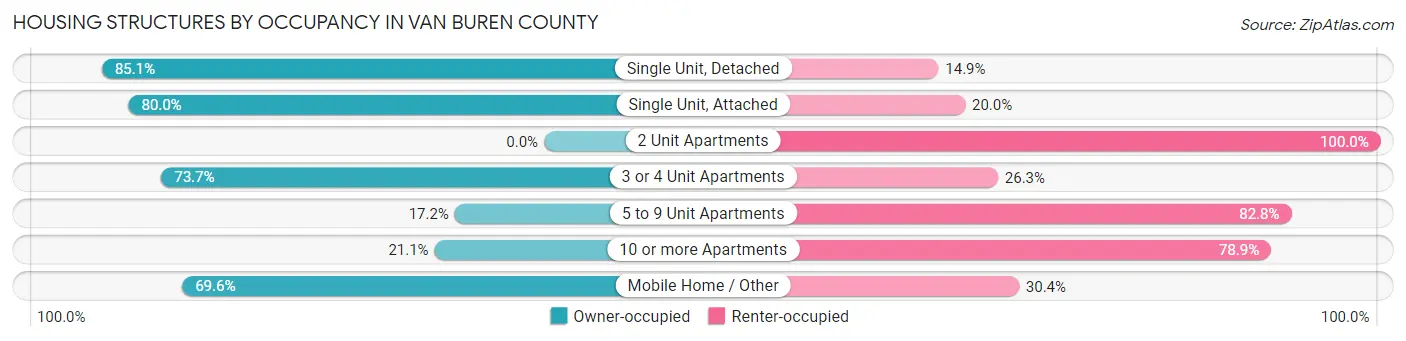
| Structure Type | Owner-occupied | Renter-occupied |
| Single Unit, Detached | 4,298 (85.1%) | 750 (14.9%) |
| Single Unit, Attached | 32 (80.0%) | 8 (20.0%) |
| 2 Unit Apartments | 0 (0.0%) | 8 (100.0%) |
| 3 or 4 Unit Apartments | 70 (73.7%) | 25 (26.3%) |
| 5 to 9 Unit Apartments | 22 (17.2%) | 106 (82.8%) |
| 10 or more Apartments | 31 (21.1%) | 116 (78.9%) |
| Mobile Home / Other | 952 (69.6%) | 415 (30.4%) |
| Total | 5,405 (79.1%) | 1,428 (20.9%) |
Housing Structures by Number of Rooms in Van Buren County

| Number of Rooms | Owner-occupied | Renter-occupied |
| 1 Room | 40 (0.7%) | 58 (4.1%) |
| 2 or 3 Rooms | 310 (5.7%) | 246 (17.2%) |
| 4 or 5 Rooms | 2,255 (41.7%) | 706 (49.4%) |
| 6 or 7 Rooms | 1,899 (35.1%) | 328 (23.0%) |
| 8 or more Rooms | 901 (16.7%) | 90 (6.3%) |
| Total | 5,405 (100.0%) | 1,428 (100.0%) |
Housing Structure by Heating Type in Van Buren County

| Heating Type | Owner-occupied | Renter-occupied |
| Utility Gas | 523 (9.7%) | 286 (20.0%) |
| Bottled, Tank, or LP Gas | 1,339 (24.8%) | 241 (16.9%) |
| Electricity | 3,118 (57.7%) | 733 (51.3%) |
| Fuel Oil or Kerosene | 20 (0.4%) | 8 (0.6%) |
| Coal or Coke | 0 (0.0%) | 0 (0.0%) |
| All other Fuels | 363 (6.7%) | 160 (11.2%) |
| No Fuel Used | 42 (0.8%) | 0 (0.0%) |
| Total | 5,405 (100.0%) | 1,428 (100.0%) |
Household Vehicle Usage in Van Buren County
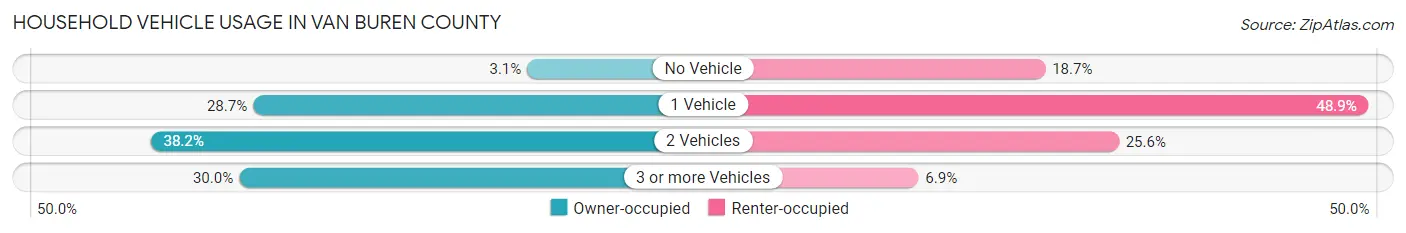
| Vehicles per Household | Owner-occupied | Renter-occupied |
| No Vehicle | 167 (3.1%) | 267 (18.7%) |
| 1 Vehicle | 1,550 (28.7%) | 698 (48.9%) |
| 2 Vehicles | 2,067 (38.2%) | 365 (25.6%) |
| 3 or more Vehicles | 1,621 (30.0%) | 98 (6.9%) |
| Total | 5,405 (100.0%) | 1,428 (100.0%) |
Real Estate & Mortgages in Van Buren County
Real Estate and Mortgage Overview in Van Buren County
| Characteristic | Without Mortgage | With Mortgage |
| Housing Units | 3,226 | 2,179 |
| Median Property Value | $114,000 | $127,800 |
| Median Household Income | $46,470 | $188 |
| Monthly Housing Costs | $370 | $39 |
| Real Estate Taxes | $591 | $313 |
Property Value by Mortgage Status in Van Buren County

| Property Value | Without Mortgage | With Mortgage |
| Less than $50,000 | 674 (20.9%) | 251 (11.5%) |
| $50,000 to $99,999 | 666 (20.6%) | 637 (29.2%) |
| $100,000 to $299,999 | 1,660 (51.5%) | 1,111 (51.0%) |
| $300,000 to $499,999 | 160 (5.0%) | 61 (2.8%) |
| $500,000 to $749,999 | 64 (2.0%) | 81 (3.7%) |
| $750,000 to $999,999 | 2 (0.1%) | 24 (1.1%) |
| $1,000,000 or more | 0 (0.0%) | 14 (0.6%) |
| Total | 3,226 (100.0%) | 2,179 (100.0%) |
Household Income by Mortgage Status in Van Buren County

| Household Income | Without Mortgage | With Mortgage |
| Less than $10,000 | 185 (5.7%) | 14 (0.6%) |
| $10,000 to $24,999 | 684 (21.2%) | 38 (1.7%) |
| $25,000 to $34,999 | 415 (12.9%) | 208 (9.6%) |
| $35,000 to $49,999 | 432 (13.4%) | 225 (10.3%) |
| $50,000 to $74,999 | 640 (19.8%) | 499 (22.9%) |
| $75,000 to $99,999 | 367 (11.4%) | 412 (18.9%) |
| $100,000 to $149,999 | 361 (11.2%) | 260 (11.9%) |
| $150,000 or more | 142 (4.4%) | 349 (16.0%) |
| Total | 3,226 (100.0%) | 2,179 (100.0%) |
Property Value to Household Income Ratio in Van Buren County
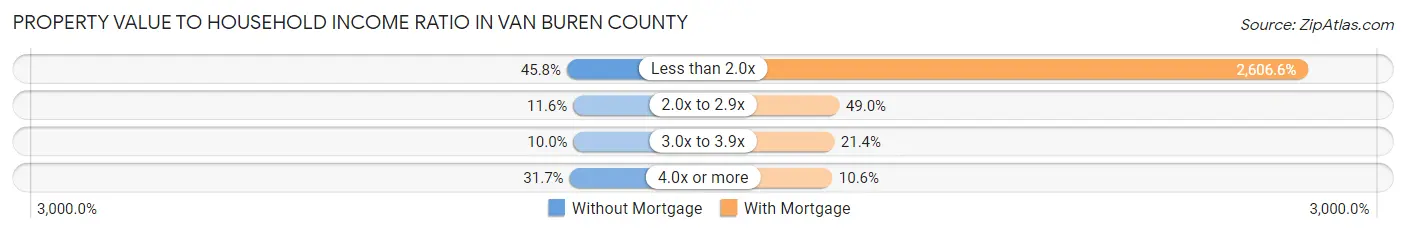
| Value-to-Income Ratio | Without Mortgage | With Mortgage |
| Less than 2.0x | 1,476 (45.8%) | 56,797 (2,606.6%) |
| 2.0x to 2.9x | 375 (11.6%) | 1,068 (49.0%) |
| 3.0x to 3.9x | 321 (10.0%) | 467 (21.4%) |
| 4.0x or more | 1,021 (31.7%) | 231 (10.6%) |
| Total | 3,226 (100.0%) | 2,179 (100.0%) |
Real Estate Taxes by Mortgage Status in Van Buren County

| Property Taxes | Without Mortgage | With Mortgage |
| Less than $800 | 1,723 (53.4%) | 0 (0.0%) |
| $800 to $1,499 | 681 (21.1%) | 1,121 (51.4%) |
| $800 to $1,499 | 396 (12.3%) | 513 (23.5%) |
| Total | 3,226 (100.0%) | 2,179 (100.0%) |
Health & Disability in Van Buren County
Health Insurance Coverage by Age in Van Buren County

| Age Bracket | With Coverage | Without Coverage |
| Under 6 Years | 754 (91.5%) | 70 (8.5%) |
| 6 to 18 Years | 2,310 (94.8%) | 127 (5.2%) |
| 19 to 25 Years | 818 (76.3%) | 254 (23.7%) |
| 26 to 34 Years | 873 (76.6%) | 267 (23.4%) |
| 35 to 44 Years | 1,407 (88.0%) | 191 (11.9%) |
| 45 to 54 Years | 1,535 (80.5%) | 371 (19.5%) |
| 55 to 64 Years | 2,448 (94.2%) | 152 (5.9%) |
| 65 to 74 Years | 2,257 (99.1%) | 20 (0.9%) |
| 75 Years and older | 1,859 (98.9%) | 20 (1.1%) |
| Total | 14,261 (90.6%) | 1,472 (9.4%) |
Health Insurance Coverage by Citizenship Status in Van Buren County
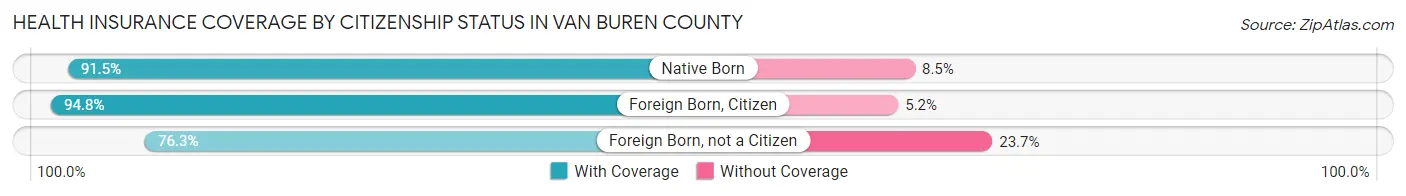
| Citizenship Status | With Coverage | Without Coverage |
| Native Born | 754 (91.5%) | 70 (8.5%) |
| Foreign Born, Citizen | 2,310 (94.8%) | 127 (5.2%) |
| Foreign Born, not a Citizen | 818 (76.3%) | 254 (23.7%) |
Health Insurance Coverage by Household Income in Van Buren County
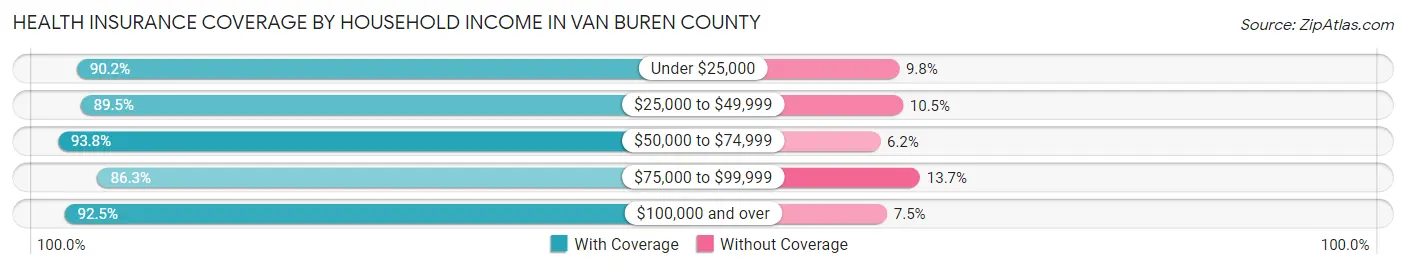
| Household Income | With Coverage | Without Coverage |
| Under $25,000 | 2,647 (90.2%) | 287 (9.8%) |
| $25,000 to $49,999 | 3,785 (89.5%) | 444 (10.5%) |
| $50,000 to $74,999 | 3,176 (93.8%) | 211 (6.2%) |
| $75,000 to $99,999 | 1,910 (86.3%) | 303 (13.7%) |
| $100,000 and over | 2,725 (92.5%) | 221 (7.5%) |
Public vs Private Health Insurance Coverage by Age in Van Buren County

| Age Bracket | Public Insurance | Private Insurance |
| Under 6 | 604 (73.3%) | 178 (21.6%) |
| 6 to 18 Years | 1,542 (63.3%) | 888 (36.4%) |
| 19 to 25 Years | 358 (33.4%) | 487 (45.4%) |
| 25 to 34 Years | 489 (42.9%) | 427 (37.5%) |
| 35 to 44 Years | 769 (48.1%) | 695 (43.5%) |
| 45 to 54 Years | 618 (32.4%) | 1,028 (53.9%) |
| 55 to 64 Years | 1,249 (48.0%) | 1,467 (56.4%) |
| 65 to 74 Years | 2,256 (99.1%) | 1,254 (55.1%) |
| 75 Years and over | 1,855 (98.7%) | 1,132 (60.2%) |
| Total | 9,740 (61.9%) | 7,556 (48.0%) |
Disability Status by Sex by Age in Van Buren County

| Age Bracket | Male | Female |
| Under 5 Years | 0 (0.0%) | 0 (0.0%) |
| 5 to 17 Years | 148 (12.5%) | 171 (14.1%) |
| 18 to 34 Years | 170 (14.0%) | 141 (12.1%) |
| 35 to 64 Years | 929 (30.6%) | 649 (21.2%) |
| 65 to 74 Years | 478 (42.8%) | 338 (29.1%) |
| 75 Years and over | 421 (54.6%) | 709 (64.0%) |
Disability Class by Sex by Age in Van Buren County
Disability Class: Hearing Difficulty

| Age Bracket | Male | Female |
| Under 5 Years | 0 (0.0%) | 0 (0.0%) |
| 5 to 17 Years | 0 (0.0%) | 0 (0.0%) |
| 18 to 34 Years | 3 (0.3%) | 11 (0.9%) |
| 35 to 64 Years | 273 (9.0%) | 106 (3.5%) |
| 65 to 74 Years | 250 (22.4%) | 81 (7.0%) |
| 75 Years and over | 296 (38.4%) | 219 (19.8%) |
Disability Class: Vision Difficulty

| Age Bracket | Male | Female |
| Under 5 Years | 0 (0.0%) | 0 (0.0%) |
| 5 to 17 Years | 49 (4.1%) | 0 (0.0%) |
| 18 to 34 Years | 48 (4.0%) | 2 (0.2%) |
| 35 to 64 Years | 266 (8.8%) | 143 (4.7%) |
| 65 to 74 Years | 204 (18.3%) | 93 (8.0%) |
| 75 Years and over | 63 (8.2%) | 205 (18.5%) |
Disability Class: Cognitive Difficulty

| Age Bracket | Male | Female |
| 5 to 17 Years | 143 (12.1%) | 39 (3.2%) |
| 18 to 34 Years | 165 (13.6%) | 96 (8.2%) |
| 35 to 64 Years | 344 (11.3%) | 241 (7.9%) |
| 65 to 74 Years | 168 (15.0%) | 79 (6.8%) |
| 75 Years and over | 190 (24.6%) | 397 (35.8%) |
Disability Class: Ambulatory Difficulty

| Age Bracket | Male | Female |
| 5 to 17 Years | 0 (0.0%) | 132 (10.9%) |
| 18 to 34 Years | 52 (4.3%) | 55 (4.7%) |
| 35 to 64 Years | 560 (18.4%) | 374 (12.2%) |
| 65 to 74 Years | 241 (21.6%) | 205 (17.7%) |
| 75 Years and over | 248 (32.2%) | 567 (51.2%) |
Disability Class: Self-Care Difficulty

| Age Bracket | Male | Female |
| 5 to 17 Years | 20 (1.7%) | 141 (11.7%) |
| 18 to 34 Years | 43 (3.5%) | 0 (0.0%) |
| 35 to 64 Years | 210 (6.9%) | 90 (2.9%) |
| 65 to 74 Years | 80 (7.2%) | 13 (1.1%) |
| 75 Years and over | 45 (5.8%) | 399 (36.0%) |
Technology Access in Van Buren County
Computing Device Access in Van Buren County

| Device Type | # Households | % Households |
| Desktop or Laptop | 4,164 | 60.9% |
| Smartphone | 5,453 | 79.8% |
| Tablet | 3,432 | 50.2% |
| No Computing Device | 889 | 13.0% |
| Total | 6,833 | 100.0% |
Internet Access in Van Buren County

| Internet Type | # Households | % Households |
| Dial-Up Internet | 87 | 1.3% |
| Broadband Home | 2,918 | 42.7% |
| Cellular Data Only | 1,478 | 21.6% |
| Satellite Internet | 749 | 11.0% |
| No Internet | 1,669 | 24.4% |
| Total | 6,833 | 100.0% |
Van Buren County Summary
Van Buren County is located in the northwest corner of Arkansas, and is bordered by the states of Oklahoma and Missouri. It is part of the Ozark Mountains region, and is known for its scenic beauty and outdoor recreation opportunities. The county was established in 1833 and named after Martin Van Buren, the eighth President of the United States. As of the 2010 census, the population was 17,295.
Geography
Van Buren County is located in the northwest corner of Arkansas, and is bordered by the states of Oklahoma and Missouri. It is part of the Ozark Mountains region, and is known for its scenic beauty and outdoor recreation opportunities. The county is located in the Boston Mountains, a sub-range of the Ozark Mountains. The highest point in the county is Mount Magazine, which rises to an elevation of 2,753 feet. The county is drained by the Petit Jean River, which flows through the county from north to south. Other major waterways include the Mulberry River, the Kings River, and the White River.
The county has a total area of 1,053 square miles, of which 1,049 square miles is land and 4.2 square miles is water. The county is divided into two distinct regions: the Ozark Plateau in the north and the Arkansas River Valley in the south. The Ozark Plateau is characterized by rolling hills and deep valleys, while the Arkansas River Valley is characterized by flat plains and fertile soil.
Demographics
As of the 2010 census, there were 17,295 people, 6,945 households, and 4,845 families residing in the county. The population density was 16.5 people per square mile. There were 7,845 housing units at an average density of 7.5 per square mile. The racial makeup of the county was 95.2% White, 0.7% Black or African American, 0.7% Native American, 0.3% Asian, 0.1% Pacific Islander, 1.7% from other races, and 1.2% from two or more races. Hispanic or Latino of any race were 3.2% of the population.
There were 6,945 households, out of which 28.2% had children under the age of 18 living with them, 54.2% were married couples living together, 10.2% had a female householder with no husband present, and 30.7% were non-families. 25.7% of all households were made up of individuals, and 11.7% had someone living alone who was 65 years of age or older. The average household size was 2.45 and the average family size was 2.92.
The median income for a household in the county was $32,917, and the median income for a family was $39,945. Males had a median income of $30,945 versus $21,813 for females. The per capita income for the county was $17,845. About 11.2% of families and 14.7% of the population were below the poverty line, including 19.2% of those under age 18 and 13.2% of those age 65 or over.
Economy
Van Buren County is largely rural and agricultural. The county is home to several large farms, as well as numerous small family farms. The county is also home to several large timber companies, which harvest timber from the Ozark Mountains. The county is also home to several manufacturing companies, including a large poultry processing plant.
The county is home to several tourist attractions, including the Ozark Folk Center State Park, which features traditional Ozark music and crafts. The county is also home to several wineries, as well as the Ozark National Forest.
The county is served by two major highways, Interstate 40 and U.S. Route 65. The county is also served by several smaller highways, including Arkansas Highway 16, Arkansas Highway 23, and Arkansas Highway 59. The county is served by the Van Buren County Regional Airport, which is located in the city of Clinton.
Conclusion
Van Buren County is a rural county located in the northwest corner of Arkansas. It is part of the Ozark Mountains region, and is known for its scenic beauty and outdoor recreation opportunities. The county is largely agricultural, with several large farms and timber companies. The county is also home to several tourist attractions, including the Ozark Folk Center State Park and several wineries. The county is served by two major highways, Interstate 40 and U.S. Route 65, as well as several smaller highways. The county is served by the Van Buren County Regional Airport, which is located in the city of Clinton.
Common Questions
What is the Total Population of Van Buren County?
Total Population of Van Buren County is 15,900.
What is the Total Male Population of Van Buren County?
Total Male Population of Van Buren County is 7,814.
What is the Total Female Population of Van Buren County?
Total Female Population of Van Buren County is 8,086.
What is the Ratio of Males per 100 Females in Van Buren County?
There are 96.64 Males per 100 Females in Van Buren County.
What is the Ratio of Females per 100 Males in Van Buren County?
There are 103.48 Females per 100 Males in Van Buren County.
What is the Median Population Age in Van Buren County?
Median Population Age in Van Buren County is 49.7 Years.
What is the Average Family Size in Van Buren County
Average Family Size in Van Buren County is 2.8 People.
What is the Average Household Size in Van Buren County
Average Household Size in Van Buren County is 2.3 People.
What is Per Capita Income in Van Buren County?
Per Capita income in Van Buren County is $26,183.
What is the Median Family Income in Van Buren County?
Median Family Income in Van Buren County is $59,654.
What is the Median Household income in Van Buren County?
Median Household Income in Van Buren County is $45,768.
What is Income or Wage Gap in Van Buren County?
Income or Wage Gap in Van Buren County is 23.8%.
Women in Van Buren County earn 76.2 cents for every dollar earned by a man.
What is Family Income Deficit in Van Buren County?
Family Income Deficit in Van Buren County is $8,610.
Families that are below poverty line in Van Buren County earn $8,610 less on average than the poverty threshold level.
What is Inequality or Gini Index in Van Buren County?
Inequality or Gini Index in Van Buren County is 0.44.
How Large is the Labor Force in Van Buren County?
There are 5,691 People in the Labor Forcein in Van Buren County.
What is the Percentage of People in the Labor Force in Van Buren County?
43.0% of People are in the Labor Force in Van Buren County.
What is the Unemployment Rate in Van Buren County?
Unemployment Rate in Van Buren County is 4.7%.