Searcy County, AR
Searcy County Map

Searcy County Overview
7,880
TOTAL POPULATION
3,944
MALE POPULATION
3,936
FEMALE POPULATION
100.20
MALES / 100 FEMALES
99.80
FEMALES / 100 MALES
46.9
MEDIAN AGE
3.2
AVG FAMILY SIZE
2.6
AVG HOUSEHOLD SIZE
$22,384
PER CAPITA INCOME
$52,830
AVG FAMILY INCOME
$42,063
AVG HOUSEHOLD INCOME
21.9%
WAGE / INCOME GAP [ % ]
78.1¢/ $1
WAGE / INCOME GAP [ $ ]
$7,240
FAMILY INCOME DEFICIT
0.44
INEQUALITY / GINI INDEX
3,081
LABOR FORCE [ PEOPLE ]
47.3%
PERCENT IN LABOR FORCE
5.2%
UNEMPLOYMENT RATE
Searcy County Area Codes
Race in Searcy County
The most populous races in Searcy County are White / Caucasian (6,954 | 88.2%), Two or more Races (640 | 8.1%), and Hispanic or Latino (239 | 3.0%).

| Race | # Population | % Population |
| Asian | 21 | 0.3% |
| Black / African American | 33 | 0.4% |
| Hawaiian / Pacific | 0 | 0.0% |
| Hispanic or Latino | 239 | 3.0% |
| Native / Alaskan | 217 | 2.8% |
| White / Caucasian | 6,954 | 88.2% |
| Two or more Races | 640 | 8.1% |
| Some other Race | 15 | 0.2% |
| Total | 7,880 | 100.0% |
Ancestry in Searcy County
The most populous ancestries reported in Searcy County are English (1,187 | 15.1%), Irish (990 | 12.6%), German (761 | 9.7%), American (626 | 7.9%), and Cherokee (233 | 3.0%), together accounting for 48.2% of all Searcy County residents.

| Ancestry | # Population | % Population |
| American | 626 | 7.9% |
| Blackfeet | 70 | 0.9% |
| British | 27 | 0.3% |
| Central American | 12 | 0.2% |
| Cherokee | 233 | 3.0% |
| Choctaw | 10 | 0.1% |
| Costa Rican | 12 | 0.2% |
| Creek | 68 | 0.9% |
| Dutch | 159 | 2.0% |
| English | 1,187 | 15.1% |
| European | 94 | 1.2% |
| Finnish | 2 | 0.0% |
| French | 89 | 1.1% |
| German | 761 | 9.7% |
| Indian (Asian) | 14 | 0.2% |
| Irish | 990 | 12.6% |
| Israeli | 62 | 0.8% |
| Italian | 125 | 1.6% |
| Mexican | 227 | 2.9% |
| Osage | 19 | 0.2% |
| Pakistani | 18 | 0.2% |
| Pennsylvania German | 29 | 0.4% |
| Polish | 44 | 0.6% |
| Portuguese | 13 | 0.2% |
| Potawatomi | 6 | 0.1% |
| Scandinavian | 16 | 0.2% |
| Scotch-Irish | 45 | 0.6% |
| Scottish | 113 | 1.4% |
| Swedish | 87 | 1.1% |
| Ukrainian | 15 | 0.2% |
| Welsh | 92 | 1.2% | View All 31 Rows |
Immigrants in Searcy County
The most numerous immigrant groups reported in Searcy County came from Central America (29 | 0.4%), Latin America (29 | 0.4%), Mexico (29 | 0.4%), Asia (21 | 0.3%), and South Eastern Asia (18 | 0.2%), together accounting for 1.6% of all Searcy County residents.

| Immigration Origin | # Population | % Population |
| Asia | 21 | 0.3% |
| Central America | 29 | 0.4% |
| China | 3 | 0.0% |
| Eastern Asia | 3 | 0.0% |
| Latin America | 29 | 0.4% |
| Mexico | 29 | 0.4% |
| South Eastern Asia | 18 | 0.2% |
| Thailand | 18 | 0.2% | View All 8 Rows |
Sex and Age in Searcy County
Sex and Age in Searcy County
The most populous age groups in Searcy County are 65 to 69 Years (368 | 9.3%) for men and 65 to 69 Years (339 | 8.6%) for women.

| Age Bracket | Male | Female |
| Under 5 Years | 175 (4.4%) | 202 (5.1%) |
| 5 to 9 Years | 263 (6.7%) | 189 (4.8%) |
| 10 to 14 Years | 212 (5.4%) | 223 (5.7%) |
| 15 to 19 Years | 185 (4.7%) | 264 (6.7%) |
| 20 to 24 Years | 213 (5.4%) | 220 (5.6%) |
| 25 to 29 Years | 202 (5.1%) | 175 (4.4%) |
| 30 to 34 Years | 184 (4.7%) | 196 (5.0%) |
| 35 to 39 Years | 155 (3.9%) | 115 (2.9%) |
| 40 to 44 Years | 339 (8.6%) | 263 (6.7%) |
| 45 to 49 Years | 124 (3.1%) | 213 (5.4%) |
| 50 to 54 Years | 244 (6.2%) | 270 (6.9%) |
| 55 to 59 Years | 311 (7.9%) | 282 (7.2%) |
| 60 to 64 Years | 362 (9.2%) | 309 (7.9%) |
| 65 to 69 Years | 368 (9.3%) | 339 (8.6%) |
| 70 to 74 Years | 240 (6.1%) | 195 (5.0%) |
| 75 to 79 Years | 185 (4.7%) | 178 (4.5%) |
| 80 to 84 Years | 153 (3.9%) | 113 (2.9%) |
| 85 Years and over | 29 (0.7%) | 190 (4.8%) |
| Total | 3,944 (100.0%) | 3,936 (100.0%) |
Families and Households in Searcy County
Median Family Size in Searcy County
The median family size in Searcy County is 3.18 persons per family, with single male/father families (100 | 5.0%) accounting for the largest median family size of 4.26 persons per family. On the other hand, married-couple families (1,654 | 82.5%) represent the smallest median family size with 3.03 persons per family.

| Family Type | # Families | Family Size |
| Married-Couple | 1,654 (82.5%) | 3.03 |
| Single Male/Father | 100 (5.0%) | 4.26 |
| Single Female/Mother | 252 (12.6%) | 3.77 |
| Total Families | 2,006 (100.0%) | 3.18 |
Median Household Size in Searcy County
The median household size in Searcy County is 2.64 persons per household, with single male/father households (100 | 3.4%) accounting for the largest median household size of 5.05 persons per household. non-family households (942 | 32.0%) represent the smallest median household size with 1.24 persons per household.

| Household Type | # Households | Household Size |
| Married-Couple | 1,654 (56.1%) | 3.10 |
| Single Male/Father | 100 (3.4%) | 5.05 |
| Single Female/Mother | 252 (8.6%) | 3.94 |
| Non-family | 942 (32.0%) | 1.24 |
| Total Households | 2,948 (100.0%) | 2.64 |
Household Size by Marriage Status in Searcy County
Out of a total of 2,948 households in Searcy County, 2,006 (68.0%) are family households, while 942 (32.0%) are nonfamily households. The most numerous type of family households are 2-person households, comprising 1,052, and the most common type of nonfamily households are 1-person households, comprising 806.

| Household Size | Family Households | Nonfamily Households |
| 1-Person Households | - | 806 (27.3%) |
| 2-Person Households | 1,052 (35.7%) | 121 (4.1%) |
| 3-Person Households | 552 (18.7%) | 15 (0.5%) |
| 4-Person Households | 175 (5.9%) | 0 (0.0%) |
| 5-Person Households | 113 (3.8%) | 0 (0.0%) |
| 6-Person Households | 93 (3.2%) | 0 (0.0%) |
| 7+ Person Households | 21 (0.7%) | 0 (0.0%) |
| Total | 2,006 (68.0%) | 942 (32.0%) |
Female Fertility in Searcy County
Fertility by Age in Searcy County
Average fertility rate in Searcy County is 70.0 births per 1,000 women. Women in the age bracket of 20 to 34 years have the highest fertility rate with 130.0 births per 1,000 women. Women in the age bracket of 20 to 34 years acount for 74.0% of all women with births.
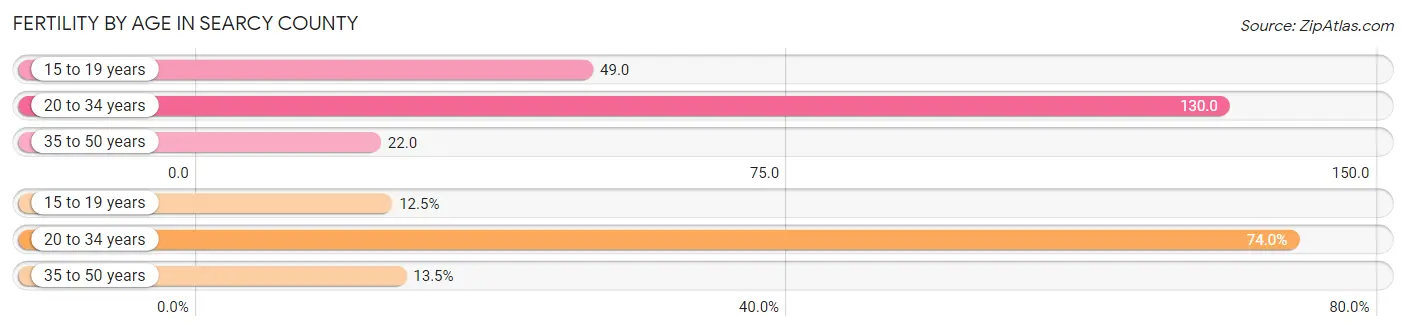
| Age Bracket | Women with Births | Births / 1,000 Women |
| 15 to 19 years | 13 (12.5%) | 49.0 |
| 20 to 34 years | 77 (74.0%) | 130.0 |
| 35 to 50 years | 14 (13.5%) | 22.0 |
| Total | 104 (100.0%) | 70.0 |
Fertility by Age by Marriage Status in Searcy County
76.9% of women with births (104) in Searcy County are married. The highest percentage of unmarried women with births falls into 15 to 19 years age bracket with 100.0% of them unmarried at the time of birth, while the lowest percentage of unmarried women with births belong to 20 to 34 years age bracket with 0.0% of them unmarried.
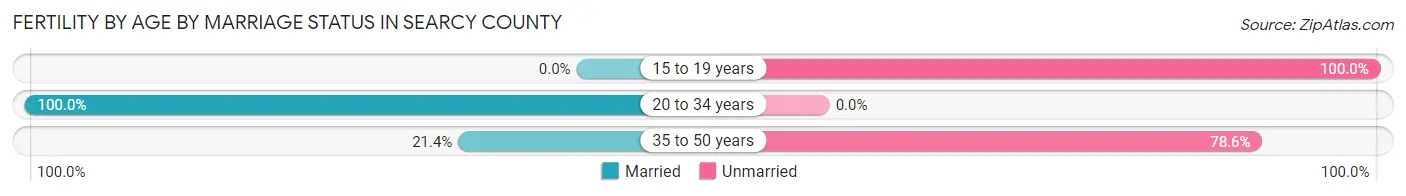
| Age Bracket | Married | Unmarried |
| 15 to 19 years | 0 (0.0%) | 13 (100.0%) |
| 20 to 34 years | 77 (100.0%) | 0 (0.0%) |
| 35 to 50 years | 3 (21.4%) | 11 (78.6%) |
| Total | 80 (76.9%) | 24 (23.1%) |
Fertility by Education in Searcy County
Average fertility rate in Searcy County is 70.0 births per 1,000 women. Women with the education attainment of high school diploma have the highest fertility rate of 137.0 births per 1,000 women, while women with the education attainment of bachelor's degree have the lowest fertility at 12.0 births per 1,000 women. Women with the education attainment of high school diploma represent 52.9% of all women with births.

| Educational Attainment | Women with Births | Births / 1,000 Women |
| Less than High School | 10 (9.6%) | 24.0 |
| High School Diploma | 55 (52.9%) | 137.0 |
| College or Associate's Degree | 35 (33.7%) | 75.0 |
| Bachelor's Degree | 2 (1.9%) | 12.0 |
| Graduate Degree | 2 (1.9%) | 56.0 |
| Total | 104 (100.0%) | 70.0 |
Fertility by Education by Marriage Status in Searcy County
23.1% of women with births in Searcy County are unmarried. Women with the educational attainment of college or associate's degree are most likely to be married with 100.0% of them married at childbirth, while women with the educational attainment of less than high school are least likely to be married with 100.0% of them unmarried at childbirth.
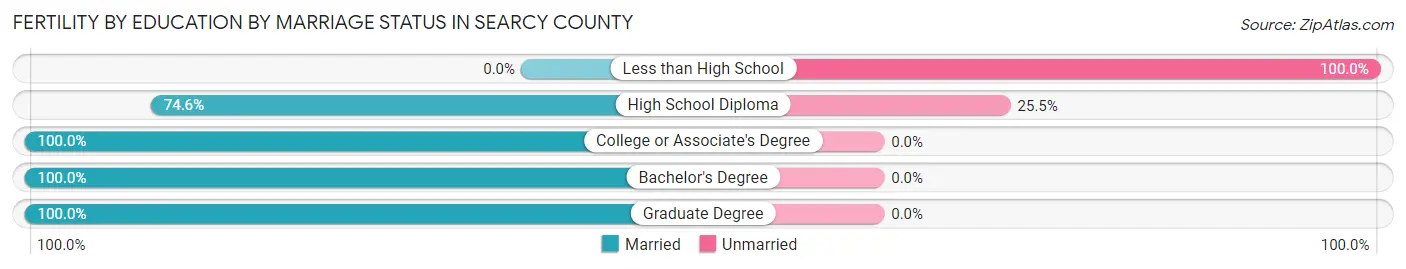
| Educational Attainment | Married | Unmarried |
| Less than High School | 0 (0.0%) | 10 (100.0%) |
| High School Diploma | 41 (74.6%) | 14 (25.5%) |
| College or Associate's Degree | 35 (100.0%) | 0 (0.0%) |
| Bachelor's Degree | 2 (100.0%) | 0 (0.0%) |
| Graduate Degree | 2 (100.0%) | 0 (0.0%) |
| Total | 80 (76.9%) | 24 (23.1%) |
Income in Searcy County
Income Overview in Searcy County
Per Capita Income in Searcy County is $22,384, while median incomes of families and households are $52,830 and $42,063 respectively.
| Characteristic | Number | Measure |
| Per Capita Income | 7,880 | $22,384 |
| Median Family Income | 2,006 | $52,830 |
| Mean Family Income | 2,006 | $63,903 |
| Median Household Income | 2,948 | $42,063 |
| Mean Household Income | 2,948 | $55,577 |
| Income Deficit | 2,006 | $7,240 |
| Wage / Income Gap (%) | 7,880 | 21.94% |
| Wage / Income Gap ($) | 7,880 | 78.06¢ per $1 |
| Gini / Inequality Index | 7,880 | 0.44 |
Earnings by Sex in Searcy County
Average Earnings in Searcy County are $24,765, $27,739 for men and $21,652 for women, a difference of 21.9%.

| Sex | Number | Average Earnings |
| Male | 1,647 (51.5%) | $27,739 |
| Female | 1,552 (48.5%) | $21,652 |
| Total | 3,199 (100.0%) | $24,765 |
Earnings by Sex by Income Bracket in Searcy County
The most common earnings brackets in Searcy County are $35,000 to $39,999 for men (193 | 11.7%) and $55,000 to $64,999 for women (226 | 14.6%).

| Income | Male | Female |
| $2,499 or less | 80 (4.9%) | 68 (4.4%) |
| $2,500 to $4,999 | 57 (3.5%) | 77 (5.0%) |
| $5,000 to $7,499 | 134 (8.1%) | 57 (3.7%) |
| $7,500 to $9,999 | 36 (2.2%) | 28 (1.8%) |
| $10,000 to $12,499 | 85 (5.2%) | 75 (4.8%) |
| $12,500 to $14,999 | 71 (4.3%) | 106 (6.8%) |
| $15,000 to $17,499 | 4 (0.2%) | 200 (12.9%) |
| $17,500 to $19,999 | 149 (9.0%) | 128 (8.3%) |
| $20,000 to $22,499 | 39 (2.4%) | 56 (3.6%) |
| $22,500 to $24,999 | 119 (7.2%) | 46 (3.0%) |
| $25,000 to $29,999 | 92 (5.6%) | 42 (2.7%) |
| $30,000 to $34,999 | 85 (5.2%) | 94 (6.1%) |
| $35,000 to $39,999 | 193 (11.7%) | 81 (5.2%) |
| $40,000 to $44,999 | 85 (5.2%) | 33 (2.1%) |
| $45,000 to $49,999 | 85 (5.2%) | 54 (3.5%) |
| $50,000 to $54,999 | 86 (5.2%) | 117 (7.5%) |
| $55,000 to $64,999 | 102 (6.2%) | 226 (14.6%) |
| $65,000 to $74,999 | 35 (2.1%) | 4 (0.3%) |
| $75,000 to $99,999 | 77 (4.7%) | 22 (1.4%) |
| $100,000+ | 33 (2.0%) | 38 (2.5%) |
| Total | 1,647 (100.0%) | 1,552 (100.0%) |
Earnings by Sex by Educational Attainment in Searcy County
Average earnings in Searcy County are $33,333 for men and $28,700 for women, a difference of 13.9%. Men with an educational attainment of graduate degree enjoy the highest average annual earnings of $62,500, while those with high school diploma education earn the least with $19,898. Women with an educational attainment of bachelor's degree earn the most with the average annual earnings of $44,375, while those with high school diploma education have the smallest earnings of $18,846.

| Educational Attainment | Male Income | Female Income |
| Less than High School | $37,031 | $20,074 |
| High School Diploma | $19,898 | $18,846 |
| College or Associate's Degree | $40,809 | $19,795 |
| Bachelor's Degree | $38,234 | $44,375 |
| Graduate Degree | $62,500 | $0 |
| Total | $33,333 | $28,700 |
Family Income in Searcy County
Family Income Brackets in Searcy County
According to the Searcy County family income data, there are 375 families falling into the $50,000 to $74,999 income range, which is the most common income bracket and makes up 18.7% of all families. Conversely, the $200,000+ income bracket is the least frequent group with only 14 families (0.7%) belonging to this category.

| Income Bracket | # Families | % Families |
| Less than $10,000 | 46 | 2.3% |
| $10,000 to $14,999 | 124 | 6.2% |
| $15,000 to $24,999 | 205 | 10.2% |
| $25,000 to $34,999 | 193 | 9.6% |
| $35,000 to $49,999 | 373 | 18.6% |
| $50,000 to $74,999 | 375 | 18.7% |
| $75,000 to $99,999 | 333 | 16.6% |
| $100,000 to $149,999 | 249 | 12.4% |
| $150,000 to $199,999 | 96 | 4.8% |
| $200,000+ | 14 | 0.7% |
Family Income by Famaliy Size in Searcy County
5-person families (74 | 3.7%) account for the highest median family income in Searcy County with $121,000 per family, while 5-person families (74 | 3.7%) have the highest median income of $24,200 per family member.

| Income Bracket | # Families | Median Income |
| 2-Person Families | 1,079 (53.8%) | $46,543 |
| 3-Person Families | 571 (28.5%) | $61,797 |
| 4-Person Families | 176 (8.8%) | $61,444 |
| 5-Person Families | 74 (3.7%) | $121,000 |
| 6-Person Families | 93 (4.6%) | $36,366 |
| 7+ Person Families | 13 (0.6%) | $97,969 |
| Total | 2,006 (100.0%) | $52,830 |
Family Income by Number of Earners in Searcy County
The median family income in Searcy County is $52,830, with families comprising 3+ earners (149) having the highest median family income of $95,842, while families with no earners (523) have the lowest median family income of $38,073, accounting for 7.4% and 26.1% of families, respectively.

| Number of Earners | # Families | Median Income |
| No Earners | 523 (26.1%) | $38,073 |
| 1 Earner | 599 (29.9%) | $39,495 |
| 2 Earners | 735 (36.6%) | $73,348 |
| 3+ Earners | 149 (7.4%) | $95,842 |
| Total | 2,006 (100.0%) | $52,830 |
Household Income in Searcy County
Household Income Brackets in Searcy County
With 472 households falling in the category, the $50,000 to $74,999 income range is the most frequent in Searcy County, accounting for 16.0% of all households. In contrast, only 32 households (1.1%) fall into the $200,000+ income bracket, making it the least populous group.

| Income Bracket | # Households | % Households |
| Less than $10,000 | 153 | 5.2% |
| $10,000 to $14,999 | 374 | 12.7% |
| $15,000 to $24,999 | 363 | 12.3% |
| $25,000 to $34,999 | 336 | 11.4% |
| $35,000 to $49,999 | 469 | 15.9% |
| $50,000 to $74,999 | 472 | 16.0% |
| $75,000 to $99,999 | 392 | 13.3% |
| $100,000 to $149,999 | 262 | 8.9% |
| $150,000 to $199,999 | 97 | 3.3% |
| $200,000+ | 32 | 1.1% |
Household Income by Householder Age in Searcy County
The median household income in Searcy County is $42,063, with the highest median household income of $63,036 found in the 45 to 64 years age bracket for the primary householder. A total of 965 households (32.7%) fall into this category. Meanwhile, the 15 to 24 years age bracket for the primary householder has the lowest median household income of $0, with 75 households (2.5%) in this group.

| Income Bracket | # Households | Median Income |
| 15 to 24 Years | 75 (2.5%) | $0 |
| 25 to 44 Years | 629 (21.3%) | $51,683 |
| 45 to 64 Years | 965 (32.7%) | $63,036 |
| 65+ Years | 1,279 (43.4%) | $32,639 |
| Total | 2,948 (100.0%) | $42,063 |
Poverty in Searcy County
Income Below Poverty by Sex and Age in Searcy County
With 22.3% poverty level for males and 30.9% for females among the residents of Searcy County, 6 to 11 year old males and under 5 year old females are the most vulnerable to poverty, with 183 males (54.9%) and 133 females (65.8%) in their respective age groups living below the poverty level.

| Age Bracket | Male | Female |
| Under 5 Years | 23 (13.1%) | 133 (65.8%) |
| 5 Years | 0 (0.0%) | 8 (21.6%) |
| 6 to 11 Years | 183 (54.9%) | 55 (31.6%) |
| 12 to 14 Years | 34 (32.7%) | 53 (34.9%) |
| 15 Years | 4 (10.5%) | 29 (44.6%) |
| 16 and 17 Years | 35 (34.6%) | 55 (45.1%) |
| 18 to 24 Years | 32 (12.4%) | 117 (39.4%) |
| 25 to 34 Years | 121 (33.1%) | 83 (22.4%) |
| 35 to 44 Years | 147 (29.9%) | 184 (48.9%) |
| 45 to 54 Years | 32 (8.8%) | 59 (12.2%) |
| 55 to 64 Years | 88 (13.3%) | 187 (31.6%) |
| 65 to 74 Years | 97 (16.0%) | 85 (15.9%) |
| 75 Years and over | 66 (19.0%) | 144 (31.8%) |
| Total | 862 (22.3%) | 1,192 (30.9%) |
Income Above Poverty by Sex and Age in Searcy County
According to the poverty statistics in Searcy County, males aged 5 years and females aged 45 to 54 years are the age groups that are most secure financially, with 100.0% of males and 87.8% of females in these age groups living above the poverty line.

| Age Bracket | Male | Female |
| Under 5 Years | 152 (86.9%) | 69 (34.2%) |
| 5 Years | 24 (100.0%) | 29 (78.4%) |
| 6 to 11 Years | 150 (45.1%) | 119 (68.4%) |
| 12 to 14 Years | 70 (67.3%) | 99 (65.1%) |
| 15 Years | 34 (89.5%) | 36 (55.4%) |
| 16 and 17 Years | 66 (65.3%) | 67 (54.9%) |
| 18 to 24 Years | 227 (87.6%) | 180 (60.6%) |
| 25 to 34 Years | 245 (66.9%) | 288 (77.6%) |
| 35 to 44 Years | 345 (70.1%) | 192 (51.1%) |
| 45 to 54 Years | 332 (91.2%) | 424 (87.8%) |
| 55 to 64 Years | 574 (86.7%) | 404 (68.4%) |
| 65 to 74 Years | 511 (84.1%) | 449 (84.1%) |
| 75 Years and over | 282 (81.0%) | 309 (68.2%) |
| Total | 3,012 (77.7%) | 2,665 (69.1%) |
Income Below Poverty Among Married-Couple Families in Searcy County
The poverty statistics for married-couple families in Searcy County show that 13.8% or 228 of the total 1,654 families live below the poverty line. Families with 3 or 4 children have the highest poverty rate of 53.5%, comprising of 69 families. On the other hand, families with 5 or more children have the lowest poverty rate of 0.0%, which includes 0 families.

| Children | Above Poverty | Below Poverty |
| No Children | 1,048 (90.3%) | 112 (9.7%) |
| 1 or 2 Children | 316 (87.1%) | 47 (13.0%) |
| 3 or 4 Children | 60 (46.5%) | 69 (53.5%) |
| 5 or more Children | 2 (100.0%) | 0 (0.0%) |
| Total | 1,426 (86.2%) | 228 (13.8%) |
Income Below Poverty Among Single-Parent Households in Searcy County
According to the poverty data in Searcy County, 58.0% or 58 single-father households and 32.1% or 81 single-mother households are living below the poverty line. Among single-father households, those with 3 or 4 children have the highest poverty rate, with 8 households (88.9%) experiencing poverty. Likewise, among single-mother households, those with 3 or 4 children have the highest poverty rate, with 23 households (100.0%) falling below the poverty line.

| Children | Single Father | Single Mother |
| No Children | 17 (40.5%) | 2 (1.5%) |
| 1 or 2 Children | 33 (67.3%) | 56 (60.2%) |
| 3 or 4 Children | 8 (88.9%) | 23 (100.0%) |
| 5 or more Children | 0 (0.0%) | 0 (0.0%) |
| Total | 58 (58.0%) | 81 (32.1%) |
Income Below Poverty Among Married-Couple vs Single-Parent Households in Searcy County
The poverty data for Searcy County shows that 228 of the married-couple family households (13.8%) and 139 of the single-parent households (39.5%) are living below the poverty level. Within the married-couple family households, those with 3 or 4 children have the highest poverty rate, with 69 households (53.5%) falling below the poverty line. Among the single-parent households, those with 3 or 4 children have the highest poverty rate, with 31 household (96.9%) living below poverty.

| Children | Married-Couple Families | Single-Parent Households |
| No Children | 112 (9.7%) | 19 (10.7%) |
| 1 or 2 Children | 47 (13.0%) | 89 (62.7%) |
| 3 or 4 Children | 69 (53.5%) | 31 (96.9%) |
| 5 or more Children | 0 (0.0%) | 0 (0.0%) |
| Total | 228 (13.8%) | 139 (39.5%) |
Employment Characteristics in Searcy County
Employment by Class of Employer in Searcy County
Among the 2,844 employed individuals in Searcy County, private company employees (1,691 | 59.5%), state government employees (321 | 11.3%), and self-employed (not incorporated) (261 | 9.2%) make up the most common classes of employment.
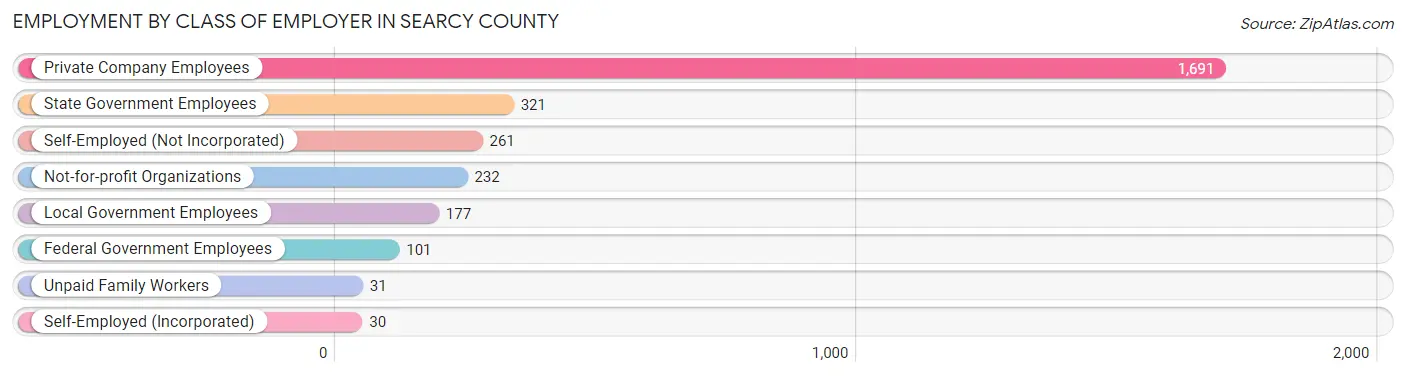
| Employer Class | # Employees | % Employees |
| Private Company Employees | 1,691 | 59.5% |
| Self-Employed (Incorporated) | 30 | 1.1% |
| Self-Employed (Not Incorporated) | 261 | 9.2% |
| Not-for-profit Organizations | 232 | 8.2% |
| Local Government Employees | 177 | 6.2% |
| State Government Employees | 321 | 11.3% |
| Federal Government Employees | 101 | 3.5% |
| Unpaid Family Workers | 31 | 1.1% |
| Total | 2,844 | 100.0% |
Employment Status by Age in Searcy County
According to the labor force statistics for Searcy County, out of the total population over 16 years of age (6,513), 47.3% or 3,081 individuals are in the labor force, with 5.2% or 160 of them unemployed. The age group with the highest labor force participation rate is 45 to 54 years, with 77.4% or 659 individuals in the labor force. Within the labor force, the 16 to 19 years age range has the highest percentage of unemployed individuals, with 34.9% or 44 of them being unemployed.
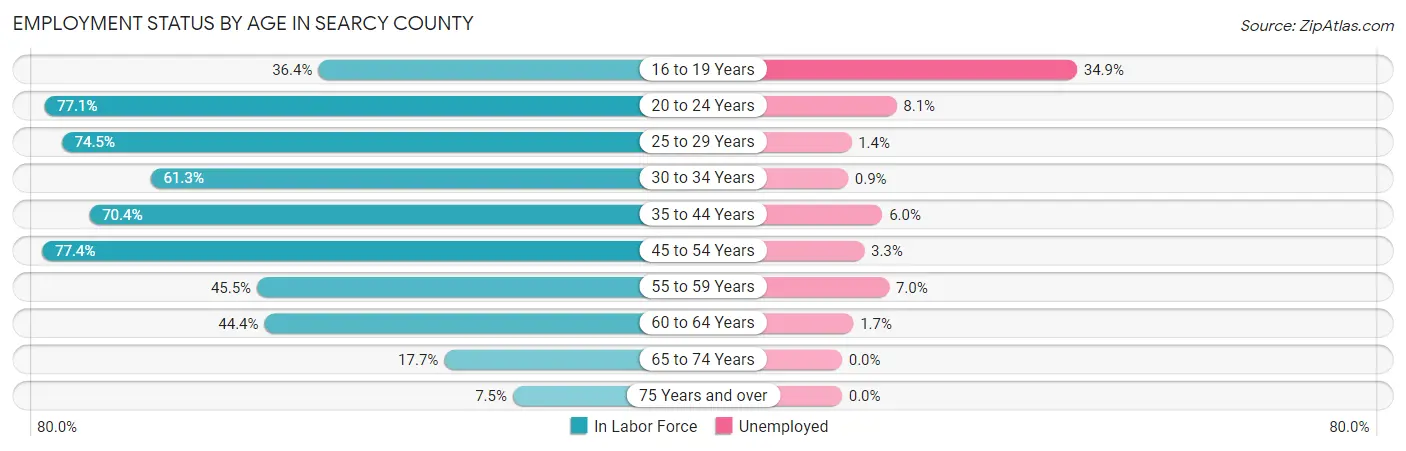
| Age Bracket | In Labor Force | Unemployed |
| 16 to 19 Years | 126 (36.4%) | 44 (34.9%) |
| 20 to 24 Years | 334 (77.1%) | 27 (8.1%) |
| 25 to 29 Years | 281 (74.5%) | 4 (1.4%) |
| 30 to 34 Years | 233 (61.3%) | 2 (0.9%) |
| 35 to 44 Years | 614 (70.4%) | 37 (6.0%) |
| 45 to 54 Years | 659 (77.4%) | 22 (3.3%) |
| 55 to 59 Years | 270 (45.5%) | 19 (7.0%) |
| 60 to 64 Years | 298 (44.4%) | 5 (1.7%) |
| 65 to 74 Years | 202 (17.7%) | 0 (0.0%) |
| 75 Years and over | 64 (7.5%) | 0 (0.0%) |
| Total | 3,081 (47.3%) | 160 (5.2%) |
Employment Status by Educational Attainment in Searcy County
According to labor force statistics for Searcy County, 62.9% of individuals (2,355) out of the total population between 25 and 64 years of age (3,744) are in the labor force, with 3.8% or 89 of them being unemployed. The group with the highest labor force participation rate are those with the educational attainment of bachelor's degree or higher, with 80.2% or 489 individuals in the labor force. Within the labor force, individuals with high school diploma education have the highest percentage of unemployment, with 6.1% or 53 of them being unemployed.

| Educational Attainment | In Labor Force | Unemployed |
| Less than High School | 162 (29.1%) | 21 (3.7%) |
| High School Diploma | 863 (58.4%) | 90 (6.1%) |
| College / Associate Degree | 842 (76.5%) | 36 (3.3%) |
| Bachelor's Degree or higher | 489 (80.2%) | 2 (0.4%) |
| Total | 2,355 (62.9%) | 142 (3.8%) |
Employment Occupations by Sex in Searcy County
Management, Business, Science and Arts Occupations
The most common Management, Business, Science and Arts occupations in Searcy County are Community & Social Service (364 | 12.5%), Education Instruction & Library (318 | 10.9%), Management (213 | 7.3%), Health Diagnosing & Treating (136 | 4.7%), and Computers, Engineering & Science (128 | 4.4%).

Management, Business, Science and Arts Occupations by Sex
Within the Management, Business, Science and Arts occupations in Searcy County, the most male-oriented occupations are Life, Physical & Social Science (100.0%), Education, Arts & Media (57.6%), and Computers, Engineering & Science (56.2%), while the most female-oriented occupations are Legal Services & Support (100.0%), Health Diagnosing & Treating (100.0%), and Health Technologists (100.0%).
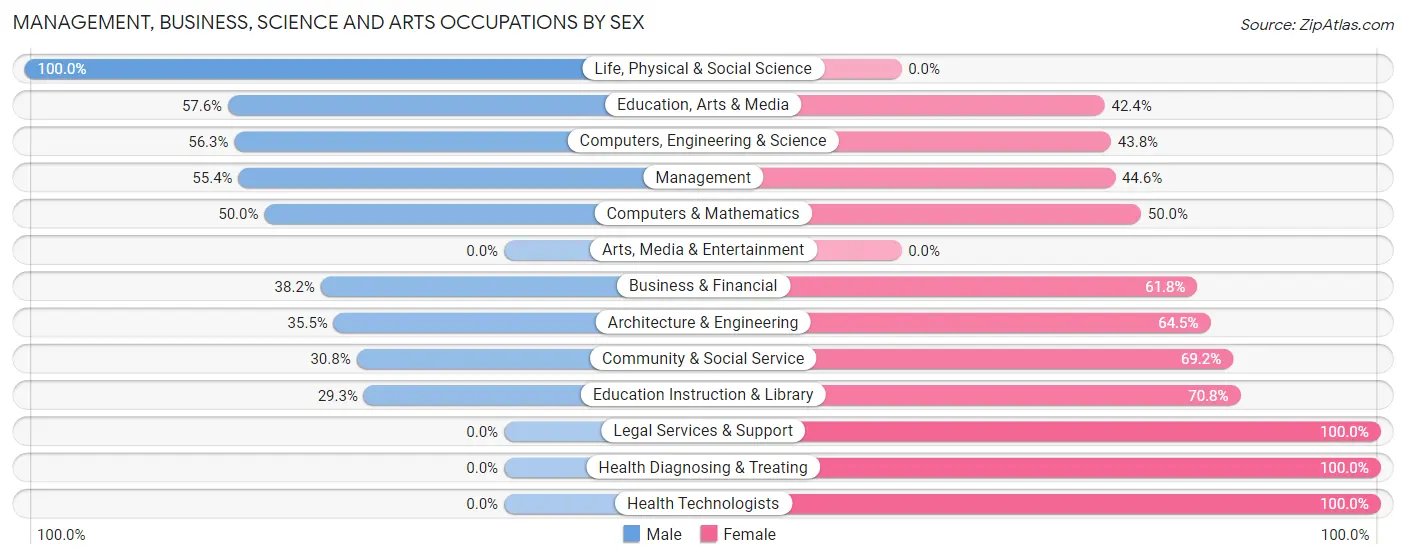
| Occupation | Male | Female |
| Management | 118 (55.4%) | 95 (44.6%) |
| Business & Financial | 39 (38.2%) | 63 (61.8%) |
| Computers, Engineering & Science | 72 (56.2%) | 56 (43.8%) |
| Computers & Mathematics | 7 (50.0%) | 7 (50.0%) |
| Architecture & Engineering | 27 (35.5%) | 49 (64.5%) |
| Life, Physical & Social Science | 38 (100.0%) | 0 (0.0%) |
| Community & Social Service | 112 (30.8%) | 252 (69.2%) |
| Education, Arts & Media | 19 (57.6%) | 14 (42.4%) |
| Legal Services & Support | 0 (0.0%) | 13 (100.0%) |
| Education Instruction & Library | 93 (29.2%) | 225 (70.8%) |
| Arts, Media & Entertainment | 0 (0.0%) | 0 (0.0%) |
| Health Diagnosing & Treating | 0 (0.0%) | 136 (100.0%) |
| Health Technologists | 0 (0.0%) | 62 (100.0%) |
| Total (Category) | 341 (36.2%) | 602 (63.8%) |
| Total (Overall) | 1,464 (50.4%) | 1,442 (49.6%) |
Services Occupations
The most common Services occupations in Searcy County are Cleaning & Maintenance (132 | 4.5%), Food Preparation & Serving (121 | 4.2%), Healthcare Support (114 | 3.9%), Security & Protection (70 | 2.4%), and Firefighting & Prevention (61 | 2.1%).

Services Occupations by Sex
Within the Services occupations in Searcy County, the most male-oriented occupations are Security & Protection (100.0%), Firefighting & Prevention (100.0%), and Law Enforcement (100.0%), while the most female-oriented occupations are Healthcare Support (89.5%), Food Preparation & Serving (86.8%), and Personal Care & Service (60.0%).

| Occupation | Male | Female |
| Healthcare Support | 12 (10.5%) | 102 (89.5%) |
| Security & Protection | 70 (100.0%) | 0 (0.0%) |
| Firefighting & Prevention | 61 (100.0%) | 0 (0.0%) |
| Law Enforcement | 9 (100.0%) | 0 (0.0%) |
| Food Preparation & Serving | 16 (13.2%) | 105 (86.8%) |
| Cleaning & Maintenance | 66 (50.0%) | 66 (50.0%) |
| Personal Care & Service | 10 (40.0%) | 15 (60.0%) |
| Total (Category) | 174 (37.7%) | 288 (62.3%) |
| Total (Overall) | 1,464 (50.4%) | 1,442 (49.6%) |
Sales and Office Occupations
The most common Sales and Office occupations in Searcy County are Office & Administration (328 | 11.3%), and Sales & Related (272 | 9.4%).

Sales and Office Occupations by Sex

| Occupation | Male | Female |
| Sales & Related | 109 (40.1%) | 163 (59.9%) |
| Office & Administration | 52 (15.9%) | 276 (84.2%) |
| Total (Category) | 161 (26.8%) | 439 (73.2%) |
| Total (Overall) | 1,464 (50.4%) | 1,442 (49.6%) |
Natural Resources, Construction and Maintenance Occupations
The most common Natural Resources, Construction and Maintenance occupations in Searcy County are Construction & Extraction (116 | 4.0%), Installation, Maintenance & Repair (112 | 3.8%), and Farming, Fishing & Forestry (51 | 1.8%).
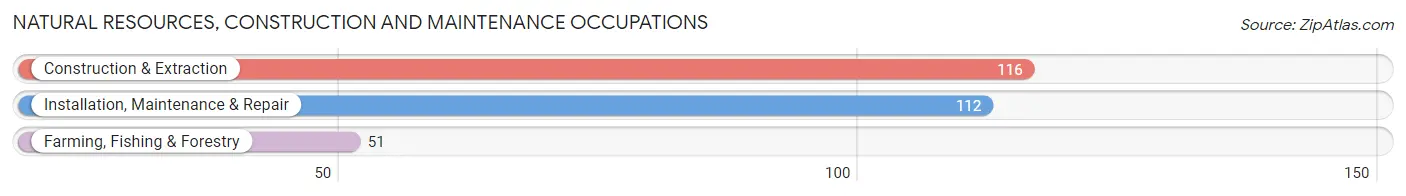
Natural Resources, Construction and Maintenance Occupations by Sex

| Occupation | Male | Female |
| Farming, Fishing & Forestry | 32 (62.7%) | 19 (37.2%) |
| Construction & Extraction | 106 (91.4%) | 10 (8.6%) |
| Installation, Maintenance & Repair | 112 (100.0%) | 0 (0.0%) |
| Total (Category) | 250 (89.6%) | 29 (10.4%) |
| Total (Overall) | 1,464 (50.4%) | 1,442 (49.6%) |
Production, Transportation and Moving Occupations
The most common Production, Transportation and Moving occupations in Searcy County are Production (309 | 10.6%), Material Moving (172 | 5.9%), and Transportation (141 | 4.9%).

Production, Transportation and Moving Occupations by Sex

| Occupation | Male | Female |
| Production | 234 (75.7%) | 75 (24.3%) |
| Transportation | 135 (95.7%) | 6 (4.3%) |
| Material Moving | 169 (98.3%) | 3 (1.7%) |
| Total (Category) | 538 (86.5%) | 84 (13.5%) |
| Total (Overall) | 1,464 (50.4%) | 1,442 (49.6%) |
Employment Industries by Sex in Searcy County
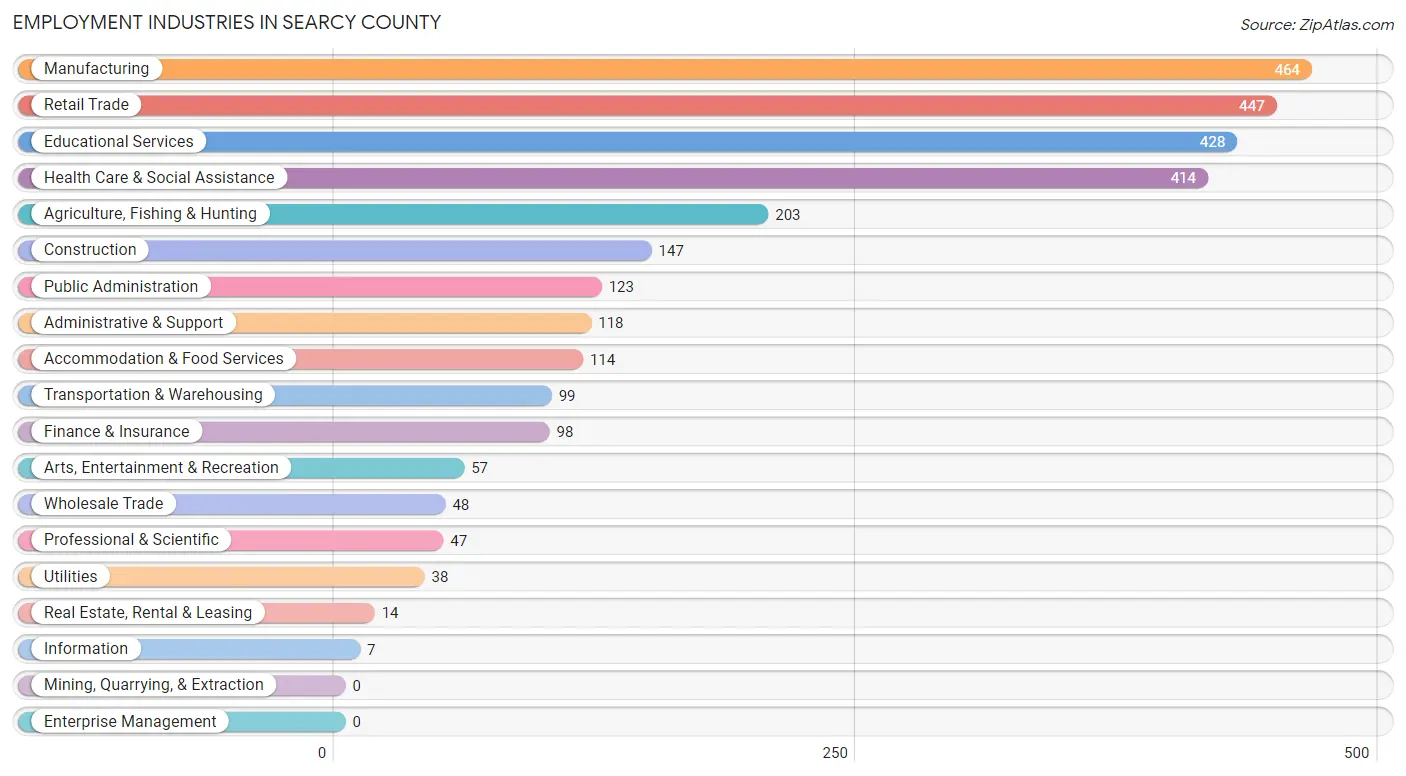
Employment Industries in Searcy County
The major employment industries in Searcy County include Manufacturing (464 | 16.0%), Retail Trade (447 | 15.4%), Educational Services (428 | 14.7%), Health Care & Social Assistance (414 | 14.2%), and Agriculture, Fishing & Hunting (203 | 7.0%).
Employment Industries by Sex in Searcy County
The Searcy County industries that see more men than women are Wholesale Trade (100.0%), Utilities (100.0%), and Information (100.0%), whereas the industries that tend to have a higher number of women are Professional & Scientific (100.0%), Health Care & Social Assistance (87.9%), and Finance & Insurance (86.7%).

| Industry | Male | Female |
| Agriculture, Fishing & Hunting | 147 (72.4%) | 56 (27.6%) |
| Mining, Quarrying, & Extraction | 0 (0.0%) | 0 (0.0%) |
| Construction | 141 (95.9%) | 6 (4.1%) |
| Manufacturing | 344 (74.1%) | 120 (25.9%) |
| Wholesale Trade | 48 (100.0%) | 0 (0.0%) |
| Retail Trade | 232 (51.9%) | 215 (48.1%) |
| Transportation & Warehousing | 35 (35.3%) | 64 (64.6%) |
| Utilities | 38 (100.0%) | 0 (0.0%) |
| Information | 7 (100.0%) | 0 (0.0%) |
| Finance & Insurance | 13 (13.3%) | 85 (86.7%) |
| Real Estate, Rental & Leasing | 3 (21.4%) | 11 (78.6%) |
| Professional & Scientific | 0 (0.0%) | 47 (100.0%) |
| Enterprise Management | 0 (0.0%) | 0 (0.0%) |
| Administrative & Support | 118 (100.0%) | 0 (0.0%) |
| Educational Services | 106 (24.8%) | 322 (75.2%) |
| Health Care & Social Assistance | 50 (12.1%) | 364 (87.9%) |
| Arts, Entertainment & Recreation | 20 (35.1%) | 37 (64.9%) |
| Accommodation & Food Services | 44 (38.6%) | 70 (61.4%) |
| Public Administration | 106 (86.2%) | 17 (13.8%) |
| Total | 1,464 (50.4%) | 1,442 (49.6%) |
Education in Searcy County
School Enrollment in Searcy County
The most common levels of schooling among the 1,400 students in Searcy County are high school (421 | 30.1%), elementary school (363 | 25.9%), and middle school (333 | 23.8%).
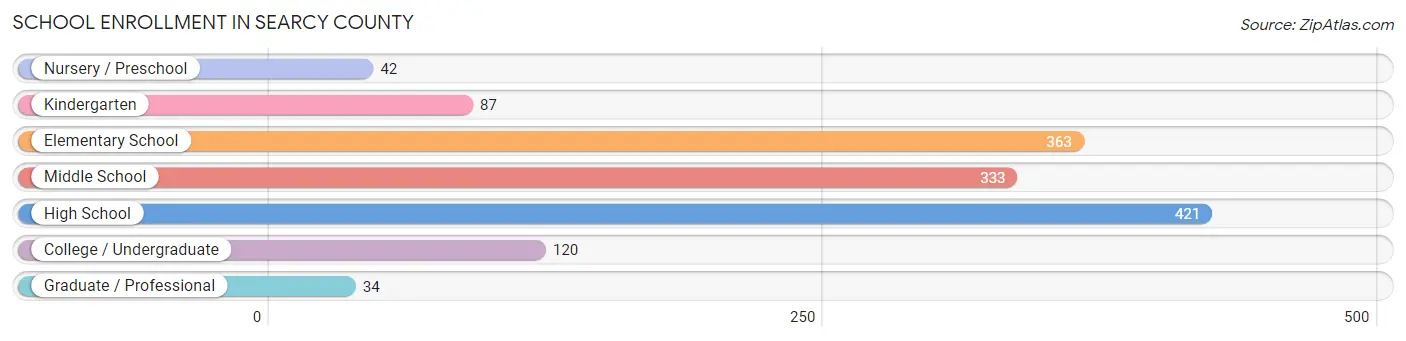
| School Level | # Students | % Students |
| Nursery / Preschool | 42 | 3.0% |
| Kindergarten | 87 | 6.2% |
| Elementary School | 363 | 25.9% |
| Middle School | 333 | 23.8% |
| High School | 421 | 30.1% |
| College / Undergraduate | 120 | 8.6% |
| Graduate / Professional | 34 | 2.4% |
| Total | 1,400 | 100.0% |
School Enrollment by Age by Funding Source in Searcy County
Out of a total of 1,400 students who are enrolled in schools in Searcy County, 203 (14.5%) attend a private institution, while the remaining 1,197 (85.5%) are enrolled in public schools. The age group of 15 to 17 year olds has the highest likelihood of being enrolled in private schools, with 99 (30.4% in the age bracket) enrolled. Conversely, the age group of 3 to 4 year olds has the lowest likelihood of being enrolled in a private school, with 20 (100.0% in the age bracket) attending a public institution.

| Age Bracket | Public School | Private School |
| 3 to 4 Year Olds | 20 (100.0%) | 0 (0.0%) |
| 5 to 9 Year Old | 433 (96.7%) | 15 (3.4%) |
| 10 to 14 Year Olds | 373 (86.1%) | 60 (13.9%) |
| 15 to 17 Year Olds | 227 (69.6%) | 99 (30.4%) |
| 18 to 19 Year Olds | 33 (100.0%) | 0 (0.0%) |
| 20 to 24 Year Olds | 3 (100.0%) | 0 (0.0%) |
| 25 to 34 Year Olds | 37 (100.0%) | 0 (0.0%) |
| 35 Years and over | 71 (71.0%) | 29 (29.0%) |
| Total | 1,197 (85.5%) | 203 (14.5%) |
Educational Attainment by Field of Study in Searcy County
Education (235 | 25.9%), bio, nature & agricultural (162 | 17.8%), science & technology (162 | 17.8%), business (122 | 13.4%), and literature & languages (65 | 7.1%) are the most common fields of study among 909 individuals in Searcy County who have obtained a bachelor's degree or higher.

| Field of Study | # Graduates | % Graduates |
| Computers & Mathematics | 15 | 1.7% |
| Bio, Nature & Agricultural | 162 | 17.8% |
| Physical & Health Sciences | 31 | 3.4% |
| Psychology | 0 | 0.0% |
| Social Sciences | 32 | 3.5% |
| Engineering | 23 | 2.5% |
| Multidisciplinary Studies | 18 | 2.0% |
| Science & Technology | 162 | 17.8% |
| Business | 122 | 13.4% |
| Education | 235 | 25.9% |
| Literature & Languages | 65 | 7.1% |
| Liberal Arts & History | 8 | 0.9% |
| Visual & Performing Arts | 21 | 2.3% |
| Communications | 0 | 0.0% |
| Arts & Humanities | 15 | 1.7% |
| Total | 909 | 100.0% |
Transportation & Commute in Searcy County
Vehicle Availability by Sex in Searcy County
The most prevalent vehicle ownership categories in Searcy County are males with 2 vehicles (476, accounting for 32.5%) and females with 2 vehicles (554, making up 34.5%).
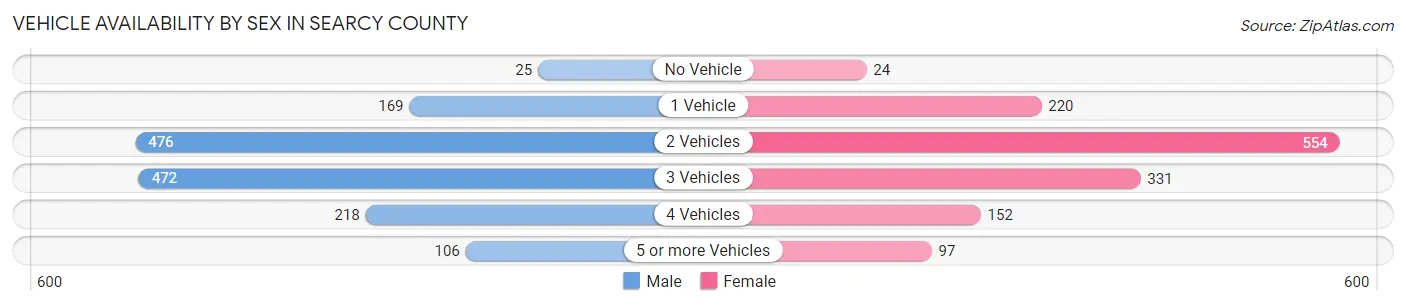
| Vehicles Available | Male | Female |
| No Vehicle | 25 (1.7%) | 24 (1.7%) |
| 1 Vehicle | 169 (11.5%) | 220 (16.0%) |
| 2 Vehicles | 476 (32.5%) | 554 (40.2%) |
| 3 Vehicles | 472 (32.2%) | 331 (24.0%) |
| 4 Vehicles | 218 (14.9%) | 152 (11.0%) |
| 5 or more Vehicles | 106 (7.2%) | 97 (7.0%) |
| Total | 1,466 (100.0%) | 1,378 (100.0%) |
Commute Time in Searcy County
The most frequently occuring commute durations in Searcy County are 20 to 24 minutes (340 commuters, 12.4%), 45 to 59 minutes (300 commuters, 10.9%), and 60 to 89 minutes (288 commuters, 10.5%).

| Commute Time | # Commuters | % Commuters |
| Less than 5 Minutes | 253 | 9.2% |
| 5 to 9 Minutes | 279 | 10.2% |
| 10 to 14 Minutes | 285 | 10.4% |
| 15 to 19 Minutes | 233 | 8.5% |
| 20 to 24 Minutes | 340 | 12.4% |
| 25 to 29 Minutes | 236 | 8.6% |
| 30 to 34 Minutes | 214 | 7.8% |
| 35 to 39 Minutes | 62 | 2.3% |
| 40 to 44 Minutes | 144 | 5.2% |
| 45 to 59 Minutes | 300 | 10.9% |
| 60 to 89 Minutes | 288 | 10.5% |
| 90 or more Minutes | 110 | 4.0% |
Commute Time by Sex in Searcy County
The most common commute times in Searcy County are 60 to 89 minutes (191 commuters, 13.3%) for males and 20 to 24 minutes (204 commuters, 15.6%) for females.

| Commute Time | Male | Female |
| Less than 5 Minutes | 127 (8.8%) | 126 (9.6%) |
| 5 to 9 Minutes | 140 (9.8%) | 139 (10.6%) |
| 10 to 14 Minutes | 182 (12.7%) | 103 (7.9%) |
| 15 to 19 Minutes | 94 (6.6%) | 139 (10.6%) |
| 20 to 24 Minutes | 136 (9.5%) | 204 (15.6%) |
| 25 to 29 Minutes | 51 (3.5%) | 185 (14.1%) |
| 30 to 34 Minutes | 131 (9.1%) | 83 (6.4%) |
| 35 to 39 Minutes | 57 (4.0%) | 5 (0.4%) |
| 40 to 44 Minutes | 77 (5.4%) | 67 (5.1%) |
| 45 to 59 Minutes | 157 (10.9%) | 143 (10.9%) |
| 60 to 89 Minutes | 191 (13.3%) | 97 (7.4%) |
| 90 or more Minutes | 93 (6.5%) | 17 (1.3%) |
Time of Departure to Work by Sex in Searcy County
The most frequent times of departure to work in Searcy County are 7:00 AM to 7:29 AM (206, 14.3%) for males and 7:00 AM to 7:29 AM (366, 28.0%) for females.

| Time of Departure | Male | Female |
| 12:00 AM to 4:59 AM | 181 (12.6%) | 118 (9.0%) |
| 5:00 AM to 5:29 AM | 102 (7.1%) | 62 (4.7%) |
| 5:30 AM to 5:59 AM | 124 (8.6%) | 14 (1.1%) |
| 6:00 AM to 6:29 AM | 168 (11.7%) | 139 (10.6%) |
| 6:30 AM to 6:59 AM | 168 (11.7%) | 101 (7.7%) |
| 7:00 AM to 7:29 AM | 206 (14.3%) | 366 (28.0%) |
| 7:30 AM to 7:59 AM | 130 (9.0%) | 194 (14.8%) |
| 8:00 AM to 8:29 AM | 86 (6.0%) | 85 (6.5%) |
| 8:30 AM to 8:59 AM | 0 (0.0%) | 49 (3.7%) |
| 9:00 AM to 9:59 AM | 17 (1.2%) | 20 (1.5%) |
| 10:00 AM to 10:59 AM | 137 (9.5%) | 37 (2.8%) |
| 11:00 AM to 11:59 AM | 59 (4.1%) | 38 (2.9%) |
| 12:00 PM to 3:59 PM | 54 (3.8%) | 44 (3.4%) |
| 4:00 PM to 11:59 PM | 4 (0.3%) | 41 (3.1%) |
| Total | 1,436 (100.0%) | 1,308 (100.0%) |
Housing Occupancy in Searcy County
Occupancy by Ownership in Searcy County
Of the total 2,948 dwellings in Searcy County, owner-occupied units account for 2,161 (73.3%), while renter-occupied units make up 787 (26.7%).

| Occupancy | # Housing Units | % Housing Units |
| Owner Occupied Housing Units | 2,161 | 73.3% |
| Renter-Occupied Housing Units | 787 | 26.7% |
| Total Occupied Housing Units | 2,948 | 100.0% |
Occupancy by Household Size in Searcy County

| Household Size | # Housing Units | % Housing Units |
| 1-Person Household | 806 | 27.3% |
| 2-Person Household | 1,173 | 39.8% |
| 3-Person Household | 567 | 19.2% |
| 4+ Person Household | 402 | 13.6% |
| Total Housing Units | 2,948 | 100.0% |
Occupancy by Ownership by Household Size in Searcy County
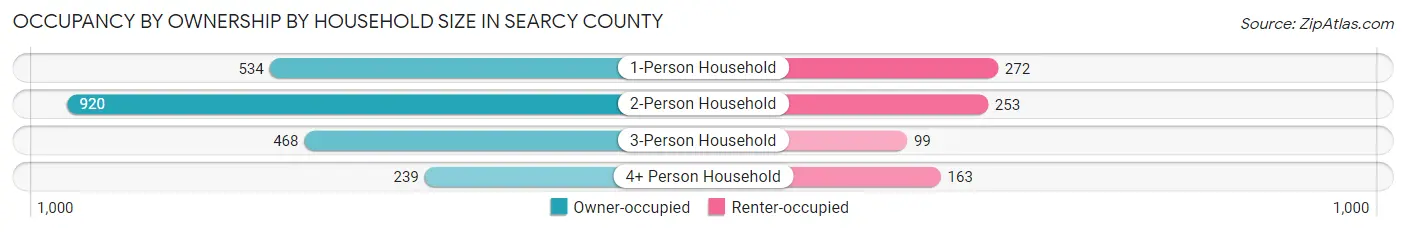
| Household Size | Owner-occupied | Renter-occupied |
| 1-Person Household | 534 (66.2%) | 272 (33.8%) |
| 2-Person Household | 920 (78.4%) | 253 (21.6%) |
| 3-Person Household | 468 (82.5%) | 99 (17.5%) |
| 4+ Person Household | 239 (59.5%) | 163 (40.6%) |
| Total Housing Units | 2,161 (73.3%) | 787 (26.7%) |
Occupancy by Educational Attainment in Searcy County

| Household Size | Owner-occupied | Renter-occupied |
| Less than High School | 304 (69.4%) | 134 (30.6%) |
| High School Diploma | 800 (75.4%) | 261 (24.6%) |
| College/Associate Degree | 666 (70.6%) | 278 (29.4%) |
| Bachelor's Degree or higher | 391 (77.4%) | 114 (22.6%) |
Occupancy by Age of Householder in Searcy County

| Age Bracket | # Households | % Households |
| Under 35 Years | 284 | 9.6% |
| 35 to 44 Years | 420 | 14.2% |
| 45 to 54 Years | 440 | 14.9% |
| 55 to 64 Years | 525 | 17.8% |
| 65 to 74 Years | 641 | 21.7% |
| 75 to 84 Years | 478 | 16.2% |
| 85 Years and Over | 160 | 5.4% |
| Total | 2,948 | 100.0% |
Housing Finances in Searcy County
Median Income by Occupancy in Searcy County

| Occupancy Type | # Households | Median Income |
| Owner-Occupied | 2,161 (73.3%) | $49,575 |
| Renter-Occupied | 787 (26.7%) | $28,199 |
| Average | 2,948 (100.0%) | $42,063 |
Occupancy by Householder Income Bracket in Searcy County
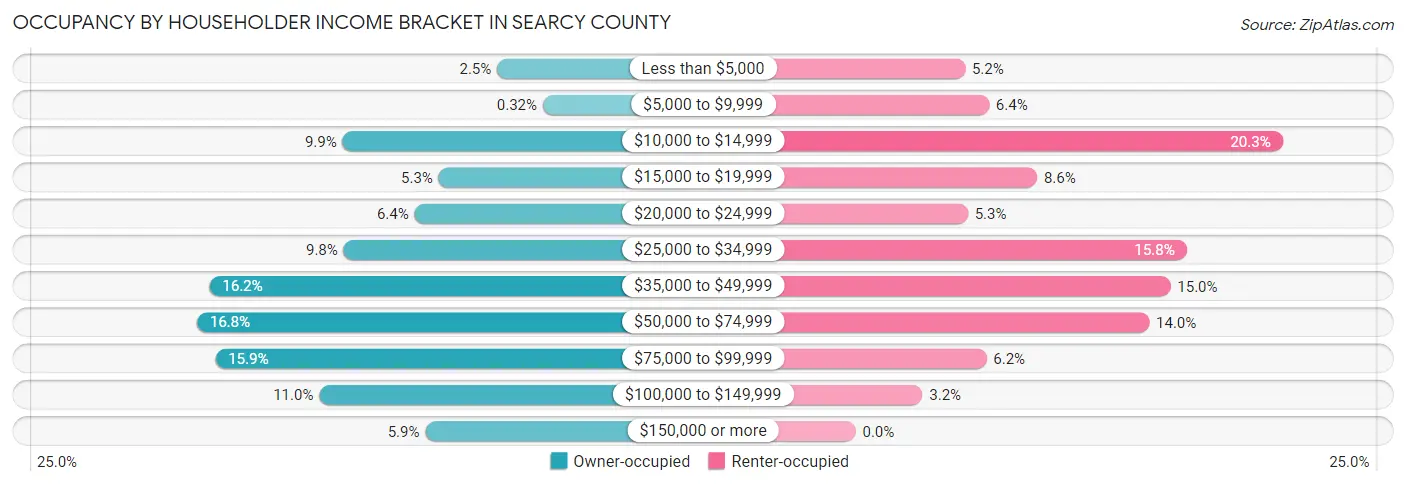
| Income Bracket | Owner-occupied | Renter-occupied |
| Less than $5,000 | 54 (2.5%) | 41 (5.2%) |
| $5,000 to $9,999 | 7 (0.3%) | 50 (6.4%) |
| $10,000 to $14,999 | 213 (9.9%) | 160 (20.3%) |
| $15,000 to $19,999 | 114 (5.3%) | 68 (8.6%) |
| $20,000 to $24,999 | 139 (6.4%) | 42 (5.3%) |
| $25,000 to $34,999 | 212 (9.8%) | 124 (15.8%) |
| $35,000 to $49,999 | 350 (16.2%) | 118 (15.0%) |
| $50,000 to $74,999 | 363 (16.8%) | 110 (14.0%) |
| $75,000 to $99,999 | 344 (15.9%) | 49 (6.2%) |
| $100,000 to $149,999 | 237 (11.0%) | 25 (3.2%) |
| $150,000 or more | 128 (5.9%) | 0 (0.0%) |
| Total | 2,161 (100.0%) | 787 (100.0%) |
Monthly Housing Cost Tiers in Searcy County

| Monthly Cost | Owner-occupied | Renter-occupied |
| Less than $300 | 583 (27.0%) | 100 (12.7%) |
| $300 to $499 | 675 (31.2%) | 113 (14.4%) |
| $500 to $799 | 402 (18.6%) | 187 (23.8%) |
| $800 to $999 | 181 (8.4%) | 71 (9.0%) |
| $1,000 to $1,499 | 212 (9.8%) | 26 (3.3%) |
| $1,500 to $1,999 | 52 (2.4%) | 0 (0.0%) |
| $2,000 to $2,499 | 10 (0.5%) | 0 (0.0%) |
| $2,500 to $2,999 | 7 (0.3%) | 28 (3.6%) |
| $3,000 or more | 39 (1.8%) | 0 (0.0%) |
| Total | 2,161 (100.0%) | 787 (100.0%) |
Physical Housing Characteristics in Searcy County
Housing Structures in Searcy County

| Structure Type | # Housing Units | % Housing Units |
| Single Unit, Detached | 2,185 | 74.1% |
| Single Unit, Attached | 37 | 1.3% |
| 2 Unit Apartments | 11 | 0.4% |
| 3 or 4 Unit Apartments | 73 | 2.5% |
| 5 to 9 Unit Apartments | 29 | 1.0% |
| 10 or more Apartments | 88 | 3.0% |
| Mobile Home / Other | 525 | 17.8% |
| Total | 2,948 | 100.0% |
Housing Structures by Occupancy in Searcy County
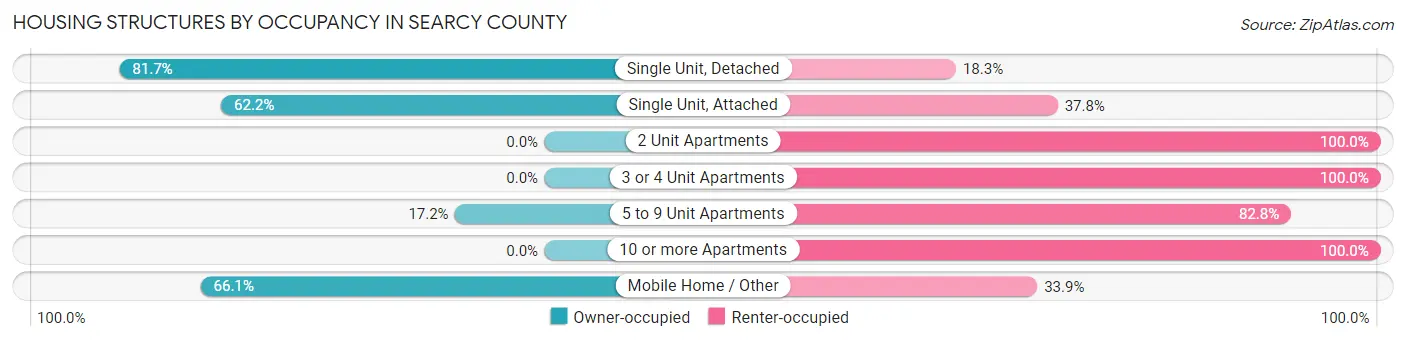
| Structure Type | Owner-occupied | Renter-occupied |
| Single Unit, Detached | 1,786 (81.7%) | 399 (18.3%) |
| Single Unit, Attached | 23 (62.2%) | 14 (37.8%) |
| 2 Unit Apartments | 0 (0.0%) | 11 (100.0%) |
| 3 or 4 Unit Apartments | 0 (0.0%) | 73 (100.0%) |
| 5 to 9 Unit Apartments | 5 (17.2%) | 24 (82.8%) |
| 10 or more Apartments | 0 (0.0%) | 88 (100.0%) |
| Mobile Home / Other | 347 (66.1%) | 178 (33.9%) |
| Total | 2,161 (73.3%) | 787 (26.7%) |
Housing Structures by Number of Rooms in Searcy County

| Number of Rooms | Owner-occupied | Renter-occupied |
| 1 Room | 9 (0.4%) | 11 (1.4%) |
| 2 or 3 Rooms | 147 (6.8%) | 152 (19.3%) |
| 4 or 5 Rooms | 828 (38.3%) | 440 (55.9%) |
| 6 or 7 Rooms | 864 (40.0%) | 181 (23.0%) |
| 8 or more Rooms | 313 (14.5%) | 3 (0.4%) |
| Total | 2,161 (100.0%) | 787 (100.0%) |
Housing Structure by Heating Type in Searcy County

| Heating Type | Owner-occupied | Renter-occupied |
| Utility Gas | 41 (1.9%) | 11 (1.4%) |
| Bottled, Tank, or LP Gas | 678 (31.4%) | 213 (27.1%) |
| Electricity | 916 (42.4%) | 414 (52.6%) |
| Fuel Oil or Kerosene | 0 (0.0%) | 0 (0.0%) |
| Coal or Coke | 0 (0.0%) | 0 (0.0%) |
| All other Fuels | 521 (24.1%) | 146 (18.5%) |
| No Fuel Used | 5 (0.2%) | 3 (0.4%) |
| Total | 2,161 (100.0%) | 787 (100.0%) |
Household Vehicle Usage in Searcy County
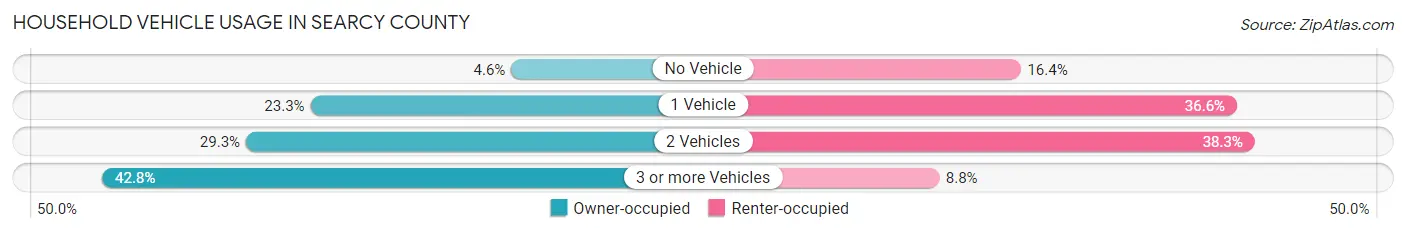
| Vehicles per Household | Owner-occupied | Renter-occupied |
| No Vehicle | 99 (4.6%) | 129 (16.4%) |
| 1 Vehicle | 504 (23.3%) | 288 (36.6%) |
| 2 Vehicles | 634 (29.3%) | 301 (38.3%) |
| 3 or more Vehicles | 924 (42.8%) | 69 (8.8%) |
| Total | 2,161 (100.0%) | 787 (100.0%) |
Real Estate & Mortgages in Searcy County
Real Estate and Mortgage Overview in Searcy County
| Characteristic | Without Mortgage | With Mortgage |
| Housing Units | 1,626 | 535 |
| Median Property Value | $97,600 | $140,300 |
| Median Household Income | $46,096 | $25 |
| Monthly Housing Costs | $353 | $25 |
| Real Estate Taxes | $443 | $13 |
Property Value by Mortgage Status in Searcy County

| Property Value | Without Mortgage | With Mortgage |
| Less than $50,000 | 341 (21.0%) | 58 (10.8%) |
| $50,000 to $99,999 | 494 (30.4%) | 99 (18.5%) |
| $100,000 to $299,999 | 670 (41.2%) | 342 (63.9%) |
| $300,000 to $499,999 | 49 (3.0%) | 11 (2.1%) |
| $500,000 to $749,999 | 14 (0.9%) | 0 (0.0%) |
| $750,000 to $999,999 | 5 (0.3%) | 0 (0.0%) |
| $1,000,000 or more | 53 (3.3%) | 25 (4.7%) |
| Total | 1,626 (100.0%) | 535 (100.0%) |
Household Income by Mortgage Status in Searcy County

| Household Income | Without Mortgage | With Mortgage |
| Less than $10,000 | 61 (3.7%) | 0 (0.0%) |
| $10,000 to $24,999 | 393 (24.2%) | 0 (0.0%) |
| $25,000 to $34,999 | 136 (8.4%) | 73 (13.6%) |
| $35,000 to $49,999 | 299 (18.4%) | 76 (14.2%) |
| $50,000 to $74,999 | 279 (17.2%) | 51 (9.5%) |
| $75,000 to $99,999 | 233 (14.3%) | 84 (15.7%) |
| $100,000 to $149,999 | 122 (7.5%) | 111 (20.7%) |
| $150,000 or more | 103 (6.3%) | 115 (21.5%) |
| Total | 1,626 (100.0%) | 535 (100.0%) |
Property Value to Household Income Ratio in Searcy County
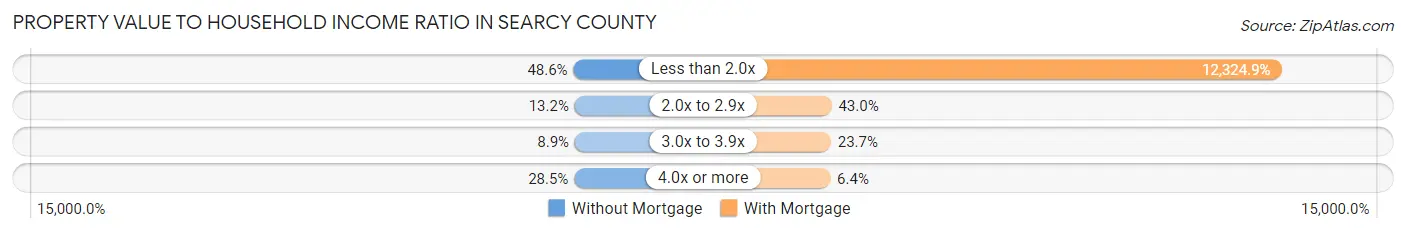
| Value-to-Income Ratio | Without Mortgage | With Mortgage |
| Less than 2.0x | 790 (48.6%) | 65,938 (12,324.9%) |
| 2.0x to 2.9x | 214 (13.2%) | 230 (43.0%) |
| 3.0x to 3.9x | 144 (8.9%) | 127 (23.7%) |
| 4.0x or more | 463 (28.5%) | 34 (6.4%) |
| Total | 1,626 (100.0%) | 535 (100.0%) |
Real Estate Taxes by Mortgage Status in Searcy County

| Property Taxes | Without Mortgage | With Mortgage |
| Less than $800 | 1,168 (71.8%) | 0 (0.0%) |
| $800 to $1,499 | 239 (14.7%) | 321 (60.0%) |
| $800 to $1,499 | 143 (8.8%) | 168 (31.4%) |
| Total | 1,626 (100.0%) | 535 (100.0%) |
Health & Disability in Searcy County
Health Insurance Coverage by Age in Searcy County

| Age Bracket | With Coverage | Without Coverage |
| Under 6 Years | 407 (92.9%) | 31 (7.1%) |
| 6 to 18 Years | 1,178 (100.0%) | 0 (0.0%) |
| 19 to 25 Years | 497 (89.1%) | 61 (10.9%) |
| 26 to 34 Years | 568 (80.1%) | 141 (19.9%) |
| 35 to 44 Years | 752 (88.3%) | 100 (11.7%) |
| 45 to 54 Years | 779 (92.0%) | 68 (8.0%) |
| 55 to 64 Years | 1,209 (96.5%) | 44 (3.5%) |
| 65 to 74 Years | 1,142 (100.0%) | 0 (0.0%) |
| 75 Years and older | 801 (100.0%) | 0 (0.0%) |
| Total | 7,333 (94.3%) | 445 (5.7%) |
Health Insurance Coverage by Citizenship Status in Searcy County

| Citizenship Status | With Coverage | Without Coverage |
| Native Born | 407 (92.9%) | 31 (7.1%) |
| Foreign Born, Citizen | 1,178 (100.0%) | 0 (0.0%) |
| Foreign Born, not a Citizen | 497 (89.1%) | 61 (10.9%) |
Health Insurance Coverage by Household Income in Searcy County

| Household Income | With Coverage | Without Coverage |
| Under $25,000 | 1,545 (93.9%) | 101 (6.1%) |
| $25,000 to $49,999 | 2,198 (94.9%) | 119 (5.1%) |
| $50,000 to $74,999 | 1,302 (93.9%) | 84 (6.1%) |
| $75,000 to $99,999 | 1,185 (91.8%) | 106 (8.2%) |
| $100,000 and over | 1,103 (96.9%) | 35 (3.1%) |
Public vs Private Health Insurance Coverage by Age in Searcy County
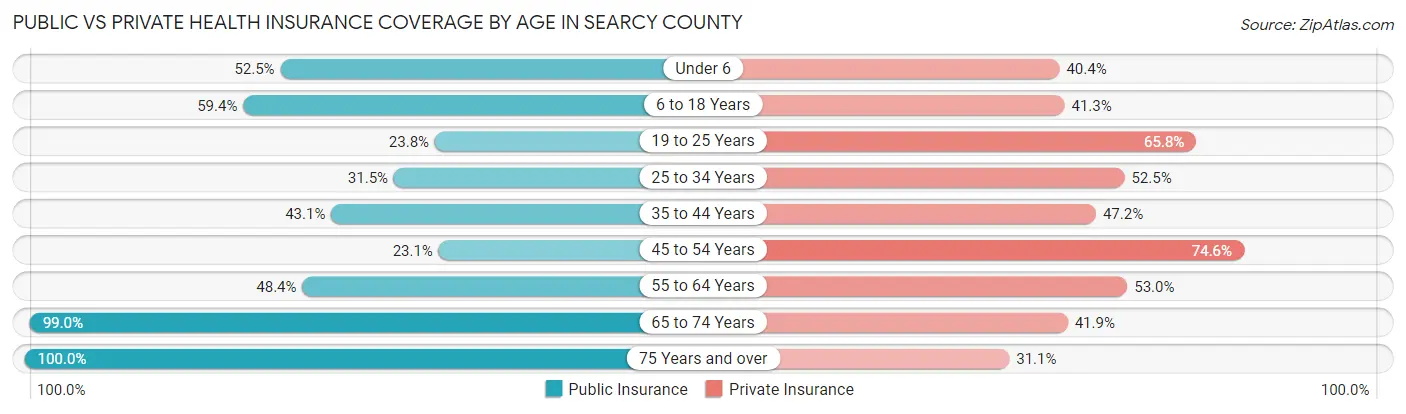
| Age Bracket | Public Insurance | Private Insurance |
| Under 6 | 230 (52.5%) | 177 (40.4%) |
| 6 to 18 Years | 700 (59.4%) | 487 (41.3%) |
| 19 to 25 Years | 133 (23.8%) | 367 (65.8%) |
| 25 to 34 Years | 223 (31.5%) | 372 (52.5%) |
| 35 to 44 Years | 367 (43.1%) | 402 (47.2%) |
| 45 to 54 Years | 196 (23.1%) | 632 (74.6%) |
| 55 to 64 Years | 607 (48.4%) | 664 (53.0%) |
| 65 to 74 Years | 1,131 (99.0%) | 479 (41.9%) |
| 75 Years and over | 801 (100.0%) | 249 (31.1%) |
| Total | 4,388 (56.4%) | 3,829 (49.2%) |
Disability Status by Sex by Age in Searcy County

| Age Bracket | Male | Female |
| Under 5 Years | 0 (0.0%) | 0 (0.0%) |
| 5 to 17 Years | 68 (11.1%) | 18 (3.0%) |
| 18 to 34 Years | 103 (16.5%) | 40 (6.0%) |
| 35 to 64 Years | 470 (31.3%) | 375 (25.9%) |
| 65 to 74 Years | 359 (59.1%) | 189 (35.4%) |
| 75 Years and over | 138 (39.7%) | 302 (66.7%) |
Disability Class by Sex by Age in Searcy County
Disability Class: Hearing Difficulty

| Age Bracket | Male | Female |
| Under 5 Years | 0 (0.0%) | 0 (0.0%) |
| 5 to 17 Years | 0 (0.0%) | 0 (0.0%) |
| 18 to 34 Years | 0 (0.0%) | 0 (0.0%) |
| 35 to 64 Years | 93 (6.2%) | 97 (6.7%) |
| 65 to 74 Years | 116 (19.1%) | 64 (12.0%) |
| 75 Years and over | 100 (28.7%) | 50 (11.0%) |
Disability Class: Vision Difficulty
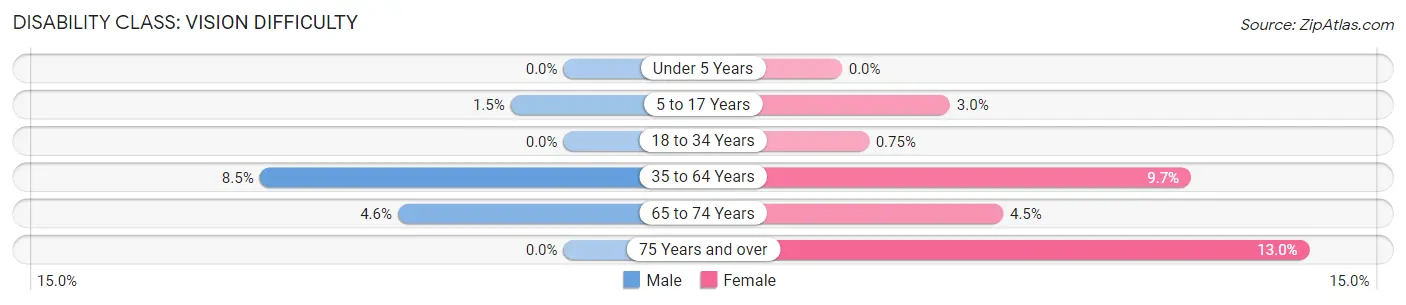
| Age Bracket | Male | Female |
| Under 5 Years | 0 (0.0%) | 0 (0.0%) |
| 5 to 17 Years | 9 (1.5%) | 18 (3.0%) |
| 18 to 34 Years | 0 (0.0%) | 5 (0.7%) |
| 35 to 64 Years | 127 (8.5%) | 141 (9.7%) |
| 65 to 74 Years | 28 (4.6%) | 24 (4.5%) |
| 75 Years and over | 0 (0.0%) | 59 (13.0%) |
Disability Class: Cognitive Difficulty

| Age Bracket | Male | Female |
| 5 to 17 Years | 57 (9.3%) | 0 (0.0%) |
| 18 to 34 Years | 85 (13.6%) | 35 (5.2%) |
| 35 to 64 Years | 141 (9.4%) | 203 (14.0%) |
| 65 to 74 Years | 192 (31.6%) | 60 (11.2%) |
| 75 Years and over | 54 (15.5%) | 63 (13.9%) |
Disability Class: Ambulatory Difficulty

| Age Bracket | Male | Female |
| 5 to 17 Years | 0 (0.0%) | 0 (0.0%) |
| 18 to 34 Years | 0 (0.0%) | 5 (0.7%) |
| 35 to 64 Years | 356 (23.7%) | 218 (15.0%) |
| 65 to 74 Years | 152 (25.0%) | 66 (12.4%) |
| 75 Years and over | 64 (18.4%) | 264 (58.3%) |
Disability Class: Self-Care Difficulty

| Age Bracket | Male | Female |
| 5 to 17 Years | 5 (0.8%) | 0 (0.0%) |
| 18 to 34 Years | 2 (0.3%) | 13 (1.9%) |
| 35 to 64 Years | 30 (2.0%) | 42 (2.9%) |
| 65 to 74 Years | 48 (7.9%) | 9 (1.7%) |
| 75 Years and over | 31 (8.9%) | 56 (12.4%) |
Technology Access in Searcy County
Computing Device Access in Searcy County

| Device Type | # Households | % Households |
| Desktop or Laptop | 1,786 | 60.6% |
| Smartphone | 2,124 | 72.1% |
| Tablet | 1,273 | 43.2% |
| No Computing Device | 516 | 17.5% |
| Total | 2,948 | 100.0% |
Internet Access in Searcy County

| Internet Type | # Households | % Households |
| Dial-Up Internet | 24 | 0.8% |
| Broadband Home | 1,152 | 39.1% |
| Cellular Data Only | 538 | 18.2% |
| Satellite Internet | 431 | 14.6% |
| No Internet | 802 | 27.2% |
| Total | 2,948 | 100.0% |
Searcy County Summary
Searcy County is located in the north-central region of Arkansas, and is part of the Ozark Mountains region. It is bordered by Stone County to the north, Van Buren County to the east, Cleburne County to the south, and Marion County to the west. The county seat is Marshall, and the largest city is Leslie. The county has a total area of 590 square miles, and a population of 8,195 as of the 2010 census.
History
Searcy County was established in 1838, and was named for Richard Searcy, a prominent early settler. The county was originally part of the Cherokee Nation, and was part of the Trail of Tears in the 1830s. The first settlers in the area were mostly farmers, and the county was largely agricultural until the late 19th century. In the late 1800s, the timber industry began to take off in the county, and the area became known for its lumber production.
Geography
Searcy County is located in the Ozark Mountains region of Arkansas. The county is mostly mountainous, with the highest point being Mount Sherman at 1,890 feet. The county is drained by the Little Red River, which flows through the county from north to south. The county is mostly forested, with the majority of the land being used for timber production.
Economy
Searcy County’s economy is largely based on agriculture and timber production. The county is home to several large timber companies, and the timber industry is the largest employer in the county. Other major industries in the county include manufacturing, tourism, and retail. The county also has a large agricultural sector, with the main crops being soybeans, corn, and cotton.
Demographics
As of the 2010 census, Searcy County had a population of 8,195. The racial makeup of the county was 95.3% White, 0.7% Black or African American, 0.5% Native American, 0.2% Asian, 0.1% Pacific Islander, 1.7% from other races, and 1.5% from two or more races. Hispanic or Latino of any race were 3.2% of the population.
The median income for a household in the county was $30,945, and the median income for a family was $37,917. The per capita income for the county was $15,945. About 16.2% of the population was below the poverty line.
Searcy County is a rural county with a strong agricultural and timber-based economy. The county has a diverse population, and is home to a variety of industries. The county is also home to several recreational areas, making it a popular destination for tourists.
Common Questions
What is the Total Population of Searcy County?
Total Population of Searcy County is 7,880.
What is the Total Male Population of Searcy County?
Total Male Population of Searcy County is 3,944.
What is the Total Female Population of Searcy County?
Total Female Population of Searcy County is 3,936.
What is the Ratio of Males per 100 Females in Searcy County?
There are 100.20 Males per 100 Females in Searcy County.
What is the Ratio of Females per 100 Males in Searcy County?
There are 99.80 Females per 100 Males in Searcy County.
What is the Median Population Age in Searcy County?
Median Population Age in Searcy County is 46.9 Years.
What is the Average Family Size in Searcy County
Average Family Size in Searcy County is 3.2 People.
What is the Average Household Size in Searcy County
Average Household Size in Searcy County is 2.6 People.
What is Per Capita Income in Searcy County?
Per Capita income in Searcy County is $22,384.
What is the Median Family Income in Searcy County?
Median Family Income in Searcy County is $52,830.
What is the Median Household income in Searcy County?
Median Household Income in Searcy County is $42,063.
What is Income or Wage Gap in Searcy County?
Income or Wage Gap in Searcy County is 21.9%.
Women in Searcy County earn 78.1 cents for every dollar earned by a man.
What is Family Income Deficit in Searcy County?
Family Income Deficit in Searcy County is $7,240.
Families that are below poverty line in Searcy County earn $7,240 less on average than the poverty threshold level.
What is Inequality or Gini Index in Searcy County?
Inequality or Gini Index in Searcy County is 0.44.
How Large is the Labor Force in Searcy County?
There are 3,081 People in the Labor Forcein in Searcy County.
What is the Percentage of People in the Labor Force in Searcy County?
47.3% of People are in the Labor Force in Searcy County.
What is the Unemployment Rate in Searcy County?
Unemployment Rate in Searcy County is 5.2%.