Scott County, AR
Scott County Map
Scott County Overview
9,871
TOTAL POPULATION
5,205
MALE POPULATION
4,666
FEMALE POPULATION
111.55
MALES / 100 FEMALES
89.64
FEMALES / 100 MALES
42.8
MEDIAN AGE
3.1
AVG FAMILY SIZE
2.5
AVG HOUSEHOLD SIZE
$23,086
PER CAPITA INCOME
$61,206
AVG FAMILY INCOME
$45,340
AVG HOUSEHOLD INCOME
15.9%
WAGE / INCOME GAP [ % ]
84.1¢/ $1
WAGE / INCOME GAP [ $ ]
0.41
INEQUALITY / GINI INDEX
4,327
LABOR FORCE [ PEOPLE ]
55.3%
PERCENT IN LABOR FORCE
5.7%
UNEMPLOYMENT RATE
Scott County Area Codes
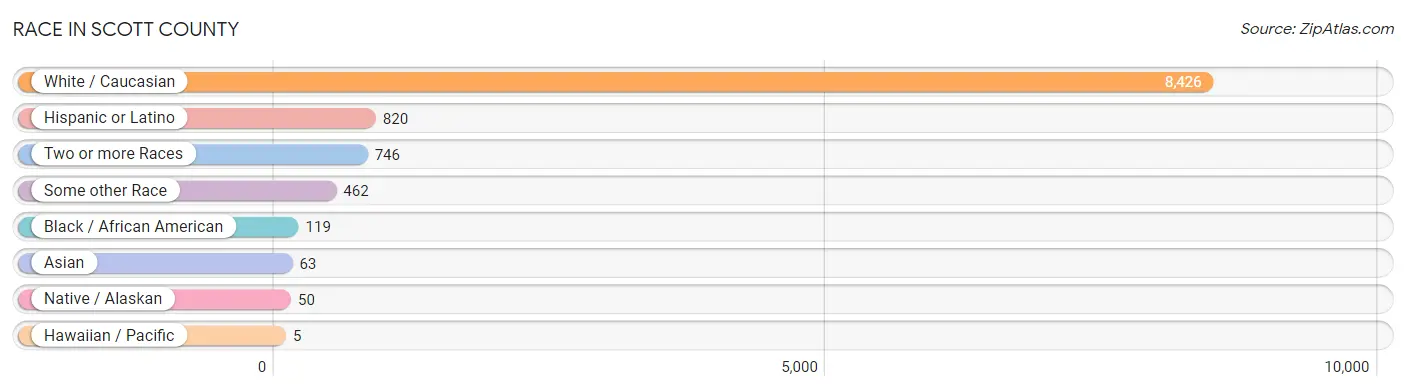
Race in Scott County
The most populous races in Scott County are White / Caucasian (8,426 | 85.4%), Hispanic or Latino (820 | 8.3%), and Two or more Races (746 | 7.6%).
| Race | # Population | % Population |
| Asian | 63 | 0.6% |
| Black / African American | 119 | 1.2% |
| Hawaiian / Pacific | 5 | 0.1% |
| Hispanic or Latino | 820 | 8.3% |
| Native / Alaskan | 50 | 0.5% |
| White / Caucasian | 8,426 | 85.4% |
| Two or more Races | 746 | 7.6% |
| Some other Race | 462 | 4.7% |
| Total | 9,871 | 100.0% |
Ancestry in Scott County
The most populous ancestries reported in Scott County are Irish (1,185 | 12.0%), American (1,058 | 10.7%), English (966 | 9.8%), Mexican (759 | 7.7%), and German (536 | 5.4%), together accounting for 45.6% of all Scott County residents.

| Ancestry | # Population | % Population |
| Aleut | 4 | 0.0% |
| American | 1,058 | 10.7% |
| British | 23 | 0.2% |
| Celtic | 7 | 0.1% |
| Central American Indian | 11 | 0.1% |
| Cherokee | 192 | 1.9% |
| Choctaw | 195 | 2.0% |
| Creek | 9 | 0.1% |
| Cuban | 8 | 0.1% |
| Czech | 7 | 0.1% |
| Dutch | 59 | 0.6% |
| Dutch West Indian | 35 | 0.4% |
| English | 966 | 9.8% |
| European | 58 | 0.6% |
| Fijian | 5 | 0.1% |
| French | 61 | 0.6% |
| French Canadian | 5 | 0.1% |
| German | 536 | 5.4% |
| Irish | 1,185 | 12.0% |
| Italian | 69 | 0.7% |
| Malaysian | 10 | 0.1% |
| Mexican | 759 | 7.7% |
| Norwegian | 46 | 0.5% |
| Osage | 16 | 0.2% |
| Polish | 70 | 0.7% |
| Portuguese | 6 | 0.1% |
| Puerto Rican | 46 | 0.5% |
| Russian | 5 | 0.1% |
| Scotch-Irish | 33 | 0.3% |
| Scottish | 57 | 0.6% |
| Seminole | 8 | 0.1% |
| Sri Lankan | 53 | 0.5% |
| Swedish | 11 | 0.1% |
| Welsh | 12 | 0.1% | View All 34 Rows |
Immigrants in Scott County
The most numerous immigrant groups reported in Scott County came from Central America (243 | 2.5%), Latin America (243 | 2.5%), Mexico (106 | 1.1%), Guatemala (87 | 0.9%), and Asia (63 | 0.6%), together accounting for 7.5% of all Scott County residents.

| Immigration Origin | # Population | % Population |
| Asia | 63 | 0.6% |
| Belize | 11 | 0.1% |
| Central America | 243 | 2.5% |
| Czechoslovakia | 7 | 0.1% |
| Eastern Europe | 7 | 0.1% |
| El Salvador | 39 | 0.4% |
| Europe | 7 | 0.1% |
| Guatemala | 87 | 0.9% |
| Laos | 10 | 0.1% |
| Latin America | 243 | 2.5% |
| Mexico | 106 | 1.1% |
| Oceania | 5 | 0.1% |
| South Eastern Asia | 63 | 0.6% |
| Vietnam | 53 | 0.5% | View All 14 Rows |
Sex and Age in Scott County
Sex and Age in Scott County
The most populous age groups in Scott County are 10 to 14 Years (504 | 9.7%) for men and 55 to 59 Years (469 | 10.1%) for women.

| Age Bracket | Male | Female |
| Under 5 Years | 281 (5.4%) | 218 (4.7%) |
| 5 to 9 Years | 390 (7.5%) | 253 (5.4%) |
| 10 to 14 Years | 504 (9.7%) | 278 (6.0%) |
| 15 to 19 Years | 351 (6.7%) | 222 (4.8%) |
| 20 to 24 Years | 240 (4.6%) | 225 (4.8%) |
| 25 to 29 Years | 309 (5.9%) | 260 (5.6%) |
| 30 to 34 Years | 279 (5.4%) | 238 (5.1%) |
| 35 to 39 Years | 305 (5.9%) | 291 (6.2%) |
| 40 to 44 Years | 204 (3.9%) | 244 (5.2%) |
| 45 to 49 Years | 260 (5.0%) | 273 (5.9%) |
| 50 to 54 Years | 372 (7.1%) | 349 (7.5%) |
| 55 to 59 Years | 325 (6.2%) | 469 (10.1%) |
| 60 to 64 Years | 402 (7.7%) | 275 (5.9%) |
| 65 to 69 Years | 258 (5.0%) | 320 (6.9%) |
| 70 to 74 Years | 325 (6.2%) | 259 (5.6%) |
| 75 to 79 Years | 235 (4.5%) | 247 (5.3%) |
| 80 to 84 Years | 117 (2.2%) | 151 (3.2%) |
| 85 Years and over | 48 (0.9%) | 94 (2.0%) |
| Total | 5,205 (100.0%) | 4,666 (100.0%) |
Families and Households in Scott County
Median Family Size in Scott County
The median family size in Scott County is 3.11 persons per family, with single female/mother families (289 | 10.8%) accounting for the largest median family size of 4.35 persons per family. On the other hand, married-couple families (2,208 | 82.7%) represent the smallest median family size with 2.91 persons per family.

| Family Type | # Families | Family Size |
| Married-Couple | 2,208 (82.7%) | 2.91 |
| Single Male/Father | 174 (6.5%) | 3.62 |
| Single Female/Mother | 289 (10.8%) | 4.35 |
| Total Families | 2,671 (100.0%) | 3.11 |
Median Household Size in Scott County
The median household size in Scott County is 2.51 persons per household, with single female/mother households (289 | 7.4%) accounting for the largest median household size of 4.54 persons per household. non-family households (1,230 | 31.5%) represent the smallest median household size with 1.12 persons per household.

| Household Type | # Households | Household Size |
| Married-Couple | 2,208 (56.6%) | 2.91 |
| Single Male/Father | 174 (4.5%) | 3.88 |
| Single Female/Mother | 289 (7.4%) | 4.54 |
| Non-family | 1,230 (31.5%) | 1.12 |
| Total Households | 3,901 (100.0%) | 2.51 |
Household Size by Marriage Status in Scott County
Out of a total of 3,901 households in Scott County, 2,671 (68.5%) are family households, while 1,230 (31.5%) are nonfamily households. The most numerous type of family households are 2-person households, comprising 1,307, and the most common type of nonfamily households are 1-person households, comprising 1,119.

| Household Size | Family Households | Nonfamily Households |
| 1-Person Households | - | 1,119 (28.7%) |
| 2-Person Households | 1,307 (33.5%) | 103 (2.6%) |
| 3-Person Households | 711 (18.2%) | 8 (0.2%) |
| 4-Person Households | 309 (7.9%) | 0 (0.0%) |
| 5-Person Households | 246 (6.3%) | 0 (0.0%) |
| 6-Person Households | 16 (0.4%) | 0 (0.0%) |
| 7+ Person Households | 82 (2.1%) | 0 (0.0%) |
| Total | 2,671 (68.5%) | 1,230 (31.5%) |
Female Fertility in Scott County
Fertility by Age in Scott County
Average fertility rate in Scott County is 66.0 births per 1,000 women. Women in the age bracket of 20 to 34 years have the highest fertility rate with 165.0 births per 1,000 women. Women in the age bracket of 20 to 34 years acount for 100.0% of all women with births.

| Age Bracket | Women with Births | Births / 1,000 Women |
| 15 to 19 years | 0 (0.0%) | 0.0 |
| 20 to 34 years | 119 (100.0%) | 165.0 |
| 35 to 50 years | 0 (0.0%) | 0.0 |
| Total | 119 (100.0%) | 66.0 |
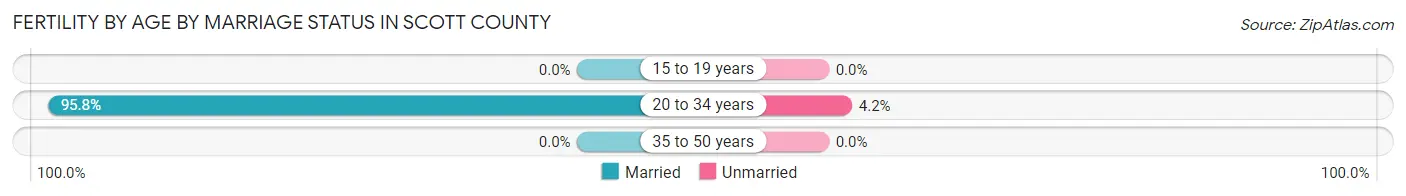
Fertility by Age by Marriage Status in Scott County
95.8% of women with births (119) in Scott County are married. The highest percentage of unmarried women with births falls into 20 to 34 years age bracket with 4.2% of them unmarried at the time of birth, while the lowest percentage of unmarried women with births belong to 20 to 34 years age bracket with 4.2% of them unmarried.
| Age Bracket | Married | Unmarried |
| 15 to 19 years | 0 (0.0%) | 0 (0.0%) |
| 20 to 34 years | 114 (95.8%) | 5 (4.2%) |
| 35 to 50 years | 0 (0.0%) | 0 (0.0%) |
| Total | 114 (95.8%) | 5 (4.2%) |
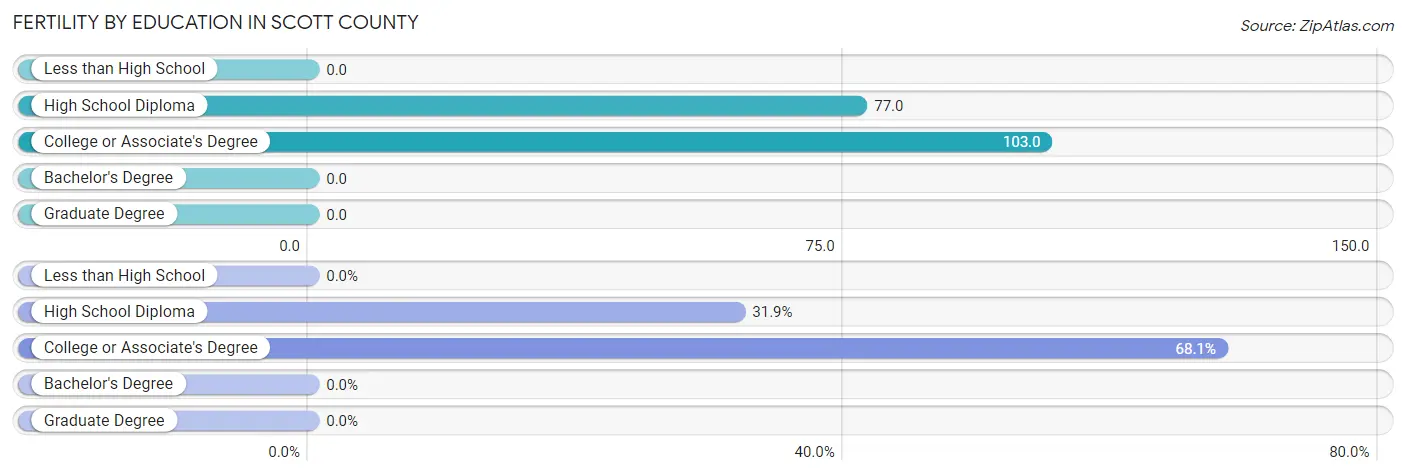
Fertility by Education in Scott County
| Educational Attainment | Women with Births | Births / 1,000 Women |
| Less than High School | 0 (0.0%) | 0.0 |
| High School Diploma | 38 (31.9%) | 77.0 |
| College or Associate's Degree | 81 (68.1%) | 103.0 |
| Bachelor's Degree | 0 (0.0%) | 0.0 |
| Graduate Degree | 0 (0.0%) | 0.0 |
| Total | 119 (100.0%) | 66.0 |
Fertility by Education by Marriage Status in Scott County
4.2% of women with births in Scott County are unmarried. Women with the educational attainment of college or associate's degree are most likely to be married with 100.0% of them married at childbirth, while women with the educational attainment of high school diploma are least likely to be married with 13.2% of them unmarried at childbirth.

| Educational Attainment | Married | Unmarried |
| Less than High School | 0 (0.0%) | 0 (0.0%) |
| High School Diploma | 33 (86.8%) | 5 (13.2%) |
| College or Associate's Degree | 81 (100.0%) | 0 (0.0%) |
| Bachelor's Degree | 0 (0.0%) | 0 (0.0%) |
| Graduate Degree | 0 (0.0%) | 0 (0.0%) |
| Total | 114 (95.8%) | 5 (4.2%) |
Income in Scott County
Income Overview in Scott County
Per Capita Income in Scott County is $23,086, while median incomes of families and households are $61,206 and $45,340 respectively.
| Characteristic | Number | Measure |
| Per Capita Income | 9,871 | $23,086 |
| Median Family Income | 2,671 | $61,206 |
| Mean Family Income | 2,671 | $69,054 |
| Median Household Income | 3,901 | $45,340 |
| Mean Household Income | 3,901 | $56,716 |
| Income Deficit | 2,671 | $0 |
| Wage / Income Gap (%) | 9,871 | 15.87% |
| Wage / Income Gap ($) | 9,871 | 84.13¢ per $1 |
| Gini / Inequality Index | 9,871 | 0.41 |
Earnings by Sex in Scott County
Average Earnings in Scott County are $30,513, $32,348 for men and $27,214 for women, a difference of 15.9%.

| Sex | Number | Average Earnings |
| Male | 2,442 (53.6%) | $32,348 |
| Female | 2,112 (46.4%) | $27,214 |
| Total | 4,554 (100.0%) | $30,513 |
Earnings by Sex by Income Bracket in Scott County
The most common earnings brackets in Scott County are $30,000 to $34,999 for men (296 | 12.1%) and $25,000 to $29,999 for women (300 | 14.2%).

| Income | Male | Female |
| $2,499 or less | 146 (6.0%) | 73 (3.5%) |
| $2,500 to $4,999 | 41 (1.7%) | 29 (1.4%) |
| $5,000 to $7,499 | 61 (2.5%) | 157 (7.4%) |
| $7,500 to $9,999 | 18 (0.7%) | 112 (5.3%) |
| $10,000 to $12,499 | 40 (1.6%) | 120 (5.7%) |
| $12,500 to $14,999 | 38 (1.6%) | 96 (4.5%) |
| $15,000 to $17,499 | 50 (2.1%) | 93 (4.4%) |
| $17,500 to $19,999 | 75 (3.1%) | 55 (2.6%) |
| $20,000 to $22,499 | 60 (2.5%) | 64 (3.0%) |
| $22,500 to $24,999 | 270 (11.1%) | 87 (4.1%) |
| $25,000 to $29,999 | 236 (9.7%) | 300 (14.2%) |
| $30,000 to $34,999 | 296 (12.1%) | 201 (9.5%) |
| $35,000 to $39,999 | 181 (7.4%) | 187 (8.8%) |
| $40,000 to $44,999 | 85 (3.5%) | 85 (4.0%) |
| $45,000 to $49,999 | 174 (7.1%) | 81 (3.8%) |
| $50,000 to $54,999 | 106 (4.3%) | 59 (2.8%) |
| $55,000 to $64,999 | 206 (8.4%) | 92 (4.4%) |
| $65,000 to $74,999 | 102 (4.2%) | 129 (6.1%) |
| $75,000 to $99,999 | 115 (4.7%) | 46 (2.2%) |
| $100,000+ | 142 (5.8%) | 46 (2.2%) |
| Total | 2,442 (100.0%) | 2,112 (100.0%) |
Earnings by Sex by Educational Attainment in Scott County
Average earnings in Scott County are $34,974 for men and $27,331 for women, a difference of 21.8%. Men with an educational attainment of graduate degree enjoy the highest average annual earnings of $65,441, while those with less than high school education earn the least with $26,710. Women with an educational attainment of bachelor's degree earn the most with the average annual earnings of $35,875, while those with high school diploma education have the smallest earnings of $24,940.

| Educational Attainment | Male Income | Female Income |
| Less than High School | $26,710 | $0 |
| High School Diploma | $40,128 | $24,940 |
| College or Associate's Degree | $37,708 | $27,243 |
| Bachelor's Degree | $34,487 | $35,875 |
| Graduate Degree | $65,441 | $0 |
| Total | $34,974 | $27,331 |
Family Income in Scott County
Family Income Brackets in Scott County
According to the Scott County family income data, there are 638 families falling into the $50,000 to $74,999 income range, which is the most common income bracket and makes up 23.9% of all families. Conversely, the $10,000 to $14,999 income bracket is the least frequent group with only 27 families (1.0%) belonging to this category.

| Income Bracket | # Families | % Families |
| Less than $10,000 | 110 | 4.1% |
| $10,000 to $14,999 | 27 | 1.0% |
| $15,000 to $24,999 | 160 | 6.0% |
| $25,000 to $34,999 | 451 | 16.9% |
| $35,000 to $49,999 | 385 | 14.4% |
| $50,000 to $74,999 | 638 | 23.9% |
| $75,000 to $99,999 | 272 | 10.2% |
| $100,000 to $149,999 | 446 | 16.7% |
| $150,000 to $199,999 | 131 | 4.9% |
| $200,000+ | 48 | 1.8% |
Family Income by Famaliy Size in Scott County
3-person families (674 | 25.2%) account for the highest median family income in Scott County with $68,962 per family, while 2-person families (1,360 | 50.9%) have the highest median income of $24,820 per family member.

| Income Bracket | # Families | Median Income |
| 2-Person Families | 1,360 (50.9%) | $49,640 |
| 3-Person Families | 674 (25.2%) | $68,962 |
| 4-Person Families | 293 (11.0%) | $61,250 |
| 5-Person Families | 246 (9.2%) | $63,882 |
| 6-Person Families | 21 (0.8%) | $0 |
| 7+ Person Families | 77 (2.9%) | $0 |
| Total | 2,671 (100.0%) | $61,206 |
Family Income by Number of Earners in Scott County
The median family income in Scott County is $61,206, with families comprising 2 earners (1,053) having the highest median family income of $78,438, while families with no earners (572) have the lowest median family income of $28,949, accounting for 39.4% and 21.4% of families, respectively.

| Number of Earners | # Families | Median Income |
| No Earners | 572 (21.4%) | $28,949 |
| 1 Earner | 787 (29.5%) | $37,762 |
| 2 Earners | 1,053 (39.4%) | $78,438 |
| 3+ Earners | 259 (9.7%) | $69,981 |
| Total | 2,671 (100.0%) | $61,206 |
Household Income in Scott County
Household Income Brackets in Scott County
With 710 households falling in the category, the $50,000 to $74,999 income range is the most frequent in Scott County, accounting for 18.2% of all households. In contrast, only 47 households (1.2%) fall into the $200,000+ income bracket, making it the least populous group.

| Income Bracket | # Households | % Households |
| Less than $10,000 | 183 | 4.7% |
| $10,000 to $14,999 | 281 | 7.2% |
| $15,000 to $24,999 | 453 | 11.6% |
| $25,000 to $34,999 | 628 | 16.1% |
| $35,000 to $49,999 | 694 | 17.8% |
| $50,000 to $74,999 | 710 | 18.2% |
| $75,000 to $99,999 | 304 | 7.8% |
| $100,000 to $149,999 | 460 | 11.8% |
| $150,000 to $199,999 | 137 | 3.5% |
| $200,000+ | 47 | 1.2% |
Household Income by Householder Age in Scott County
The median household income in Scott County is $45,340, with the highest median household income of $55,256 found in the 25 to 44 years age bracket for the primary householder. A total of 1,019 households (26.1%) fall into this category. Meanwhile, the 15 to 24 years age bracket for the primary householder has the lowest median household income of $30,893, with 134 households (3.4%) in this group.

| Income Bracket | # Households | Median Income |
| 15 to 24 Years | 134 (3.4%) | $30,893 |
| 25 to 44 Years | 1,019 (26.1%) | $55,256 |
| 45 to 64 Years | 1,451 (37.2%) | $49,676 |
| 65+ Years | 1,297 (33.3%) | $32,106 |
| Total | 3,901 (100.0%) | $45,340 |
Poverty in Scott County
Income Below Poverty by Sex and Age in Scott County
With 15.0% poverty level for males and 19.5% for females among the residents of Scott County, 12 to 14 year old males and 12 to 14 year old females are the most vulnerable to poverty, with 107 males (44.0%) and 111 females (50.7%) in their respective age groups living below the poverty level.

| Age Bracket | Male | Female |
| Under 5 Years | 22 (7.8%) | 16 (7.3%) |
| 5 Years | 22 (33.9%) | 0 (0.0%) |
| 6 to 11 Years | 129 (22.0%) | 52 (19.2%) |
| 12 to 14 Years | 107 (44.0%) | 111 (50.7%) |
| 15 Years | 27 (34.2%) | 22 (50.0%) |
| 16 and 17 Years | 41 (28.3%) | 34 (33.7%) |
| 18 to 24 Years | 42 (11.4%) | 58 (19.2%) |
| 25 to 34 Years | 71 (12.2%) | 56 (11.2%) |
| 35 to 44 Years | 57 (11.2%) | 189 (35.3%) |
| 45 to 54 Years | 108 (17.1%) | 113 (18.2%) |
| 55 to 64 Years | 87 (12.0%) | 99 (13.3%) |
| 65 to 74 Years | 33 (6.0%) | 118 (20.6%) |
| 75 Years and over | 29 (7.5%) | 34 (7.3%) |
| Total | 775 (15.0%) | 902 (19.5%) |
Income Above Poverty by Sex and Age in Scott County
According to the poverty statistics in Scott County, males aged 65 to 74 years and females aged 5 years are the age groups that are most secure financially, with 94.0% of males and 100.0% of females in these age groups living above the poverty line.

| Age Bracket | Male | Female |
| Under 5 Years | 259 (92.2%) | 202 (92.7%) |
| 5 Years | 43 (66.1%) | 41 (100.0%) |
| 6 to 11 Years | 457 (78.0%) | 219 (80.8%) |
| 12 to 14 Years | 136 (56.0%) | 108 (49.3%) |
| 15 Years | 52 (65.8%) | 22 (50.0%) |
| 16 and 17 Years | 104 (71.7%) | 67 (66.3%) |
| 18 to 24 Years | 325 (88.6%) | 244 (80.8%) |
| 25 to 34 Years | 512 (87.8%) | 442 (88.8%) |
| 35 to 44 Years | 452 (88.8%) | 346 (64.7%) |
| 45 to 54 Years | 522 (82.9%) | 509 (81.8%) |
| 55 to 64 Years | 640 (88.0%) | 645 (86.7%) |
| 65 to 74 Years | 520 (94.0%) | 456 (79.4%) |
| 75 Years and over | 359 (92.5%) | 433 (92.7%) |
| Total | 4,381 (85.0%) | 3,734 (80.5%) |
Income Below Poverty Among Married-Couple Families in Scott County
The poverty statistics for married-couple families in Scott County show that 7.9% or 174 of the total 2,208 families live below the poverty line. Families with 3 or 4 children have the highest poverty rate of 31.3%, comprising of 57 families. On the other hand, families with no children have the lowest poverty rate of 3.9%, which includes 58 families.

| Children | Above Poverty | Below Poverty |
| No Children | 1,418 (96.1%) | 58 (3.9%) |
| 1 or 2 Children | 462 (90.6%) | 48 (9.4%) |
| 3 or 4 Children | 125 (68.7%) | 57 (31.3%) |
| 5 or more Children | 29 (72.5%) | 11 (27.5%) |
| Total | 2,034 (92.1%) | 174 (7.9%) |
Income Below Poverty Among Single-Parent Households in Scott County
According to the poverty data in Scott County, 4.6% or 8 single-father households and 54.7% or 158 single-mother households are living below the poverty line. Among single-father households, those with 1 or 2 children have the highest poverty rate, with 8 households (7.6%) experiencing poverty. Likewise, among single-mother households, those with 1 or 2 children have the highest poverty rate, with 113 households (72.9%) falling below the poverty line.

| Children | Single Father | Single Mother |
| No Children | 0 (0.0%) | 23 (33.3%) |
| 1 or 2 Children | 8 (7.6%) | 113 (72.9%) |
| 3 or 4 Children | 0 (0.0%) | 22 (37.9%) |
| 5 or more Children | 0 (0.0%) | 0 (0.0%) |
| Total | 8 (4.6%) | 158 (54.7%) |
Income Below Poverty Among Married-Couple vs Single-Parent Households in Scott County
The poverty data for Scott County shows that 174 of the married-couple family households (7.9%) and 166 of the single-parent households (35.8%) are living below the poverty level. Within the married-couple family households, those with 3 or 4 children have the highest poverty rate, with 57 households (31.3%) falling below the poverty line. Among the single-parent households, those with 1 or 2 children have the highest poverty rate, with 121 household (46.5%) living below poverty.

| Children | Married-Couple Families | Single-Parent Households |
| No Children | 58 (3.9%) | 23 (16.7%) |
| 1 or 2 Children | 48 (9.4%) | 121 (46.5%) |
| 3 or 4 Children | 57 (31.3%) | 22 (37.9%) |
| 5 or more Children | 11 (27.5%) | 0 (0.0%) |
| Total | 174 (7.9%) | 166 (35.8%) |
Employment Characteristics in Scott County
Employment by Class of Employer in Scott County
Among the 4,047 employed individuals in Scott County, private company employees (2,904 | 71.8%), local government employees (340 | 8.4%), and self-employed (not incorporated) (326 | 8.1%) make up the most common classes of employment.

| Employer Class | # Employees | % Employees |
| Private Company Employees | 2,904 | 71.8% |
| Self-Employed (Incorporated) | 42 | 1.0% |
| Self-Employed (Not Incorporated) | 326 | 8.1% |
| Not-for-profit Organizations | 143 | 3.5% |
| Local Government Employees | 340 | 8.4% |
| State Government Employees | 183 | 4.5% |
| Federal Government Employees | 109 | 2.7% |
| Unpaid Family Workers | 0 | 0.0% |
| Total | 4,047 | 100.0% |
Employment Status by Age in Scott County
According to the labor force statistics for Scott County, out of the total population over 16 years of age (7,824), 55.3% or 4,327 individuals are in the labor force, with 5.7% or 247 of them unemployed. The age group with the highest labor force participation rate is 25 to 29 years, with 83.0% or 472 individuals in the labor force. Within the labor force, the 16 to 19 years age range has the highest percentage of unemployed individuals, with 50.5% or 54 of them being unemployed.

| Age Bracket | In Labor Force | Unemployed |
| 16 to 19 Years | 107 (23.8%) | 54 (50.5%) |
| 20 to 24 Years | 301 (64.7%) | 17 (5.6%) |
| 25 to 29 Years | 472 (83.0%) | 12 (2.5%) |
| 30 to 34 Years | 407 (78.7%) | 9 (2.2%) |
| 35 to 44 Years | 790 (75.7%) | 37 (4.7%) |
| 45 to 54 Years | 961 (76.6%) | 85 (8.8%) |
| 55 to 59 Years | 551 (69.4%) | 6 (1.1%) |
| 60 to 64 Years | 385 (56.9%) | 11 (2.9%) |
| 65 to 74 Years | 254 (21.9%) | 0 (0.0%) |
| 75 Years and over | 98 (11.0%) | 17 (17.3%) |
| Total | 4,327 (55.3%) | 247 (5.7%) |
Employment Status by Educational Attainment in Scott County
According to labor force statistics for Scott County, 73.5% of individuals (3,568) out of the total population between 25 and 64 years of age (4,855) are in the labor force, with 4.5% or 161 of them being unemployed. The group with the highest labor force participation rate are those with the educational attainment of bachelor's degree or higher, with 85.8% or 552 individuals in the labor force. Within the labor force, individuals with less than high school education have the highest percentage of unemployment, with 24.2% or 102 of them being unemployed.

| Educational Attainment | In Labor Force | Unemployed |
| Less than High School | 422 (74.6%) | 137 (24.2%) |
| High School Diploma | 1,283 (66.8%) | 48 (2.5%) |
| College / Associate Degree | 1,308 (75.8%) | 35 (2.0%) |
| Bachelor's Degree or higher | 552 (85.8%) | 0 (0.0%) |
| Total | 3,568 (73.5%) | 218 (4.5%) |
Employment Occupations by Sex in Scott County
Management, Business, Science and Arts Occupations
The most common Management, Business, Science and Arts occupations in Scott County are Health Diagnosing & Treating (342 | 8.4%), Management (295 | 7.2%), Community & Social Service (278 | 6.8%), Health Technologists (247 | 6.1%), and Education Instruction & Library (182 | 4.5%).

Management, Business, Science and Arts Occupations by Sex
Within the Management, Business, Science and Arts occupations in Scott County, the most male-oriented occupations are Legal Services & Support (100.0%), Management (54.6%), and Arts, Media & Entertainment (47.1%), while the most female-oriented occupations are Architecture & Engineering (100.0%), Education Instruction & Library (88.5%), and Health Technologists (78.1%).

| Occupation | Male | Female |
| Management | 161 (54.6%) | 134 (45.4%) |
| Business & Financial | 18 (28.6%) | 45 (71.4%) |
| Computers, Engineering & Science | 37 (33.6%) | 73 (66.4%) |
| Computers & Mathematics | 12 (31.6%) | 26 (68.4%) |
| Architecture & Engineering | 0 (0.0%) | 10 (100.0%) |
| Life, Physical & Social Science | 25 (40.3%) | 37 (59.7%) |
| Community & Social Service | 80 (28.8%) | 198 (71.2%) |
| Education, Arts & Media | 12 (30.0%) | 28 (70.0%) |
| Legal Services & Support | 39 (100.0%) | 0 (0.0%) |
| Education Instruction & Library | 21 (11.5%) | 161 (88.5%) |
| Arts, Media & Entertainment | 8 (47.1%) | 9 (52.9%) |
| Health Diagnosing & Treating | 92 (26.9%) | 250 (73.1%) |
| Health Technologists | 54 (21.9%) | 193 (78.1%) |
| Total (Category) | 388 (35.7%) | 700 (64.3%) |
| Total (Overall) | 2,176 (53.3%) | 1,903 (46.7%) |
Services Occupations
The most common Services occupations in Scott County are Healthcare Support (206 | 5.1%), Food Preparation & Serving (151 | 3.7%), Cleaning & Maintenance (126 | 3.1%), Security & Protection (67 | 1.6%), and Law Enforcement (67 | 1.6%).

Services Occupations by Sex
Within the Services occupations in Scott County, the most male-oriented occupations are Security & Protection (94.0%), Law Enforcement (94.0%), and Cleaning & Maintenance (66.7%), while the most female-oriented occupations are Healthcare Support (100.0%), Food Preparation & Serving (98.0%), and Personal Care & Service (34.5%).

| Occupation | Male | Female |
| Healthcare Support | 0 (0.0%) | 206 (100.0%) |
| Security & Protection | 63 (94.0%) | 4 (6.0%) |
| Firefighting & Prevention | 0 (0.0%) | 0 (0.0%) |
| Law Enforcement | 63 (94.0%) | 4 (6.0%) |
| Food Preparation & Serving | 3 (2.0%) | 148 (98.0%) |
| Cleaning & Maintenance | 84 (66.7%) | 42 (33.3%) |
| Personal Care & Service | 36 (65.4%) | 19 (34.5%) |
| Total (Category) | 186 (30.7%) | 419 (69.3%) |
| Total (Overall) | 2,176 (53.3%) | 1,903 (46.7%) |
Sales and Office Occupations
The most common Sales and Office occupations in Scott County are Office & Administration (546 | 13.4%), and Sales & Related (237 | 5.8%).

Sales and Office Occupations by Sex
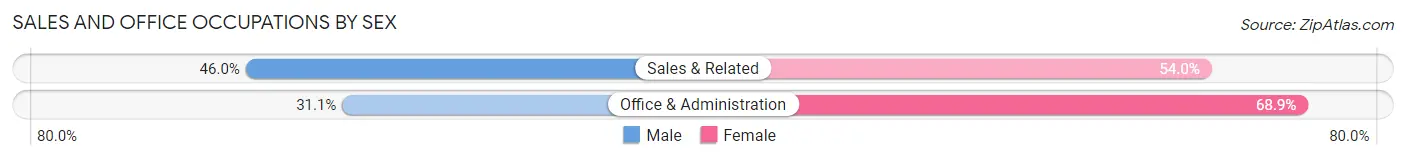
| Occupation | Male | Female |
| Sales & Related | 109 (46.0%) | 128 (54.0%) |
| Office & Administration | 170 (31.1%) | 376 (68.9%) |
| Total (Category) | 279 (35.6%) | 504 (64.4%) |
| Total (Overall) | 2,176 (53.3%) | 1,903 (46.7%) |
Natural Resources, Construction and Maintenance Occupations
The most common Natural Resources, Construction and Maintenance occupations in Scott County are Installation, Maintenance & Repair (171 | 4.2%), Construction & Extraction (162 | 4.0%), and Farming, Fishing & Forestry (160 | 3.9%).

Natural Resources, Construction and Maintenance Occupations by Sex
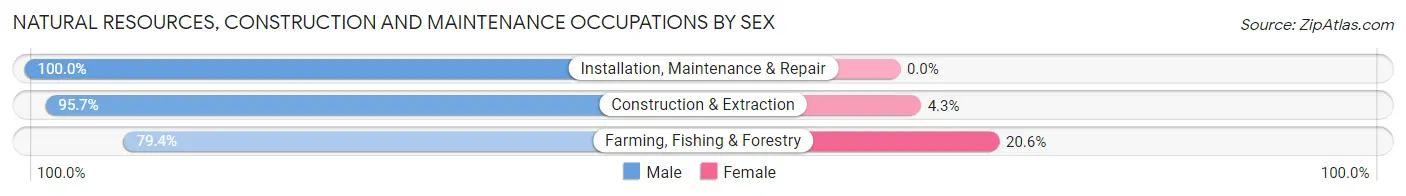
| Occupation | Male | Female |
| Farming, Fishing & Forestry | 127 (79.4%) | 33 (20.6%) |
| Construction & Extraction | 155 (95.7%) | 7 (4.3%) |
| Installation, Maintenance & Repair | 171 (100.0%) | 0 (0.0%) |
| Total (Category) | 453 (91.9%) | 40 (8.1%) |
| Total (Overall) | 2,176 (53.3%) | 1,903 (46.7%) |
Production, Transportation and Moving Occupations
The most common Production, Transportation and Moving occupations in Scott County are Production (541 | 13.3%), Transportation (338 | 8.3%), and Material Moving (231 | 5.7%).

Production, Transportation and Moving Occupations by Sex

| Occupation | Male | Female |
| Production | 385 (71.2%) | 156 (28.8%) |
| Transportation | 338 (100.0%) | 0 (0.0%) |
| Material Moving | 147 (63.6%) | 84 (36.4%) |
| Total (Category) | 870 (78.4%) | 240 (21.6%) |
| Total (Overall) | 2,176 (53.3%) | 1,903 (46.7%) |
Employment Industries by Sex in Scott County
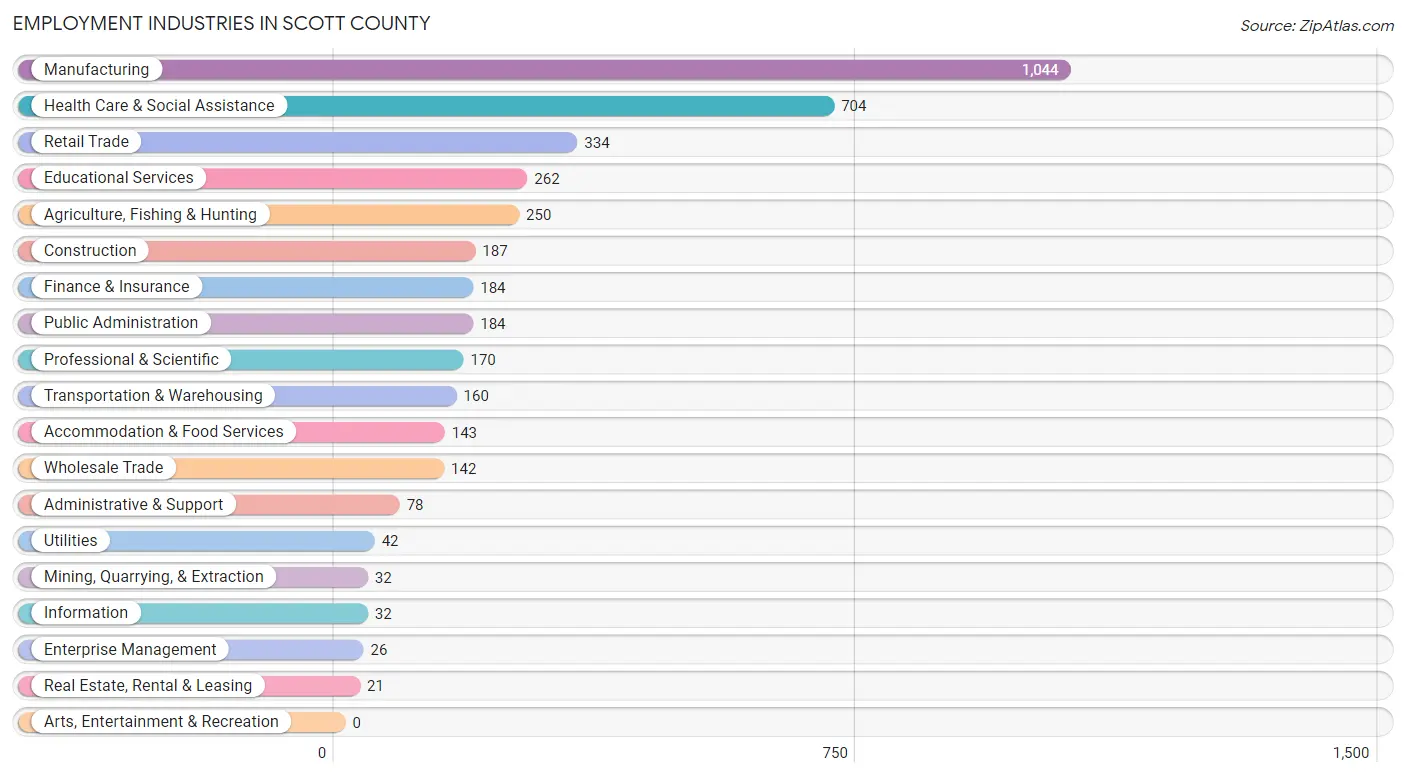
Employment Industries in Scott County
The major employment industries in Scott County include Manufacturing (1,044 | 25.6%), Health Care & Social Assistance (704 | 17.3%), Retail Trade (334 | 8.2%), Educational Services (262 | 6.4%), and Agriculture, Fishing & Hunting (250 | 6.1%).
Employment Industries by Sex in Scott County
The Scott County industries that see more men than women are Mining, Quarrying, & Extraction (100.0%), Wholesale Trade (100.0%), and Utilities (100.0%), whereas the industries that tend to have a higher number of women are Information (100.0%), Real Estate, Rental & Leasing (100.0%), and Enterprise Management (100.0%).

| Industry | Male | Female |
| Agriculture, Fishing & Hunting | 213 (85.2%) | 37 (14.8%) |
| Mining, Quarrying, & Extraction | 32 (100.0%) | 0 (0.0%) |
| Construction | 180 (96.3%) | 7 (3.7%) |
| Manufacturing | 707 (67.7%) | 337 (32.3%) |
| Wholesale Trade | 142 (100.0%) | 0 (0.0%) |
| Retail Trade | 216 (64.7%) | 118 (35.3%) |
| Transportation & Warehousing | 81 (50.6%) | 79 (49.4%) |
| Utilities | 42 (100.0%) | 0 (0.0%) |
| Information | 0 (0.0%) | 32 (100.0%) |
| Finance & Insurance | 14 (7.6%) | 170 (92.4%) |
| Real Estate, Rental & Leasing | 0 (0.0%) | 21 (100.0%) |
| Professional & Scientific | 128 (75.3%) | 42 (24.7%) |
| Enterprise Management | 0 (0.0%) | 26 (100.0%) |
| Administrative & Support | 57 (73.1%) | 21 (26.9%) |
| Educational Services | 89 (34.0%) | 173 (66.0%) |
| Health Care & Social Assistance | 108 (15.3%) | 596 (84.7%) |
| Arts, Entertainment & Recreation | 0 (0.0%) | 0 (0.0%) |
| Accommodation & Food Services | 9 (6.3%) | 134 (93.7%) |
| Public Administration | 102 (55.4%) | 82 (44.6%) |
| Total | 2,176 (53.3%) | 1,903 (46.7%) |
Education in Scott County
School Enrollment in Scott County
The most common levels of schooling among the 2,185 students in Scott County are elementary school (581 | 26.6%), middle school (524 | 24.0%), and high school (512 | 23.4%).

| School Level | # Students | % Students |
| Nursery / Preschool | 106 | 4.9% |
| Kindergarten | 134 | 6.1% |
| Elementary School | 581 | 26.6% |
| Middle School | 524 | 24.0% |
| High School | 512 | 23.4% |
| College / Undergraduate | 312 | 14.3% |
| Graduate / Professional | 16 | 0.7% |
| Total | 2,185 | 100.0% |
School Enrollment by Age by Funding Source in Scott County
Out of a total of 2,185 students who are enrolled in schools in Scott County, 149 (6.8%) attend a private institution, while the remaining 2,036 (93.2%) are enrolled in public schools. The age group of 35 years and over has the highest likelihood of being enrolled in private schools, with 56 (34.6% in the age bracket) enrolled. Conversely, the age group of 3 to 4 year olds has the lowest likelihood of being enrolled in a private school, with 84 (100.0% in the age bracket) attending a public institution.

| Age Bracket | Public School | Private School |
| 3 to 4 Year Olds | 84 (100.0%) | 0 (0.0%) |
| 5 to 9 Year Old | 577 (93.4%) | 41 (6.6%) |
| 10 to 14 Year Olds | 678 (92.9%) | 52 (7.1%) |
| 15 to 17 Year Olds | 332 (100.0%) | 0 (0.0%) |
| 18 to 19 Year Olds | 115 (100.0%) | 0 (0.0%) |
| 20 to 24 Year Olds | 104 (100.0%) | 0 (0.0%) |
| 25 to 34 Year Olds | 40 (100.0%) | 0 (0.0%) |
| 35 Years and over | 106 (65.4%) | 56 (34.6%) |
| Total | 2,036 (93.2%) | 149 (6.8%) |
Educational Attainment by Field of Study in Scott County
Business (258 | 29.0%), education (152 | 17.1%), bio, nature & agricultural (129 | 14.5%), arts & humanities (61 | 6.9%), and science & technology (57 | 6.4%) are the most common fields of study among 890 individuals in Scott County who have obtained a bachelor's degree or higher.

| Field of Study | # Graduates | % Graduates |
| Computers & Mathematics | 45 | 5.1% |
| Bio, Nature & Agricultural | 129 | 14.5% |
| Physical & Health Sciences | 25 | 2.8% |
| Psychology | 47 | 5.3% |
| Social Sciences | 5 | 0.6% |
| Engineering | 22 | 2.5% |
| Multidisciplinary Studies | 0 | 0.0% |
| Science & Technology | 57 | 6.4% |
| Business | 258 | 29.0% |
| Education | 152 | 17.1% |
| Literature & Languages | 16 | 1.8% |
| Liberal Arts & History | 48 | 5.4% |
| Visual & Performing Arts | 18 | 2.0% |
| Communications | 7 | 0.8% |
| Arts & Humanities | 61 | 6.9% |
| Total | 890 | 100.0% |
Transportation & Commute in Scott County
Vehicle Availability by Sex in Scott County
The most prevalent vehicle ownership categories in Scott County are males with 2 vehicles (662, accounting for 30.6%) and females with 2 vehicles (652, making up 35.2%).

| Vehicles Available | Male | Female |
| No Vehicle | 81 (3.7%) | 51 (2.7%) |
| 1 Vehicle | 321 (14.8%) | 375 (19.9%) |
| 2 Vehicles | 662 (30.6%) | 652 (34.6%) |
| 3 Vehicles | 508 (23.5%) | 378 (20.1%) |
| 4 Vehicles | 473 (21.8%) | 355 (18.9%) |
| 5 or more Vehicles | 120 (5.5%) | 71 (3.8%) |
| Total | 2,165 (100.0%) | 1,882 (100.0%) |
Commute Time in Scott County
The most frequently occuring commute durations in Scott County are 10 to 14 minutes (737 commuters, 18.7%), 15 to 19 minutes (476 commuters, 12.1%), and 60 to 89 minutes (476 commuters, 12.1%).

| Commute Time | # Commuters | % Commuters |
| Less than 5 Minutes | 359 | 9.1% |
| 5 to 9 Minutes | 428 | 10.9% |
| 10 to 14 Minutes | 737 | 18.7% |
| 15 to 19 Minutes | 476 | 12.1% |
| 20 to 24 Minutes | 94 | 2.4% |
| 25 to 29 Minutes | 283 | 7.2% |
| 30 to 34 Minutes | 336 | 8.5% |
| 35 to 39 Minutes | 47 | 1.2% |
| 40 to 44 Minutes | 142 | 3.6% |
| 45 to 59 Minutes | 373 | 9.5% |
| 60 to 89 Minutes | 476 | 12.1% |
| 90 or more Minutes | 187 | 4.8% |
Commute Time by Sex in Scott County
The most common commute times in Scott County are 10 to 14 minutes (395 commuters, 19.1%) for males and 10 to 14 minutes (342 commuters, 18.3%) for females.

| Commute Time | Male | Female |
| Less than 5 Minutes | 126 (6.1%) | 233 (12.5%) |
| 5 to 9 Minutes | 184 (8.9%) | 244 (13.1%) |
| 10 to 14 Minutes | 395 (19.1%) | 342 (18.3%) |
| 15 to 19 Minutes | 269 (13.0%) | 207 (11.1%) |
| 20 to 24 Minutes | 17 (0.8%) | 77 (4.1%) |
| 25 to 29 Minutes | 47 (2.3%) | 236 (12.7%) |
| 30 to 34 Minutes | 169 (8.2%) | 167 (8.9%) |
| 35 to 39 Minutes | 47 (2.3%) | 0 (0.0%) |
| 40 to 44 Minutes | 87 (4.2%) | 55 (2.9%) |
| 45 to 59 Minutes | 287 (13.9%) | 86 (4.6%) |
| 60 to 89 Minutes | 326 (15.7%) | 150 (8.0%) |
| 90 or more Minutes | 118 (5.7%) | 69 (3.7%) |
Time of Departure to Work by Sex in Scott County
The most frequent times of departure to work in Scott County are 12:00 AM to 4:59 AM (443, 21.4%) for males and 7:00 AM to 7:29 AM (340, 18.2%) for females.

| Time of Departure | Male | Female |
| 12:00 AM to 4:59 AM | 443 (21.4%) | 58 (3.1%) |
| 5:00 AM to 5:29 AM | 137 (6.6%) | 58 (3.1%) |
| 5:30 AM to 5:59 AM | 123 (5.9%) | 178 (9.5%) |
| 6:00 AM to 6:29 AM | 166 (8.0%) | 197 (10.6%) |
| 6:30 AM to 6:59 AM | 345 (16.7%) | 274 (14.7%) |
| 7:00 AM to 7:29 AM | 152 (7.3%) | 340 (18.2%) |
| 7:30 AM to 7:59 AM | 91 (4.4%) | 228 (12.2%) |
| 8:00 AM to 8:29 AM | 72 (3.5%) | 243 (13.0%) |
| 8:30 AM to 8:59 AM | 50 (2.4%) | 0 (0.0%) |
| 9:00 AM to 9:59 AM | 18 (0.9%) | 33 (1.8%) |
| 10:00 AM to 10:59 AM | 36 (1.7%) | 51 (2.7%) |
| 11:00 AM to 11:59 AM | 43 (2.1%) | 50 (2.7%) |
| 12:00 PM to 3:59 PM | 85 (4.1%) | 42 (2.2%) |
| 4:00 PM to 11:59 PM | 311 (15.0%) | 114 (6.1%) |
| Total | 2,072 (100.0%) | 1,866 (100.0%) |
Housing Occupancy in Scott County
Occupancy by Ownership in Scott County
Of the total 3,901 dwellings in Scott County, owner-occupied units account for 2,897 (74.3%), while renter-occupied units make up 1,004 (25.7%).

| Occupancy | # Housing Units | % Housing Units |
| Owner Occupied Housing Units | 2,897 | 74.3% |
| Renter-Occupied Housing Units | 1,004 | 25.7% |
| Total Occupied Housing Units | 3,901 | 100.0% |
Occupancy by Household Size in Scott County
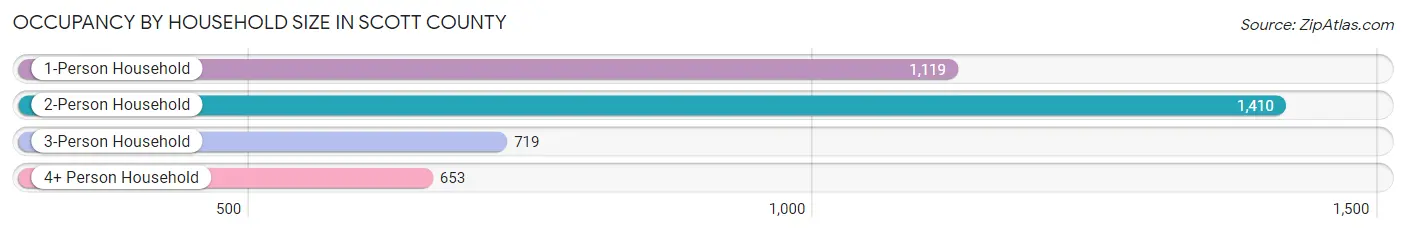
| Household Size | # Housing Units | % Housing Units |
| 1-Person Household | 1,119 | 28.7% |
| 2-Person Household | 1,410 | 36.1% |
| 3-Person Household | 719 | 18.4% |
| 4+ Person Household | 653 | 16.7% |
| Total Housing Units | 3,901 | 100.0% |
Occupancy by Ownership by Household Size in Scott County

| Household Size | Owner-occupied | Renter-occupied |
| 1-Person Household | 708 (63.3%) | 411 (36.7%) |
| 2-Person Household | 1,205 (85.5%) | 205 (14.5%) |
| 3-Person Household | 480 (66.8%) | 239 (33.2%) |
| 4+ Person Household | 504 (77.2%) | 149 (22.8%) |
| Total Housing Units | 2,897 (74.3%) | 1,004 (25.7%) |
Occupancy by Educational Attainment in Scott County

| Household Size | Owner-occupied | Renter-occupied |
| Less than High School | 405 (68.5%) | 186 (31.5%) |
| High School Diploma | 1,073 (71.8%) | 421 (28.2%) |
| College/Associate Degree | 1,009 (73.8%) | 358 (26.2%) |
| Bachelor's Degree or higher | 410 (91.3%) | 39 (8.7%) |
Occupancy by Age of Householder in Scott County

| Age Bracket | # Households | % Households |
| Under 35 Years | 623 | 16.0% |
| 35 to 44 Years | 530 | 13.6% |
| 45 to 54 Years | 673 | 17.2% |
| 55 to 64 Years | 778 | 19.9% |
| 65 to 74 Years | 682 | 17.5% |
| 75 to 84 Years | 500 | 12.8% |
| 85 Years and Over | 115 | 2.9% |
| Total | 3,901 | 100.0% |
Housing Finances in Scott County
Median Income by Occupancy in Scott County

| Occupancy Type | # Households | Median Income |
| Owner-Occupied | 2,897 (74.3%) | $49,760 |
| Renter-Occupied | 1,004 (25.7%) | $29,205 |
| Average | 3,901 (100.0%) | $45,340 |
Occupancy by Householder Income Bracket in Scott County

| Income Bracket | Owner-occupied | Renter-occupied |
| Less than $5,000 | 24 (0.8%) | 89 (8.9%) |
| $5,000 to $9,999 | 22 (0.8%) | 49 (4.9%) |
| $10,000 to $14,999 | 121 (4.2%) | 161 (16.0%) |
| $15,000 to $19,999 | 136 (4.7%) | 110 (11.0%) |
| $20,000 to $24,999 | 163 (5.6%) | 42 (4.2%) |
| $25,000 to $34,999 | 513 (17.7%) | 117 (11.7%) |
| $35,000 to $49,999 | 481 (16.6%) | 213 (21.2%) |
| $50,000 to $74,999 | 580 (20.0%) | 131 (13.1%) |
| $75,000 to $99,999 | 258 (8.9%) | 48 (4.8%) |
| $100,000 to $149,999 | 425 (14.7%) | 35 (3.5%) |
| $150,000 or more | 174 (6.0%) | 9 (0.9%) |
| Total | 2,897 (100.0%) | 1,004 (100.0%) |
Monthly Housing Cost Tiers in Scott County

| Monthly Cost | Owner-occupied | Renter-occupied |
| Less than $300 | 668 (23.1%) | 74 (7.4%) |
| $300 to $499 | 767 (26.5%) | 107 (10.7%) |
| $500 to $799 | 482 (16.6%) | 341 (34.0%) |
| $800 to $999 | 310 (10.7%) | 166 (16.5%) |
| $1,000 to $1,499 | 471 (16.3%) | 60 (6.0%) |
| $1,500 to $1,999 | 147 (5.1%) | 17 (1.7%) |
| $2,000 to $2,499 | 28 (1.0%) | 0 (0.0%) |
| $2,500 to $2,999 | 24 (0.8%) | 16 (1.6%) |
| $3,000 or more | 0 (0.0%) | 0 (0.0%) |
| Total | 2,897 (100.0%) | 1,004 (100.0%) |
Physical Housing Characteristics in Scott County
Housing Structures in Scott County

| Structure Type | # Housing Units | % Housing Units |
| Single Unit, Detached | 2,984 | 76.5% |
| Single Unit, Attached | 16 | 0.4% |
| 2 Unit Apartments | 98 | 2.5% |
| 3 or 4 Unit Apartments | 88 | 2.3% |
| 5 to 9 Unit Apartments | 47 | 1.2% |
| 10 or more Apartments | 64 | 1.6% |
| Mobile Home / Other | 604 | 15.5% |
| Total | 3,901 | 100.0% |
Housing Structures by Occupancy in Scott County

| Structure Type | Owner-occupied | Renter-occupied |
| Single Unit, Detached | 2,520 (84.5%) | 464 (15.5%) |
| Single Unit, Attached | 9 (56.2%) | 7 (43.8%) |
| 2 Unit Apartments | 0 (0.0%) | 98 (100.0%) |
| 3 or 4 Unit Apartments | 20 (22.7%) | 68 (77.3%) |
| 5 to 9 Unit Apartments | 0 (0.0%) | 47 (100.0%) |
| 10 or more Apartments | 0 (0.0%) | 64 (100.0%) |
| Mobile Home / Other | 348 (57.6%) | 256 (42.4%) |
| Total | 2,897 (74.3%) | 1,004 (25.7%) |
Housing Structures by Number of Rooms in Scott County

| Number of Rooms | Owner-occupied | Renter-occupied |
| 1 Room | 22 (0.8%) | 61 (6.1%) |
| 2 or 3 Rooms | 197 (6.8%) | 144 (14.3%) |
| 4 or 5 Rooms | 1,020 (35.2%) | 526 (52.4%) |
| 6 or 7 Rooms | 1,203 (41.5%) | 200 (19.9%) |
| 8 or more Rooms | 455 (15.7%) | 73 (7.3%) |
| Total | 2,897 (100.0%) | 1,004 (100.0%) |
Housing Structure by Heating Type in Scott County

| Heating Type | Owner-occupied | Renter-occupied |
| Utility Gas | 411 (14.2%) | 214 (21.3%) |
| Bottled, Tank, or LP Gas | 312 (10.8%) | 82 (8.2%) |
| Electricity | 1,512 (52.2%) | 625 (62.3%) |
| Fuel Oil or Kerosene | 49 (1.7%) | 0 (0.0%) |
| Coal or Coke | 0 (0.0%) | 0 (0.0%) |
| All other Fuels | 605 (20.9%) | 83 (8.3%) |
| No Fuel Used | 8 (0.3%) | 0 (0.0%) |
| Total | 2,897 (100.0%) | 1,004 (100.0%) |
Household Vehicle Usage in Scott County
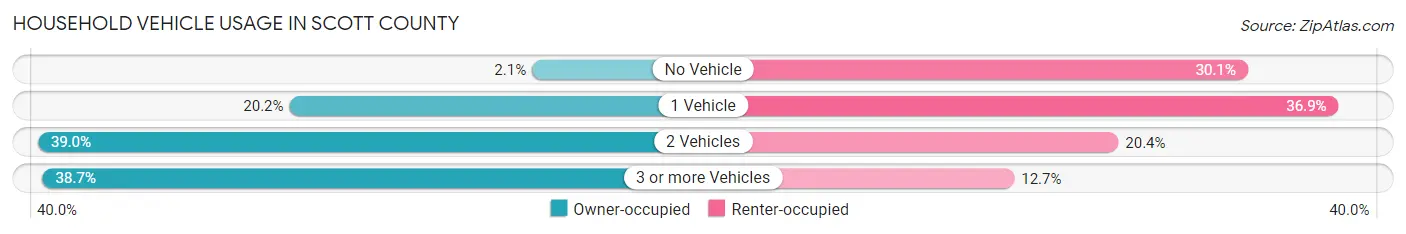
| Vehicles per Household | Owner-occupied | Renter-occupied |
| No Vehicle | 61 (2.1%) | 302 (30.1%) |
| 1 Vehicle | 586 (20.2%) | 370 (36.8%) |
| 2 Vehicles | 1,130 (39.0%) | 205 (20.4%) |
| 3 or more Vehicles | 1,120 (38.7%) | 127 (12.7%) |
| Total | 2,897 (100.0%) | 1,004 (100.0%) |
Real Estate & Mortgages in Scott County
Real Estate and Mortgage Overview in Scott County
| Characteristic | Without Mortgage | With Mortgage |
| Housing Units | 1,612 | 1,285 |
| Median Property Value | $93,700 | $99,300 |
| Median Household Income | $45,244 | $117 |
| Monthly Housing Costs | $341 | $0 |
| Real Estate Taxes | $411 | $122 |
Property Value by Mortgage Status in Scott County
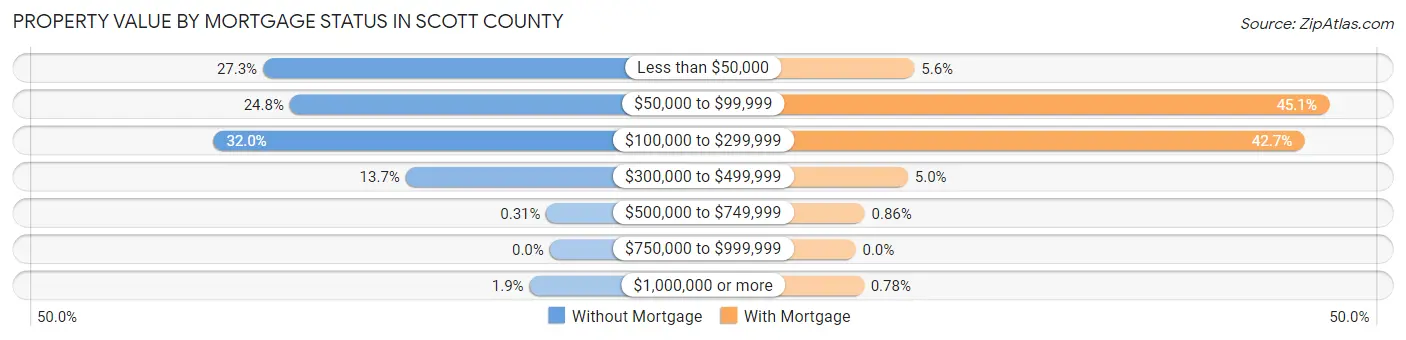
| Property Value | Without Mortgage | With Mortgage |
| Less than $50,000 | 440 (27.3%) | 72 (5.6%) |
| $50,000 to $99,999 | 399 (24.7%) | 579 (45.1%) |
| $100,000 to $299,999 | 516 (32.0%) | 549 (42.7%) |
| $300,000 to $499,999 | 221 (13.7%) | 64 (5.0%) |
| $500,000 to $749,999 | 5 (0.3%) | 11 (0.9%) |
| $750,000 to $999,999 | 0 (0.0%) | 0 (0.0%) |
| $1,000,000 or more | 31 (1.9%) | 10 (0.8%) |
| Total | 1,612 (100.0%) | 1,285 (100.0%) |
Household Income by Mortgage Status in Scott County
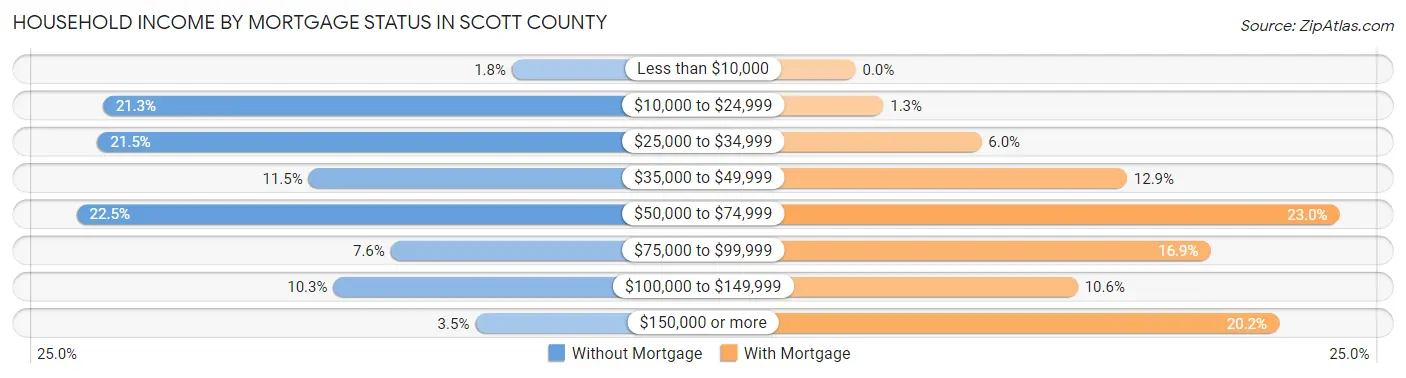
| Household Income | Without Mortgage | With Mortgage |
| Less than $10,000 | 29 (1.8%) | 0 (0.0%) |
| $10,000 to $24,999 | 343 (21.3%) | 17 (1.3%) |
| $25,000 to $34,999 | 347 (21.5%) | 77 (6.0%) |
| $35,000 to $49,999 | 185 (11.5%) | 166 (12.9%) |
| $50,000 to $74,999 | 363 (22.5%) | 296 (23.0%) |
| $75,000 to $99,999 | 122 (7.6%) | 217 (16.9%) |
| $100,000 to $149,999 | 166 (10.3%) | 136 (10.6%) |
| $150,000 or more | 57 (3.5%) | 259 (20.2%) |
| Total | 1,612 (100.0%) | 1,285 (100.0%) |
Property Value to Household Income Ratio in Scott County
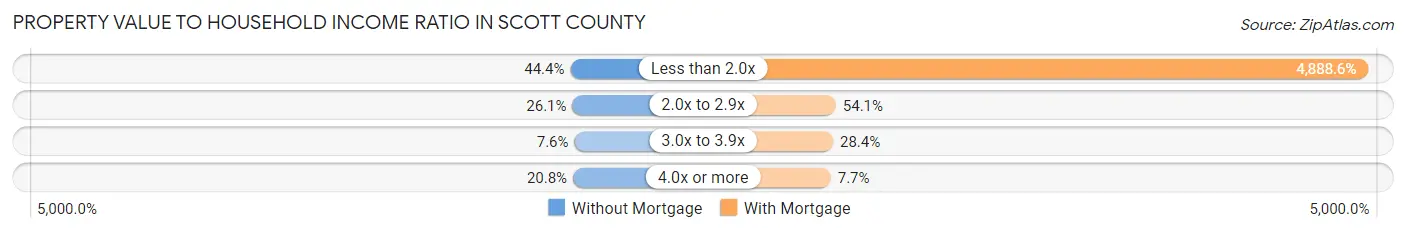
| Value-to-Income Ratio | Without Mortgage | With Mortgage |
| Less than 2.0x | 715 (44.4%) | 62,819 (4,888.6%) |
| 2.0x to 2.9x | 421 (26.1%) | 695 (54.1%) |
| 3.0x to 3.9x | 123 (7.6%) | 365 (28.4%) |
| 4.0x or more | 335 (20.8%) | 99 (7.7%) |
| Total | 1,612 (100.0%) | 1,285 (100.0%) |
Real Estate Taxes by Mortgage Status in Scott County

| Property Taxes | Without Mortgage | With Mortgage |
| Less than $800 | 1,071 (66.4%) | 6 (0.5%) |
| $800 to $1,499 | 284 (17.6%) | 890 (69.3%) |
| $800 to $1,499 | 63 (3.9%) | 145 (11.3%) |
| Total | 1,612 (100.0%) | 1,285 (100.0%) |
Health & Disability in Scott County
Health Insurance Coverage by Age in Scott County

| Age Bracket | With Coverage | Without Coverage |
| Under 6 Years | 549 (90.7%) | 56 (9.3%) |
| 6 to 18 Years | 1,495 (82.0%) | 328 (18.0%) |
| 19 to 25 Years | 523 (85.0%) | 92 (15.0%) |
| 26 to 34 Years | 832 (83.2%) | 168 (16.8%) |
| 35 to 44 Years | 963 (92.2%) | 81 (7.8%) |
| 45 to 54 Years | 1,069 (85.4%) | 183 (14.6%) |
| 55 to 64 Years | 1,361 (92.5%) | 110 (7.5%) |
| 65 to 74 Years | 1,120 (99.4%) | 7 (0.6%) |
| 75 Years and older | 855 (100.0%) | 0 (0.0%) |
| Total | 8,767 (89.5%) | 1,025 (10.5%) |
Health Insurance Coverage by Citizenship Status in Scott County

| Citizenship Status | With Coverage | Without Coverage |
| Native Born | 549 (90.7%) | 56 (9.3%) |
| Foreign Born, Citizen | 1,495 (82.0%) | 328 (18.0%) |
| Foreign Born, not a Citizen | 523 (85.0%) | 92 (15.0%) |
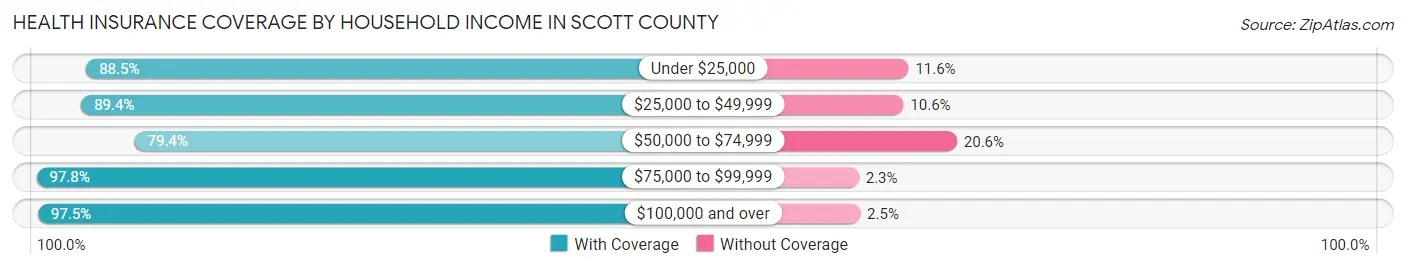
Health Insurance Coverage by Household Income in Scott County
| Household Income | With Coverage | Without Coverage |
| Under $25,000 | 1,225 (88.4%) | 160 (11.6%) |
| $25,000 to $49,999 | 2,554 (89.4%) | 303 (10.6%) |
| $50,000 to $74,999 | 1,863 (79.4%) | 484 (20.6%) |
| $75,000 to $99,999 | 824 (97.8%) | 19 (2.2%) |
| $100,000 and over | 2,301 (97.5%) | 59 (2.5%) |
Public vs Private Health Insurance Coverage by Age in Scott County

| Age Bracket | Public Insurance | Private Insurance |
| Under 6 | 321 (53.1%) | 236 (39.0%) |
| 6 to 18 Years | 1,049 (57.5%) | 597 (32.8%) |
| 19 to 25 Years | 190 (30.9%) | 383 (62.3%) |
| 25 to 34 Years | 310 (31.0%) | 620 (62.0%) |
| 35 to 44 Years | 312 (29.9%) | 679 (65.0%) |
| 45 to 54 Years | 207 (16.5%) | 896 (71.6%) |
| 55 to 64 Years | 470 (32.0%) | 1,022 (69.5%) |
| 65 to 74 Years | 1,017 (90.2%) | 607 (53.9%) |
| 75 Years and over | 834 (97.5%) | 398 (46.6%) |
| Total | 4,710 (48.1%) | 5,438 (55.5%) |
Disability Status by Sex by Age in Scott County
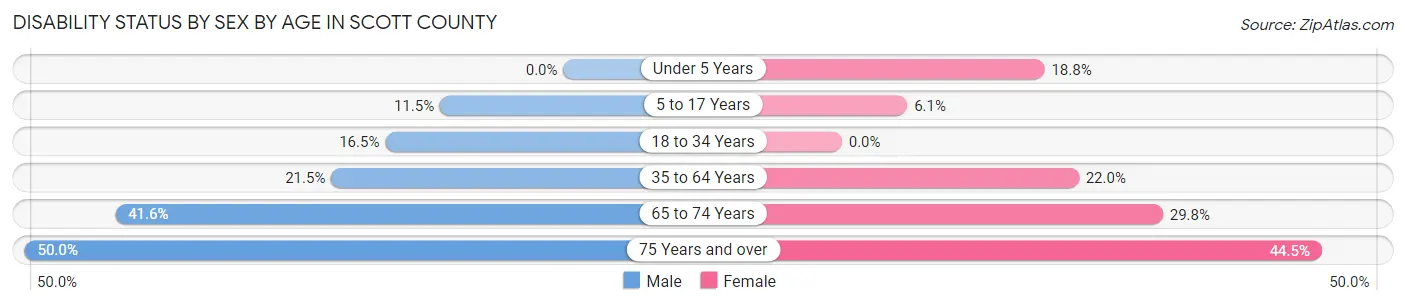
| Age Bracket | Male | Female |
| Under 5 Years | 0 (0.0%) | 41 (18.8%) |
| 5 to 17 Years | 128 (11.5%) | 41 (6.1%) |
| 18 to 34 Years | 157 (16.5%) | 0 (0.0%) |
| 35 to 64 Years | 402 (21.5%) | 418 (22.0%) |
| 65 to 74 Years | 230 (41.6%) | 171 (29.8%) |
| 75 Years and over | 194 (50.0%) | 208 (44.5%) |
Disability Class by Sex by Age in Scott County
Disability Class: Hearing Difficulty

| Age Bracket | Male | Female |
| Under 5 Years | 0 (0.0%) | 7 (3.2%) |
| 5 to 17 Years | 56 (5.0%) | 0 (0.0%) |
| 18 to 34 Years | 19 (2.0%) | 0 (0.0%) |
| 35 to 64 Years | 156 (8.4%) | 50 (2.6%) |
| 65 to 74 Years | 140 (25.3%) | 29 (5.1%) |
| 75 Years and over | 126 (32.5%) | 69 (14.8%) |
Disability Class: Vision Difficulty

| Age Bracket | Male | Female |
| Under 5 Years | 0 (0.0%) | 34 (15.6%) |
| 5 to 17 Years | 15 (1.3%) | 41 (6.1%) |
| 18 to 34 Years | 38 (4.0%) | 0 (0.0%) |
| 35 to 64 Years | 37 (2.0%) | 30 (1.6%) |
| 65 to 74 Years | 0 (0.0%) | 23 (4.0%) |
| 75 Years and over | 32 (8.3%) | 74 (15.9%) |
Disability Class: Cognitive Difficulty

| Age Bracket | Male | Female |
| 5 to 17 Years | 105 (9.4%) | 41 (6.1%) |
| 18 to 34 Years | 91 (9.6%) | 0 (0.0%) |
| 35 to 64 Years | 155 (8.3%) | 181 (9.5%) |
| 65 to 74 Years | 35 (6.3%) | 40 (7.0%) |
| 75 Years and over | 37 (9.5%) | 34 (7.3%) |
Disability Class: Ambulatory Difficulty

| Age Bracket | Male | Female |
| 5 to 17 Years | 0 (0.0%) | 41 (6.1%) |
| 18 to 34 Years | 6 (0.6%) | 0 (0.0%) |
| 35 to 64 Years | 229 (12.3%) | 276 (14.5%) |
| 65 to 74 Years | 90 (16.3%) | 134 (23.3%) |
| 75 Years and over | 104 (26.8%) | 118 (25.3%) |
Disability Class: Self-Care Difficulty

| Age Bracket | Male | Female |
| 5 to 17 Years | 6 (0.5%) | 0 (0.0%) |
| 18 to 34 Years | 18 (1.9%) | 0 (0.0%) |
| 35 to 64 Years | 70 (3.7%) | 40 (2.1%) |
| 65 to 74 Years | 52 (9.4%) | 71 (12.4%) |
| 75 Years and over | 39 (10.1%) | 22 (4.7%) |
Technology Access in Scott County
Computing Device Access in Scott County

| Device Type | # Households | % Households |
| Desktop or Laptop | 2,433 | 62.4% |
| Smartphone | 2,992 | 76.7% |
| Tablet | 1,792 | 45.9% |
| No Computing Device | 550 | 14.1% |
| Total | 3,901 | 100.0% |
Internet Access in Scott County
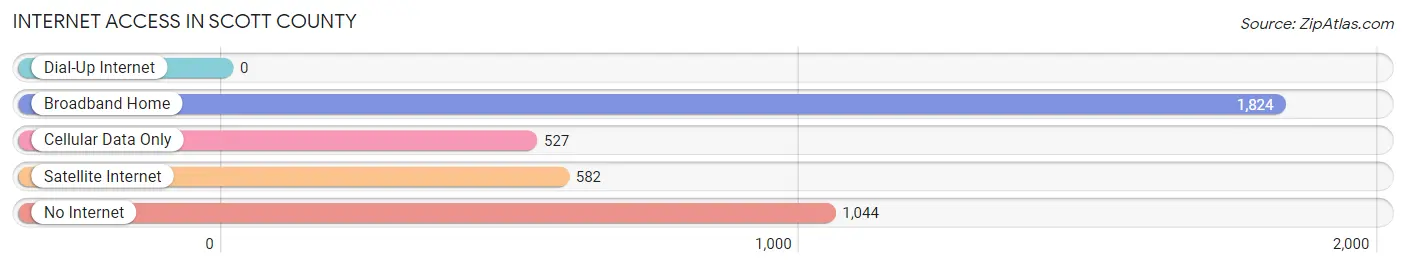
| Internet Type | # Households | % Households |
| Dial-Up Internet | 0 | 0.0% |
| Broadband Home | 1,824 | 46.8% |
| Cellular Data Only | 527 | 13.5% |
| Satellite Internet | 582 | 14.9% |
| No Internet | 1,044 | 26.8% |
| Total | 3,901 | 100.0% |
Scott County Summary
Scott County is a county located in the U.S. state of Arkansas. As of the 2010 census, the population was 11,233. The county seat is Waldron. Scott County is Arkansas's 67th county, formed on November 5, 1833, and named for Andrew Scott, a justice of the Supreme Court of the Arkansas Territory.
Geography
Scott County is located in the Ouachita Mountains region of Arkansas. According to the U.S. Census Bureau, the county has a total area of 602sqmi, of which 599sqmi is land and 3sqmi (0.5%) is water.
The county is located approximately in the center of the state and is bordered by Logan County to the north, Yell County to the east, Montgomery County to the south, and Sebastian County to the west.
Major highways
20px U S Highway 71
20px U S Highway 270
20px Highway 10
20px Highway 23
20px Highway 80
Adjacent counties
Logan County north
Yell County east
Montgomery County south
Sebastian County west
Demographics
As of the 2000 United States Census, there were 11,945 people, 4,717 households, and 3,400 families residing in the county. The population density was 20 people per square mile (8/km^2). There were 5,541 housing units at an average density of 9 per squaremile (4/km^2). The racial makeup of the county was 93.90% White, 0.17% Black or African American, 1.45% Native American, 0.17% Asian, 0.02% Pacific Islander, 2.90% from other races, and 1.39% from two or more races. 5.45% of the population were Hispanic or Latino of any race.
There were 4,717 households, out of which 30.90% had children under the age of 18 living with them, 57.90% were married couples living together, 9.50% had a female householder with no husband present, and 28.90% were non-families. 25.90% of all households were made up of individuals, and 13.50% had someone living alone who was 65 years of age or older. The average household size was 2.50 and the average family size was 3.00.
In the county, the population was spread out, with 25.90% under the age of 18, 8.10% from 18 to 24, 25.50% from 25 to 44, 23.90% from 45 to 64, and 16.60% who were 65 years of age or older. The median age was 38 years. For every 100 females there were 94.90 males. For every 100 females age 18 and over, there were 91.90 males.
The median income for a household in the county was $25,945, and the median income for a family was $31,945. Males had a median income of $25,945 versus $18,945 for females. The per capita income for the county was $14,945. About 14.90% of families and 18.90% of the population were below the poverty line, including 24.90% of those under age 18 and 16.90% of those age 65 or over.
Economy
The economy of Scott County is largely based on agriculture and timber. The county is home to a variety of crops, including corn, soybeans, wheat, and hay. The timber industry is also an important part of the local economy, with the county being home to several sawmills and wood-processing plants.
The county is also home to several manufacturing companies, including a furniture manufacturer, a plastics manufacturer, and a metal fabrication plant. The county is also home to a number of small businesses, including restaurants, retail stores, and service providers.
The county is served by the Waldron Municipal Airport, which provides general aviation services. The county is also served by the Waldron School District, which provides public education to the county's students.
Conclusion
Scott County is a rural county located in the Ouachita Mountains region of Arkansas. The county is home to a variety of agricultural and timber-based industries, as well as a number of small businesses. The county is served by the Waldron Municipal Airport and the Waldron School District. The county has a population of 11,233, as of the 2010 census.
Common Questions
What is the Total Population of Scott County?
Total Population of Scott County is 9,871.
What is the Total Male Population of Scott County?
Total Male Population of Scott County is 5,205.
What is the Total Female Population of Scott County?
Total Female Population of Scott County is 4,666.
What is the Ratio of Males per 100 Females in Scott County?
There are 111.55 Males per 100 Females in Scott County.
What is the Ratio of Females per 100 Males in Scott County?
There are 89.64 Females per 100 Males in Scott County.
What is the Median Population Age in Scott County?
Median Population Age in Scott County is 42.8 Years.
What is the Average Family Size in Scott County
Average Family Size in Scott County is 3.1 People.
What is the Average Household Size in Scott County
Average Household Size in Scott County is 2.5 People.
What is Per Capita Income in Scott County?
Per Capita income in Scott County is $23,086.
What is the Median Family Income in Scott County?
Median Family Income in Scott County is $61,206.
What is the Median Household income in Scott County?
Median Household Income in Scott County is $45,340.
What is Income or Wage Gap in Scott County?
Income or Wage Gap in Scott County is 15.9%.
Women in Scott County earn 84.1 cents for every dollar earned by a man.
What is Inequality or Gini Index in Scott County?
Inequality or Gini Index in Scott County is 0.41.
How Large is the Labor Force in Scott County?
There are 4,327 People in the Labor Forcein in Scott County.
What is the Percentage of People in the Labor Force in Scott County?
55.3% of People are in the Labor Force in Scott County.
What is the Unemployment Rate in Scott County?
Unemployment Rate in Scott County is 5.7%.