Prairie County, AR
Prairie County Map

Prairie County Overview
8,217
TOTAL POPULATION
4,128
MALE POPULATION
4,089
FEMALE POPULATION
100.95
MALES / 100 FEMALES
99.06
FEMALES / 100 MALES
46.5
MEDIAN AGE
3.1
AVG FAMILY SIZE
2.4
AVG HOUSEHOLD SIZE
$29,018
PER CAPITA INCOME
$76,988
AVG FAMILY INCOME
$47,045
AVG HOUSEHOLD INCOME
31.1%
WAGE / INCOME GAP [ % ]
68.9¢/ $1
WAGE / INCOME GAP [ $ ]
0.44
INEQUALITY / GINI INDEX
3,723
LABOR FORCE [ PEOPLE ]
54.0%
PERCENT IN LABOR FORCE
4.1%
UNEMPLOYMENT RATE
Prairie County Area Codes
Race in Prairie County
The most populous races in Prairie County are White / Caucasian (6,970 | 84.8%), Black / African American (866 | 10.5%), and Two or more Races (265 | 3.2%).

| Race | # Population | % Population |
| Asian | 17 | 0.2% |
| Black / African American | 866 | 10.5% |
| Hawaiian / Pacific | 0 | 0.0% |
| Hispanic or Latino | 171 | 2.1% |
| Native / Alaskan | 4 | 0.1% |
| White / Caucasian | 6,970 | 84.8% |
| Two or more Races | 265 | 3.2% |
| Some other Race | 95 | 1.2% |
| Total | 8,217 | 100.0% |
Ancestry in Prairie County
The most populous ancestries reported in Prairie County are Irish (1,117 | 13.6%), German (1,067 | 13.0%), English (687 | 8.4%), American (557 | 6.8%), and Dutch (375 | 4.6%), together accounting for 46.3% of all Prairie County residents.

| Ancestry | # Population | % Population |
| African | 5 | 0.1% |
| American | 557 | 6.8% |
| Bangladeshi | 17 | 0.2% |
| Bhutanese | 8 | 0.1% |
| Blackfeet | 1 | 0.0% |
| British | 16 | 0.2% |
| Cherokee | 9 | 0.1% |
| Chippewa | 2 | 0.0% |
| Creek | 4 | 0.1% |
| Czech | 40 | 0.5% |
| Czechoslovakian | 45 | 0.5% |
| Dutch | 375 | 4.6% |
| Eastern European | 75 | 0.9% |
| English | 687 | 8.4% |
| French | 17 | 0.2% |
| German | 1,067 | 13.0% |
| Greek | 6 | 0.1% |
| Irish | 1,117 | 13.6% |
| Italian | 69 | 0.8% |
| Korean | 6 | 0.1% |
| Mexican | 140 | 1.7% |
| Northern European | 9 | 0.1% |
| Norwegian | 1 | 0.0% |
| Polish | 15 | 0.2% |
| Scotch-Irish | 179 | 2.2% |
| Scottish | 58 | 0.7% |
| Slovak | 13 | 0.2% |
| Subsaharan African | 5 | 0.1% |
| Swedish | 37 | 0.4% |
| Welsh | 10 | 0.1% |
| Yugoslavian | 3 | 0.0% | View All 31 Rows |
Immigrants in Prairie County
The most numerous immigrant groups reported in Prairie County came from Central America (15 | 0.2%), Latin America (15 | 0.2%), El Salvador (9 | 0.1%), Mexico (6 | 0.1%), and Europe (1 | 0.0%), together accounting for 0.6% of all Prairie County residents.
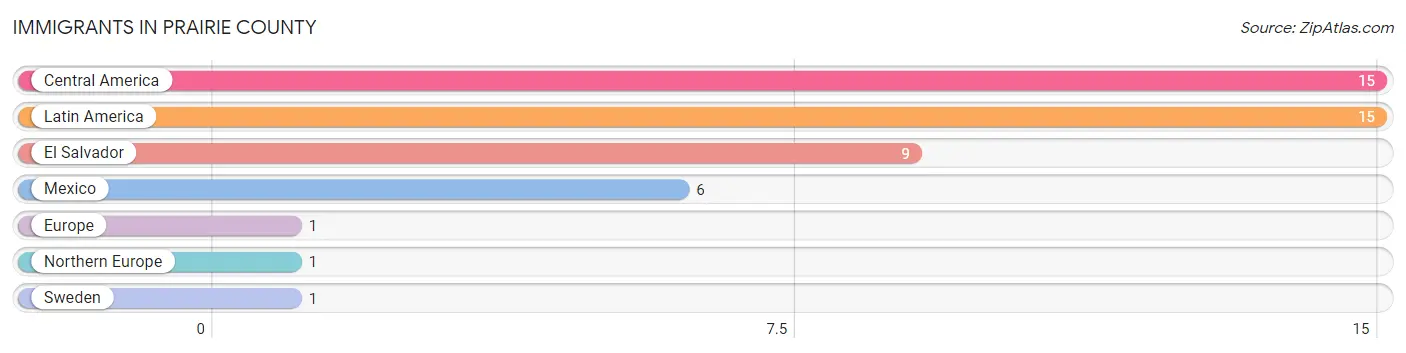
| Immigration Origin | # Population | % Population |
| Central America | 15 | 0.2% |
| El Salvador | 9 | 0.1% |
| Europe | 1 | 0.0% |
| Latin America | 15 | 0.2% |
| Mexico | 6 | 0.1% |
| Northern Europe | 1 | 0.0% |
| Sweden | 1 | 0.0% | View All 7 Rows |
Sex and Age in Prairie County
Sex and Age in Prairie County
The most populous age groups in Prairie County are 60 to 64 Years (350 | 8.5%) for men and 55 to 59 Years (349 | 8.5%) for women.

| Age Bracket | Male | Female |
| Under 5 Years | 234 (5.7%) | 170 (4.2%) |
| 5 to 9 Years | 134 (3.3%) | 251 (6.1%) |
| 10 to 14 Years | 336 (8.1%) | 111 (2.7%) |
| 15 to 19 Years | 323 (7.8%) | 266 (6.5%) |
| 20 to 24 Years | 191 (4.6%) | 207 (5.1%) |
| 25 to 29 Years | 227 (5.5%) | 184 (4.5%) |
| 30 to 34 Years | 240 (5.8%) | 219 (5.4%) |
| 35 to 39 Years | 155 (3.7%) | 198 (4.8%) |
| 40 to 44 Years | 264 (6.4%) | 242 (5.9%) |
| 45 to 49 Years | 221 (5.3%) | 244 (6.0%) |
| 50 to 54 Years | 311 (7.5%) | 329 (8.1%) |
| 55 to 59 Years | 232 (5.6%) | 349 (8.5%) |
| 60 to 64 Years | 350 (8.5%) | 286 (7.0%) |
| 65 to 69 Years | 308 (7.5%) | 221 (5.4%) |
| 70 to 74 Years | 183 (4.4%) | 300 (7.3%) |
| 75 to 79 Years | 221 (5.3%) | 247 (6.0%) |
| 80 to 84 Years | 137 (3.3%) | 96 (2.4%) |
| 85 Years and over | 61 (1.5%) | 169 (4.1%) |
| Total | 4,128 (100.0%) | 4,089 (100.0%) |
Families and Households in Prairie County
Median Family Size in Prairie County
The median family size in Prairie County is 3.14 persons per family, with single male/father families (100 | 4.8%) accounting for the largest median family size of 4.24 persons per family. On the other hand, married-couple families (1,595 | 77.2%) represent the smallest median family size with 3.01 persons per family.

| Family Type | # Families | Family Size |
| Married-Couple | 1,595 (77.2%) | 3.01 |
| Single Male/Father | 100 (4.8%) | 4.24 |
| Single Female/Mother | 370 (17.9%) | 3.39 |
| Total Families | 2,065 (100.0%) | 3.14 |
Median Household Size in Prairie County
The median household size in Prairie County is 2.43 persons per household, with single male/father households (100 | 3.0%) accounting for the largest median household size of 4.41 persons per household. non-family households (1,249 | 37.7%) represent the smallest median household size with 1.18 persons per household.
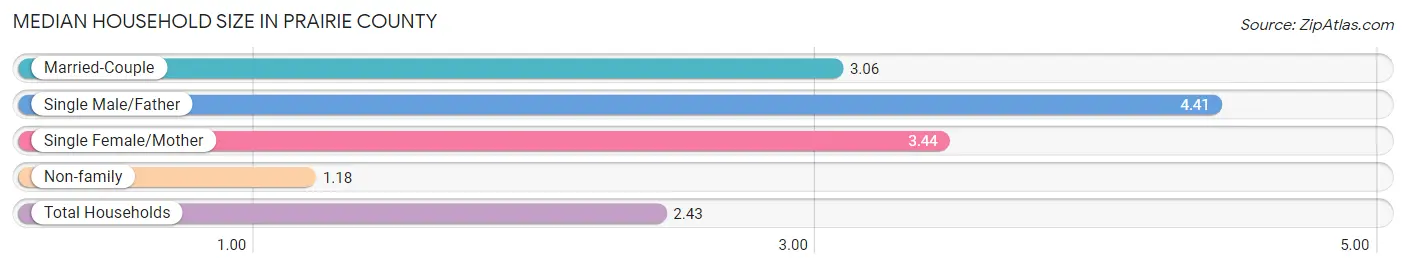
| Household Type | # Households | Household Size |
| Married-Couple | 1,595 (48.1%) | 3.06 |
| Single Male/Father | 100 (3.0%) | 4.41 |
| Single Female/Mother | 370 (11.2%) | 3.44 |
| Non-family | 1,249 (37.7%) | 1.18 |
| Total Households | 3,314 (100.0%) | 2.43 |
Household Size by Marriage Status in Prairie County
Out of a total of 3,314 households in Prairie County, 2,065 (62.3%) are family households, while 1,249 (37.7%) are nonfamily households. The most numerous type of family households are 2-person households, comprising 1,041, and the most common type of nonfamily households are 1-person households, comprising 1,128.

| Household Size | Family Households | Nonfamily Households |
| 1-Person Households | - | 1,128 (34.0%) |
| 2-Person Households | 1,041 (31.4%) | 91 (2.8%) |
| 3-Person Households | 530 (16.0%) | 15 (0.4%) |
| 4-Person Households | 351 (10.6%) | 15 (0.4%) |
| 5-Person Households | 99 (3.0%) | 0 (0.0%) |
| 6-Person Households | 35 (1.1%) | 0 (0.0%) |
| 7+ Person Households | 9 (0.3%) | 0 (0.0%) |
| Total | 2,065 (62.3%) | 1,249 (37.7%) |
Female Fertility in Prairie County
Fertility by Age in Prairie County
Average fertility rate in Prairie County is 51.0 births per 1,000 women. Women in the age bracket of 20 to 34 years have the highest fertility rate with 126.0 births per 1,000 women. Women in the age bracket of 20 to 34 years acount for 90.6% of all women with births.

| Age Bracket | Women with Births | Births / 1,000 Women |
| 15 to 19 years | 0 (0.0%) | 0.0 |
| 20 to 34 years | 77 (90.6%) | 126.0 |
| 35 to 50 years | 8 (9.4%) | 10.0 |
| Total | 85 (100.0%) | 51.0 |
Fertility by Age by Marriage Status in Prairie County
51.8% of women with births (85) in Prairie County are married. The highest percentage of unmarried women with births falls into 20 to 34 years age bracket with 53.2% of them unmarried at the time of birth, while the lowest percentage of unmarried women with births belong to 35 to 50 years age bracket with 0.0% of them unmarried.

| Age Bracket | Married | Unmarried |
| 15 to 19 years | 0 (0.0%) | 0 (0.0%) |
| 20 to 34 years | 36 (46.8%) | 41 (53.2%) |
| 35 to 50 years | 8 (100.0%) | 0 (0.0%) |
| Total | 44 (51.8%) | 41 (48.2%) |
Fertility by Education in Prairie County

| Educational Attainment | Women with Births | Births / 1,000 Women |
| Less than High School | 0 (0.0%) | 0.0 |
| High School Diploma | 43 (50.6%) | 114.0 |
| College or Associate's Degree | 13 (15.3%) | 26.0 |
| Bachelor's Degree | 18 (21.2%) | 57.0 |
| Graduate Degree | 11 (12.9%) | 62.0 |
| Total | 85 (100.0%) | 51.0 |
Fertility by Education by Marriage Status in Prairie County
48.2% of women with births in Prairie County are unmarried. Women with the educational attainment of bachelor's degree are most likely to be married with 100.0% of them married at childbirth, while women with the educational attainment of college or associate's degree are least likely to be married with 100.0% of them unmarried at childbirth.

| Educational Attainment | Married | Unmarried |
| Less than High School | 0 (0.0%) | 0 (0.0%) |
| High School Diploma | 15 (34.9%) | 28 (65.1%) |
| College or Associate's Degree | 0 (0.0%) | 13 (100.0%) |
| Bachelor's Degree | 18 (100.0%) | 0 (0.0%) |
| Graduate Degree | 11 (100.0%) | 0 (0.0%) |
| Total | 44 (51.8%) | 41 (48.2%) |
Income in Prairie County
Income Overview in Prairie County
Per Capita Income in Prairie County is $29,018, while median incomes of families and households are $76,988 and $47,045 respectively.
| Characteristic | Number | Measure |
| Per Capita Income | 8,217 | $29,018 |
| Median Family Income | 2,065 | $76,988 |
| Mean Family Income | 2,065 | $86,531 |
| Median Household Income | 3,314 | $47,045 |
| Mean Household Income | 3,314 | $66,616 |
| Income Deficit | 2,065 | $0 |
| Wage / Income Gap (%) | 8,217 | 31.14% |
| Wage / Income Gap ($) | 8,217 | 68.86¢ per $1 |
| Gini / Inequality Index | 8,217 | 0.44 |
Earnings by Sex in Prairie County
Average Earnings in Prairie County are $35,279, $44,682 for men and $30,767 for women, a difference of 31.1%.
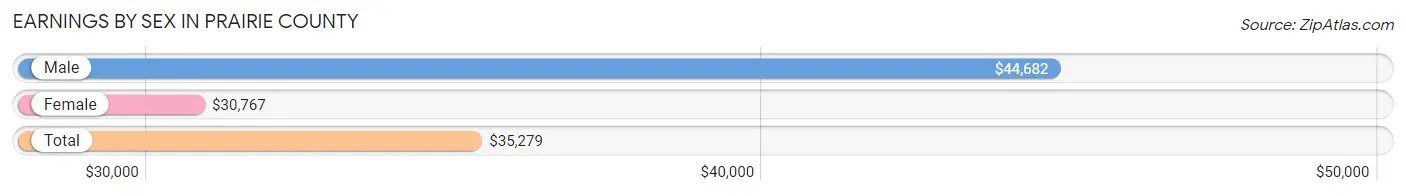
| Sex | Number | Average Earnings |
| Male | 1,934 (50.9%) | $44,682 |
| Female | 1,865 (49.1%) | $30,767 |
| Total | 3,799 (100.0%) | $35,279 |
Earnings by Sex by Income Bracket in Prairie County
The most common earnings brackets in Prairie County are $100,000+ for men (248 | 12.8%) and $55,000 to $64,999 for women (237 | 12.7%).
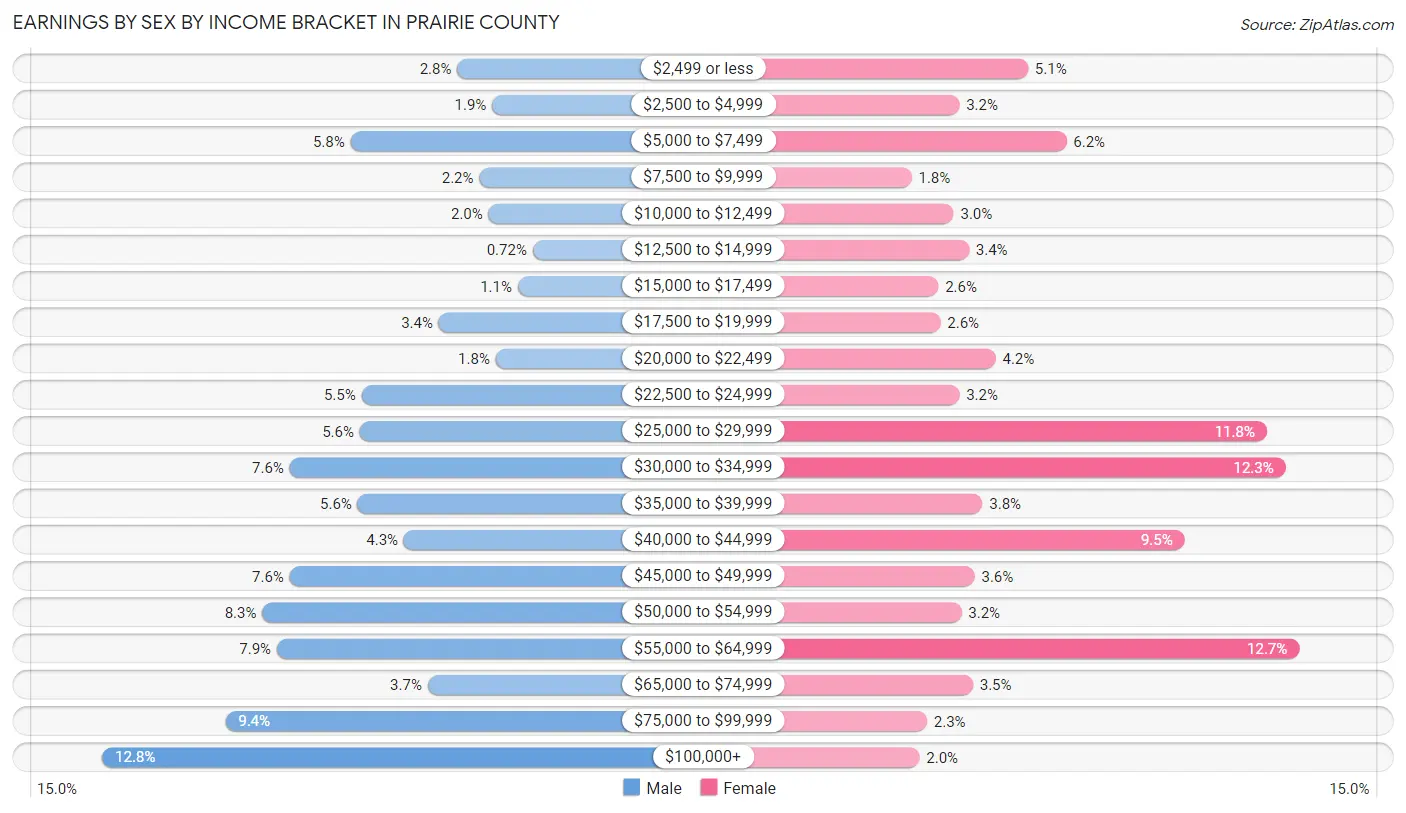
| Income | Male | Female |
| $2,499 or less | 55 (2.8%) | 95 (5.1%) |
| $2,500 to $4,999 | 36 (1.9%) | 59 (3.2%) |
| $5,000 to $7,499 | 113 (5.8%) | 115 (6.2%) |
| $7,500 to $9,999 | 43 (2.2%) | 34 (1.8%) |
| $10,000 to $12,499 | 38 (2.0%) | 56 (3.0%) |
| $12,500 to $14,999 | 14 (0.7%) | 64 (3.4%) |
| $15,000 to $17,499 | 22 (1.1%) | 48 (2.6%) |
| $17,500 to $19,999 | 65 (3.4%) | 49 (2.6%) |
| $20,000 to $22,499 | 34 (1.8%) | 78 (4.2%) |
| $22,500 to $24,999 | 107 (5.5%) | 59 (3.2%) |
| $25,000 to $29,999 | 108 (5.6%) | 220 (11.8%) |
| $30,000 to $34,999 | 146 (7.5%) | 230 (12.3%) |
| $35,000 to $39,999 | 109 (5.6%) | 71 (3.8%) |
| $40,000 to $44,999 | 84 (4.3%) | 177 (9.5%) |
| $45,000 to $49,999 | 146 (7.5%) | 67 (3.6%) |
| $50,000 to $54,999 | 161 (8.3%) | 60 (3.2%) |
| $55,000 to $64,999 | 153 (7.9%) | 237 (12.7%) |
| $65,000 to $74,999 | 71 (3.7%) | 66 (3.5%) |
| $75,000 to $99,999 | 181 (9.4%) | 42 (2.2%) |
| $100,000+ | 248 (12.8%) | 38 (2.0%) |
| Total | 1,934 (100.0%) | 1,865 (100.0%) |
Earnings by Sex by Educational Attainment in Prairie County
Average earnings in Prairie County are $46,111 for men and $31,471 for women, a difference of 31.8%. Men with an educational attainment of bachelor's degree enjoy the highest average annual earnings of $50,179, while those with less than high school education earn the least with $33,882. Women with an educational attainment of graduate degree earn the most with the average annual earnings of $55,708, while those with less than high school education have the smallest earnings of $6,417.

| Educational Attainment | Male Income | Female Income |
| Less than High School | $33,882 | $6,417 |
| High School Diploma | $35,893 | $25,893 |
| College or Associate's Degree | $49,063 | $31,206 |
| Bachelor's Degree | $50,179 | $37,045 |
| Graduate Degree | - | - |
| Total | $46,111 | $31,471 |
Family Income in Prairie County
Family Income Brackets in Prairie County
According to the Prairie County family income data, there are 483 families falling into the $75,000 to $99,999 income range, which is the most common income bracket and makes up 23.4% of all families. Conversely, the $10,000 to $14,999 income bracket is the least frequent group with only 19 families (0.9%) belonging to this category.

| Income Bracket | # Families | % Families |
| Less than $10,000 | 52 | 2.5% |
| $10,000 to $14,999 | 19 | 0.9% |
| $15,000 to $24,999 | 87 | 4.2% |
| $25,000 to $34,999 | 217 | 10.5% |
| $35,000 to $49,999 | 351 | 17.0% |
| $50,000 to $74,999 | 260 | 12.6% |
| $75,000 to $99,999 | 483 | 23.4% |
| $100,000 to $149,999 | 345 | 16.7% |
| $150,000 to $199,999 | 128 | 6.2% |
| $200,000+ | 126 | 6.1% |
Family Income by Famaliy Size in Prairie County
3-person families (547 | 26.5%) account for the highest median family income in Prairie County with $79,208 per family, while 2-person families (1,070 | 51.8%) have the highest median income of $37,652 per family member.

| Income Bracket | # Families | Median Income |
| 2-Person Families | 1,070 (51.8%) | $75,303 |
| 3-Person Families | 547 (26.5%) | $79,208 |
| 4-Person Families | 327 (15.8%) | $62,250 |
| 5-Person Families | 82 (4.0%) | $76,875 |
| 6-Person Families | 30 (1.5%) | $0 |
| 7+ Person Families | 9 (0.4%) | $0 |
| Total | 2,065 (100.0%) | $76,988 |
Family Income by Number of Earners in Prairie County
The median family income in Prairie County is $76,988, with families comprising 3+ earners (120) having the highest median family income of $95,000, while families with no earners (337) have the lowest median family income of $39,438, accounting for 5.8% and 16.3% of families, respectively.

| Number of Earners | # Families | Median Income |
| No Earners | 337 (16.3%) | $39,438 |
| 1 Earner | 614 (29.7%) | $45,366 |
| 2 Earners | 994 (48.1%) | $94,746 |
| 3+ Earners | 120 (5.8%) | $95,000 |
| Total | 2,065 (100.0%) | $76,988 |
Household Income in Prairie County
Household Income Brackets in Prairie County
With 527 households falling in the category, the $75,000 to $99,999 income range is the most frequent in Prairie County, accounting for 15.9% of all households. In contrast, only 136 households (4.1%) fall into the $150,000 to $199,999 income bracket, making it the least populous group.

| Income Bracket | # Households | % Households |
| Less than $10,000 | 172 | 5.2% |
| $10,000 to $14,999 | 156 | 4.7% |
| $15,000 to $24,999 | 500 | 15.1% |
| $25,000 to $34,999 | 374 | 11.3% |
| $35,000 to $49,999 | 517 | 15.6% |
| $50,000 to $74,999 | 437 | 13.2% |
| $75,000 to $99,999 | 527 | 15.9% |
| $100,000 to $149,999 | 355 | 10.7% |
| $150,000 to $199,999 | 136 | 4.1% |
| $200,000+ | 136 | 4.1% |
Household Income by Householder Age in Prairie County
The median household income in Prairie County is $47,045, with the highest median household income of $70,938 found in the 25 to 44 years age bracket for the primary householder. A total of 727 households (21.9%) fall into this category. Meanwhile, the 15 to 24 years age bracket for the primary householder has the lowest median household income of $0, with 56 households (1.7%) in this group.

| Income Bracket | # Households | Median Income |
| 15 to 24 Years | 56 (1.7%) | $0 |
| 25 to 44 Years | 727 (21.9%) | $70,938 |
| 45 to 64 Years | 1,234 (37.2%) | $58,448 |
| 65+ Years | 1,297 (39.1%) | $28,536 |
| Total | 3,314 (100.0%) | $47,045 |
Poverty in Prairie County
Income Below Poverty by Sex and Age in Prairie County
With 9.7% poverty level for males and 10.2% for females among the residents of Prairie County, 25 to 34 year old males and 5 year old females are the most vulnerable to poverty, with 83 males (18.1%) and 1 females (25.0%) in their respective age groups living below the poverty level.

| Age Bracket | Male | Female |
| Under 5 Years | 22 (10.2%) | 13 (8.5%) |
| 5 Years | 0 (0.0%) | 1 (25.0%) |
| 6 to 11 Years | 26 (9.2%) | 33 (12.4%) |
| 12 to 14 Years | 0 (0.0%) | 9 (10.5%) |
| 15 Years | 0 (0.0%) | 0 (0.0%) |
| 16 and 17 Years | 27 (17.3%) | 17 (10.2%) |
| 18 to 24 Years | 7 (2.3%) | 33 (12.3%) |
| 25 to 34 Years | 83 (18.1%) | 32 (7.9%) |
| 35 to 44 Years | 27 (6.6%) | 50 (11.4%) |
| 45 to 54 Years | 32 (6.2%) | 43 (7.7%) |
| 55 to 64 Years | 92 (15.9%) | 52 (8.4%) |
| 65 to 74 Years | 41 (9.1%) | 61 (12.0%) |
| 75 Years and over | 29 (7.2%) | 67 (13.2%) |
| Total | 386 (9.7%) | 411 (10.2%) |
Income Above Poverty by Sex and Age in Prairie County
According to the poverty statistics in Prairie County, males aged 5 years and females aged 15 years are the age groups that are most secure financially, with 100.0% of males and 100.0% of females in these age groups living above the poverty line.

| Age Bracket | Male | Female |
| Under 5 Years | 194 (89.8%) | 140 (91.5%) |
| 5 Years | 47 (100.0%) | 3 (75.0%) |
| 6 to 11 Years | 256 (90.8%) | 234 (87.6%) |
| 12 to 14 Years | 106 (100.0%) | 77 (89.5%) |
| 15 Years | 48 (100.0%) | 38 (100.0%) |
| 16 and 17 Years | 129 (82.7%) | 150 (89.8%) |
| 18 to 24 Years | 303 (97.7%) | 235 (87.7%) |
| 25 to 34 Years | 375 (81.9%) | 371 (92.1%) |
| 35 to 44 Years | 382 (93.4%) | 390 (88.6%) |
| 45 to 54 Years | 480 (93.8%) | 516 (92.3%) |
| 55 to 64 Years | 486 (84.1%) | 565 (91.6%) |
| 65 to 74 Years | 408 (90.9%) | 446 (88.0%) |
| 75 Years and over | 371 (92.7%) | 440 (86.8%) |
| Total | 3,585 (90.3%) | 3,605 (89.8%) |
Income Below Poverty Among Married-Couple Families in Prairie County
The poverty statistics for married-couple families in Prairie County show that 3.0% or 48 of the total 1,595 families live below the poverty line. Families with 1 or 2 children have the highest poverty rate of 4.6%, comprising of 25 families. On the other hand, families with 3 or 4 children have the lowest poverty rate of 0.0%, which includes 0 families.
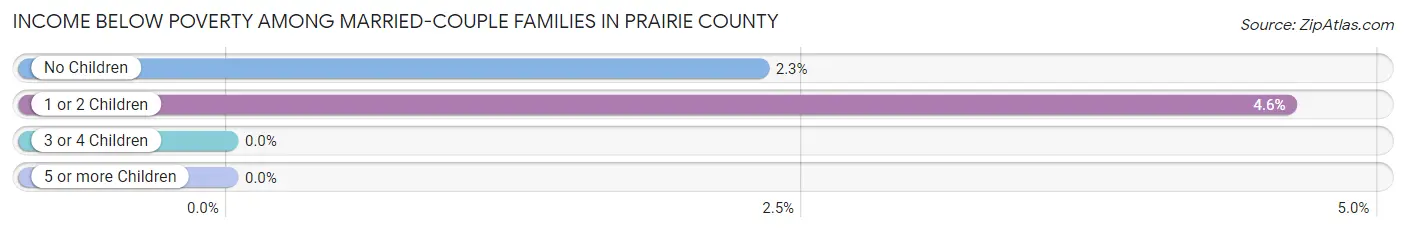
| Children | Above Poverty | Below Poverty |
| No Children | 971 (97.7%) | 23 (2.3%) |
| 1 or 2 Children | 517 (95.4%) | 25 (4.6%) |
| 3 or 4 Children | 59 (100.0%) | 0 (0.0%) |
| 5 or more Children | 0 (0.0%) | 0 (0.0%) |
| Total | 1,547 (97.0%) | 48 (3.0%) |
Income Below Poverty Among Single-Parent Households in Prairie County
According to the poverty data in Prairie County, 7.0% or 7 single-father households and 14.1% or 52 single-mother households are living below the poverty line. Among single-father households, those with no children have the highest poverty rate, with 7 households (10.6%) experiencing poverty. Likewise, among single-mother households, those with 3 or 4 children have the highest poverty rate, with 6 households (60.0%) falling below the poverty line.
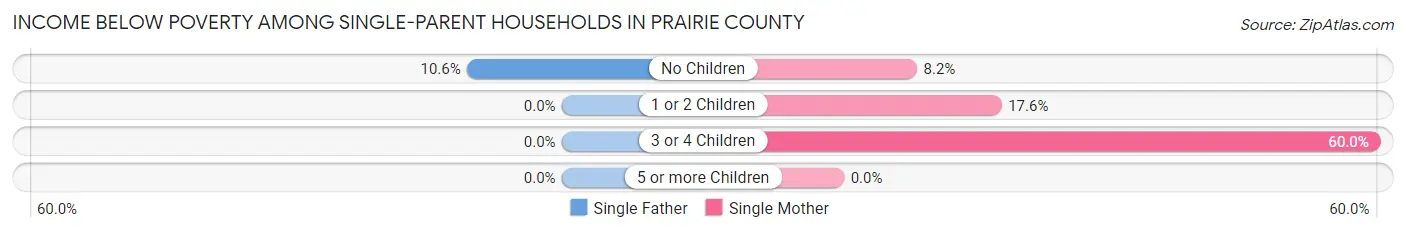
| Children | Single Father | Single Mother |
| No Children | 7 (10.6%) | 15 (8.2%) |
| 1 or 2 Children | 0 (0.0%) | 31 (17.6%) |
| 3 or 4 Children | 0 (0.0%) | 6 (60.0%) |
| 5 or more Children | 0 (0.0%) | 0 (0.0%) |
| Total | 7 (7.0%) | 52 (14.1%) |
Income Below Poverty Among Married-Couple vs Single-Parent Households in Prairie County
The poverty data for Prairie County shows that 48 of the married-couple family households (3.0%) and 59 of the single-parent households (12.6%) are living below the poverty level. Within the married-couple family households, those with 1 or 2 children have the highest poverty rate, with 25 households (4.6%) falling below the poverty line. Among the single-parent households, those with 3 or 4 children have the highest poverty rate, with 6 household (21.4%) living below poverty.

| Children | Married-Couple Families | Single-Parent Households |
| No Children | 23 (2.3%) | 22 (8.8%) |
| 1 or 2 Children | 25 (4.6%) | 31 (16.2%) |
| 3 or 4 Children | 0 (0.0%) | 6 (21.4%) |
| 5 or more Children | 0 (0.0%) | 0 (0.0%) |
| Total | 48 (3.0%) | 59 (12.6%) |
Employment Characteristics in Prairie County
Employment by Class of Employer in Prairie County
Among the 3,540 employed individuals in Prairie County, private company employees (1,982 | 56.0%), not-for-profit organizations (397 | 11.2%), and self-employed (not incorporated) (343 | 9.7%) make up the most common classes of employment.

| Employer Class | # Employees | % Employees |
| Private Company Employees | 1,982 | 56.0% |
| Self-Employed (Incorporated) | 217 | 6.1% |
| Self-Employed (Not Incorporated) | 343 | 9.7% |
| Not-for-profit Organizations | 397 | 11.2% |
| Local Government Employees | 272 | 7.7% |
| State Government Employees | 267 | 7.5% |
| Federal Government Employees | 42 | 1.2% |
| Unpaid Family Workers | 20 | 0.6% |
| Total | 3,540 | 100.0% |
Employment Status by Age in Prairie County
According to the labor force statistics for Prairie County, out of the total population over 16 years of age (6,895), 54.0% or 3,723 individuals are in the labor force, with 4.1% or 153 of them unemployed. The age group with the highest labor force participation rate is 25 to 29 years, with 89.1% or 366 individuals in the labor force. Within the labor force, the 16 to 19 years age range has the highest percentage of unemployed individuals, with 52.1% or 88 of them being unemployed.

| Age Bracket | In Labor Force | Unemployed |
| 16 to 19 Years | 169 (33.6%) | 88 (52.1%) |
| 20 to 24 Years | 237 (59.5%) | 11 (4.6%) |
| 25 to 29 Years | 366 (89.1%) | 26 (7.0%) |
| 30 to 34 Years | 405 (88.2%) | 15 (3.7%) |
| 35 to 44 Years | 646 (75.2%) | 9 (1.4%) |
| 45 to 54 Years | 897 (81.2%) | 0 (0.0%) |
| 55 to 59 Years | 342 (58.9%) | 4 (1.2%) |
| 60 to 64 Years | 326 (51.3%) | 0 (0.0%) |
| 65 to 74 Years | 314 (31.0%) | 0 (0.0%) |
| 75 Years and over | 20 (2.1%) | 0 (0.0%) |
| Total | 3,723 (54.0%) | 153 (4.1%) |
Employment Status by Educational Attainment in Prairie County
According to labor force statistics for Prairie County, 73.6% of individuals (2,982) out of the total population between 25 and 64 years of age (4,051) are in the labor force, with 1.8% or 54 of them being unemployed. The group with the highest labor force participation rate are those with the educational attainment of bachelor's degree or higher, with 92.5% or 725 individuals in the labor force. Within the labor force, individuals with less than high school education have the highest percentage of unemployment, with 6.7% or 13 of them being unemployed.

| Educational Attainment | In Labor Force | Unemployed |
| Less than High School | 194 (42.5%) | 31 (6.7%) |
| High School Diploma | 1,011 (67.2%) | 9 (0.6%) |
| College / Associate Degree | 1,053 (80.6%) | 43 (3.3%) |
| Bachelor's Degree or higher | 725 (92.5%) | 0 (0.0%) |
| Total | 2,982 (73.6%) | 73 (1.8%) |
Employment Occupations by Sex in Prairie County
Management, Business, Science and Arts Occupations
The most common Management, Business, Science and Arts occupations in Prairie County are Management (451 | 12.7%), Community & Social Service (287 | 8.1%), Health Diagnosing & Treating (238 | 6.7%), Education Instruction & Library (235 | 6.6%), and Health Technologists (143 | 4.0%).

Management, Business, Science and Arts Occupations by Sex
Within the Management, Business, Science and Arts occupations in Prairie County, the most male-oriented occupations are Architecture & Engineering (100.0%), Life, Physical & Social Science (100.0%), and Computers, Engineering & Science (92.9%), while the most female-oriented occupations are Computers & Mathematics (100.0%), Arts, Media & Entertainment (100.0%), and Health Technologists (94.4%).

| Occupation | Male | Female |
| Management | 365 (80.9%) | 86 (19.1%) |
| Business & Financial | 14 (15.6%) | 76 (84.4%) |
| Computers, Engineering & Science | 52 (92.9%) | 4 (7.1%) |
| Computers & Mathematics | 0 (0.0%) | 4 (100.0%) |
| Architecture & Engineering | 51 (100.0%) | 0 (0.0%) |
| Life, Physical & Social Science | 1 (100.0%) | 0 (0.0%) |
| Community & Social Service | 18 (6.3%) | 269 (93.7%) |
| Education, Arts & Media | 3 (10.0%) | 27 (90.0%) |
| Legal Services & Support | 0 (0.0%) | 0 (0.0%) |
| Education Instruction & Library | 15 (6.4%) | 220 (93.6%) |
| Arts, Media & Entertainment | 0 (0.0%) | 22 (100.0%) |
| Health Diagnosing & Treating | 52 (21.8%) | 186 (78.1%) |
| Health Technologists | 8 (5.6%) | 135 (94.4%) |
| Total (Category) | 501 (44.7%) | 621 (55.3%) |
| Total (Overall) | 1,807 (50.7%) | 1,754 (49.3%) |
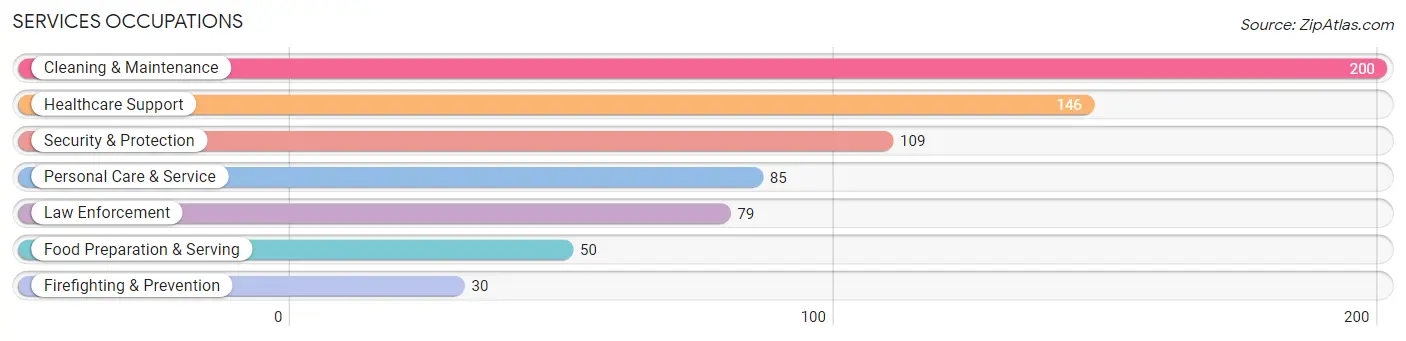
Services Occupations
The most common Services occupations in Prairie County are Cleaning & Maintenance (200 | 5.6%), Healthcare Support (146 | 4.1%), Security & Protection (109 | 3.1%), Personal Care & Service (85 | 2.4%), and Law Enforcement (79 | 2.2%).
Services Occupations by Sex
Within the Services occupations in Prairie County, the most male-oriented occupations are Law Enforcement (100.0%), Security & Protection (80.7%), and Cleaning & Maintenance (68.0%), while the most female-oriented occupations are Healthcare Support (78.1%), Food Preparation & Serving (78.0%), and Firefighting & Prevention (70.0%).
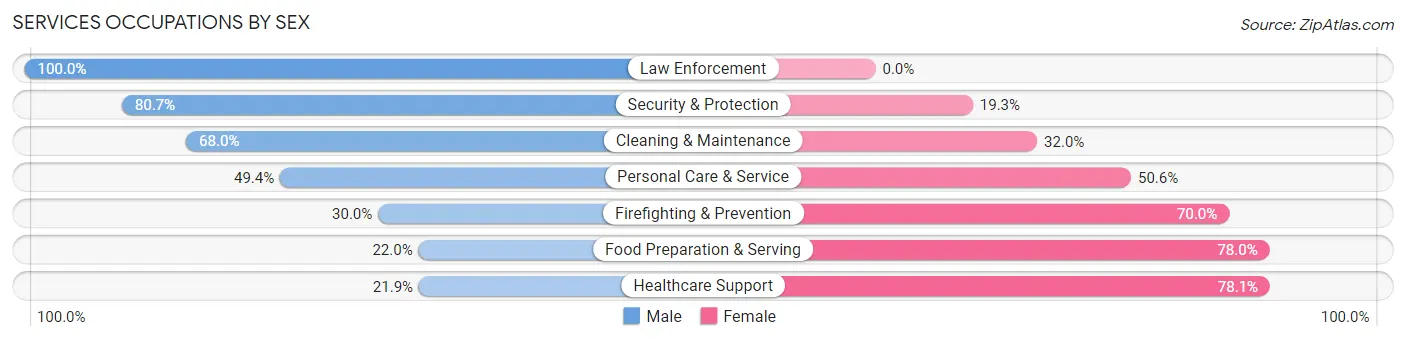
| Occupation | Male | Female |
| Healthcare Support | 32 (21.9%) | 114 (78.1%) |
| Security & Protection | 88 (80.7%) | 21 (19.3%) |
| Firefighting & Prevention | 9 (30.0%) | 21 (70.0%) |
| Law Enforcement | 79 (100.0%) | 0 (0.0%) |
| Food Preparation & Serving | 11 (22.0%) | 39 (78.0%) |
| Cleaning & Maintenance | 136 (68.0%) | 64 (32.0%) |
| Personal Care & Service | 42 (49.4%) | 43 (50.6%) |
| Total (Category) | 309 (52.4%) | 281 (47.6%) |
| Total (Overall) | 1,807 (50.7%) | 1,754 (49.3%) |
Sales and Office Occupations
The most common Sales and Office occupations in Prairie County are Office & Administration (455 | 12.8%), and Sales & Related (377 | 10.6%).

Sales and Office Occupations by Sex

| Occupation | Male | Female |
| Sales & Related | 107 (28.4%) | 270 (71.6%) |
| Office & Administration | 18 (4.0%) | 437 (96.0%) |
| Total (Category) | 125 (15.0%) | 707 (85.0%) |
| Total (Overall) | 1,807 (50.7%) | 1,754 (49.3%) |
Natural Resources, Construction and Maintenance Occupations
The most common Natural Resources, Construction and Maintenance occupations in Prairie County are Construction & Extraction (148 | 4.2%), Installation, Maintenance & Repair (130 | 3.6%), and Farming, Fishing & Forestry (109 | 3.1%).

Natural Resources, Construction and Maintenance Occupations by Sex
| Occupation | Male | Female |
| Farming, Fishing & Forestry | 105 (96.3%) | 4 (3.7%) |
| Construction & Extraction | 148 (100.0%) | 0 (0.0%) |
| Installation, Maintenance & Repair | 130 (100.0%) | 0 (0.0%) |
| Total (Category) | 383 (99.0%) | 4 (1.0%) |
| Total (Overall) | 1,807 (50.7%) | 1,754 (49.3%) |
Production, Transportation and Moving Occupations
The most common Production, Transportation and Moving occupations in Prairie County are Production (302 | 8.5%), Transportation (216 | 6.1%), and Material Moving (112 | 3.2%).
Production, Transportation and Moving Occupations by Sex

| Occupation | Male | Female |
| Production | 254 (84.1%) | 48 (15.9%) |
| Transportation | 167 (77.3%) | 49 (22.7%) |
| Material Moving | 68 (60.7%) | 44 (39.3%) |
| Total (Category) | 489 (77.6%) | 141 (22.4%) |
| Total (Overall) | 1,807 (50.7%) | 1,754 (49.3%) |
Employment Industries by Sex in Prairie County
Employment Industries in Prairie County
The major employment industries in Prairie County include Health Care & Social Assistance (485 | 13.6%), Retail Trade (412 | 11.6%), Manufacturing (379 | 10.6%), Educational Services (353 | 9.9%), and Agriculture, Fishing & Hunting (309 | 8.7%).

Employment Industries by Sex in Prairie County
The Prairie County industries that see more men than women are Construction (95.9%), Wholesale Trade (95.8%), and Agriculture, Fishing & Hunting (90.6%), whereas the industries that tend to have a higher number of women are Real Estate, Rental & Leasing (100.0%), Enterprise Management (100.0%), and Educational Services (89.2%).
| Industry | Male | Female |
| Agriculture, Fishing & Hunting | 280 (90.6%) | 29 (9.4%) |
| Mining, Quarrying, & Extraction | 0 (0.0%) | 0 (0.0%) |
| Construction | 279 (95.9%) | 12 (4.1%) |
| Manufacturing | 313 (82.6%) | 66 (17.4%) |
| Wholesale Trade | 92 (95.8%) | 4 (4.2%) |
| Retail Trade | 108 (26.2%) | 304 (73.8%) |
| Transportation & Warehousing | 162 (75.3%) | 53 (24.6%) |
| Utilities | 34 (89.5%) | 4 (10.5%) |
| Information | 13 (59.1%) | 9 (40.9%) |
| Finance & Insurance | 38 (23.7%) | 122 (76.2%) |
| Real Estate, Rental & Leasing | 0 (0.0%) | 51 (100.0%) |
| Professional & Scientific | 36 (23.8%) | 115 (76.2%) |
| Enterprise Management | 0 (0.0%) | 7 (100.0%) |
| Administrative & Support | 83 (79.0%) | 22 (20.9%) |
| Educational Services | 38 (10.8%) | 315 (89.2%) |
| Health Care & Social Assistance | 82 (16.9%) | 403 (83.1%) |
| Arts, Entertainment & Recreation | 2 (14.3%) | 12 (85.7%) |
| Accommodation & Food Services | 27 (42.2%) | 37 (57.8%) |
| Public Administration | 101 (47.0%) | 114 (53.0%) |
| Total | 1,807 (50.7%) | 1,754 (49.3%) |
Education in Prairie County
School Enrollment in Prairie County
The most common levels of schooling among the 1,519 students in Prairie County are high school (411 | 27.1%), middle school (389 | 25.6%), and elementary school (349 | 23.0%).

| School Level | # Students | % Students |
| Nursery / Preschool | 89 | 5.9% |
| Kindergarten | 31 | 2.0% |
| Elementary School | 349 | 23.0% |
| Middle School | 389 | 25.6% |
| High School | 411 | 27.1% |
| College / Undergraduate | 192 | 12.6% |
| Graduate / Professional | 58 | 3.8% |
| Total | 1,519 | 100.0% |
School Enrollment by Age by Funding Source in Prairie County
Out of a total of 1,519 students who are enrolled in schools in Prairie County, 96 (6.3%) attend a private institution, while the remaining 1,423 (93.7%) are enrolled in public schools. The age group of 15 to 17 year olds has the highest likelihood of being enrolled in private schools, with 46 (12.4% in the age bracket) enrolled. Conversely, the age group of 3 to 4 year olds has the lowest likelihood of being enrolled in a private school, with 47 (100.0% in the age bracket) attending a public institution.

| Age Bracket | Public School | Private School |
| 3 to 4 Year Olds | 47 (100.0%) | 0 (0.0%) |
| 5 to 9 Year Old | 352 (91.4%) | 33 (8.6%) |
| 10 to 14 Year Olds | 435 (99.1%) | 4 (0.9%) |
| 15 to 17 Year Olds | 325 (87.6%) | 46 (12.4%) |
| 18 to 19 Year Olds | 94 (95.0%) | 5 (5.1%) |
| 20 to 24 Year Olds | 76 (90.5%) | 8 (9.5%) |
| 25 to 34 Year Olds | 26 (100.0%) | 0 (0.0%) |
| 35 Years and over | 68 (100.0%) | 0 (0.0%) |
| Total | 1,423 (93.7%) | 96 (6.3%) |
Educational Attainment by Field of Study in Prairie County
Business (275 | 27.8%), education (257 | 26.0%), science & technology (111 | 11.2%), bio, nature & agricultural (71 | 7.2%), and arts & humanities (63 | 6.4%) are the most common fields of study among 990 individuals in Prairie County who have obtained a bachelor's degree or higher.

| Field of Study | # Graduates | % Graduates |
| Computers & Mathematics | 36 | 3.6% |
| Bio, Nature & Agricultural | 71 | 7.2% |
| Physical & Health Sciences | 0 | 0.0% |
| Psychology | 27 | 2.7% |
| Social Sciences | 57 | 5.8% |
| Engineering | 20 | 2.0% |
| Multidisciplinary Studies | 14 | 1.4% |
| Science & Technology | 111 | 11.2% |
| Business | 275 | 27.8% |
| Education | 257 | 26.0% |
| Literature & Languages | 15 | 1.5% |
| Liberal Arts & History | 26 | 2.6% |
| Visual & Performing Arts | 2 | 0.2% |
| Communications | 16 | 1.6% |
| Arts & Humanities | 63 | 6.4% |
| Total | 990 | 100.0% |
Transportation & Commute in Prairie County
Vehicle Availability by Sex in Prairie County
The most prevalent vehicle ownership categories in Prairie County are males with 2 vehicles (812, accounting for 45.1%) and females with 2 vehicles (682, making up 46.7%).

| Vehicles Available | Male | Female |
| No Vehicle | 47 (2.6%) | 0 (0.0%) |
| 1 Vehicle | 186 (10.3%) | 403 (23.2%) |
| 2 Vehicles | 812 (45.1%) | 682 (39.2%) |
| 3 Vehicles | 280 (15.5%) | 345 (19.9%) |
| 4 Vehicles | 245 (13.6%) | 214 (12.3%) |
| 5 or more Vehicles | 232 (12.9%) | 94 (5.4%) |
| Total | 1,802 (100.0%) | 1,738 (100.0%) |
Commute Time in Prairie County
The most frequently occuring commute durations in Prairie County are 45 to 59 minutes (472 commuters, 14.4%), 30 to 34 minutes (468 commuters, 14.3%), and 10 to 14 minutes (401 commuters, 12.2%).

| Commute Time | # Commuters | % Commuters |
| Less than 5 Minutes | 246 | 7.5% |
| 5 to 9 Minutes | 393 | 12.0% |
| 10 to 14 Minutes | 401 | 12.2% |
| 15 to 19 Minutes | 298 | 9.1% |
| 20 to 24 Minutes | 382 | 11.7% |
| 25 to 29 Minutes | 136 | 4.2% |
| 30 to 34 Minutes | 468 | 14.3% |
| 35 to 39 Minutes | 78 | 2.4% |
| 40 to 44 Minutes | 98 | 3.0% |
| 45 to 59 Minutes | 472 | 14.4% |
| 60 to 89 Minutes | 232 | 7.1% |
| 90 or more Minutes | 76 | 2.3% |
Commute Time by Sex in Prairie County
The most common commute times in Prairie County are 30 to 34 minutes (246 commuters, 15.2%) for males and 45 to 59 minutes (287 commuters, 17.3%) for females.

| Commute Time | Male | Female |
| Less than 5 Minutes | 132 (8.2%) | 114 (6.9%) |
| 5 to 9 Minutes | 226 (14.0%) | 167 (10.1%) |
| 10 to 14 Minutes | 220 (13.6%) | 181 (10.9%) |
| 15 to 19 Minutes | 80 (4.9%) | 218 (13.1%) |
| 20 to 24 Minutes | 96 (5.9%) | 286 (17.2%) |
| 25 to 29 Minutes | 66 (4.1%) | 70 (4.2%) |
| 30 to 34 Minutes | 246 (15.2%) | 222 (13.4%) |
| 35 to 39 Minutes | 49 (3.0%) | 29 (1.8%) |
| 40 to 44 Minutes | 86 (5.3%) | 12 (0.7%) |
| 45 to 59 Minutes | 185 (11.4%) | 287 (17.3%) |
| 60 to 89 Minutes | 192 (11.9%) | 40 (2.4%) |
| 90 or more Minutes | 41 (2.5%) | 35 (2.1%) |
Time of Departure to Work by Sex in Prairie County
The most frequent times of departure to work in Prairie County are 6:30 AM to 6:59 AM (373, 23.0%) for males and 7:30 AM to 7:59 AM (422, 25.4%) for females.

| Time of Departure | Male | Female |
| 12:00 AM to 4:59 AM | 33 (2.0%) | 225 (13.6%) |
| 5:00 AM to 5:29 AM | 69 (4.3%) | 14 (0.8%) |
| 5:30 AM to 5:59 AM | 151 (9.3%) | 181 (10.9%) |
| 6:00 AM to 6:29 AM | 234 (14.4%) | 73 (4.4%) |
| 6:30 AM to 6:59 AM | 373 (23.0%) | 203 (12.2%) |
| 7:00 AM to 7:29 AM | 336 (20.7%) | 281 (16.9%) |
| 7:30 AM to 7:59 AM | 115 (7.1%) | 422 (25.4%) |
| 8:00 AM to 8:29 AM | 115 (7.1%) | 72 (4.3%) |
| 8:30 AM to 8:59 AM | 15 (0.9%) | 10 (0.6%) |
| 9:00 AM to 9:59 AM | 47 (2.9%) | 80 (4.8%) |
| 10:00 AM to 10:59 AM | 0 (0.0%) | 6 (0.4%) |
| 11:00 AM to 11:59 AM | 0 (0.0%) | 4 (0.2%) |
| 12:00 PM to 3:59 PM | 46 (2.8%) | 66 (4.0%) |
| 4:00 PM to 11:59 PM | 85 (5.2%) | 24 (1.4%) |
| Total | 1,619 (100.0%) | 1,661 (100.0%) |
Housing Occupancy in Prairie County
Occupancy by Ownership in Prairie County
Of the total 3,314 dwellings in Prairie County, owner-occupied units account for 2,562 (77.3%), while renter-occupied units make up 752 (22.7%).

| Occupancy | # Housing Units | % Housing Units |
| Owner Occupied Housing Units | 2,562 | 77.3% |
| Renter-Occupied Housing Units | 752 | 22.7% |
| Total Occupied Housing Units | 3,314 | 100.0% |
Occupancy by Household Size in Prairie County

| Household Size | # Housing Units | % Housing Units |
| 1-Person Household | 1,128 | 34.0% |
| 2-Person Household | 1,132 | 34.2% |
| 3-Person Household | 545 | 16.5% |
| 4+ Person Household | 509 | 15.4% |
| Total Housing Units | 3,314 | 100.0% |
Occupancy by Ownership by Household Size in Prairie County

| Household Size | Owner-occupied | Renter-occupied |
| 1-Person Household | 801 (71.0%) | 327 (29.0%) |
| 2-Person Household | 901 (79.6%) | 231 (20.4%) |
| 3-Person Household | 438 (80.4%) | 107 (19.6%) |
| 4+ Person Household | 422 (82.9%) | 87 (17.1%) |
| Total Housing Units | 2,562 (77.3%) | 752 (22.7%) |
Occupancy by Educational Attainment in Prairie County

| Household Size | Owner-occupied | Renter-occupied |
| Less than High School | 389 (76.6%) | 119 (23.4%) |
| High School Diploma | 857 (70.3%) | 362 (29.7%) |
| College/Associate Degree | 874 (81.2%) | 202 (18.8%) |
| Bachelor's Degree or higher | 442 (86.5%) | 69 (13.5%) |
Occupancy by Age of Householder in Prairie County
| Age Bracket | # Households | % Households |
| Under 35 Years | 418 | 12.6% |
| 35 to 44 Years | 365 | 11.0% |
| 45 to 54 Years | 575 | 17.3% |
| 55 to 64 Years | 659 | 19.9% |
| 65 to 74 Years | 554 | 16.7% |
| 75 to 84 Years | 570 | 17.2% |
| 85 Years and Over | 173 | 5.2% |
| Total | 3,314 | 100.0% |
Housing Finances in Prairie County
Median Income by Occupancy in Prairie County

| Occupancy Type | # Households | Median Income |
| Owner-Occupied | 2,562 (77.3%) | $58,942 |
| Renter-Occupied | 752 (22.7%) | $28,697 |
| Average | 3,314 (100.0%) | $47,045 |
Occupancy by Householder Income Bracket in Prairie County

| Income Bracket | Owner-occupied | Renter-occupied |
| Less than $5,000 | 46 (1.8%) | 30 (4.0%) |
| $5,000 to $9,999 | 50 (1.9%) | 46 (6.1%) |
| $10,000 to $14,999 | 89 (3.5%) | 68 (9.0%) |
| $15,000 to $19,999 | 145 (5.7%) | 55 (7.3%) |
| $20,000 to $24,999 | 211 (8.2%) | 90 (12.0%) |
| $25,000 to $34,999 | 190 (7.4%) | 185 (24.6%) |
| $35,000 to $49,999 | 416 (16.2%) | 101 (13.4%) |
| $50,000 to $74,999 | 365 (14.2%) | 73 (9.7%) |
| $75,000 to $99,999 | 463 (18.1%) | 65 (8.6%) |
| $100,000 to $149,999 | 342 (13.4%) | 14 (1.9%) |
| $150,000 or more | 245 (9.6%) | 25 (3.3%) |
| Total | 2,562 (100.0%) | 752 (100.0%) |
Monthly Housing Cost Tiers in Prairie County

| Monthly Cost | Owner-occupied | Renter-occupied |
| Less than $300 | 434 (16.9%) | 82 (10.9%) |
| $300 to $499 | 629 (24.5%) | 76 (10.1%) |
| $500 to $799 | 533 (20.8%) | 200 (26.6%) |
| $800 to $999 | 376 (14.7%) | 117 (15.6%) |
| $1,000 to $1,499 | 354 (13.8%) | 72 (9.6%) |
| $1,500 to $1,999 | 194 (7.6%) | 0 (0.0%) |
| $2,000 to $2,499 | 27 (1.1%) | 0 (0.0%) |
| $2,500 to $2,999 | 5 (0.2%) | 0 (0.0%) |
| $3,000 or more | 10 (0.4%) | 0 (0.0%) |
| Total | 2,562 (100.0%) | 752 (100.0%) |
Physical Housing Characteristics in Prairie County
Housing Structures in Prairie County

| Structure Type | # Housing Units | % Housing Units |
| Single Unit, Detached | 2,396 | 72.3% |
| Single Unit, Attached | 9 | 0.3% |
| 2 Unit Apartments | 92 | 2.8% |
| 3 or 4 Unit Apartments | 58 | 1.8% |
| 5 to 9 Unit Apartments | 16 | 0.5% |
| 10 or more Apartments | 86 | 2.6% |
| Mobile Home / Other | 657 | 19.8% |
| Total | 3,314 | 100.0% |
Housing Structures by Occupancy in Prairie County

| Structure Type | Owner-occupied | Renter-occupied |
| Single Unit, Detached | 2,070 (86.4%) | 326 (13.6%) |
| Single Unit, Attached | 7 (77.8%) | 2 (22.2%) |
| 2 Unit Apartments | 0 (0.0%) | 92 (100.0%) |
| 3 or 4 Unit Apartments | 0 (0.0%) | 58 (100.0%) |
| 5 to 9 Unit Apartments | 0 (0.0%) | 16 (100.0%) |
| 10 or more Apartments | 0 (0.0%) | 86 (100.0%) |
| Mobile Home / Other | 485 (73.8%) | 172 (26.2%) |
| Total | 2,562 (77.3%) | 752 (22.7%) |
Housing Structures by Number of Rooms in Prairie County
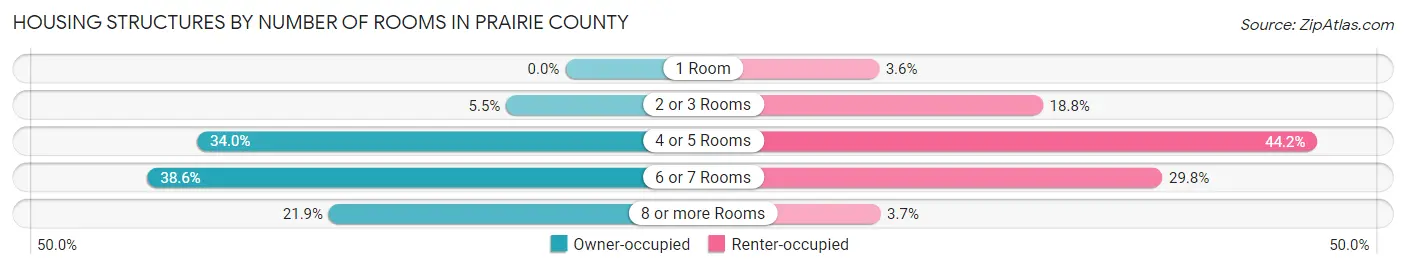
| Number of Rooms | Owner-occupied | Renter-occupied |
| 1 Room | 0 (0.0%) | 27 (3.6%) |
| 2 or 3 Rooms | 140 (5.5%) | 141 (18.8%) |
| 4 or 5 Rooms | 872 (34.0%) | 332 (44.2%) |
| 6 or 7 Rooms | 990 (38.6%) | 224 (29.8%) |
| 8 or more Rooms | 560 (21.9%) | 28 (3.7%) |
| Total | 2,562 (100.0%) | 752 (100.0%) |
Housing Structure by Heating Type in Prairie County
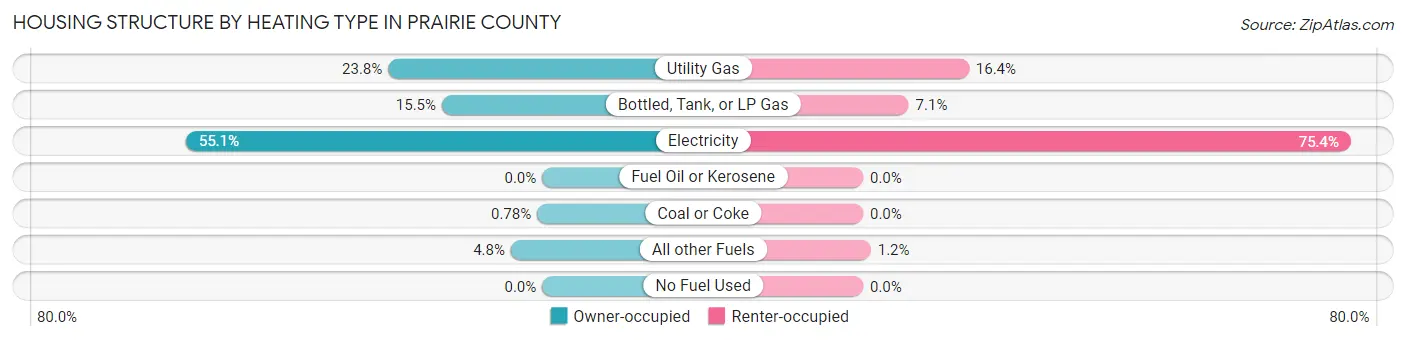
| Heating Type | Owner-occupied | Renter-occupied |
| Utility Gas | 610 (23.8%) | 123 (16.4%) |
| Bottled, Tank, or LP Gas | 397 (15.5%) | 53 (7.0%) |
| Electricity | 1,411 (55.1%) | 567 (75.4%) |
| Fuel Oil or Kerosene | 0 (0.0%) | 0 (0.0%) |
| Coal or Coke | 20 (0.8%) | 0 (0.0%) |
| All other Fuels | 124 (4.8%) | 9 (1.2%) |
| No Fuel Used | 0 (0.0%) | 0 (0.0%) |
| Total | 2,562 (100.0%) | 752 (100.0%) |
Household Vehicle Usage in Prairie County

| Vehicles per Household | Owner-occupied | Renter-occupied |
| No Vehicle | 65 (2.5%) | 88 (11.7%) |
| 1 Vehicle | 711 (27.8%) | 437 (58.1%) |
| 2 Vehicles | 1,052 (41.1%) | 123 (16.4%) |
| 3 or more Vehicles | 734 (28.6%) | 104 (13.8%) |
| Total | 2,562 (100.0%) | 752 (100.0%) |
Real Estate & Mortgages in Prairie County
Real Estate and Mortgage Overview in Prairie County
| Characteristic | Without Mortgage | With Mortgage |
| Housing Units | 1,467 | 1,095 |
| Median Property Value | $68,300 | $113,300 |
| Median Household Income | $42,992 | $122 |
| Monthly Housing Costs | $373 | $10 |
| Real Estate Taxes | $466 | $120 |
Property Value by Mortgage Status in Prairie County
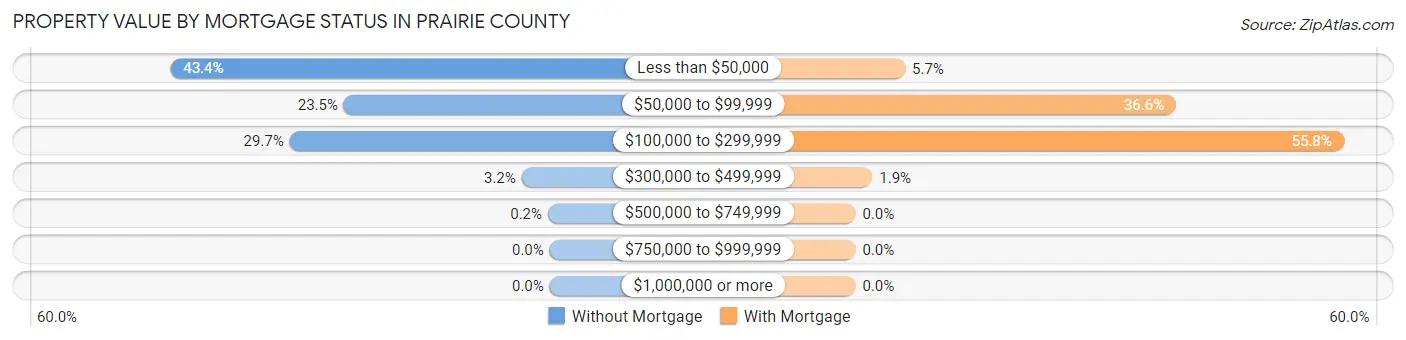
| Property Value | Without Mortgage | With Mortgage |
| Less than $50,000 | 636 (43.3%) | 62 (5.7%) |
| $50,000 to $99,999 | 345 (23.5%) | 401 (36.6%) |
| $100,000 to $299,999 | 436 (29.7%) | 611 (55.8%) |
| $300,000 to $499,999 | 47 (3.2%) | 21 (1.9%) |
| $500,000 to $749,999 | 3 (0.2%) | 0 (0.0%) |
| $750,000 to $999,999 | 0 (0.0%) | 0 (0.0%) |
| $1,000,000 or more | 0 (0.0%) | 0 (0.0%) |
| Total | 1,467 (100.0%) | 1,095 (100.0%) |
Household Income by Mortgage Status in Prairie County

| Household Income | Without Mortgage | With Mortgage |
| Less than $10,000 | 71 (4.8%) | 23 (2.1%) |
| $10,000 to $24,999 | 398 (27.1%) | 25 (2.3%) |
| $25,000 to $34,999 | 122 (8.3%) | 47 (4.3%) |
| $35,000 to $49,999 | 205 (14.0%) | 68 (6.2%) |
| $50,000 to $74,999 | 209 (14.2%) | 211 (19.3%) |
| $75,000 to $99,999 | 187 (12.8%) | 156 (14.2%) |
| $100,000 to $149,999 | 152 (10.4%) | 276 (25.2%) |
| $150,000 or more | 123 (8.4%) | 190 (17.3%) |
| Total | 1,467 (100.0%) | 1,095 (100.0%) |
Property Value to Household Income Ratio in Prairie County

| Value-to-Income Ratio | Without Mortgage | With Mortgage |
| Less than 2.0x | 824 (56.2%) | 77,672 (7,093.3%) |
| 2.0x to 2.9x | 343 (23.4%) | 695 (63.5%) |
| 3.0x to 3.9x | 98 (6.7%) | 235 (21.5%) |
| 4.0x or more | 183 (12.5%) | 64 (5.8%) |
| Total | 1,467 (100.0%) | 1,095 (100.0%) |
Real Estate Taxes by Mortgage Status in Prairie County

| Property Taxes | Without Mortgage | With Mortgage |
| Less than $800 | 874 (59.6%) | 8 (0.7%) |
| $800 to $1,499 | 239 (16.3%) | 671 (61.3%) |
| $800 to $1,499 | 123 (8.4%) | 243 (22.2%) |
| Total | 1,467 (100.0%) | 1,095 (100.0%) |
Health & Disability in Prairie County
Health Insurance Coverage by Age in Prairie County

| Age Bracket | With Coverage | Without Coverage |
| Under 6 Years | 438 (96.3%) | 17 (3.7%) |
| 6 to 18 Years | 1,240 (96.7%) | 43 (3.4%) |
| 19 to 25 Years | 454 (86.6%) | 70 (13.4%) |
| 26 to 34 Years | 649 (79.8%) | 164 (20.2%) |
| 35 to 44 Years | 766 (90.2%) | 83 (9.8%) |
| 45 to 54 Years | 989 (92.3%) | 82 (7.7%) |
| 55 to 64 Years | 1,074 (89.9%) | 121 (10.1%) |
| 65 to 74 Years | 956 (100.0%) | 0 (0.0%) |
| 75 Years and older | 907 (100.0%) | 0 (0.0%) |
| Total | 7,473 (92.8%) | 580 (7.2%) |
Health Insurance Coverage by Citizenship Status in Prairie County
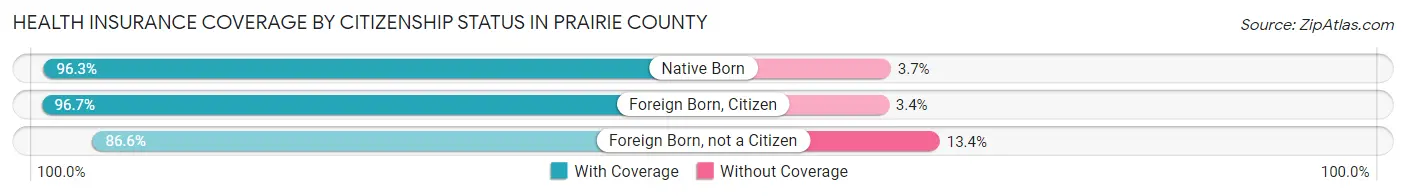
| Citizenship Status | With Coverage | Without Coverage |
| Native Born | 438 (96.3%) | 17 (3.7%) |
| Foreign Born, Citizen | 1,240 (96.7%) | 43 (3.4%) |
| Foreign Born, not a Citizen | 454 (86.6%) | 70 (13.4%) |
Health Insurance Coverage by Household Income in Prairie County

| Household Income | With Coverage | Without Coverage |
| Under $25,000 | 1,048 (87.6%) | 148 (12.4%) |
| $25,000 to $49,999 | 1,920 (94.0%) | 122 (6.0%) |
| $50,000 to $74,999 | 1,119 (88.0%) | 153 (12.0%) |
| $75,000 to $99,999 | 1,533 (93.5%) | 107 (6.5%) |
| $100,000 and over | 1,853 (97.4%) | 50 (2.6%) |
Public vs Private Health Insurance Coverage by Age in Prairie County

| Age Bracket | Public Insurance | Private Insurance |
| Under 6 | 298 (65.5%) | 144 (31.7%) |
| 6 to 18 Years | 583 (45.4%) | 688 (53.6%) |
| 19 to 25 Years | 133 (25.4%) | 344 (65.6%) |
| 25 to 34 Years | 133 (16.4%) | 519 (63.8%) |
| 35 to 44 Years | 174 (20.5%) | 593 (69.9%) |
| 45 to 54 Years | 154 (14.4%) | 883 (82.5%) |
| 55 to 64 Years | 364 (30.5%) | 807 (67.5%) |
| 65 to 74 Years | 951 (99.5%) | 440 (46.0%) |
| 75 Years and over | 907 (100.0%) | 372 (41.0%) |
| Total | 3,697 (45.9%) | 4,790 (59.5%) |
Disability Status by Sex by Age in Prairie County

| Age Bracket | Male | Female |
| Under 5 Years | 0 (0.0%) | 0 (0.0%) |
| 5 to 17 Years | 71 (10.5%) | 77 (13.6%) |
| 18 to 34 Years | 15 (2.0%) | 51 (7.6%) |
| 35 to 64 Years | 328 (21.9%) | 367 (22.7%) |
| 65 to 74 Years | 181 (40.3%) | 248 (48.9%) |
| 75 Years and over | 255 (63.7%) | 283 (55.8%) |
Disability Class by Sex by Age in Prairie County
Disability Class: Hearing Difficulty
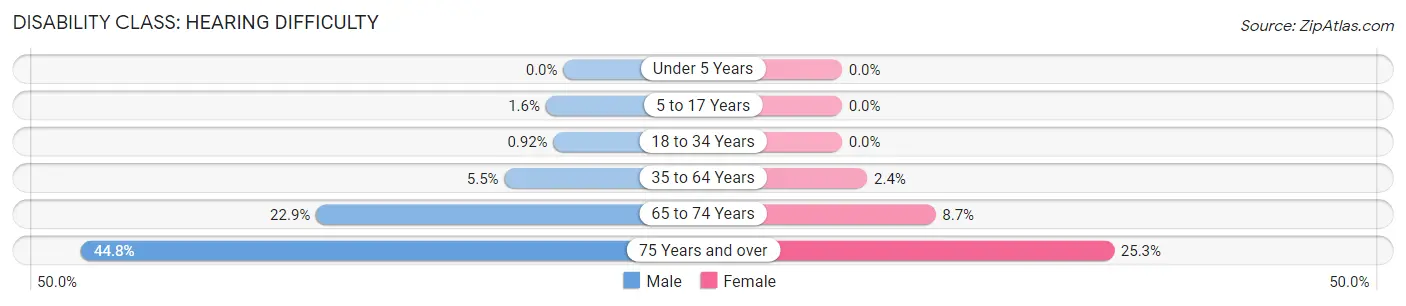
| Age Bracket | Male | Female |
| Under 5 Years | 0 (0.0%) | 0 (0.0%) |
| 5 to 17 Years | 11 (1.6%) | 0 (0.0%) |
| 18 to 34 Years | 7 (0.9%) | 0 (0.0%) |
| 35 to 64 Years | 82 (5.5%) | 38 (2.4%) |
| 65 to 74 Years | 103 (22.9%) | 44 (8.7%) |
| 75 Years and over | 179 (44.8%) | 128 (25.3%) |
Disability Class: Vision Difficulty

| Age Bracket | Male | Female |
| Under 5 Years | 0 (0.0%) | 0 (0.0%) |
| 5 to 17 Years | 55 (8.2%) | 8 (1.4%) |
| 18 to 34 Years | 4 (0.5%) | 18 (2.7%) |
| 35 to 64 Years | 36 (2.4%) | 43 (2.7%) |
| 65 to 74 Years | 4 (0.9%) | 51 (10.1%) |
| 75 Years and over | 51 (12.8%) | 87 (17.2%) |
Disability Class: Cognitive Difficulty

| Age Bracket | Male | Female |
| 5 to 17 Years | 27 (4.0%) | 69 (12.2%) |
| 18 to 34 Years | 4 (0.5%) | 15 (2.2%) |
| 35 to 64 Years | 153 (10.2%) | 99 (6.1%) |
| 65 to 74 Years | 6 (1.3%) | 10 (2.0%) |
| 75 Years and over | 82 (20.5%) | 142 (28.0%) |
Disability Class: Ambulatory Difficulty

| Age Bracket | Male | Female |
| 5 to 17 Years | 11 (1.6%) | 15 (2.6%) |
| 18 to 34 Years | 0 (0.0%) | 18 (2.7%) |
| 35 to 64 Years | 168 (11.2%) | 300 (18.6%) |
| 65 to 74 Years | 64 (14.2%) | 199 (39.3%) |
| 75 Years and over | 187 (46.8%) | 211 (41.6%) |
Disability Class: Self-Care Difficulty

| Age Bracket | Male | Female |
| 5 to 17 Years | 11 (1.6%) | 0 (0.0%) |
| 18 to 34 Years | 0 (0.0%) | 0 (0.0%) |
| 35 to 64 Years | 18 (1.2%) | 57 (3.5%) |
| 65 to 74 Years | 0 (0.0%) | 8 (1.6%) |
| 75 Years and over | 85 (21.2%) | 164 (32.4%) |
Technology Access in Prairie County
Computing Device Access in Prairie County
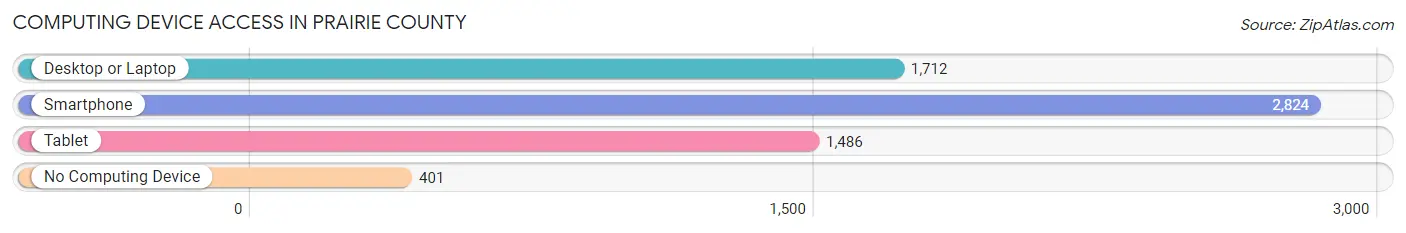
| Device Type | # Households | % Households |
| Desktop or Laptop | 1,712 | 51.7% |
| Smartphone | 2,824 | 85.2% |
| Tablet | 1,486 | 44.8% |
| No Computing Device | 401 | 12.1% |
| Total | 3,314 | 100.0% |
Internet Access in Prairie County
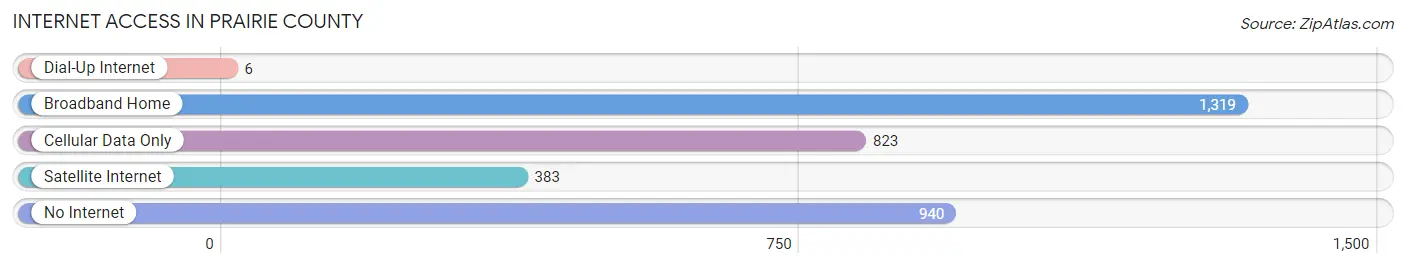
| Internet Type | # Households | % Households |
| Dial-Up Internet | 6 | 0.2% |
| Broadband Home | 1,319 | 39.8% |
| Cellular Data Only | 823 | 24.8% |
| Satellite Internet | 383 | 11.6% |
| No Internet | 940 | 28.4% |
| Total | 3,314 | 100.0% |
Prairie County Summary
Prairie County is located in the Arkansas Delta region of the state of Arkansas. It is bordered by Monroe County to the north, Woodruff County to the east, Arkansas County to the south, and Lonoke County to the west. The county seat is Des Arc, and the largest city is DeValls Bluff. The county has a total area of 645 square miles, of which 644 square miles is land and 1 square mile is water.
History
Prairie County was established in 1846 and was named for the prairie-like landscape of the area. The county was originally part of Arkansas County, but was later divided into its own county. The first settlers in the area were French and Spanish traders who established trading posts along the White River. The first permanent settlement in the county was established in 1820 by William and Mary Moore.
The county was home to several Civil War battles, including the Battle of DeValls Bluff in 1863. The county was also the site of the Battle of Cotton Plant in 1864.
Geography
Prairie County is located in the Arkansas Delta region of the state. The terrain is mostly flat, with some rolling hills in the northern part of the county. The White River forms the western border of the county, and the Cache River forms the eastern border. The county is home to several lakes, including Lake Des Arc, Lake Hogue, and Lake Charles.
The climate in Prairie County is humid subtropical, with hot, humid summers and mild winters. The average annual temperature is 64°F, and the average annual precipitation is 48 inches.
Economy
Agriculture is the main economic activity in Prairie County. The county is home to several large farms, and the main crops grown in the area are cotton, soybeans, corn, and rice. The county is also home to several timber companies, and the timber industry is an important part of the local economy.
The county is home to several manufacturing companies, including a paper mill, a furniture factory, and a plastics factory. The county is also home to several retail stores, restaurants, and other businesses.
Demographics
As of the 2010 census, the population of Prairie County was 17,919. The racial makeup of the county was 79.3% White, 18.2% Black or African American, 0.3% Native American, 0.2% Asian, 0.1% Pacific Islander, 0.7% from other races, and 1.4% from two or more races. Hispanic or Latino of any race were 1.9% of the population.
The median household income in Prairie County was $35,945, and the median family income was $43,945. The per capita income was $17,945. About 17.3% of the population was below the poverty line.
Common Questions
What is the Total Population of Prairie County?
Total Population of Prairie County is 8,217.
What is the Total Male Population of Prairie County?
Total Male Population of Prairie County is 4,128.
What is the Total Female Population of Prairie County?
Total Female Population of Prairie County is 4,089.
What is the Ratio of Males per 100 Females in Prairie County?
There are 100.95 Males per 100 Females in Prairie County.
What is the Ratio of Females per 100 Males in Prairie County?
There are 99.06 Females per 100 Males in Prairie County.
What is the Median Population Age in Prairie County?
Median Population Age in Prairie County is 46.5 Years.
What is the Average Family Size in Prairie County
Average Family Size in Prairie County is 3.1 People.
What is the Average Household Size in Prairie County
Average Household Size in Prairie County is 2.4 People.
What is Per Capita Income in Prairie County?
Per Capita income in Prairie County is $29,018.
What is the Median Family Income in Prairie County?
Median Family Income in Prairie County is $76,988.
What is the Median Household income in Prairie County?
Median Household Income in Prairie County is $47,045.
What is Income or Wage Gap in Prairie County?
Income or Wage Gap in Prairie County is 31.1%.
Women in Prairie County earn 68.9 cents for every dollar earned by a man.
What is Inequality or Gini Index in Prairie County?
Inequality or Gini Index in Prairie County is 0.44.
How Large is the Labor Force in Prairie County?
There are 3,723 People in the Labor Forcein in Prairie County.
What is the Percentage of People in the Labor Force in Prairie County?
54.0% of People are in the Labor Force in Prairie County.
What is the Unemployment Rate in Prairie County?
Unemployment Rate in Prairie County is 4.1%.