Phillips County, AR
Phillips County Map
Phillips County Overview
16,373
TOTAL POPULATION
7,600
MALE POPULATION
8,773
FEMALE POPULATION
86.63
MALES / 100 FEMALES
115.43
FEMALES / 100 MALES
39.7
MEDIAN AGE
3.5
AVG FAMILY SIZE
2.6
AVG HOUSEHOLD SIZE
$22,644
PER CAPITA INCOME
$50,951
AVG FAMILY INCOME
$37,458
AVG HOUSEHOLD INCOME
38.0%
WAGE / INCOME GAP [ % ]
62.0¢/ $1
WAGE / INCOME GAP [ $ ]
$14,026
FAMILY INCOME DEFICIT
0.50
INEQUALITY / GINI INDEX
6,564
LABOR FORCE [ PEOPLE ]
52.6%
PERCENT IN LABOR FORCE
13.3%
UNEMPLOYMENT RATE
Phillips County Area Codes
Race in Phillips County
The most populous races in Phillips County are Black / African American (10,189 | 62.2%), White / Caucasian (5,718 | 34.9%), and Hispanic or Latino (354 | 2.2%).

| Race | # Population | % Population |
| Asian | 93 | 0.6% |
| Black / African American | 10,189 | 62.2% |
| Hawaiian / Pacific | 0 | 0.0% |
| Hispanic or Latino | 354 | 2.2% |
| Native / Alaskan | 4 | 0.0% |
| White / Caucasian | 5,718 | 34.9% |
| Two or more Races | 325 | 2.0% |
| Some other Race | 44 | 0.3% |
| Total | 16,373 | 100.0% |
Ancestry in Phillips County
The most populous ancestries reported in Phillips County are English (863 | 5.3%), Irish (725 | 4.4%), German (565 | 3.5%), American (349 | 2.1%), and Subsaharan African (223 | 1.4%), together accounting for 16.6% of all Phillips County residents.

| Ancestry | # Population | % Population |
| African | 202 | 1.2% |
| American | 349 | 2.1% |
| Arab | 3 | 0.0% |
| Brazilian | 10 | 0.1% |
| British | 41 | 0.3% |
| Cherokee | 49 | 0.3% |
| Creek | 2 | 0.0% |
| Czech | 7 | 0.0% |
| Danish | 9 | 0.1% |
| Dutch | 83 | 0.5% |
| English | 863 | 5.3% |
| European | 27 | 0.2% |
| French | 31 | 0.2% |
| German | 565 | 3.5% |
| Greek | 12 | 0.1% |
| Irish | 725 | 4.4% |
| Italian | 150 | 0.9% |
| Korean | 108 | 0.7% |
| Mexican | 208 | 1.3% |
| Northern European | 3 | 0.0% |
| Norwegian | 9 | 0.1% |
| Polish | 16 | 0.1% |
| Puerto Rican | 58 | 0.4% |
| Scandinavian | 9 | 0.1% |
| Scotch-Irish | 83 | 0.5% |
| Scottish | 121 | 0.7% |
| South African | 21 | 0.1% |
| South American Indian | 3 | 0.0% |
| Spanish | 22 | 0.1% |
| Subsaharan African | 223 | 1.4% |
| Swiss | 137 | 0.8% |
| Syrian | 3 | 0.0% | View All 32 Rows |
Immigrants in Phillips County
The most numerous immigrant groups reported in Phillips County came from Asia (93 | 0.6%), Philippines (93 | 0.6%), South Eastern Asia (93 | 0.6%), Latin America (45 | 0.3%), and Africa (40 | 0.2%), together accounting for 2.2% of all Phillips County residents.

| Immigration Origin | # Population | % Population |
| Africa | 40 | 0.2% |
| Asia | 93 | 0.6% |
| Brazil | 10 | 0.1% |
| Central America | 35 | 0.2% |
| El Salvador | 1 | 0.0% |
| Ghana | 5 | 0.0% |
| Latin America | 45 | 0.3% |
| Mexico | 34 | 0.2% |
| Philippines | 93 | 0.6% |
| South Africa | 35 | 0.2% |
| South America | 10 | 0.1% |
| South Eastern Asia | 93 | 0.6% |
| Western Africa | 5 | 0.0% | View All 13 Rows |
Sex and Age in Phillips County
Sex and Age in Phillips County
The most populous age groups in Phillips County are 10 to 14 Years (659 | 8.7%) for men and 15 to 19 Years (752 | 8.6%) for women.

| Age Bracket | Male | Female |
| Under 5 Years | 604 (8.0%) | 542 (6.2%) |
| 5 to 9 Years | 587 (7.7%) | 505 (5.8%) |
| 10 to 14 Years | 659 (8.7%) | 692 (7.9%) |
| 15 to 19 Years | 451 (5.9%) | 752 (8.6%) |
| 20 to 24 Years | 509 (6.7%) | 402 (4.6%) |
| 25 to 29 Years | 403 (5.3%) | 497 (5.7%) |
| 30 to 34 Years | 309 (4.1%) | 439 (5.0%) |
| 35 to 39 Years | 455 (6.0%) | 462 (5.3%) |
| 40 to 44 Years | 430 (5.7%) | 454 (5.2%) |
| 45 to 49 Years | 335 (4.4%) | 446 (5.1%) |
| 50 to 54 Years | 443 (5.8%) | 482 (5.5%) |
| 55 to 59 Years | 558 (7.3%) | 666 (7.6%) |
| 60 to 64 Years | 476 (6.3%) | 608 (6.9%) |
| 65 to 69 Years | 520 (6.8%) | 560 (6.4%) |
| 70 to 74 Years | 349 (4.6%) | 486 (5.5%) |
| 75 to 79 Years | 285 (3.7%) | 291 (3.3%) |
| 80 to 84 Years | 126 (1.7%) | 269 (3.1%) |
| 85 Years and over | 101 (1.3%) | 220 (2.5%) |
| Total | 7,600 (100.0%) | 8,773 (100.0%) |
Families and Households in Phillips County
Median Family Size in Phillips County
The median family size in Phillips County is 3.55 persons per family, with single female/mother families (1,537 | 41.9%) accounting for the largest median family size of 4.08 persons per family. On the other hand, married-couple families (1,934 | 52.7%) represent the smallest median family size with 3.15 persons per family.

| Family Type | # Families | Family Size |
| Married-Couple | 1,934 (52.7%) | 3.15 |
| Single Male/Father | 197 (5.4%) | 3.22 |
| Single Female/Mother | 1,537 (41.9%) | 4.08 |
| Total Families | 3,668 (100.0%) | 3.55 |
Median Household Size in Phillips County
The median household size in Phillips County is 2.62 persons per household, with single female/mother households (1,537 | 24.9%) accounting for the largest median household size of 4.19 persons per household. non-family households (2,512 | 40.6%) represent the smallest median household size with 1.17 persons per household.

| Household Type | # Households | Household Size |
| Married-Couple | 1,934 (31.3%) | 3.16 |
| Single Male/Father | 197 (3.2%) | 3.31 |
| Single Female/Mother | 1,537 (24.9%) | 4.19 |
| Non-family | 2,512 (40.6%) | 1.17 |
| Total Households | 6,180 (100.0%) | 2.62 |
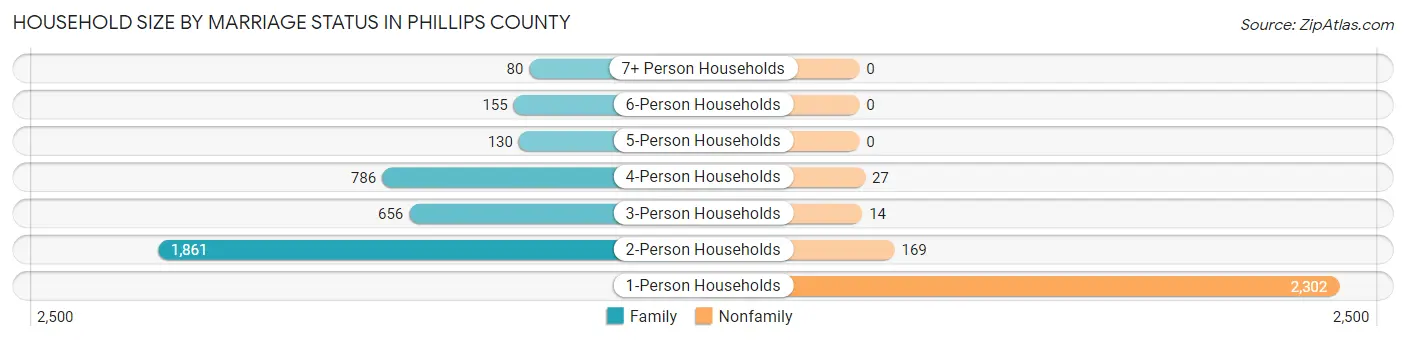
Household Size by Marriage Status in Phillips County
Out of a total of 6,180 households in Phillips County, 3,668 (59.4%) are family households, while 2,512 (40.6%) are nonfamily households. The most numerous type of family households are 2-person households, comprising 1,861, and the most common type of nonfamily households are 1-person households, comprising 2,302.
| Household Size | Family Households | Nonfamily Households |
| 1-Person Households | - | 2,302 (37.2%) |
| 2-Person Households | 1,861 (30.1%) | 169 (2.7%) |
| 3-Person Households | 656 (10.6%) | 14 (0.2%) |
| 4-Person Households | 786 (12.7%) | 27 (0.4%) |
| 5-Person Households | 130 (2.1%) | 0 (0.0%) |
| 6-Person Households | 155 (2.5%) | 0 (0.0%) |
| 7+ Person Households | 80 (1.3%) | 0 (0.0%) |
| Total | 3,668 (59.4%) | 2,512 (40.6%) |
Female Fertility in Phillips County
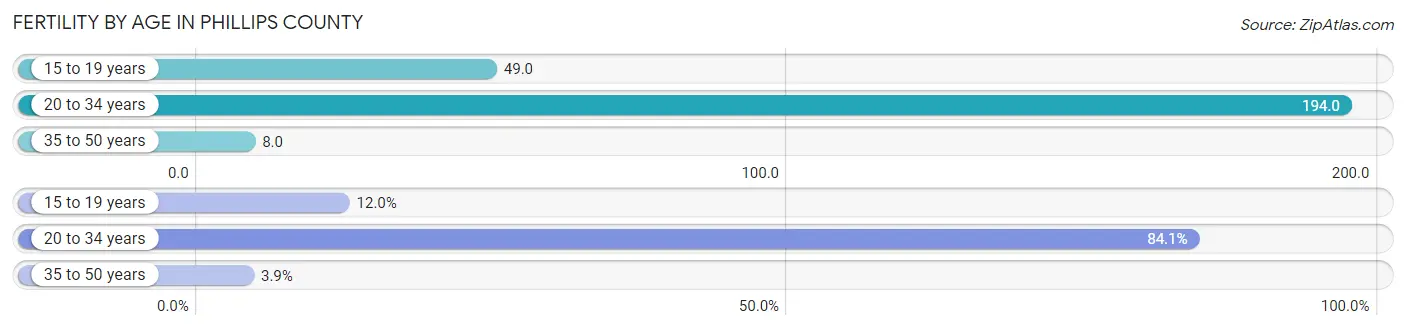
Fertility by Age in Phillips County
Average fertility rate in Phillips County is 85.0 births per 1,000 women. Women in the age bracket of 20 to 34 years have the highest fertility rate with 194.0 births per 1,000 women. Women in the age bracket of 20 to 34 years acount for 84.1% of all women with births.
| Age Bracket | Women with Births | Births / 1,000 Women |
| 15 to 19 years | 37 (12.0%) | 49.0 |
| 20 to 34 years | 259 (84.1%) | 194.0 |
| 35 to 50 years | 12 (3.9%) | 8.0 |
| Total | 308 (100.0%) | 85.0 |
Fertility by Age by Marriage Status in Phillips County
15.3% of women with births (308) in Phillips County are married. The highest percentage of unmarried women with births falls into 15 to 19 years age bracket with 100.0% of them unmarried at the time of birth, while the lowest percentage of unmarried women with births belong to 20 to 34 years age bracket with 81.9% of them unmarried.

| Age Bracket | Married | Unmarried |
| 15 to 19 years | 0 (0.0%) | 37 (100.0%) |
| 20 to 34 years | 47 (18.1%) | 212 (81.9%) |
| 35 to 50 years | 0 (0.0%) | 12 (100.0%) |
| Total | 47 (15.3%) | 261 (84.7%) |
Fertility by Education in Phillips County
Average fertility rate in Phillips County is 85.0 births per 1,000 women. Women with the education attainment of high school diploma have the highest fertility rate of 126.0 births per 1,000 women, while women with the education attainment of bachelor's degree have the lowest fertility at 33.0 births per 1,000 women. Women with the education attainment of high school diploma represent 37.7% of all women with births.

| Educational Attainment | Women with Births | Births / 1,000 Women |
| Less than High School | 61 (19.8%) | 83.0 |
| High School Diploma | 116 (37.7%) | 126.0 |
| College or Associate's Degree | 106 (34.4%) | 74.0 |
| Bachelor's Degree | 14 (4.5%) | 33.0 |
| Graduate Degree | 11 (3.6%) | 95.0 |
| Total | 308 (100.0%) | 85.0 |
Fertility by Education by Marriage Status in Phillips County
84.7% of women with births in Phillips County are unmarried. Women with the educational attainment of bachelor's degree are most likely to be married with 100.0% of them married at childbirth, while women with the educational attainment of less than high school are least likely to be married with 100.0% of them unmarried at childbirth.

| Educational Attainment | Married | Unmarried |
| Less than High School | 0 (0.0%) | 61 (100.0%) |
| High School Diploma | 9 (7.8%) | 107 (92.2%) |
| College or Associate's Degree | 13 (12.3%) | 93 (87.7%) |
| Bachelor's Degree | 14 (100.0%) | 0 (0.0%) |
| Graduate Degree | 11 (100.0%) | 0 (0.0%) |
| Total | 47 (15.3%) | 261 (84.7%) |
Income in Phillips County
Income Overview in Phillips County
Per Capita Income in Phillips County is $22,644, while median incomes of families and households are $50,951 and $37,458 respectively.
| Characteristic | Number | Measure |
| Per Capita Income | 16,373 | $22,644 |
| Median Family Income | 3,668 | $50,951 |
| Mean Family Income | 3,668 | $67,381 |
| Median Household Income | 6,180 | $37,458 |
| Mean Household Income | 6,180 | $54,223 |
| Income Deficit | 3,668 | $14,026 |
| Wage / Income Gap (%) | 16,373 | 37.97% |
| Wage / Income Gap ($) | 16,373 | 62.03¢ per $1 |
| Gini / Inequality Index | 16,373 | 0.50 |
Earnings by Sex in Phillips County
Average Earnings in Phillips County are $35,219, $40,211 for men and $24,944 for women, a difference of 38.0%.

| Sex | Number | Average Earnings |
| Male | 3,214 (48.5%) | $40,211 |
| Female | 3,415 (51.5%) | $24,944 |
| Total | 6,629 (100.0%) | $35,219 |
Earnings by Sex by Income Bracket in Phillips County
The most common earnings brackets in Phillips County are $35,000 to $39,999 for men (404 | 12.6%) and $55,000 to $64,999 for women (412 | 12.1%).

| Income | Male | Female |
| $2,499 or less | 151 (4.7%) | 258 (7.5%) |
| $2,500 to $4,999 | 210 (6.5%) | 208 (6.1%) |
| $5,000 to $7,499 | 45 (1.4%) | 200 (5.9%) |
| $7,500 to $9,999 | 117 (3.6%) | 35 (1.0%) |
| $10,000 to $12,499 | 36 (1.1%) | 203 (5.9%) |
| $12,500 to $14,999 | 119 (3.7%) | 131 (3.8%) |
| $15,000 to $17,499 | 25 (0.8%) | 229 (6.7%) |
| $17,500 to $19,999 | 35 (1.1%) | 107 (3.1%) |
| $20,000 to $22,499 | 55 (1.7%) | 184 (5.4%) |
| $22,500 to $24,999 | 88 (2.7%) | 156 (4.6%) |
| $25,000 to $29,999 | 161 (5.0%) | 217 (6.4%) |
| $30,000 to $34,999 | 153 (4.8%) | 162 (4.7%) |
| $35,000 to $39,999 | 404 (12.6%) | 190 (5.6%) |
| $40,000 to $44,999 | 214 (6.7%) | 128 (3.7%) |
| $45,000 to $49,999 | 184 (5.7%) | 249 (7.3%) |
| $50,000 to $54,999 | 171 (5.3%) | 90 (2.6%) |
| $55,000 to $64,999 | 266 (8.3%) | 412 (12.1%) |
| $65,000 to $74,999 | 304 (9.5%) | 119 (3.5%) |
| $75,000 to $99,999 | 294 (9.1%) | 53 (1.5%) |
| $100,000+ | 182 (5.7%) | 84 (2.5%) |
| Total | 3,214 (100.0%) | 3,415 (100.0%) |
Earnings by Sex by Educational Attainment in Phillips County
Average earnings in Phillips County are $43,960 for men and $30,589 for women, a difference of 30.4%. Men with an educational attainment of graduate degree enjoy the highest average annual earnings of $140,476, while those with less than high school education earn the least with $35,102. Women with an educational attainment of graduate degree earn the most with the average annual earnings of $56,477, while those with high school diploma education have the smallest earnings of $20,707.

| Educational Attainment | Male Income | Female Income |
| Less than High School | $35,102 | $0 |
| High School Diploma | $38,873 | $20,707 |
| College or Associate's Degree | $46,200 | $24,881 |
| Bachelor's Degree | $70,000 | $46,935 |
| Graduate Degree | $140,476 | $56,477 |
| Total | $43,960 | $30,589 |
Family Income in Phillips County
Family Income Brackets in Phillips County
According to the Phillips County family income data, there are 602 families falling into the $100,000 to $149,999 income range, which is the most common income bracket and makes up 16.4% of all families. Conversely, the $150,000 to $199,999 income bracket is the least frequent group with only 92 families (2.5%) belonging to this category.

| Income Bracket | # Families | % Families |
| Less than $10,000 | 381 | 10.4% |
| $10,000 to $14,999 | 286 | 7.8% |
| $15,000 to $24,999 | 400 | 10.9% |
| $25,000 to $34,999 | 304 | 8.3% |
| $35,000 to $49,999 | 422 | 11.5% |
| $50,000 to $74,999 | 580 | 15.8% |
| $75,000 to $99,999 | 466 | 12.7% |
| $100,000 to $149,999 | 602 | 16.4% |
| $150,000 to $199,999 | 92 | 2.5% |
| $200,000+ | 136 | 3.7% |
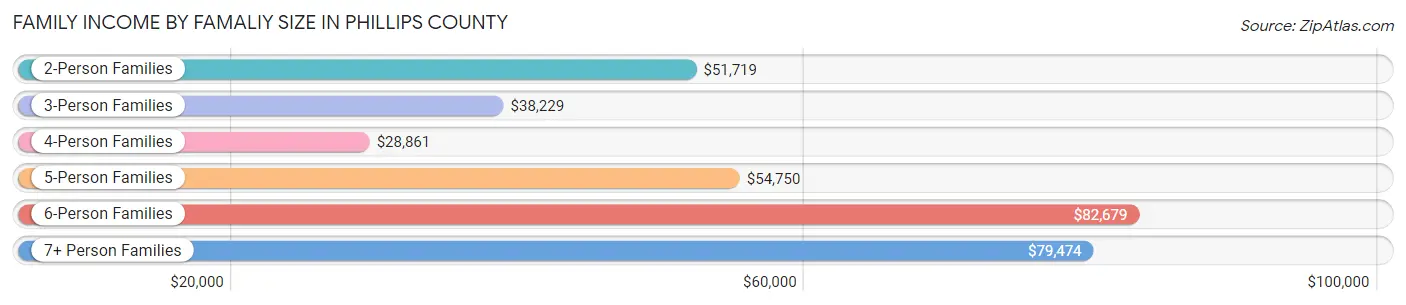
Family Income by Famaliy Size in Phillips County
6-person families (137 | 3.7%) account for the highest median family income in Phillips County with $82,679 per family, while 2-person families (1,929 | 52.6%) have the highest median income of $25,860 per family member.
| Income Bracket | # Families | Median Income |
| 2-Person Families | 1,929 (52.6%) | $51,719 |
| 3-Person Families | 666 (18.2%) | $38,229 |
| 4-Person Families | 731 (19.9%) | $28,861 |
| 5-Person Families | 125 (3.4%) | $54,750 |
| 6-Person Families | 137 (3.7%) | $82,679 |
| 7+ Person Families | 80 (2.2%) | $79,474 |
| Total | 3,668 (100.0%) | $50,951 |
Family Income by Number of Earners in Phillips County

| Number of Earners | # Families | Median Income |
| No Earners | 1,075 (29.3%) | $19,313 |
| 1 Earner | 1,255 (34.2%) | $43,534 |
| 2 Earners | 1,163 (31.7%) | $89,779 |
| 3+ Earners | 175 (4.8%) | $0 |
| Total | 3,668 (100.0%) | $50,951 |
Household Income in Phillips County
Household Income Brackets in Phillips County
With 976 households falling in the category, the $15,000 to $24,999 income range is the most frequent in Phillips County, accounting for 15.8% of all households. In contrast, only 105 households (1.7%) fall into the $150,000 to $199,999 income bracket, making it the least populous group.

| Income Bracket | # Households | % Households |
| Less than $10,000 | 630 | 10.2% |
| $10,000 to $14,999 | 779 | 12.6% |
| $15,000 to $24,999 | 976 | 15.8% |
| $25,000 to $34,999 | 531 | 8.6% |
| $35,000 to $49,999 | 779 | 12.6% |
| $50,000 to $74,999 | 952 | 15.4% |
| $75,000 to $99,999 | 599 | 9.7% |
| $100,000 to $149,999 | 686 | 11.1% |
| $150,000 to $199,999 | 105 | 1.7% |
| $200,000+ | 136 | 2.2% |
Household Income by Householder Age in Phillips County
The median household income in Phillips County is $37,458, with the highest median household income of $39,452 found in the 45 to 64 years age bracket for the primary householder. A total of 2,317 households (37.5%) fall into this category. Meanwhile, the 15 to 24 years age bracket for the primary householder has the lowest median household income of $35,536, with 150 households (2.4%) in this group.

| Income Bracket | # Households | Median Income |
| 15 to 24 Years | 150 (2.4%) | $35,536 |
| 25 to 44 Years | 1,598 (25.9%) | $37,898 |
| 45 to 64 Years | 2,317 (37.5%) | $39,452 |
| 65+ Years | 2,115 (34.2%) | $35,858 |
| Total | 6,180 (100.0%) | $37,458 |
Poverty in Phillips County
Income Below Poverty by Sex and Age in Phillips County
With 30.8% poverty level for males and 30.1% for females among the residents of Phillips County, under 5 year old males and 5 year old females are the most vulnerable to poverty, with 428 males (70.9%) and 35 females (53.8%) in their respective age groups living below the poverty level.

| Age Bracket | Male | Female |
| Under 5 Years | 428 (70.9%) | 290 (53.5%) |
| 5 Years | 52 (49.1%) | 35 (53.8%) |
| 6 to 11 Years | 473 (53.7%) | 261 (43.0%) |
| 12 to 14 Years | 29 (11.2%) | 247 (47.2%) |
| 15 Years | 22 (21.8%) | 23 (11.3%) |
| 16 and 17 Years | 37 (20.3%) | 67 (27.0%) |
| 18 to 24 Years | 217 (32.1%) | 191 (27.2%) |
| 25 to 34 Years | 136 (19.5%) | 462 (49.4%) |
| 35 to 44 Years | 246 (28.5%) | 222 (24.2%) |
| 45 to 54 Years | 189 (24.5%) | 231 (24.9%) |
| 55 to 64 Years | 208 (20.1%) | 384 (30.1%) |
| 65 to 74 Years | 190 (22.3%) | 128 (12.3%) |
| 75 Years and over | 84 (17.7%) | 94 (12.4%) |
| Total | 2,311 (30.8%) | 2,635 (30.1%) |
Income Above Poverty by Sex and Age in Phillips County
According to the poverty statistics in Phillips County, males aged 12 to 14 years and females aged 15 years are the age groups that are most secure financially, with 88.8% of males and 88.7% of females in these age groups living above the poverty line.
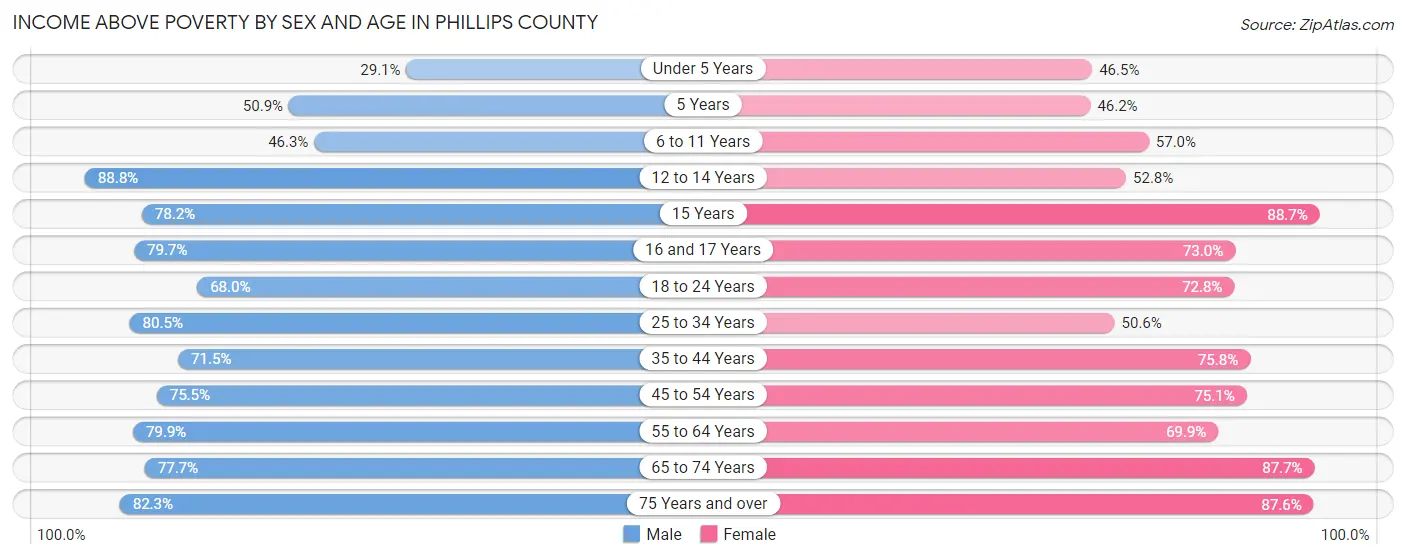
| Age Bracket | Male | Female |
| Under 5 Years | 176 (29.1%) | 252 (46.5%) |
| 5 Years | 54 (50.9%) | 30 (46.2%) |
| 6 to 11 Years | 407 (46.3%) | 346 (57.0%) |
| 12 to 14 Years | 230 (88.8%) | 276 (52.8%) |
| 15 Years | 79 (78.2%) | 180 (88.7%) |
| 16 and 17 Years | 145 (79.7%) | 181 (73.0%) |
| 18 to 24 Years | 460 (67.9%) | 512 (72.8%) |
| 25 to 34 Years | 561 (80.5%) | 474 (50.6%) |
| 35 to 44 Years | 617 (71.5%) | 694 (75.8%) |
| 45 to 54 Years | 581 (75.4%) | 697 (75.1%) |
| 55 to 64 Years | 826 (79.9%) | 890 (69.9%) |
| 65 to 74 Years | 661 (77.7%) | 914 (87.7%) |
| 75 Years and over | 391 (82.3%) | 662 (87.6%) |
| Total | 5,188 (69.2%) | 6,108 (69.9%) |
Income Below Poverty Among Married-Couple Families in Phillips County
The poverty statistics for married-couple families in Phillips County show that 6.3% or 121 of the total 1,934 families live below the poverty line. Families with 3 or 4 children have the highest poverty rate of 6.7%, comprising of 8 families. On the other hand, families with 5 or more children have the lowest poverty rate of 0.0%, which includes 0 families.

| Children | Above Poverty | Below Poverty |
| No Children | 1,284 (93.7%) | 86 (6.3%) |
| 1 or 2 Children | 400 (93.7%) | 27 (6.3%) |
| 3 or 4 Children | 111 (93.3%) | 8 (6.7%) |
| 5 or more Children | 18 (100.0%) | 0 (0.0%) |
| Total | 1,813 (93.7%) | 121 (6.3%) |
Income Below Poverty Among Single-Parent Households in Phillips County
According to the poverty data in Phillips County, 16.8% or 33 single-father households and 51.8% or 796 single-mother households are living below the poverty line. Among single-father households, those with no children have the highest poverty rate, with 30 households (28.0%) experiencing poverty. Likewise, among single-mother households, those with 3 or 4 children have the highest poverty rate, with 329 households (78.1%) falling below the poverty line.

| Children | Single Father | Single Mother |
| No Children | 30 (28.0%) | 202 (37.5%) |
| 1 or 2 Children | 3 (3.3%) | 249 (46.0%) |
| 3 or 4 Children | 0 (0.0%) | 329 (78.1%) |
| 5 or more Children | 0 (0.0%) | 16 (44.4%) |
| Total | 33 (16.8%) | 796 (51.8%) |
Income Below Poverty Among Married-Couple vs Single-Parent Households in Phillips County
The poverty data for Phillips County shows that 121 of the married-couple family households (6.3%) and 829 of the single-parent households (47.8%) are living below the poverty level. Within the married-couple family households, those with 3 or 4 children have the highest poverty rate, with 8 households (6.7%) falling below the poverty line. Among the single-parent households, those with 3 or 4 children have the highest poverty rate, with 329 household (78.1%) living below poverty.

| Children | Married-Couple Families | Single-Parent Households |
| No Children | 86 (6.3%) | 232 (35.9%) |
| 1 or 2 Children | 27 (6.3%) | 252 (39.9%) |
| 3 or 4 Children | 8 (6.7%) | 329 (78.1%) |
| 5 or more Children | 0 (0.0%) | 16 (44.4%) |
| Total | 121 (6.3%) | 829 (47.8%) |
Employment Characteristics in Phillips County
Employment by Class of Employer in Phillips County
Among the 5,529 employed individuals in Phillips County, private company employees (3,625 | 65.6%), state government employees (618 | 11.2%), and local government employees (494 | 8.9%) make up the most common classes of employment.
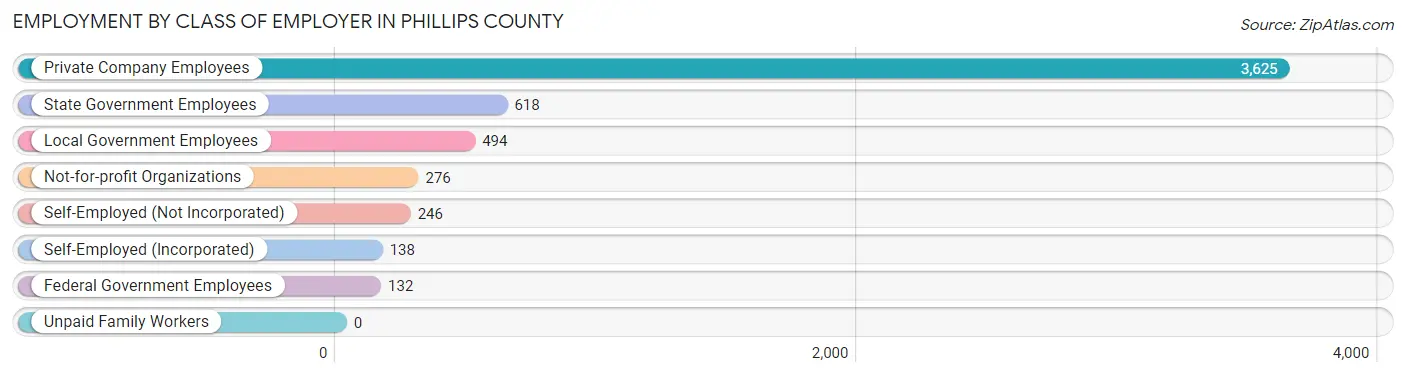
| Employer Class | # Employees | % Employees |
| Private Company Employees | 3,625 | 65.6% |
| Self-Employed (Incorporated) | 138 | 2.5% |
| Self-Employed (Not Incorporated) | 246 | 4.4% |
| Not-for-profit Organizations | 276 | 5.0% |
| Local Government Employees | 494 | 8.9% |
| State Government Employees | 618 | 11.2% |
| Federal Government Employees | 132 | 2.4% |
| Unpaid Family Workers | 0 | 0.0% |
| Total | 5,529 | 100.0% |
Employment Status by Age in Phillips County
According to the labor force statistics for Phillips County, out of the total population over 16 years of age (12,480), 52.6% or 6,564 individuals are in the labor force, with 13.3% or 873 of them unemployed. The age group with the highest labor force participation rate is 25 to 29 years, with 80.8% or 727 individuals in the labor force. Within the labor force, the 30 to 34 years age range has the highest percentage of unemployed individuals, with 32.7% or 166 of them being unemployed.

| Age Bracket | In Labor Force | Unemployed |
| 16 to 19 Years | 391 (43.5%) | 51 (13.0%) |
| 20 to 24 Years | 662 (72.7%) | 152 (23.0%) |
| 25 to 29 Years | 727 (80.8%) | 179 (24.6%) |
| 30 to 34 Years | 507 (67.8%) | 166 (32.7%) |
| 35 to 44 Years | 1,315 (73.0%) | 191 (14.5%) |
| 45 to 54 Years | 1,182 (69.3%) | 61 (5.2%) |
| 55 to 59 Years | 798 (65.2%) | 13 (1.6%) |
| 60 to 64 Years | 472 (43.5%) | 37 (7.8%) |
| 65 to 74 Years | 471 (24.6%) | 24 (5.1%) |
| 75 Years and over | 43 (3.3%) | 0 (0.0%) |
| Total | 6,564 (52.6%) | 873 (13.3%) |
Employment Status by Educational Attainment in Phillips County
According to labor force statistics for Phillips County, 67.0% of individuals (5,000) out of the total population between 25 and 64 years of age (7,463) are in the labor force, with 12.9% or 645 of them being unemployed. The group with the highest labor force participation rate are those with the educational attainment of bachelor's degree or higher, with 75.1% or 882 individuals in the labor force. Within the labor force, individuals with high school diploma education have the highest percentage of unemployment, with 23.8% or 370 of them being unemployed.

| Educational Attainment | In Labor Force | Unemployed |
| Less than High School | 485 (51.6%) | 77 (8.2%) |
| High School Diploma | 1,553 (64.0%) | 577 (23.8%) |
| College / Associate Degree | 2,081 (71.2%) | 272 (9.3%) |
| Bachelor's Degree or higher | 882 (75.1%) | 54 (4.6%) |
| Total | 5,000 (67.0%) | 963 (12.9%) |
Employment Occupations by Sex in Phillips County
Management, Business, Science and Arts Occupations
The most common Management, Business, Science and Arts occupations in Phillips County are Community & Social Service (680 | 12.0%), Education Instruction & Library (561 | 9.9%), Management (468 | 8.3%), Business & Financial (221 | 3.9%), and Health Diagnosing & Treating (213 | 3.8%).

Management, Business, Science and Arts Occupations by Sex
Within the Management, Business, Science and Arts occupations in Phillips County, the most male-oriented occupations are Computers & Mathematics (100.0%), Management (54.9%), and Life, Physical & Social Science (51.6%), while the most female-oriented occupations are Arts, Media & Entertainment (100.0%), Health Diagnosing & Treating (92.0%), and Business & Financial (89.1%).

| Occupation | Male | Female |
| Management | 257 (54.9%) | 211 (45.1%) |
| Business & Financial | 24 (10.9%) | 197 (89.1%) |
| Computers, Engineering & Science | 61 (39.1%) | 95 (60.9%) |
| Computers & Mathematics | 16 (100.0%) | 0 (0.0%) |
| Architecture & Engineering | 13 (16.7%) | 65 (83.3%) |
| Life, Physical & Social Science | 32 (51.6%) | 30 (48.4%) |
| Community & Social Service | 192 (28.2%) | 488 (71.8%) |
| Education, Arts & Media | 32 (32.7%) | 66 (67.3%) |
| Legal Services & Support | 8 (47.1%) | 9 (52.9%) |
| Education Instruction & Library | 152 (27.1%) | 409 (72.9%) |
| Arts, Media & Entertainment | 0 (0.0%) | 4 (100.0%) |
| Health Diagnosing & Treating | 17 (8.0%) | 196 (92.0%) |
| Health Technologists | 14 (21.5%) | 51 (78.5%) |
| Total (Category) | 551 (31.7%) | 1,187 (68.3%) |
| Total (Overall) | 2,786 (49.3%) | 2,868 (50.7%) |
Services Occupations
The most common Services occupations in Phillips County are Healthcare Support (224 | 4.0%), Food Preparation & Serving (214 | 3.8%), Security & Protection (151 | 2.7%), Cleaning & Maintenance (122 | 2.2%), and Personal Care & Service (114 | 2.0%).

Services Occupations by Sex
Within the Services occupations in Phillips County, the most male-oriented occupations are Law Enforcement (100.0%), Security & Protection (99.3%), and Firefighting & Prevention (99.0%), while the most female-oriented occupations are Healthcare Support (100.0%), Food Preparation & Serving (87.8%), and Personal Care & Service (86.8%).

| Occupation | Male | Female |
| Healthcare Support | 0 (0.0%) | 224 (100.0%) |
| Security & Protection | 150 (99.3%) | 1 (0.7%) |
| Firefighting & Prevention | 95 (99.0%) | 1 (1.0%) |
| Law Enforcement | 55 (100.0%) | 0 (0.0%) |
| Food Preparation & Serving | 26 (12.1%) | 188 (87.8%) |
| Cleaning & Maintenance | 50 (41.0%) | 72 (59.0%) |
| Personal Care & Service | 15 (13.2%) | 99 (86.8%) |
| Total (Category) | 241 (29.2%) | 584 (70.8%) |
| Total (Overall) | 2,786 (49.3%) | 2,868 (50.7%) |
Sales and Office Occupations
The most common Sales and Office occupations in Phillips County are Office & Administration (687 | 12.1%), and Sales & Related (643 | 11.4%).
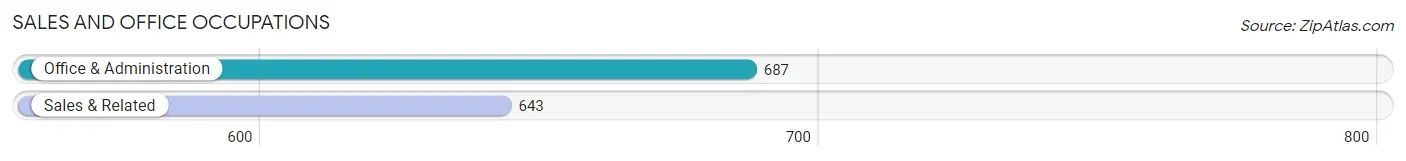
Sales and Office Occupations by Sex

| Occupation | Male | Female |
| Sales & Related | 323 (50.2%) | 320 (49.8%) |
| Office & Administration | 83 (12.1%) | 604 (87.9%) |
| Total (Category) | 406 (30.5%) | 924 (69.5%) |
| Total (Overall) | 2,786 (49.3%) | 2,868 (50.7%) |
Natural Resources, Construction and Maintenance Occupations
The most common Natural Resources, Construction and Maintenance occupations in Phillips County are Installation, Maintenance & Repair (174 | 3.1%), Construction & Extraction (163 | 2.9%), and Farming, Fishing & Forestry (161 | 2.9%).

Natural Resources, Construction and Maintenance Occupations by Sex

| Occupation | Male | Female |
| Farming, Fishing & Forestry | 152 (94.4%) | 9 (5.6%) |
| Construction & Extraction | 163 (100.0%) | 0 (0.0%) |
| Installation, Maintenance & Repair | 174 (100.0%) | 0 (0.0%) |
| Total (Category) | 489 (98.2%) | 9 (1.8%) |
| Total (Overall) | 2,786 (49.3%) | 2,868 (50.7%) |
Production, Transportation and Moving Occupations
The most common Production, Transportation and Moving occupations in Phillips County are Production (464 | 8.2%), Transportation (445 | 7.9%), and Material Moving (354 | 6.3%).

Production, Transportation and Moving Occupations by Sex

| Occupation | Male | Female |
| Production | 363 (78.2%) | 101 (21.8%) |
| Transportation | 439 (98.7%) | 6 (1.3%) |
| Material Moving | 297 (83.9%) | 57 (16.1%) |
| Total (Category) | 1,099 (87.0%) | 164 (13.0%) |
| Total (Overall) | 2,786 (49.3%) | 2,868 (50.7%) |
Employment Industries by Sex in Phillips County
Employment Industries in Phillips County
The major employment industries in Phillips County include Manufacturing (902 | 16.0%), Retail Trade (884 | 15.6%), Health Care & Social Assistance (827 | 14.6%), Educational Services (695 | 12.3%), and Arts, Entertainment & Recreation (317 | 5.6%).

Employment Industries by Sex in Phillips County
The Phillips County industries that see more men than women are Wholesale Trade (100.0%), Utilities (99.3%), and Construction (97.6%), whereas the industries that tend to have a higher number of women are Enterprise Management (100.0%), Accommodation & Food Services (97.5%), and Health Care & Social Assistance (95.3%).

| Industry | Male | Female |
| Agriculture, Fishing & Hunting | 233 (94.3%) | 14 (5.7%) |
| Mining, Quarrying, & Extraction | 0 (0.0%) | 0 (0.0%) |
| Construction | 282 (97.6%) | 7 (2.4%) |
| Manufacturing | 597 (66.2%) | 305 (33.8%) |
| Wholesale Trade | 104 (100.0%) | 0 (0.0%) |
| Retail Trade | 415 (46.9%) | 469 (53.0%) |
| Transportation & Warehousing | 210 (82.4%) | 45 (17.6%) |
| Utilities | 142 (99.3%) | 1 (0.7%) |
| Information | 11 (91.7%) | 1 (8.3%) |
| Finance & Insurance | 104 (39.0%) | 163 (61.1%) |
| Real Estate, Rental & Leasing | 29 (50.0%) | 29 (50.0%) |
| Professional & Scientific | 10 (33.3%) | 20 (66.7%) |
| Enterprise Management | 0 (0.0%) | 4 (100.0%) |
| Administrative & Support | 159 (90.9%) | 16 (9.1%) |
| Educational Services | 213 (30.6%) | 482 (69.4%) |
| Health Care & Social Assistance | 39 (4.7%) | 788 (95.3%) |
| Arts, Entertainment & Recreation | 49 (15.5%) | 268 (84.5%) |
| Accommodation & Food Services | 3 (2.5%) | 119 (97.5%) |
| Public Administration | 81 (50.6%) | 79 (49.4%) |
| Total | 2,786 (49.3%) | 2,868 (50.7%) |
Education in Phillips County
School Enrollment in Phillips County
The most common levels of schooling among the 4,222 students in Phillips County are high school (1,174 | 27.8%), middle school (1,106 | 26.2%), and elementary school (811 | 19.2%).

| School Level | # Students | % Students |
| Nursery / Preschool | 296 | 7.0% |
| Kindergarten | 300 | 7.1% |
| Elementary School | 811 | 19.2% |
| Middle School | 1,106 | 26.2% |
| High School | 1,174 | 27.8% |
| College / Undergraduate | 462 | 10.9% |
| Graduate / Professional | 73 | 1.7% |
| Total | 4,222 | 100.0% |
School Enrollment by Age by Funding Source in Phillips County
Out of a total of 4,222 students who are enrolled in schools in Phillips County, 249 (5.9%) attend a private institution, while the remaining 3,973 (94.1%) are enrolled in public schools. The age group of 15 to 17 year olds has the highest likelihood of being enrolled in private schools, with 79 (10.8% in the age bracket) enrolled. Conversely, the age group of 18 to 19 year olds has the lowest likelihood of being enrolled in a private school, with 344 (98.6% in the age bracket) attending a public institution.

| Age Bracket | Public School | Private School |
| 3 to 4 Year Olds | 193 (91.0%) | 19 (9.0%) |
| 5 to 9 Year Old | 991 (93.9%) | 64 (6.1%) |
| 10 to 14 Year Olds | 1,289 (95.8%) | 57 (4.2%) |
| 15 to 17 Year Olds | 655 (89.2%) | 79 (10.8%) |
| 18 to 19 Year Olds | 344 (98.6%) | 5 (1.4%) |
| 20 to 24 Year Olds | 235 (96.7%) | 8 (3.3%) |
| 25 to 34 Year Olds | 92 (92.0%) | 8 (8.0%) |
| 35 Years and over | 172 (94.0%) | 11 (6.0%) |
| Total | 3,973 (94.1%) | 249 (5.9%) |
Educational Attainment by Field of Study in Phillips County
Education (544 | 32.7%), business (241 | 14.5%), science & technology (186 | 11.2%), bio, nature & agricultural (120 | 7.2%), and social sciences (119 | 7.1%) are the most common fields of study among 1,665 individuals in Phillips County who have obtained a bachelor's degree or higher.
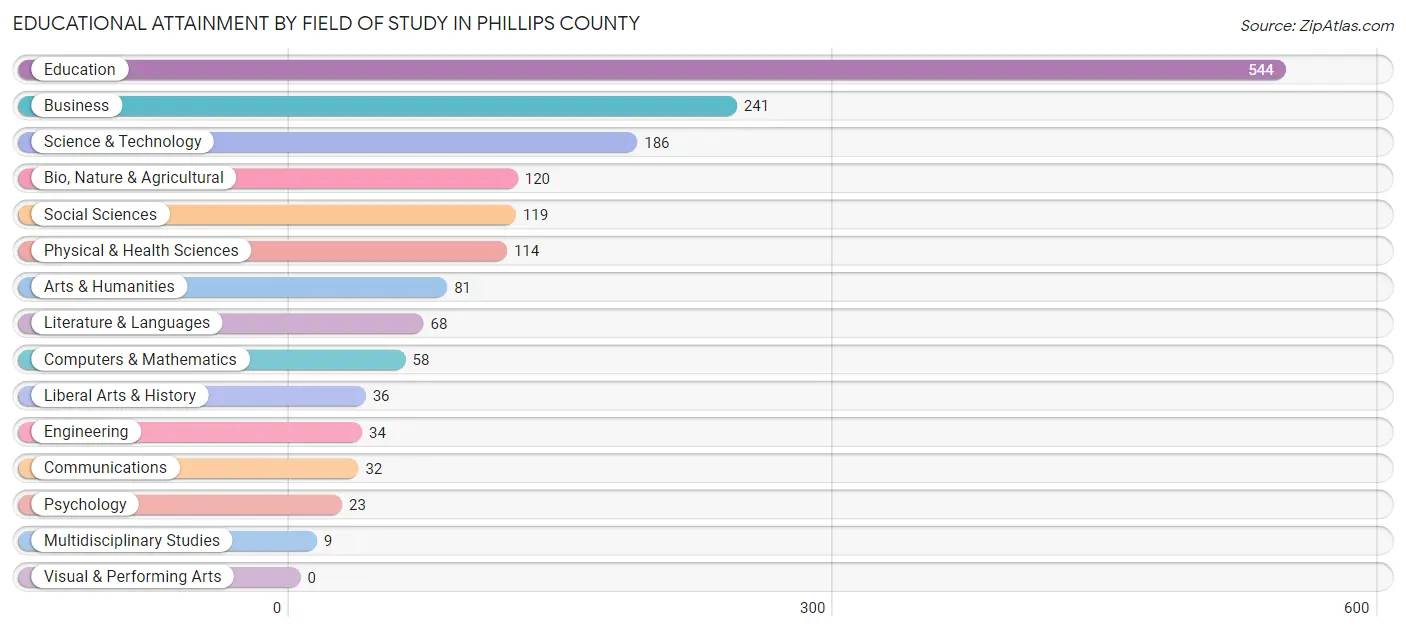
| Field of Study | # Graduates | % Graduates |
| Computers & Mathematics | 58 | 3.5% |
| Bio, Nature & Agricultural | 120 | 7.2% |
| Physical & Health Sciences | 114 | 6.9% |
| Psychology | 23 | 1.4% |
| Social Sciences | 119 | 7.1% |
| Engineering | 34 | 2.0% |
| Multidisciplinary Studies | 9 | 0.5% |
| Science & Technology | 186 | 11.2% |
| Business | 241 | 14.5% |
| Education | 544 | 32.7% |
| Literature & Languages | 68 | 4.1% |
| Liberal Arts & History | 36 | 2.2% |
| Visual & Performing Arts | 0 | 0.0% |
| Communications | 32 | 1.9% |
| Arts & Humanities | 81 | 4.9% |
| Total | 1,665 | 100.0% |
Transportation & Commute in Phillips County
Vehicle Availability by Sex in Phillips County
The most prevalent vehicle ownership categories in Phillips County are males with 2 vehicles (824, accounting for 30.1%) and females with 2 vehicles (772, making up 29.5%).

| Vehicles Available | Male | Female |
| No Vehicle | 50 (1.8%) | 230 (8.2%) |
| 1 Vehicle | 715 (26.1%) | 1,026 (36.7%) |
| 2 Vehicles | 824 (30.1%) | 772 (27.6%) |
| 3 Vehicles | 736 (26.9%) | 567 (20.3%) |
| 4 Vehicles | 291 (10.6%) | 87 (3.1%) |
| 5 or more Vehicles | 120 (4.4%) | 111 (4.0%) |
| Total | 2,736 (100.0%) | 2,793 (100.0%) |
Commute Time in Phillips County
The most frequently occuring commute durations in Phillips County are 5 to 9 minutes (1,248 commuters, 23.6%), 10 to 14 minutes (1,084 commuters, 20.5%), and 15 to 19 minutes (883 commuters, 16.7%).
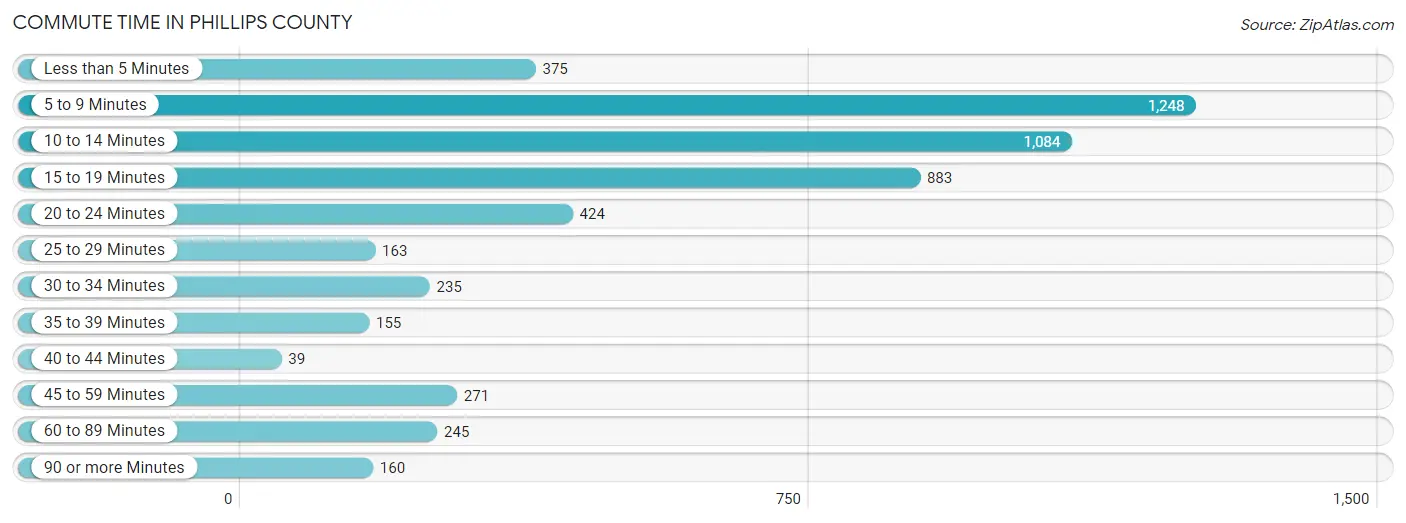
| Commute Time | # Commuters | % Commuters |
| Less than 5 Minutes | 375 | 7.1% |
| 5 to 9 Minutes | 1,248 | 23.6% |
| 10 to 14 Minutes | 1,084 | 20.5% |
| 15 to 19 Minutes | 883 | 16.7% |
| 20 to 24 Minutes | 424 | 8.0% |
| 25 to 29 Minutes | 163 | 3.1% |
| 30 to 34 Minutes | 235 | 4.4% |
| 35 to 39 Minutes | 155 | 2.9% |
| 40 to 44 Minutes | 39 | 0.7% |
| 45 to 59 Minutes | 271 | 5.1% |
| 60 to 89 Minutes | 245 | 4.6% |
| 90 or more Minutes | 160 | 3.0% |
Commute Time by Sex in Phillips County
The most common commute times in Phillips County are 10 to 14 minutes (566 commuters, 21.2%) for males and 5 to 9 minutes (697 commuters, 26.7%) for females.
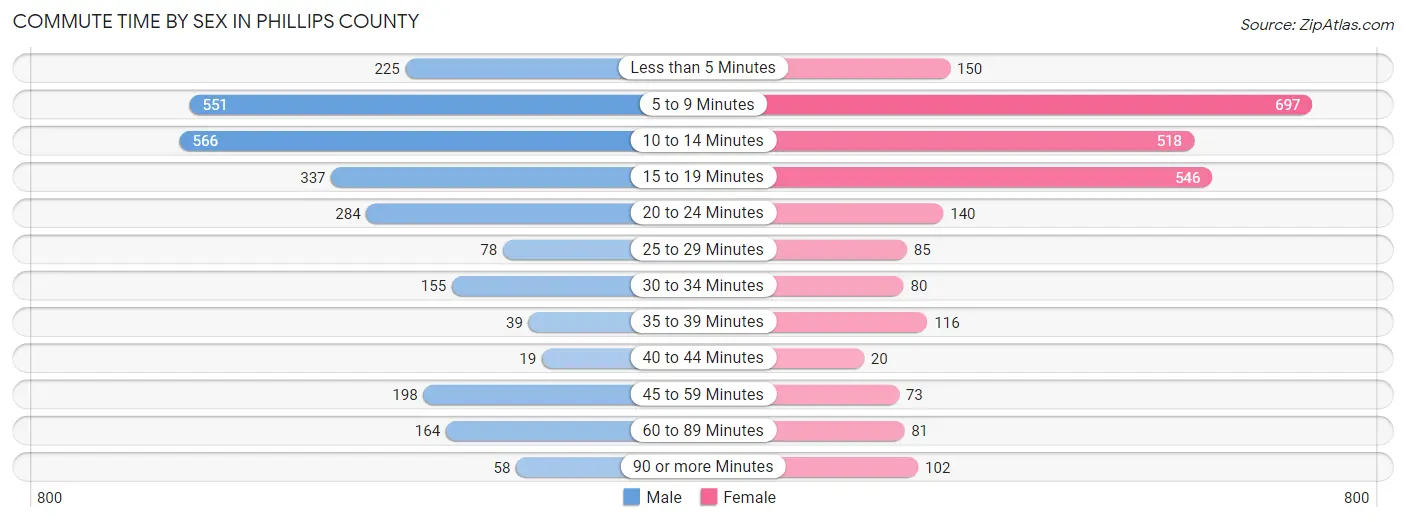
| Commute Time | Male | Female |
| Less than 5 Minutes | 225 (8.4%) | 150 (5.8%) |
| 5 to 9 Minutes | 551 (20.6%) | 697 (26.7%) |
| 10 to 14 Minutes | 566 (21.2%) | 518 (19.9%) |
| 15 to 19 Minutes | 337 (12.6%) | 546 (20.9%) |
| 20 to 24 Minutes | 284 (10.6%) | 140 (5.4%) |
| 25 to 29 Minutes | 78 (2.9%) | 85 (3.3%) |
| 30 to 34 Minutes | 155 (5.8%) | 80 (3.1%) |
| 35 to 39 Minutes | 39 (1.5%) | 116 (4.4%) |
| 40 to 44 Minutes | 19 (0.7%) | 20 (0.8%) |
| 45 to 59 Minutes | 198 (7.4%) | 73 (2.8%) |
| 60 to 89 Minutes | 164 (6.1%) | 81 (3.1%) |
| 90 or more Minutes | 58 (2.2%) | 102 (3.9%) |
Time of Departure to Work by Sex in Phillips County
The most frequent times of departure to work in Phillips County are 7:00 AM to 7:29 AM (468, 17.5%) for males and 7:00 AM to 7:29 AM (555, 21.3%) for females.

| Time of Departure | Male | Female |
| 12:00 AM to 4:59 AM | 197 (7.4%) | 69 (2.6%) |
| 5:00 AM to 5:29 AM | 107 (4.0%) | 81 (3.1%) |
| 5:30 AM to 5:59 AM | 338 (12.6%) | 82 (3.1%) |
| 6:00 AM to 6:29 AM | 275 (10.3%) | 266 (10.2%) |
| 6:30 AM to 6:59 AM | 385 (14.4%) | 329 (12.6%) |
| 7:00 AM to 7:29 AM | 468 (17.5%) | 555 (21.3%) |
| 7:30 AM to 7:59 AM | 114 (4.3%) | 348 (13.3%) |
| 8:00 AM to 8:29 AM | 253 (9.5%) | 276 (10.6%) |
| 8:30 AM to 8:59 AM | 173 (6.5%) | 209 (8.0%) |
| 9:00 AM to 9:59 AM | 42 (1.6%) | 142 (5.4%) |
| 10:00 AM to 10:59 AM | 20 (0.7%) | 24 (0.9%) |
| 11:00 AM to 11:59 AM | 0 (0.0%) | 26 (1.0%) |
| 12:00 PM to 3:59 PM | 67 (2.5%) | 54 (2.1%) |
| 4:00 PM to 11:59 PM | 235 (8.8%) | 147 (5.6%) |
| Total | 2,674 (100.0%) | 2,608 (100.0%) |
Housing Occupancy in Phillips County
Occupancy by Ownership in Phillips County
Of the total 6,180 dwellings in Phillips County, owner-occupied units account for 3,318 (53.7%), while renter-occupied units make up 2,862 (46.3%).

| Occupancy | # Housing Units | % Housing Units |
| Owner Occupied Housing Units | 3,318 | 53.7% |
| Renter-Occupied Housing Units | 2,862 | 46.3% |
| Total Occupied Housing Units | 6,180 | 100.0% |
Occupancy by Household Size in Phillips County
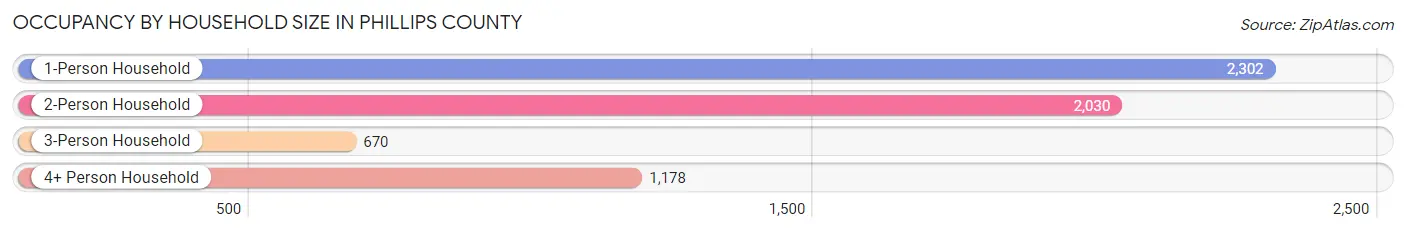
| Household Size | # Housing Units | % Housing Units |
| 1-Person Household | 2,302 | 37.2% |
| 2-Person Household | 2,030 | 32.9% |
| 3-Person Household | 670 | 10.8% |
| 4+ Person Household | 1,178 | 19.1% |
| Total Housing Units | 6,180 | 100.0% |
Occupancy by Ownership by Household Size in Phillips County

| Household Size | Owner-occupied | Renter-occupied |
| 1-Person Household | 1,063 (46.2%) | 1,239 (53.8%) |
| 2-Person Household | 1,468 (72.3%) | 562 (27.7%) |
| 3-Person Household | 337 (50.3%) | 333 (49.7%) |
| 4+ Person Household | 450 (38.2%) | 728 (61.8%) |
| Total Housing Units | 3,318 (53.7%) | 2,862 (46.3%) |
Occupancy by Educational Attainment in Phillips County

| Household Size | Owner-occupied | Renter-occupied |
| Less than High School | 572 (50.2%) | 567 (49.8%) |
| High School Diploma | 801 (49.0%) | 835 (51.0%) |
| College/Associate Degree | 1,260 (53.2%) | 1,108 (46.8%) |
| Bachelor's Degree or higher | 685 (66.1%) | 352 (33.9%) |
Occupancy by Age of Householder in Phillips County

| Age Bracket | # Households | % Households |
| Under 35 Years | 951 | 15.4% |
| 35 to 44 Years | 797 | 12.9% |
| 45 to 54 Years | 905 | 14.6% |
| 55 to 64 Years | 1,412 | 22.9% |
| 65 to 74 Years | 1,147 | 18.6% |
| 75 to 84 Years | 736 | 11.9% |
| 85 Years and Over | 232 | 3.7% |
| Total | 6,180 | 100.0% |
Housing Finances in Phillips County
Median Income by Occupancy in Phillips County

| Occupancy Type | # Households | Median Income |
| Owner-Occupied | 3,318 (53.7%) | $53,105 |
| Renter-Occupied | 2,862 (46.3%) | $22,235 |
| Average | 6,180 (100.0%) | $37,458 |
Occupancy by Householder Income Bracket in Phillips County

| Income Bracket | Owner-occupied | Renter-occupied |
| Less than $5,000 | 117 (3.5%) | 331 (11.6%) |
| $5,000 to $9,999 | 41 (1.2%) | 141 (4.9%) |
| $10,000 to $14,999 | 189 (5.7%) | 587 (20.5%) |
| $15,000 to $19,999 | 285 (8.6%) | 254 (8.9%) |
| $20,000 to $24,999 | 219 (6.6%) | 220 (7.7%) |
| $25,000 to $34,999 | 293 (8.8%) | 239 (8.4%) |
| $35,000 to $49,999 | 368 (11.1%) | 412 (14.4%) |
| $50,000 to $74,999 | 651 (19.6%) | 303 (10.6%) |
| $75,000 to $99,999 | 337 (10.2%) | 265 (9.3%) |
| $100,000 to $149,999 | 600 (18.1%) | 88 (3.1%) |
| $150,000 or more | 218 (6.6%) | 22 (0.8%) |
| Total | 3,318 (100.0%) | 2,862 (100.0%) |
Monthly Housing Cost Tiers in Phillips County

| Monthly Cost | Owner-occupied | Renter-occupied |
| Less than $300 | 689 (20.8%) | 152 (5.3%) |
| $300 to $499 | 935 (28.2%) | 520 (18.2%) |
| $500 to $799 | 789 (23.8%) | 764 (26.7%) |
| $800 to $999 | 250 (7.5%) | 434 (15.2%) |
| $1,000 to $1,499 | 492 (14.8%) | 508 (17.7%) |
| $1,500 to $1,999 | 115 (3.5%) | 34 (1.2%) |
| $2,000 to $2,499 | 23 (0.7%) | 0 (0.0%) |
| $2,500 to $2,999 | 16 (0.5%) | 0 (0.0%) |
| $3,000 or more | 9 (0.3%) | 0 (0.0%) |
| Total | 3,318 (100.0%) | 2,862 (100.0%) |
Physical Housing Characteristics in Phillips County
Housing Structures in Phillips County

| Structure Type | # Housing Units | % Housing Units |
| Single Unit, Detached | 4,457 | 72.1% |
| Single Unit, Attached | 44 | 0.7% |
| 2 Unit Apartments | 330 | 5.3% |
| 3 or 4 Unit Apartments | 260 | 4.2% |
| 5 to 9 Unit Apartments | 154 | 2.5% |
| 10 or more Apartments | 229 | 3.7% |
| Mobile Home / Other | 706 | 11.4% |
| Total | 6,180 | 100.0% |
Housing Structures by Occupancy in Phillips County

| Structure Type | Owner-occupied | Renter-occupied |
| Single Unit, Detached | 2,809 (63.0%) | 1,648 (37.0%) |
| Single Unit, Attached | 26 (59.1%) | 18 (40.9%) |
| 2 Unit Apartments | 5 (1.5%) | 325 (98.5%) |
| 3 or 4 Unit Apartments | 0 (0.0%) | 260 (100.0%) |
| 5 to 9 Unit Apartments | 0 (0.0%) | 154 (100.0%) |
| 10 or more Apartments | 0 (0.0%) | 229 (100.0%) |
| Mobile Home / Other | 478 (67.7%) | 228 (32.3%) |
| Total | 3,318 (53.7%) | 2,862 (46.3%) |
Housing Structures by Number of Rooms in Phillips County
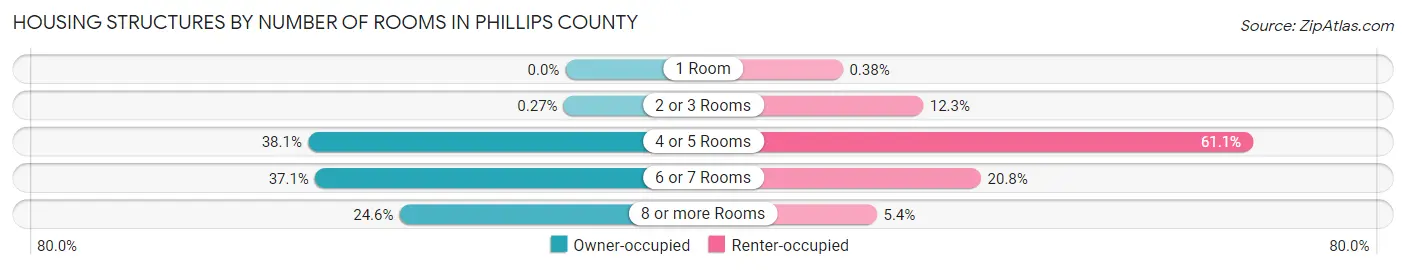
| Number of Rooms | Owner-occupied | Renter-occupied |
| 1 Room | 0 (0.0%) | 11 (0.4%) |
| 2 or 3 Rooms | 9 (0.3%) | 351 (12.3%) |
| 4 or 5 Rooms | 1,264 (38.1%) | 1,749 (61.1%) |
| 6 or 7 Rooms | 1,230 (37.1%) | 596 (20.8%) |
| 8 or more Rooms | 815 (24.6%) | 155 (5.4%) |
| Total | 3,318 (100.0%) | 2,862 (100.0%) |
Housing Structure by Heating Type in Phillips County

| Heating Type | Owner-occupied | Renter-occupied |
| Utility Gas | 2,019 (60.9%) | 1,367 (47.8%) |
| Bottled, Tank, or LP Gas | 415 (12.5%) | 178 (6.2%) |
| Electricity | 820 (24.7%) | 1,310 (45.8%) |
| Fuel Oil or Kerosene | 0 (0.0%) | 0 (0.0%) |
| Coal or Coke | 0 (0.0%) | 0 (0.0%) |
| All other Fuels | 64 (1.9%) | 7 (0.2%) |
| No Fuel Used | 0 (0.0%) | 0 (0.0%) |
| Total | 3,318 (100.0%) | 2,862 (100.0%) |
Household Vehicle Usage in Phillips County

| Vehicles per Household | Owner-occupied | Renter-occupied |
| No Vehicle | 63 (1.9%) | 799 (27.9%) |
| 1 Vehicle | 1,012 (30.5%) | 1,414 (49.4%) |
| 2 Vehicles | 1,493 (45.0%) | 377 (13.2%) |
| 3 or more Vehicles | 750 (22.6%) | 272 (9.5%) |
| Total | 3,318 (100.0%) | 2,862 (100.0%) |
Real Estate & Mortgages in Phillips County
Real Estate and Mortgage Overview in Phillips County
| Characteristic | Without Mortgage | With Mortgage |
| Housing Units | 2,277 | 1,041 |
| Median Property Value | $61,500 | $107,800 |
| Median Household Income | $39,688 | $85 |
| Monthly Housing Costs | $402 | $9 |
| Real Estate Taxes | $329 | $112 |
Property Value by Mortgage Status in Phillips County

| Property Value | Without Mortgage | With Mortgage |
| Less than $50,000 | 913 (40.1%) | 119 (11.4%) |
| $50,000 to $99,999 | 785 (34.5%) | 363 (34.9%) |
| $100,000 to $299,999 | 460 (20.2%) | 521 (50.0%) |
| $300,000 to $499,999 | 98 (4.3%) | 22 (2.1%) |
| $500,000 to $749,999 | 0 (0.0%) | 7 (0.7%) |
| $750,000 to $999,999 | 15 (0.7%) | 9 (0.9%) |
| $1,000,000 or more | 6 (0.3%) | 0 (0.0%) |
| Total | 2,277 (100.0%) | 1,041 (100.0%) |
Household Income by Mortgage Status in Phillips County
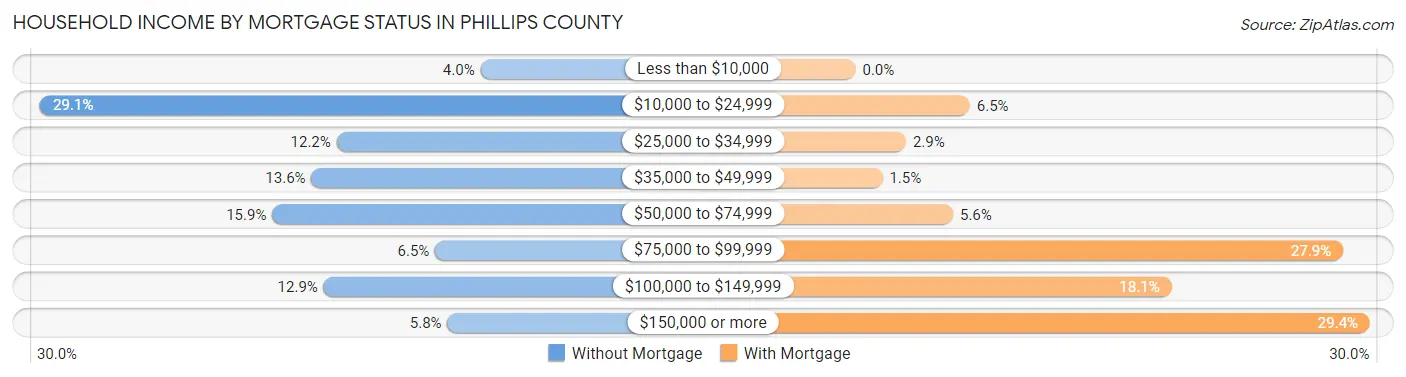
| Household Income | Without Mortgage | With Mortgage |
| Less than $10,000 | 90 (4.0%) | 0 (0.0%) |
| $10,000 to $24,999 | 663 (29.1%) | 68 (6.5%) |
| $25,000 to $34,999 | 277 (12.2%) | 30 (2.9%) |
| $35,000 to $49,999 | 310 (13.6%) | 16 (1.5%) |
| $50,000 to $74,999 | 361 (15.9%) | 58 (5.6%) |
| $75,000 to $99,999 | 149 (6.5%) | 290 (27.9%) |
| $100,000 to $149,999 | 294 (12.9%) | 188 (18.1%) |
| $150,000 or more | 133 (5.8%) | 306 (29.4%) |
| Total | 2,277 (100.0%) | 1,041 (100.0%) |
Property Value to Household Income Ratio in Phillips County

| Value-to-Income Ratio | Without Mortgage | With Mortgage |
| Less than 2.0x | 1,373 (60.3%) | 78,338 (7,525.3%) |
| 2.0x to 2.9x | 439 (19.3%) | 724 (69.6%) |
| 3.0x to 3.9x | 177 (7.8%) | 129 (12.4%) |
| 4.0x or more | 265 (11.6%) | 90 (8.6%) |
| Total | 2,277 (100.0%) | 1,041 (100.0%) |
Real Estate Taxes by Mortgage Status in Phillips County
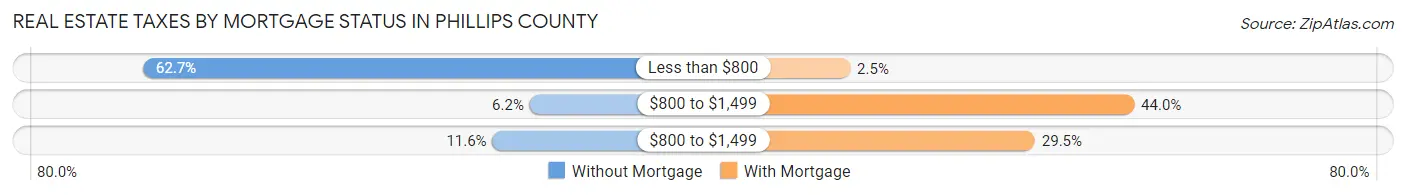
| Property Taxes | Without Mortgage | With Mortgage |
| Less than $800 | 1,428 (62.7%) | 26 (2.5%) |
| $800 to $1,499 | 141 (6.2%) | 458 (44.0%) |
| $800 to $1,499 | 265 (11.6%) | 307 (29.5%) |
| Total | 2,277 (100.0%) | 1,041 (100.0%) |
Health & Disability in Phillips County
Health Insurance Coverage by Age in Phillips County

| Age Bracket | With Coverage | Without Coverage |
| Under 6 Years | 1,303 (98.8%) | 16 (1.2%) |
| 6 to 18 Years | 3,100 (95.0%) | 162 (5.0%) |
| 19 to 25 Years | 898 (76.0%) | 284 (24.0%) |
| 26 to 34 Years | 1,424 (90.5%) | 149 (9.5%) |
| 35 to 44 Years | 1,478 (85.3%) | 254 (14.7%) |
| 45 to 54 Years | 1,518 (89.4%) | 180 (10.6%) |
| 55 to 64 Years | 2,164 (93.8%) | 144 (6.2%) |
| 65 to 74 Years | 1,853 (97.9%) | 40 (2.1%) |
| 75 Years and older | 1,231 (100.0%) | 0 (0.0%) |
| Total | 14,969 (92.4%) | 1,229 (7.6%) |
Health Insurance Coverage by Citizenship Status in Phillips County

| Citizenship Status | With Coverage | Without Coverage |
| Native Born | 1,303 (98.8%) | 16 (1.2%) |
| Foreign Born, Citizen | 3,100 (95.0%) | 162 (5.0%) |
| Foreign Born, not a Citizen | 898 (76.0%) | 284 (24.0%) |
Health Insurance Coverage by Household Income in Phillips County

| Household Income | With Coverage | Without Coverage |
| Under $25,000 | 4,648 (89.6%) | 537 (10.4%) |
| $25,000 to $49,999 | 2,919 (90.8%) | 296 (9.2%) |
| $50,000 to $74,999 | 2,427 (91.9%) | 213 (8.1%) |
| $75,000 to $99,999 | 2,075 (94.4%) | 124 (5.6%) |
| $100,000 and over | 2,822 (98.0%) | 59 (2.1%) |
Public vs Private Health Insurance Coverage by Age in Phillips County

| Age Bracket | Public Insurance | Private Insurance |
| Under 6 | 1,168 (88.5%) | 135 (10.2%) |
| 6 to 18 Years | 2,425 (74.3%) | 819 (25.1%) |
| 19 to 25 Years | 498 (42.1%) | 423 (35.8%) |
| 25 to 34 Years | 785 (49.9%) | 669 (42.5%) |
| 35 to 44 Years | 688 (39.7%) | 834 (48.1%) |
| 45 to 54 Years | 498 (29.3%) | 1,099 (64.7%) |
| 55 to 64 Years | 1,121 (48.6%) | 1,183 (51.3%) |
| 65 to 74 Years | 1,717 (90.7%) | 1,017 (53.7%) |
| 75 Years and over | 1,211 (98.4%) | 575 (46.7%) |
| Total | 10,111 (62.4%) | 6,754 (41.7%) |
Disability Status by Sex by Age in Phillips County
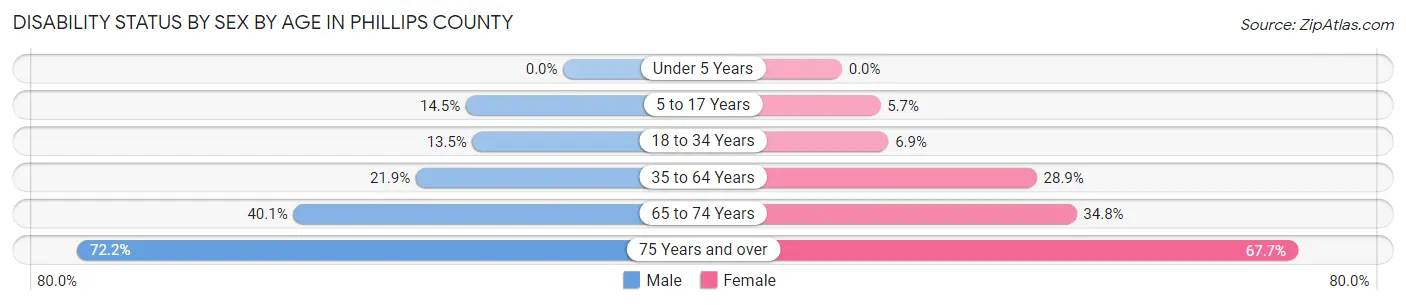
| Age Bracket | Male | Female |
| Under 5 Years | 0 (0.0%) | 0 (0.0%) |
| 5 to 17 Years | 221 (14.4%) | 94 (5.7%) |
| 18 to 34 Years | 185 (13.5%) | 113 (6.9%) |
| 35 to 64 Years | 573 (21.9%) | 902 (28.9%) |
| 65 to 74 Years | 341 (40.1%) | 363 (34.8%) |
| 75 Years and over | 343 (72.2%) | 512 (67.7%) |
Disability Class by Sex by Age in Phillips County
Disability Class: Hearing Difficulty

| Age Bracket | Male | Female |
| Under 5 Years | 0 (0.0%) | 0 (0.0%) |
| 5 to 17 Years | 0 (0.0%) | 68 (4.1%) |
| 18 to 34 Years | 0 (0.0%) | 0 (0.0%) |
| 35 to 64 Years | 132 (5.0%) | 96 (3.1%) |
| 65 to 74 Years | 74 (8.7%) | 56 (5.4%) |
| 75 Years and over | 212 (44.6%) | 181 (23.9%) |
Disability Class: Vision Difficulty

| Age Bracket | Male | Female |
| Under 5 Years | 0 (0.0%) | 0 (0.0%) |
| 5 to 17 Years | 7 (0.5%) | 17 (1.0%) |
| 18 to 34 Years | 28 (2.0%) | 41 (2.5%) |
| 35 to 64 Years | 108 (4.1%) | 184 (5.9%) |
| 65 to 74 Years | 59 (6.9%) | 14 (1.3%) |
| 75 Years and over | 49 (10.3%) | 184 (24.3%) |
Disability Class: Cognitive Difficulty

| Age Bracket | Male | Female |
| 5 to 17 Years | 124 (8.1%) | 9 (0.5%) |
| 18 to 34 Years | 138 (10.0%) | 36 (2.2%) |
| 35 to 64 Years | 211 (8.1%) | 311 (10.0%) |
| 65 to 74 Years | 133 (15.6%) | 86 (8.3%) |
| 75 Years and over | 69 (14.5%) | 157 (20.8%) |
Disability Class: Ambulatory Difficulty

| Age Bracket | Male | Female |
| 5 to 17 Years | 4 (0.3%) | 0 (0.0%) |
| 18 to 34 Years | 28 (2.0%) | 0 (0.0%) |
| 35 to 64 Years | 391 (14.9%) | 692 (22.2%) |
| 65 to 74 Years | 252 (29.6%) | 193 (18.5%) |
| 75 Years and over | 208 (43.8%) | 377 (49.9%) |
Disability Class: Self-Care Difficulty

| Age Bracket | Male | Female |
| 5 to 17 Years | 95 (6.2%) | 2 (0.1%) |
| 18 to 34 Years | 67 (4.9%) | 0 (0.0%) |
| 35 to 64 Years | 159 (6.1%) | 226 (7.2%) |
| 65 to 74 Years | 119 (14.0%) | 60 (5.8%) |
| 75 Years and over | 106 (22.3%) | 160 (21.2%) |
Technology Access in Phillips County
Computing Device Access in Phillips County

| Device Type | # Households | % Households |
| Desktop or Laptop | 3,303 | 53.4% |
| Smartphone | 4,830 | 78.2% |
| Tablet | 2,966 | 48.0% |
| No Computing Device | 1,102 | 17.8% |
| Total | 6,180 | 100.0% |
Internet Access in Phillips County

| Internet Type | # Households | % Households |
| Dial-Up Internet | 0 | 0.0% |
| Broadband Home | 2,924 | 47.3% |
| Cellular Data Only | 1,360 | 22.0% |
| Satellite Internet | 753 | 12.2% |
| No Internet | 1,476 | 23.9% |
| Total | 6,180 | 100.0% |
Phillips County Summary
Phillips County is located in the eastern part of Arkansas, in the Mississippi Delta region. It is bordered by Lee County to the north, Monroe County to the east, St. Francis County to the south, and Desha County to the west. The county seat is Helena-West Helena, which is also the largest city in the county. Phillips County covers an area of 745 square miles and has a population of 21,757, according to the 2010 census.
History
Phillips County was established in 1820 and named after Sylvanus Phillips, a prominent early settler. The county was originally part of Arkansas County, which was divided into several smaller counties in 1820. The county was initially populated by Native Americans, including the Quapaw, Tunica, and Chickasaw tribes.
The county was also home to a large number of African Americans, who were brought to the area as slaves. After the Civil War, many African Americans stayed in the area and became sharecroppers. The county was also home to a large number of immigrants from Europe, particularly from Germany and Ireland.
Geography
Phillips County is located in the Mississippi Delta region of Arkansas. The county is mostly flat, with some rolling hills in the northern part of the county. The county is drained by the St. Francis River, which flows through the county from north to south. The county is also home to several lakes, including Lake Frierson and Lake Lee.
The county has a humid subtropical climate, with hot, humid summers and mild winters. The average annual temperature is around 64°F, and the average annual precipitation is around 48 inches.
Economy
Agriculture is the main economic activity in Phillips County. The county is home to a large number of farms, which produce cotton, soybeans, corn, and rice. The county is also home to several manufacturing companies, including a paper mill and a furniture factory.
The county is also home to several casinos, which attract tourists from all over the region. Tourism is an important part of the county's economy, and the county is home to several historic sites, including the Helena-West Helena Historic District.
Demographics
According to the 2010 census, Phillips County had a population of 21,757. The racial makeup of the county was 57.3% African American, 37.2% White, 0.5% Native American, 0.3% Asian, 0.1% Pacific Islander, and 4.6% from other races. The median household income was $25,945, and the median family income was $31,945.
The county is home to a large number of churches, including Baptist, Methodist, and Catholic churches. The county is also home to several schools, including Phillips Community College of the University of Arkansas.
Common Questions
What is the Total Population of Phillips County?
Total Population of Phillips County is 16,373.
What is the Total Male Population of Phillips County?
Total Male Population of Phillips County is 7,600.
What is the Total Female Population of Phillips County?
Total Female Population of Phillips County is 8,773.
What is the Ratio of Males per 100 Females in Phillips County?
There are 86.63 Males per 100 Females in Phillips County.
What is the Ratio of Females per 100 Males in Phillips County?
There are 115.43 Females per 100 Males in Phillips County.
What is the Median Population Age in Phillips County?
Median Population Age in Phillips County is 39.7 Years.
What is the Average Family Size in Phillips County
Average Family Size in Phillips County is 3.5 People.
What is the Average Household Size in Phillips County
Average Household Size in Phillips County is 2.6 People.
What is Per Capita Income in Phillips County?
Per Capita income in Phillips County is $22,644.
What is the Median Family Income in Phillips County?
Median Family Income in Phillips County is $50,951.
What is the Median Household income in Phillips County?
Median Household Income in Phillips County is $37,458.
What is Income or Wage Gap in Phillips County?
Income or Wage Gap in Phillips County is 38.0%.
Women in Phillips County earn 62.0 cents for every dollar earned by a man.
What is Family Income Deficit in Phillips County?
Family Income Deficit in Phillips County is $14,026.
Families that are below poverty line in Phillips County earn $14,026 less on average than the poverty threshold level.
What is Inequality or Gini Index in Phillips County?
Inequality or Gini Index in Phillips County is 0.50.
How Large is the Labor Force in Phillips County?
There are 6,564 People in the Labor Forcein in Phillips County.
What is the Percentage of People in the Labor Force in Phillips County?
52.6% of People are in the Labor Force in Phillips County.
What is the Unemployment Rate in Phillips County?
Unemployment Rate in Phillips County is 13.3%.