Nevada County, AR
Nevada County Map
Nevada County Overview
8,292
TOTAL POPULATION
4,058
MALE POPULATION
4,234
FEMALE POPULATION
95.84
MALES / 100 FEMALES
104.34
FEMALES / 100 MALES
44.7
MEDIAN AGE
3.4
AVG FAMILY SIZE
2.6
AVG HOUSEHOLD SIZE
$22,041
PER CAPITA INCOME
$47,059
AVG FAMILY INCOME
$43,421
AVG HOUSEHOLD INCOME
20.9%
WAGE / INCOME GAP [ % ]
79.1¢/ $1
WAGE / INCOME GAP [ $ ]
$10,045
FAMILY INCOME DEFICIT
0.43
INEQUALITY / GINI INDEX
3,380
LABOR FORCE [ PEOPLE ]
51.3%
PERCENT IN LABOR FORCE
7.8%
UNEMPLOYMENT RATE
Nevada County Area Codes
Race in Nevada County
The most populous races in Nevada County are White / Caucasian (5,320 | 64.2%), Black / African American (2,798 | 33.7%), and Two or more Races (141 | 1.7%).

| Race | # Population | % Population |
| Asian | 13 | 0.2% |
| Black / African American | 2,798 | 33.7% |
| Hawaiian / Pacific | 8 | 0.1% |
| Hispanic or Latino | 122 | 1.5% |
| Native / Alaskan | 10 | 0.1% |
| White / Caucasian | 5,320 | 64.2% |
| Two or more Races | 141 | 1.7% |
| Some other Race | 2 | 0.0% |
| Total | 8,292 | 100.0% |
Ancestry in Nevada County
The most populous ancestries reported in Nevada County are Irish (941 | 11.4%), English (753 | 9.1%), German (299 | 3.6%), American (212 | 2.6%), and Scotch-Irish (166 | 2.0%), together accounting for 28.6% of all Nevada County residents.

| Ancestry | # Population | % Population |
| African | 1 | 0.0% |
| American | 212 | 2.6% |
| Apache | 6 | 0.1% |
| Bhutanese | 6 | 0.1% |
| Blackfeet | 2 | 0.0% |
| British | 11 | 0.1% |
| Cajun | 12 | 0.1% |
| Cherokee | 11 | 0.1% |
| Choctaw | 3 | 0.0% |
| Czechoslovakian | 103 | 1.2% |
| Danish | 2 | 0.0% |
| Dutch | 16 | 0.2% |
| English | 753 | 9.1% |
| European | 26 | 0.3% |
| Fijian | 8 | 0.1% |
| French | 30 | 0.4% |
| German | 299 | 3.6% |
| Hungarian | 44 | 0.5% |
| Irish | 941 | 11.4% |
| Italian | 10 | 0.1% |
| Korean | 13 | 0.2% |
| Mexican | 120 | 1.5% |
| Norwegian | 20 | 0.2% |
| Osage | 2 | 0.0% |
| Pakistani | 21 | 0.3% |
| Polish | 11 | 0.1% |
| Scotch-Irish | 166 | 2.0% |
| Scottish | 41 | 0.5% |
| Subsaharan African | 1 | 0.0% |
| Swedish | 26 | 0.3% |
| Welsh | 17 | 0.2% | View All 31 Rows |
Immigrants in Nevada County
The most numerous immigrant groups reported in Nevada County came from Oceania (8 | 0.1%), Europe (1 | 0.0%), France (1 | 0.0%), and Western Europe (1 | 0.0%), together accounting for 0.1% of all Nevada County residents.

| Immigration Origin | # Population | % Population |
| Europe | 1 | 0.0% |
| France | 1 | 0.0% |
| Oceania | 8 | 0.1% |
| Western Europe | 1 | 0.0% | View All 4 Rows |
Sex and Age in Nevada County
Sex and Age in Nevada County
The most populous age groups in Nevada County are 15 to 19 Years (320 | 7.9%) for men and 5 to 9 Years (358 | 8.5%) for women.

| Age Bracket | Male | Female |
| Under 5 Years | 258 (6.4%) | 204 (4.8%) |
| 5 to 9 Years | 274 (6.8%) | 358 (8.5%) |
| 10 to 14 Years | 304 (7.5%) | 275 (6.5%) |
| 15 to 19 Years | 320 (7.9%) | 120 (2.8%) |
| 20 to 24 Years | 233 (5.7%) | 289 (6.8%) |
| 25 to 29 Years | 99 (2.4%) | 199 (4.7%) |
| 30 to 34 Years | 179 (4.4%) | 154 (3.6%) |
| 35 to 39 Years | 209 (5.1%) | 318 (7.5%) |
| 40 to 44 Years | 310 (7.6%) | 111 (2.6%) |
| 45 to 49 Years | 243 (6.0%) | 354 (8.4%) |
| 50 to 54 Years | 274 (6.8%) | 275 (6.5%) |
| 55 to 59 Years | 299 (7.4%) | 339 (8.0%) |
| 60 to 64 Years | 276 (6.8%) | 279 (6.6%) |
| 65 to 69 Years | 192 (4.7%) | 248 (5.9%) |
| 70 to 74 Years | 276 (6.8%) | 252 (5.9%) |
| 75 to 79 Years | 123 (3.0%) | 130 (3.1%) |
| 80 to 84 Years | 118 (2.9%) | 136 (3.2%) |
| 85 Years and over | 71 (1.8%) | 193 (4.6%) |
| Total | 4,058 (100.0%) | 4,234 (100.0%) |
Families and Households in Nevada County
Median Family Size in Nevada County
The median family size in Nevada County is 3.40 persons per family, with single female/mother families (616 | 31.1%) accounting for the largest median family size of 3.63 persons per family. On the other hand, married-couple families (1,142 | 57.7%) represent the smallest median family size with 3.26 persons per family.

| Family Type | # Families | Family Size |
| Married-Couple | 1,142 (57.7%) | 3.26 |
| Single Male/Father | 220 (11.1%) | 3.49 |
| Single Female/Mother | 616 (31.1%) | 3.63 |
| Total Families | 1,978 (100.0%) | 3.40 |
Median Household Size in Nevada County
The median household size in Nevada County is 2.57 persons per household, with single female/mother households (616 | 19.5%) accounting for the largest median household size of 3.71 persons per household. non-family households (1,176 | 37.3%) represent the smallest median household size with 1.07 persons per household.

| Household Type | # Households | Household Size |
| Married-Couple | 1,142 (36.2%) | 3.28 |
| Single Male/Father | 220 (7.0%) | 3.66 |
| Single Female/Mother | 616 (19.5%) | 3.71 |
| Non-family | 1,176 (37.3%) | 1.07 |
| Total Households | 3,154 (100.0%) | 2.57 |
Household Size by Marriage Status in Nevada County
Out of a total of 3,154 households in Nevada County, 1,978 (62.7%) are family households, while 1,176 (37.3%) are nonfamily households. The most numerous type of family households are 2-person households, comprising 936, and the most common type of nonfamily households are 1-person households, comprising 1,122.

| Household Size | Family Households | Nonfamily Households |
| 1-Person Households | - | 1,122 (35.6%) |
| 2-Person Households | 936 (29.7%) | 53 (1.7%) |
| 3-Person Households | 454 (14.4%) | 1 (0.0%) |
| 4-Person Households | 380 (12.0%) | 0 (0.0%) |
| 5-Person Households | 119 (3.8%) | 0 (0.0%) |
| 6-Person Households | 57 (1.8%) | 0 (0.0%) |
| 7+ Person Households | 32 (1.0%) | 0 (0.0%) |
| Total | 1,978 (62.7%) | 1,176 (37.3%) |
Female Fertility in Nevada County
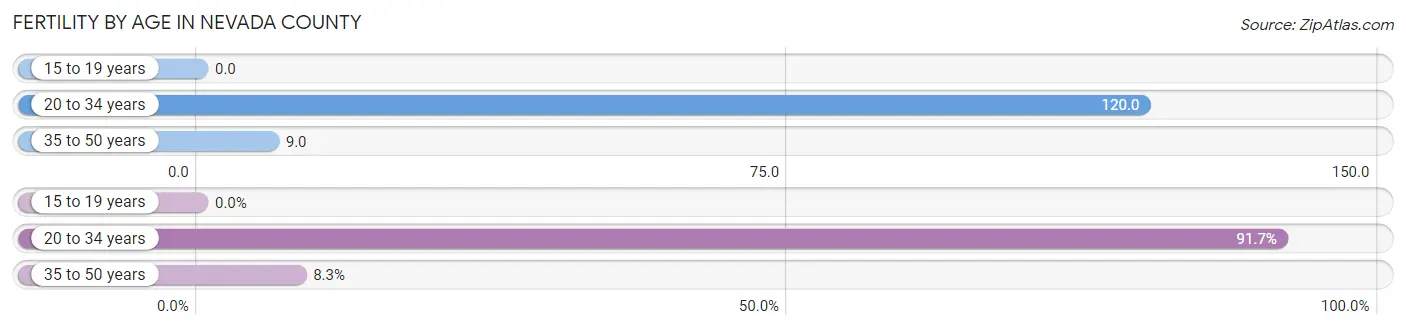
Fertility by Age in Nevada County
Average fertility rate in Nevada County is 53.0 births per 1,000 women. Women in the age bracket of 20 to 34 years have the highest fertility rate with 120.0 births per 1,000 women. Women in the age bracket of 20 to 34 years acount for 91.7% of all women with births.
| Age Bracket | Women with Births | Births / 1,000 Women |
| 15 to 19 years | 0 (0.0%) | 0.0 |
| 20 to 34 years | 77 (91.7%) | 120.0 |
| 35 to 50 years | 7 (8.3%) | 9.0 |
| Total | 84 (100.0%) | 53.0 |
Fertility by Age by Marriage Status in Nevada County
13.1% of women with births (84) in Nevada County are married. The highest percentage of unmarried women with births falls into 20 to 34 years age bracket with 94.8% of them unmarried at the time of birth, while the lowest percentage of unmarried women with births belong to 35 to 50 years age bracket with 0.0% of them unmarried.

| Age Bracket | Married | Unmarried |
| 15 to 19 years | 0 (0.0%) | 0 (0.0%) |
| 20 to 34 years | 4 (5.2%) | 73 (94.8%) |
| 35 to 50 years | 7 (100.0%) | 0 (0.0%) |
| Total | 11 (13.1%) | 73 (86.9%) |
Fertility by Education in Nevada County

| Educational Attainment | Women with Births | Births / 1,000 Women |
| Less than High School | 0 (0.0%) | 0.0 |
| High School Diploma | 59 (70.2%) | 132.0 |
| College or Associate's Degree | 18 (21.4%) | 29.0 |
| Bachelor's Degree | 0 (0.0%) | 0.0 |
| Graduate Degree | 7 (8.3%) | 179.0 |
| Total | 84 (100.0%) | 53.0 |
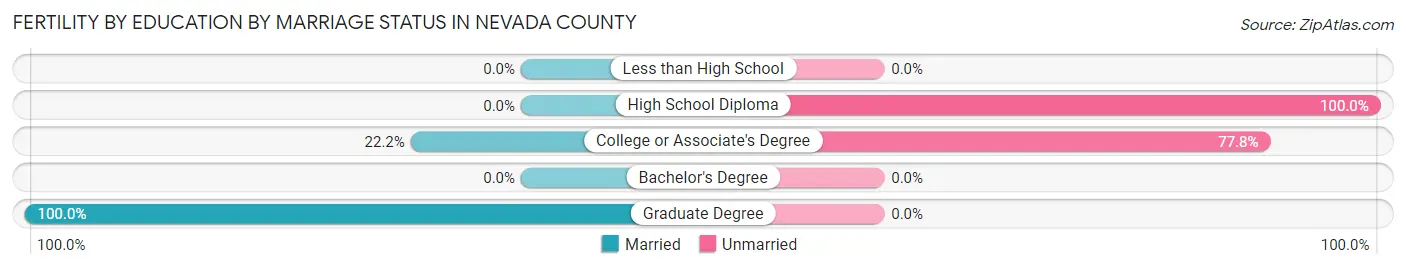
Fertility by Education by Marriage Status in Nevada County
86.9% of women with births in Nevada County are unmarried. Women with the educational attainment of graduate degree are most likely to be married with 100.0% of them married at childbirth, while women with the educational attainment of high school diploma are least likely to be married with 100.0% of them unmarried at childbirth.
| Educational Attainment | Married | Unmarried |
| Less than High School | 0 (0.0%) | 0 (0.0%) |
| High School Diploma | 0 (0.0%) | 59 (100.0%) |
| College or Associate's Degree | 4 (22.2%) | 14 (77.8%) |
| Bachelor's Degree | 0 (0.0%) | 0 (0.0%) |
| Graduate Degree | 7 (100.0%) | 0 (0.0%) |
| Total | 11 (13.1%) | 73 (86.9%) |
Income in Nevada County
Income Overview in Nevada County
Per Capita Income in Nevada County is $22,041, while median incomes of families and households are $47,059 and $43,421 respectively.
| Characteristic | Number | Measure |
| Per Capita Income | 8,292 | $22,041 |
| Median Family Income | 1,978 | $47,059 |
| Mean Family Income | 1,978 | $57,535 |
| Median Household Income | 3,154 | $43,421 |
| Mean Household Income | 3,154 | $51,512 |
| Income Deficit | 1,978 | $10,045 |
| Wage / Income Gap (%) | 8,292 | 20.86% |
| Wage / Income Gap ($) | 8,292 | 79.14¢ per $1 |
| Gini / Inequality Index | 8,292 | 0.43 |
Earnings by Sex in Nevada County
Average Earnings in Nevada County are $28,354, $31,349 for men and $24,809 for women, a difference of 20.9%.

| Sex | Number | Average Earnings |
| Male | 1,673 (48.8%) | $31,349 |
| Female | 1,757 (51.2%) | $24,809 |
| Total | 3,430 (100.0%) | $28,354 |
Earnings by Sex by Income Bracket in Nevada County
The most common earnings brackets in Nevada County are $40,000 to $44,999 for men (178 | 10.6%) and $10,000 to $12,499 for women (217 | 12.3%).

| Income | Male | Female |
| $2,499 or less | 110 (6.6%) | 71 (4.0%) |
| $2,500 to $4,999 | 24 (1.4%) | 38 (2.2%) |
| $5,000 to $7,499 | 68 (4.1%) | 5 (0.3%) |
| $7,500 to $9,999 | 50 (3.0%) | 111 (6.3%) |
| $10,000 to $12,499 | 27 (1.6%) | 217 (12.3%) |
| $12,500 to $14,999 | 35 (2.1%) | 178 (10.1%) |
| $15,000 to $17,499 | 161 (9.6%) | 67 (3.8%) |
| $17,500 to $19,999 | 50 (3.0%) | 90 (5.1%) |
| $20,000 to $22,499 | 58 (3.5%) | 47 (2.7%) |
| $22,500 to $24,999 | 87 (5.2%) | 59 (3.4%) |
| $25,000 to $29,999 | 112 (6.7%) | 185 (10.5%) |
| $30,000 to $34,999 | 169 (10.1%) | 28 (1.6%) |
| $35,000 to $39,999 | 121 (7.2%) | 211 (12.0%) |
| $40,000 to $44,999 | 178 (10.6%) | 92 (5.2%) |
| $45,000 to $49,999 | 118 (7.0%) | 103 (5.9%) |
| $50,000 to $54,999 | 32 (1.9%) | 126 (7.2%) |
| $55,000 to $64,999 | 132 (7.9%) | 6 (0.3%) |
| $65,000 to $74,999 | 51 (3.0%) | 75 (4.3%) |
| $75,000 to $99,999 | 41 (2.5%) | 42 (2.4%) |
| $100,000+ | 49 (2.9%) | 6 (0.3%) |
| Total | 1,673 (100.0%) | 1,757 (100.0%) |
Earnings by Sex by Educational Attainment in Nevada County
Average earnings in Nevada County are $39,309 for men and $28,707 for women, a difference of 27.0%. Men with an educational attainment of bachelor's degree enjoy the highest average annual earnings of $102,639, while those with less than high school education earn the least with $24,561. Women with an educational attainment of graduate degree earn the most with the average annual earnings of $44,821, while those with less than high school education have the smallest earnings of $9,394.

| Educational Attainment | Male Income | Female Income |
| Less than High School | $24,561 | $9,394 |
| High School Diploma | $38,482 | $21,643 |
| College or Associate's Degree | $41,174 | $28,299 |
| Bachelor's Degree | $102,639 | $42,411 |
| Graduate Degree | - | - |
| Total | $39,309 | $28,707 |
Family Income in Nevada County
Family Income Brackets in Nevada County
According to the Nevada County family income data, there are 504 families falling into the $50,000 to $74,999 income range, which is the most common income bracket and makes up 25.5% of all families. Conversely, the $200,000+ income bracket is the least frequent group with only 14 families (0.7%) belonging to this category.

| Income Bracket | # Families | % Families |
| Less than $10,000 | 127 | 6.4% |
| $10,000 to $14,999 | 93 | 4.7% |
| $15,000 to $24,999 | 263 | 13.3% |
| $25,000 to $34,999 | 152 | 7.7% |
| $35,000 to $49,999 | 429 | 21.7% |
| $50,000 to $74,999 | 504 | 25.5% |
| $75,000 to $99,999 | 196 | 9.9% |
| $100,000 to $149,999 | 146 | 7.4% |
| $150,000 to $199,999 | 53 | 2.7% |
| $200,000+ | 14 | 0.7% |
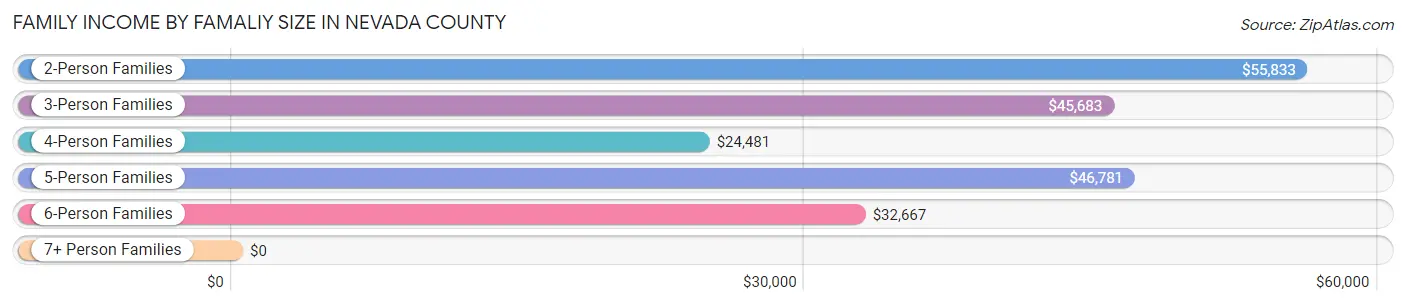
Family Income by Famaliy Size in Nevada County
2-person families (988 | 49.9%) account for the highest median family income in Nevada County with $55,833 per family, while 2-person families (988 | 49.9%) have the highest median income of $27,916 per family member.
| Income Bracket | # Families | Median Income |
| 2-Person Families | 988 (49.9%) | $55,833 |
| 3-Person Families | 445 (22.5%) | $45,683 |
| 4-Person Families | 356 (18.0%) | $24,481 |
| 5-Person Families | 105 (5.3%) | $46,781 |
| 6-Person Families | 52 (2.6%) | $32,667 |
| 7+ Person Families | 32 (1.6%) | $0 |
| Total | 1,978 (100.0%) | $47,059 |
Family Income by Number of Earners in Nevada County
The median family income in Nevada County is $47,059, with families comprising 3+ earners (110) having the highest median family income of $79,688, while families with no earners (465) have the lowest median family income of $38,320, accounting for 5.6% and 23.5% of families, respectively.

| Number of Earners | # Families | Median Income |
| No Earners | 465 (23.5%) | $38,320 |
| 1 Earner | 956 (48.3%) | $42,407 |
| 2 Earners | 447 (22.6%) | $47,384 |
| 3+ Earners | 110 (5.6%) | $79,688 |
| Total | 1,978 (100.0%) | $47,059 |
Household Income in Nevada County
Household Income Brackets in Nevada County
With 703 households falling in the category, the $50,000 to $74,999 income range is the most frequent in Nevada County, accounting for 22.3% of all households. In contrast, only 44 households (1.4%) fall into the $200,000+ income bracket, making it the least populous group.

| Income Bracket | # Households | % Households |
| Less than $10,000 | 211 | 6.7% |
| $10,000 to $14,999 | 278 | 8.8% |
| $15,000 to $24,999 | 473 | 15.0% |
| $25,000 to $34,999 | 319 | 10.1% |
| $35,000 to $49,999 | 691 | 21.9% |
| $50,000 to $74,999 | 703 | 22.3% |
| $75,000 to $99,999 | 224 | 7.1% |
| $100,000 to $149,999 | 158 | 5.0% |
| $150,000 to $199,999 | 54 | 1.7% |
| $200,000+ | 44 | 1.4% |
Household Income by Householder Age in Nevada County
The median household income in Nevada County is $43,421, with the highest median household income of $46,544 found in the 45 to 64 years age bracket for the primary householder. A total of 1,375 households (43.6%) fall into this category. Meanwhile, the 15 to 24 years age bracket for the primary householder has the lowest median household income of $0, with 57 households (1.8%) in this group.

| Income Bracket | # Households | Median Income |
| 15 to 24 Years | 57 (1.8%) | $0 |
| 25 to 44 Years | 676 (21.4%) | $41,176 |
| 45 to 64 Years | 1,375 (43.6%) | $46,544 |
| 65+ Years | 1,046 (33.2%) | $42,941 |
| Total | 3,154 (100.0%) | $43,421 |
Poverty in Nevada County
Income Below Poverty by Sex and Age in Nevada County
With 25.2% poverty level for males and 30.4% for females among the residents of Nevada County, 15 year old males and under 5 year old females are the most vulnerable to poverty, with 14 males (100.0%) and 139 females (68.1%) in their respective age groups living below the poverty level.

| Age Bracket | Male | Female |
| Under 5 Years | 193 (74.8%) | 139 (68.1%) |
| 5 Years | 3 (23.1%) | 3 (3.8%) |
| 6 to 11 Years | 152 (38.2%) | 212 (58.4%) |
| 12 to 14 Years | 67 (45.0%) | 75 (46.3%) |
| 15 Years | 14 (100.0%) | 10 (62.5%) |
| 16 and 17 Years | 24 (28.9%) | 39 (50.6%) |
| 18 to 24 Years | 65 (14.2%) | 125 (39.6%) |
| 25 to 34 Years | 62 (22.9%) | 90 (25.5%) |
| 35 to 44 Years | 215 (42.7%) | 184 (42.9%) |
| 45 to 54 Years | 105 (20.6%) | 127 (20.2%) |
| 55 to 64 Years | 82 (14.3%) | 88 (14.7%) |
| 65 to 74 Years | 10 (2.2%) | 96 (19.3%) |
| 75 Years and over | 9 (3.0%) | 59 (15.5%) |
| Total | 1,001 (25.2%) | 1,247 (30.4%) |
Income Above Poverty by Sex and Age in Nevada County
According to the poverty statistics in Nevada County, males aged 65 to 74 years and females aged 5 years are the age groups that are most secure financially, with 97.8% of males and 96.2% of females in these age groups living above the poverty line.

| Age Bracket | Male | Female |
| Under 5 Years | 65 (25.2%) | 65 (31.9%) |
| 5 Years | 10 (76.9%) | 76 (96.2%) |
| 6 to 11 Years | 246 (61.8%) | 151 (41.6%) |
| 12 to 14 Years | 82 (55.0%) | 87 (53.7%) |
| 15 Years | 0 (0.0%) | 6 (37.5%) |
| 16 and 17 Years | 59 (71.1%) | 38 (49.3%) |
| 18 to 24 Years | 391 (85.8%) | 191 (60.4%) |
| 25 to 34 Years | 209 (77.1%) | 263 (74.5%) |
| 35 to 44 Years | 288 (57.3%) | 245 (57.1%) |
| 45 to 54 Years | 405 (79.4%) | 502 (79.8%) |
| 55 to 64 Years | 493 (85.7%) | 511 (85.3%) |
| 65 to 74 Years | 437 (97.8%) | 401 (80.7%) |
| 75 Years and over | 289 (97.0%) | 321 (84.5%) |
| Total | 2,974 (74.8%) | 2,857 (69.6%) |
Income Below Poverty Among Married-Couple Families in Nevada County
The poverty statistics for married-couple families in Nevada County show that 17.9% or 204 of the total 1,142 families live below the poverty line. Families with 1 or 2 children have the highest poverty rate of 40.0%, comprising of 157 families. On the other hand, families with no children have the lowest poverty rate of 3.4%, which includes 22 families.
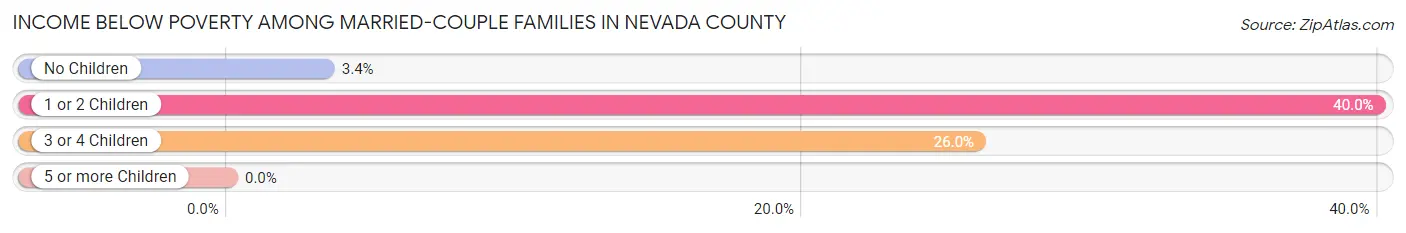
| Children | Above Poverty | Below Poverty |
| No Children | 631 (96.6%) | 22 (3.4%) |
| 1 or 2 Children | 236 (60.1%) | 157 (40.0%) |
| 3 or 4 Children | 71 (74.0%) | 25 (26.0%) |
| 5 or more Children | 0 (0.0%) | 0 (0.0%) |
| Total | 938 (82.1%) | 204 (17.9%) |
Income Below Poverty Among Single-Parent Households in Nevada County
According to the poverty data in Nevada County, 16.8% or 37 single-father households and 41.2% or 254 single-mother households are living below the poverty line. Among single-father households, those with 3 or 4 children have the highest poverty rate, with 2 households (100.0%) experiencing poverty. Likewise, among single-mother households, those with 3 or 4 children have the highest poverty rate, with 41 households (74.6%) falling below the poverty line.

| Children | Single Father | Single Mother |
| No Children | 0 (0.0%) | 13 (6.2%) |
| 1 or 2 Children | 35 (89.7%) | 200 (56.8%) |
| 3 or 4 Children | 2 (100.0%) | 41 (74.6%) |
| 5 or more Children | 0 (0.0%) | 0 (0.0%) |
| Total | 37 (16.8%) | 254 (41.2%) |
Income Below Poverty Among Married-Couple vs Single-Parent Households in Nevada County
The poverty data for Nevada County shows that 204 of the married-couple family households (17.9%) and 291 of the single-parent households (34.8%) are living below the poverty level. Within the married-couple family households, those with 1 or 2 children have the highest poverty rate, with 157 households (40.0%) falling below the poverty line. Among the single-parent households, those with 3 or 4 children have the highest poverty rate, with 43 household (75.4%) living below poverty.

| Children | Married-Couple Families | Single-Parent Households |
| No Children | 22 (3.4%) | 13 (3.4%) |
| 1 or 2 Children | 157 (40.0%) | 235 (60.1%) |
| 3 or 4 Children | 25 (26.0%) | 43 (75.4%) |
| 5 or more Children | 0 (0.0%) | 0 (0.0%) |
| Total | 204 (17.9%) | 291 (34.8%) |
Employment Characteristics in Nevada County
Employment by Class of Employer in Nevada County
Among the 3,117 employed individuals in Nevada County, private company employees (2,164 | 69.4%), local government employees (281 | 9.0%), and not-for-profit organizations (202 | 6.5%) make up the most common classes of employment.

| Employer Class | # Employees | % Employees |
| Private Company Employees | 2,164 | 69.4% |
| Self-Employed (Incorporated) | 134 | 4.3% |
| Self-Employed (Not Incorporated) | 163 | 5.2% |
| Not-for-profit Organizations | 202 | 6.5% |
| Local Government Employees | 281 | 9.0% |
| State Government Employees | 136 | 4.4% |
| Federal Government Employees | 37 | 1.2% |
| Unpaid Family Workers | 0 | 0.0% |
| Total | 3,117 | 100.0% |
Employment Status by Age in Nevada County
According to the labor force statistics for Nevada County, out of the total population over 16 years of age (6,589), 51.3% or 3,380 individuals are in the labor force, with 7.8% or 264 of them unemployed. The age group with the highest labor force participation rate is 30 to 34 years, with 85.3% or 284 individuals in the labor force. Within the labor force, the 35 to 44 years age range has the highest percentage of unemployed individuals, with 22.5% or 140 of them being unemployed.
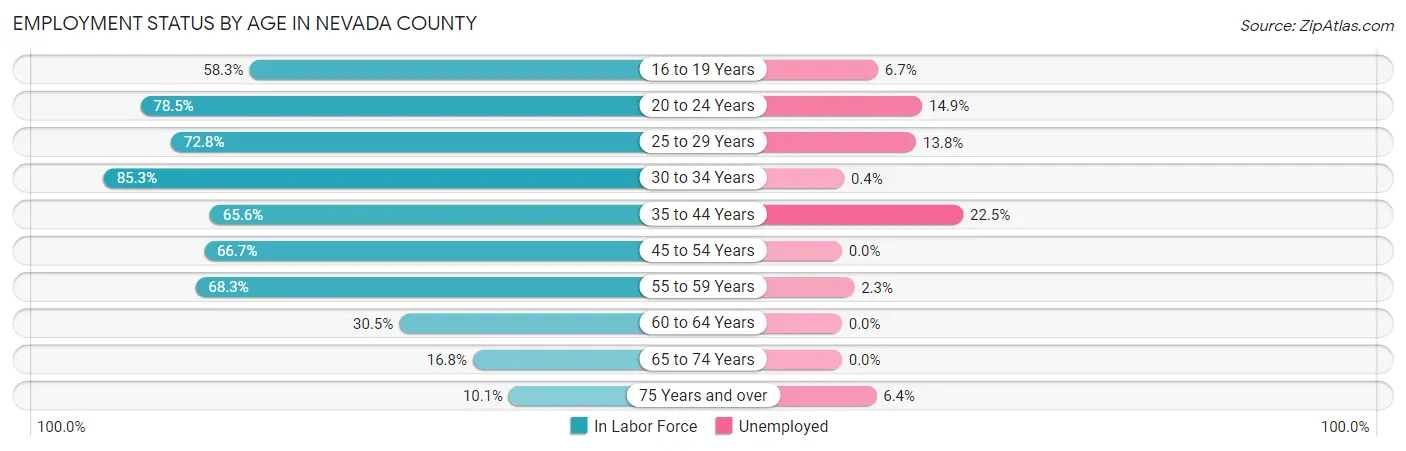
| Age Bracket | In Labor Force | Unemployed |
| 16 to 19 Years | 239 (58.3%) | 16 (6.7%) |
| 20 to 24 Years | 410 (78.5%) | 61 (14.9%) |
| 25 to 29 Years | 217 (72.8%) | 30 (13.8%) |
| 30 to 34 Years | 284 (85.3%) | 1 (0.4%) |
| 35 to 44 Years | 622 (65.6%) | 140 (22.5%) |
| 45 to 54 Years | 764 (66.7%) | 0 (0.0%) |
| 55 to 59 Years | 436 (68.3%) | 10 (2.3%) |
| 60 to 64 Years | 169 (30.5%) | 0 (0.0%) |
| 65 to 74 Years | 163 (16.8%) | 0 (0.0%) |
| 75 Years and over | 78 (10.1%) | 5 (6.4%) |
| Total | 3,380 (51.3%) | 264 (7.8%) |
Employment Status by Educational Attainment in Nevada County
According to labor force statistics for Nevada County, 63.6% of individuals (2,492) out of the total population between 25 and 64 years of age (3,918) are in the labor force, with 7.3% or 182 of them being unemployed. The group with the highest labor force participation rate are those with the educational attainment of bachelor's degree or higher, with 73.0% or 308 individuals in the labor force. Within the labor force, individuals with high school diploma education have the highest percentage of unemployment, with 13.4% or 162 of them being unemployed.

| Educational Attainment | In Labor Force | Unemployed |
| Less than High School | 142 (40.0%) | 0 (0.0%) |
| High School Diploma | 1,209 (61.2%) | 265 (13.4%) |
| College / Associate Degree | 832 (71.4%) | 5 (0.4%) |
| Bachelor's Degree or higher | 308 (73.0%) | 22 (5.2%) |
| Total | 2,492 (63.6%) | 286 (7.3%) |
Employment Occupations by Sex in Nevada County
Management, Business, Science and Arts Occupations
The most common Management, Business, Science and Arts occupations in Nevada County are Community & Social Service (280 | 9.0%), Health Diagnosing & Treating (201 | 6.4%), Education Instruction & Library (173 | 5.6%), Education, Arts & Media (107 | 3.4%), and Management (90 | 2.9%).

Management, Business, Science and Arts Occupations by Sex
Within the Management, Business, Science and Arts occupations in Nevada County, the most male-oriented occupations are Architecture & Engineering (100.0%), Management (56.7%), and Computers & Mathematics (41.7%), while the most female-oriented occupations are Education Instruction & Library (100.0%), Health Technologists (100.0%), and Health Diagnosing & Treating (99.0%).
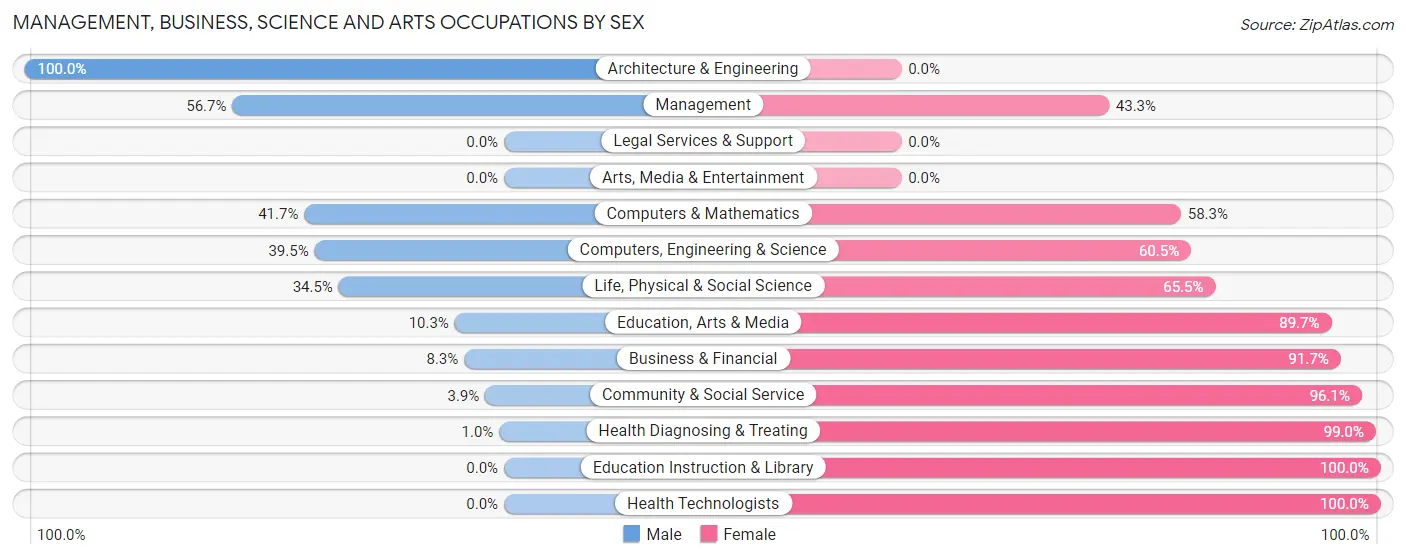
| Occupation | Male | Female |
| Management | 51 (56.7%) | 39 (43.3%) |
| Business & Financial | 3 (8.3%) | 33 (91.7%) |
| Computers, Engineering & Science | 17 (39.5%) | 26 (60.5%) |
| Computers & Mathematics | 5 (41.7%) | 7 (58.3%) |
| Architecture & Engineering | 2 (100.0%) | 0 (0.0%) |
| Life, Physical & Social Science | 10 (34.5%) | 19 (65.5%) |
| Community & Social Service | 11 (3.9%) | 269 (96.1%) |
| Education, Arts & Media | 11 (10.3%) | 96 (89.7%) |
| Legal Services & Support | 0 (0.0%) | 0 (0.0%) |
| Education Instruction & Library | 0 (0.0%) | 173 (100.0%) |
| Arts, Media & Entertainment | 0 (0.0%) | 0 (0.0%) |
| Health Diagnosing & Treating | 2 (1.0%) | 199 (99.0%) |
| Health Technologists | 0 (0.0%) | 48 (100.0%) |
| Total (Category) | 84 (12.9%) | 566 (87.1%) |
| Total (Overall) | 1,523 (48.8%) | 1,596 (51.2%) |
Services Occupations
The most common Services occupations in Nevada County are Food Preparation & Serving (353 | 11.3%), Cleaning & Maintenance (174 | 5.6%), Personal Care & Service (150 | 4.8%), Security & Protection (110 | 3.5%), and Firefighting & Prevention (102 | 3.3%).

Services Occupations by Sex
Within the Services occupations in Nevada County, the most male-oriented occupations are Firefighting & Prevention (100.0%), Security & Protection (97.3%), and Law Enforcement (62.5%), while the most female-oriented occupations are Healthcare Support (100.0%), Food Preparation & Serving (62.6%), and Personal Care & Service (55.3%).
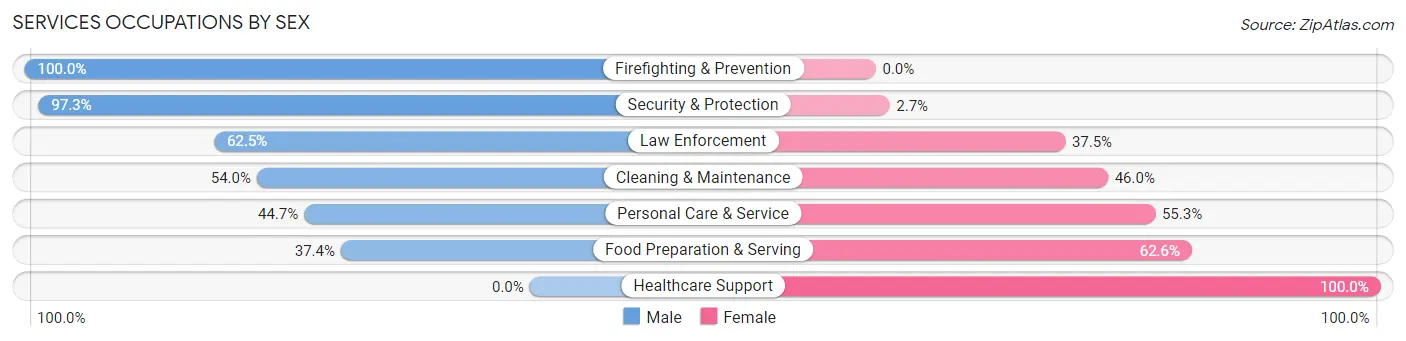
| Occupation | Male | Female |
| Healthcare Support | 0 (0.0%) | 84 (100.0%) |
| Security & Protection | 107 (97.3%) | 3 (2.7%) |
| Firefighting & Prevention | 102 (100.0%) | 0 (0.0%) |
| Law Enforcement | 5 (62.5%) | 3 (37.5%) |
| Food Preparation & Serving | 132 (37.4%) | 221 (62.6%) |
| Cleaning & Maintenance | 94 (54.0%) | 80 (46.0%) |
| Personal Care & Service | 67 (44.7%) | 83 (55.3%) |
| Total (Category) | 400 (45.9%) | 471 (54.1%) |
| Total (Overall) | 1,523 (48.8%) | 1,596 (51.2%) |
Sales and Office Occupations
The most common Sales and Office occupations in Nevada County are Office & Administration (510 | 16.4%), and Sales & Related (167 | 5.3%).

Sales and Office Occupations by Sex

| Occupation | Male | Female |
| Sales & Related | 108 (64.7%) | 59 (35.3%) |
| Office & Administration | 157 (30.8%) | 353 (69.2%) |
| Total (Category) | 265 (39.1%) | 412 (60.9%) |
| Total (Overall) | 1,523 (48.8%) | 1,596 (51.2%) |
Natural Resources, Construction and Maintenance Occupations
The most common Natural Resources, Construction and Maintenance occupations in Nevada County are Installation, Maintenance & Repair (178 | 5.7%), Construction & Extraction (119 | 3.8%), and Farming, Fishing & Forestry (39 | 1.3%).
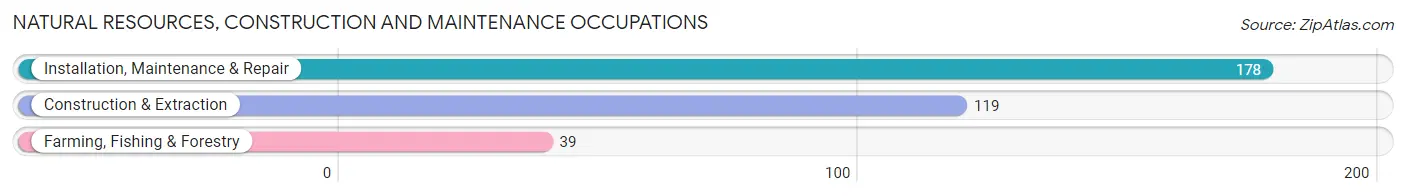
Natural Resources, Construction and Maintenance Occupations by Sex

| Occupation | Male | Female |
| Farming, Fishing & Forestry | 39 (100.0%) | 0 (0.0%) |
| Construction & Extraction | 119 (100.0%) | 0 (0.0%) |
| Installation, Maintenance & Repair | 178 (100.0%) | 0 (0.0%) |
| Total (Category) | 336 (100.0%) | 0 (0.0%) |
| Total (Overall) | 1,523 (48.8%) | 1,596 (51.2%) |
Production, Transportation and Moving Occupations
The most common Production, Transportation and Moving occupations in Nevada County are Production (280 | 9.0%), Transportation (183 | 5.9%), and Material Moving (122 | 3.9%).

Production, Transportation and Moving Occupations by Sex
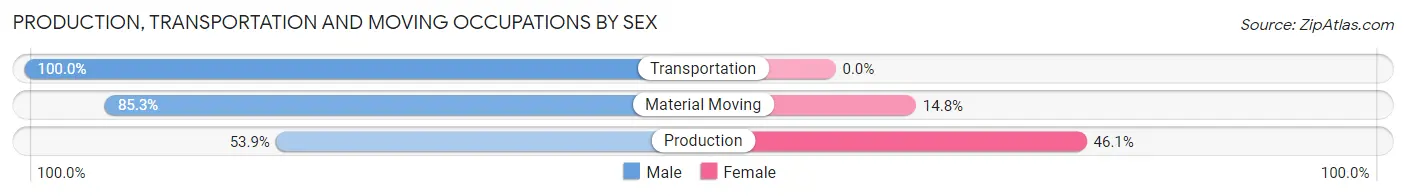
| Occupation | Male | Female |
| Production | 151 (53.9%) | 129 (46.1%) |
| Transportation | 183 (100.0%) | 0 (0.0%) |
| Material Moving | 104 (85.3%) | 18 (14.7%) |
| Total (Category) | 438 (74.9%) | 147 (25.1%) |
| Total (Overall) | 1,523 (48.8%) | 1,596 (51.2%) |
Employment Industries by Sex in Nevada County
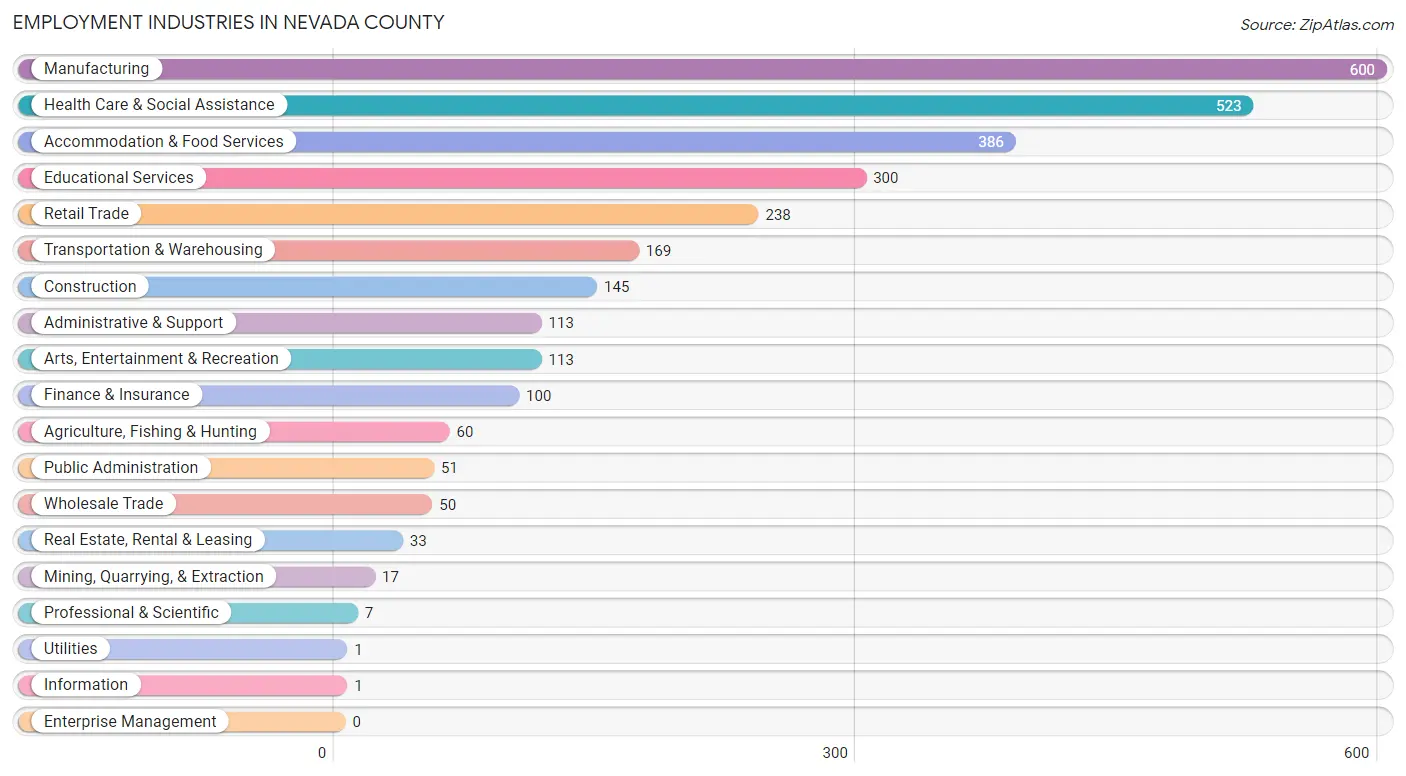
Employment Industries in Nevada County
The major employment industries in Nevada County include Manufacturing (600 | 19.2%), Health Care & Social Assistance (523 | 16.8%), Accommodation & Food Services (386 | 12.4%), Educational Services (300 | 9.6%), and Retail Trade (238 | 7.6%).
Employment Industries by Sex in Nevada County
The Nevada County industries that see more men than women are Agriculture, Fishing & Hunting (100.0%), Mining, Quarrying, & Extraction (100.0%), and Construction (100.0%), whereas the industries that tend to have a higher number of women are Professional & Scientific (100.0%), Finance & Insurance (99.0%), and Educational Services (87.3%).

| Industry | Male | Female |
| Agriculture, Fishing & Hunting | 60 (100.0%) | 0 (0.0%) |
| Mining, Quarrying, & Extraction | 17 (100.0%) | 0 (0.0%) |
| Construction | 145 (100.0%) | 0 (0.0%) |
| Manufacturing | 379 (63.2%) | 221 (36.8%) |
| Wholesale Trade | 50 (100.0%) | 0 (0.0%) |
| Retail Trade | 83 (34.9%) | 155 (65.1%) |
| Transportation & Warehousing | 127 (75.1%) | 42 (24.8%) |
| Utilities | 1 (100.0%) | 0 (0.0%) |
| Information | 1 (100.0%) | 0 (0.0%) |
| Finance & Insurance | 1 (1.0%) | 99 (99.0%) |
| Real Estate, Rental & Leasing | 26 (78.8%) | 7 (21.2%) |
| Professional & Scientific | 0 (0.0%) | 7 (100.0%) |
| Enterprise Management | 0 (0.0%) | 0 (0.0%) |
| Administrative & Support | 88 (77.9%) | 25 (22.1%) |
| Educational Services | 38 (12.7%) | 262 (87.3%) |
| Health Care & Social Assistance | 124 (23.7%) | 399 (76.3%) |
| Arts, Entertainment & Recreation | 87 (77.0%) | 26 (23.0%) |
| Accommodation & Food Services | 135 (35.0%) | 251 (65.0%) |
| Public Administration | 29 (56.9%) | 22 (43.1%) |
| Total | 1,523 (48.8%) | 1,596 (51.2%) |
Education in Nevada County
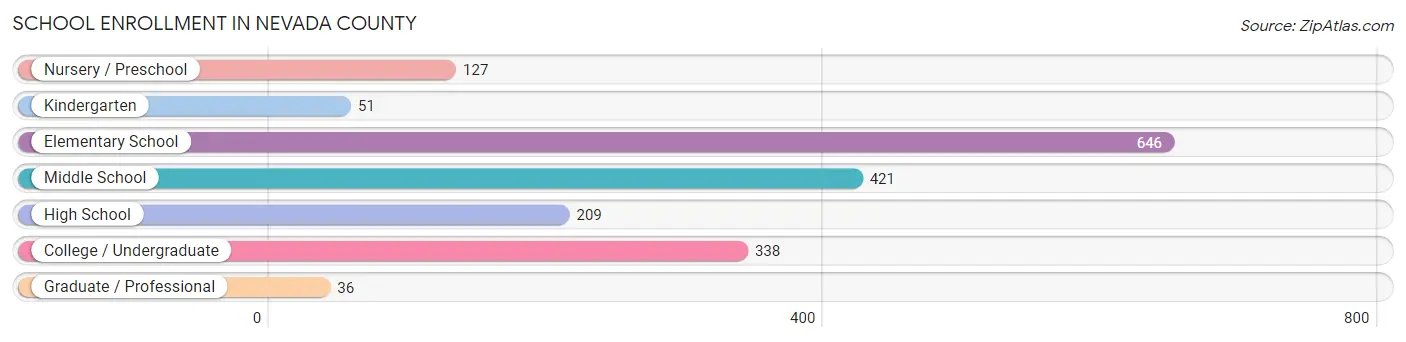
School Enrollment in Nevada County
The most common levels of schooling among the 1,828 students in Nevada County are elementary school (646 | 35.3%), middle school (421 | 23.0%), and college / undergraduate (338 | 18.5%).
| School Level | # Students | % Students |
| Nursery / Preschool | 127 | 7.0% |
| Kindergarten | 51 | 2.8% |
| Elementary School | 646 | 35.3% |
| Middle School | 421 | 23.0% |
| High School | 209 | 11.4% |
| College / Undergraduate | 338 | 18.5% |
| Graduate / Professional | 36 | 2.0% |
| Total | 1,828 | 100.0% |
School Enrollment by Age by Funding Source in Nevada County
Out of a total of 1,828 students who are enrolled in schools in Nevada County, 163 (8.9%) attend a private institution, while the remaining 1,665 (91.1%) are enrolled in public schools. The age group of 15 to 17 year olds has the highest likelihood of being enrolled in private schools, with 39 (23.8% in the age bracket) enrolled. Conversely, the age group of 3 to 4 year olds has the lowest likelihood of being enrolled in a private school, with 78 (100.0% in the age bracket) attending a public institution.

| Age Bracket | Public School | Private School |
| 3 to 4 Year Olds | 78 (100.0%) | 0 (0.0%) |
| 5 to 9 Year Old | 564 (91.9%) | 50 (8.1%) |
| 10 to 14 Year Olds | 536 (92.9%) | 41 (7.1%) |
| 15 to 17 Year Olds | 125 (76.2%) | 39 (23.8%) |
| 18 to 19 Year Olds | 75 (98.7%) | 1 (1.3%) |
| 20 to 24 Year Olds | 196 (93.8%) | 13 (6.2%) |
| 25 to 34 Year Olds | 33 (100.0%) | 0 (0.0%) |
| 35 Years and over | 59 (76.6%) | 18 (23.4%) |
| Total | 1,665 (91.1%) | 163 (8.9%) |
Educational Attainment by Field of Study in Nevada County
Education (210 | 32.8%), social sciences (85 | 13.3%), business (61 | 9.5%), psychology (59 | 9.2%), and visual & performing arts (40 | 6.2%) are the most common fields of study among 641 individuals in Nevada County who have obtained a bachelor's degree or higher.
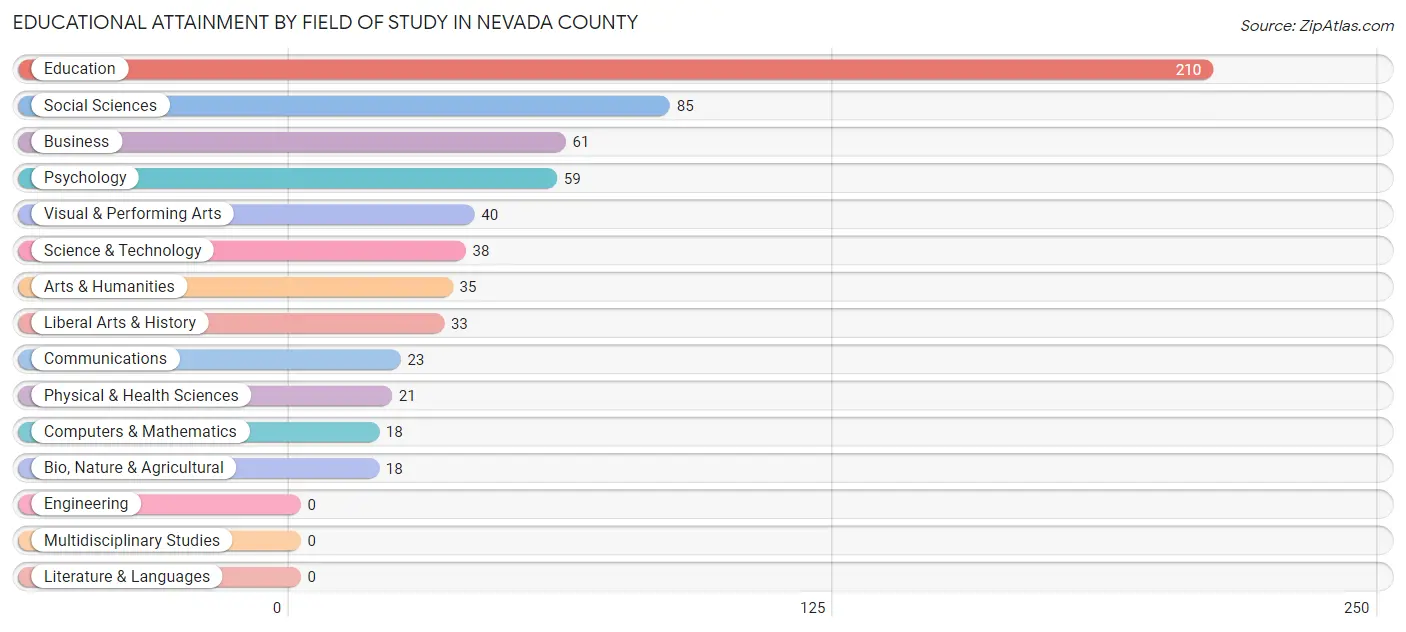
| Field of Study | # Graduates | % Graduates |
| Computers & Mathematics | 18 | 2.8% |
| Bio, Nature & Agricultural | 18 | 2.8% |
| Physical & Health Sciences | 21 | 3.3% |
| Psychology | 59 | 9.2% |
| Social Sciences | 85 | 13.3% |
| Engineering | 0 | 0.0% |
| Multidisciplinary Studies | 0 | 0.0% |
| Science & Technology | 38 | 5.9% |
| Business | 61 | 9.5% |
| Education | 210 | 32.8% |
| Literature & Languages | 0 | 0.0% |
| Liberal Arts & History | 33 | 5.1% |
| Visual & Performing Arts | 40 | 6.2% |
| Communications | 23 | 3.6% |
| Arts & Humanities | 35 | 5.5% |
| Total | 641 | 100.0% |
Transportation & Commute in Nevada County
Vehicle Availability by Sex in Nevada County
The most prevalent vehicle ownership categories in Nevada County are males with 2 vehicles (445, accounting for 29.3%) and females with 2 vehicles (744, making up 28.0%).

| Vehicles Available | Male | Female |
| No Vehicle | 0 (0.0%) | 8 (0.5%) |
| 1 Vehicle | 328 (21.6%) | 429 (27.0%) |
| 2 Vehicles | 445 (29.3%) | 744 (46.8%) |
| 3 Vehicles | 370 (24.4%) | 215 (13.5%) |
| 4 Vehicles | 212 (14.0%) | 115 (7.2%) |
| 5 or more Vehicles | 161 (10.6%) | 78 (4.9%) |
| Total | 1,516 (100.0%) | 1,589 (100.0%) |
Commute Time in Nevada County
The most frequently occuring commute durations in Nevada County are 5 to 9 minutes (613 commuters, 19.7%), 30 to 34 minutes (476 commuters, 15.3%), and 60 to 89 minutes (393 commuters, 12.7%).

| Commute Time | # Commuters | % Commuters |
| Less than 5 Minutes | 102 | 3.3% |
| 5 to 9 Minutes | 613 | 19.7% |
| 10 to 14 Minutes | 259 | 8.3% |
| 15 to 19 Minutes | 385 | 12.4% |
| 20 to 24 Minutes | 332 | 10.7% |
| 25 to 29 Minutes | 101 | 3.3% |
| 30 to 34 Minutes | 476 | 15.3% |
| 35 to 39 Minutes | 63 | 2.0% |
| 40 to 44 Minutes | 56 | 1.8% |
| 45 to 59 Minutes | 231 | 7.4% |
| 60 to 89 Minutes | 393 | 12.7% |
| 90 or more Minutes | 96 | 3.1% |
Commute Time by Sex in Nevada County
The most common commute times in Nevada County are 60 to 89 minutes (316 commuters, 20.8%) for males and 5 to 9 minutes (389 commuters, 24.5%) for females.
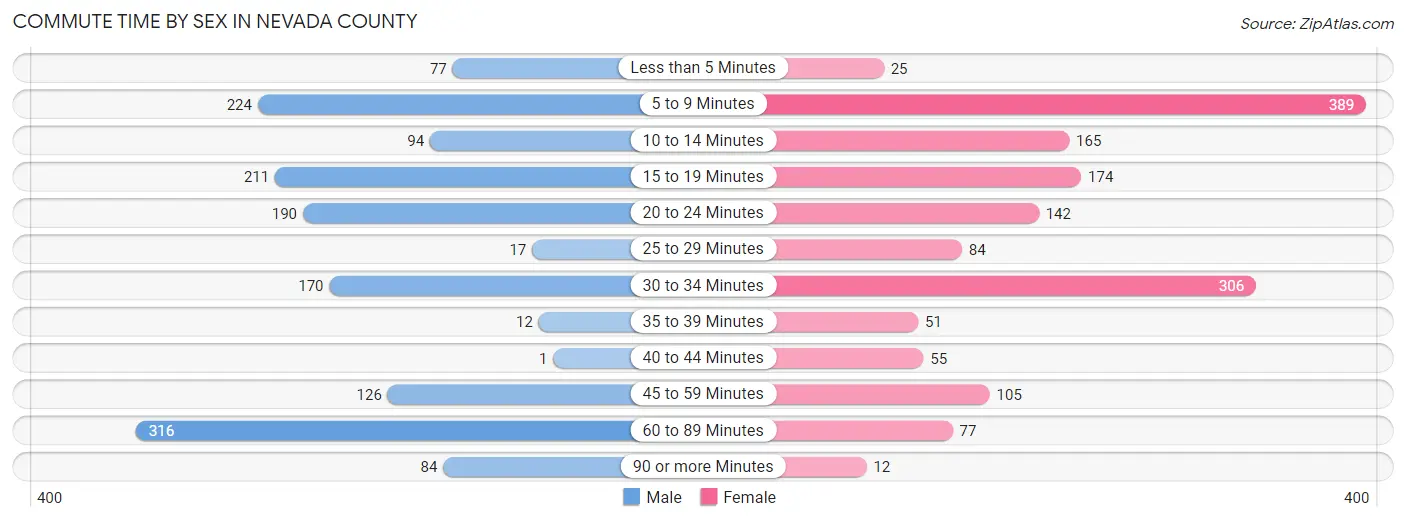
| Commute Time | Male | Female |
| Less than 5 Minutes | 77 (5.1%) | 25 (1.6%) |
| 5 to 9 Minutes | 224 (14.7%) | 389 (24.5%) |
| 10 to 14 Minutes | 94 (6.2%) | 165 (10.4%) |
| 15 to 19 Minutes | 211 (13.9%) | 174 (11.0%) |
| 20 to 24 Minutes | 190 (12.5%) | 142 (9.0%) |
| 25 to 29 Minutes | 17 (1.1%) | 84 (5.3%) |
| 30 to 34 Minutes | 170 (11.2%) | 306 (19.3%) |
| 35 to 39 Minutes | 12 (0.8%) | 51 (3.2%) |
| 40 to 44 Minutes | 1 (0.1%) | 55 (3.5%) |
| 45 to 59 Minutes | 126 (8.3%) | 105 (6.6%) |
| 60 to 89 Minutes | 316 (20.8%) | 77 (4.9%) |
| 90 or more Minutes | 84 (5.5%) | 12 (0.8%) |
Time of Departure to Work by Sex in Nevada County
The most frequent times of departure to work in Nevada County are 6:00 AM to 6:29 AM (293, 19.3%) for males and 7:00 AM to 7:29 AM (318, 20.1%) for females.

| Time of Departure | Male | Female |
| 12:00 AM to 4:59 AM | 123 (8.1%) | 41 (2.6%) |
| 5:00 AM to 5:29 AM | 44 (2.9%) | 90 (5.7%) |
| 5:30 AM to 5:59 AM | 95 (6.2%) | 46 (2.9%) |
| 6:00 AM to 6:29 AM | 293 (19.3%) | 111 (7.0%) |
| 6:30 AM to 6:59 AM | 243 (16.0%) | 216 (13.6%) |
| 7:00 AM to 7:29 AM | 106 (7.0%) | 318 (20.1%) |
| 7:30 AM to 7:59 AM | 135 (8.9%) | 299 (18.9%) |
| 8:00 AM to 8:29 AM | 56 (3.7%) | 230 (14.5%) |
| 8:30 AM to 8:59 AM | 69 (4.5%) | 73 (4.6%) |
| 9:00 AM to 9:59 AM | 48 (3.2%) | 2 (0.1%) |
| 10:00 AM to 10:59 AM | 0 (0.0%) | 0 (0.0%) |
| 11:00 AM to 11:59 AM | 0 (0.0%) | 2 (0.1%) |
| 12:00 PM to 3:59 PM | 222 (14.6%) | 102 (6.4%) |
| 4:00 PM to 11:59 PM | 88 (5.8%) | 55 (3.5%) |
| Total | 1,522 (100.0%) | 1,585 (100.0%) |
Housing Occupancy in Nevada County
Occupancy by Ownership in Nevada County
Of the total 3,154 dwellings in Nevada County, owner-occupied units account for 2,103 (66.7%), while renter-occupied units make up 1,051 (33.3%).
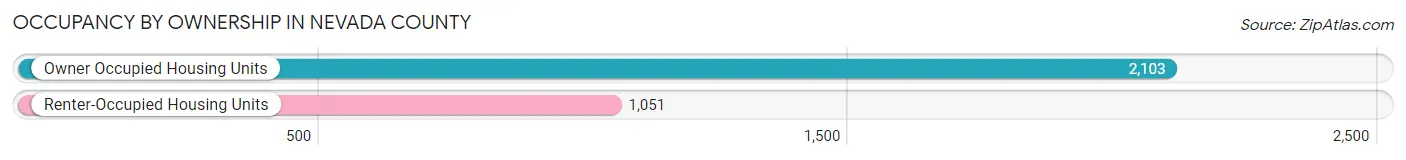
| Occupancy | # Housing Units | % Housing Units |
| Owner Occupied Housing Units | 2,103 | 66.7% |
| Renter-Occupied Housing Units | 1,051 | 33.3% |
| Total Occupied Housing Units | 3,154 | 100.0% |
Occupancy by Household Size in Nevada County

| Household Size | # Housing Units | % Housing Units |
| 1-Person Household | 1,122 | 35.6% |
| 2-Person Household | 989 | 31.4% |
| 3-Person Household | 455 | 14.4% |
| 4+ Person Household | 588 | 18.6% |
| Total Housing Units | 3,154 | 100.0% |
Occupancy by Ownership by Household Size in Nevada County

| Household Size | Owner-occupied | Renter-occupied |
| 1-Person Household | 558 (49.7%) | 564 (50.3%) |
| 2-Person Household | 863 (87.3%) | 126 (12.7%) |
| 3-Person Household | 327 (71.9%) | 128 (28.1%) |
| 4+ Person Household | 355 (60.4%) | 233 (39.6%) |
| Total Housing Units | 2,103 (66.7%) | 1,051 (33.3%) |
Occupancy by Educational Attainment in Nevada County

| Household Size | Owner-occupied | Renter-occupied |
| Less than High School | 125 (62.5%) | 75 (37.5%) |
| High School Diploma | 1,069 (66.4%) | 542 (33.6%) |
| College/Associate Degree | 685 (69.8%) | 297 (30.2%) |
| Bachelor's Degree or higher | 224 (62.1%) | 137 (38.0%) |
Occupancy by Age of Householder in Nevada County
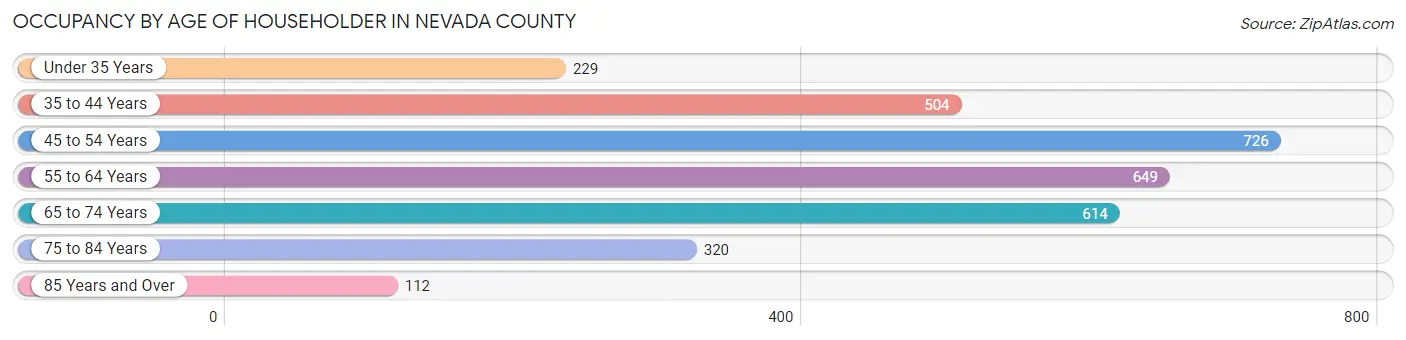
| Age Bracket | # Households | % Households |
| Under 35 Years | 229 | 7.3% |
| 35 to 44 Years | 504 | 16.0% |
| 45 to 54 Years | 726 | 23.0% |
| 55 to 64 Years | 649 | 20.6% |
| 65 to 74 Years | 614 | 19.5% |
| 75 to 84 Years | 320 | 10.2% |
| 85 Years and Over | 112 | 3.5% |
| Total | 3,154 | 100.0% |
Housing Finances in Nevada County
Median Income by Occupancy in Nevada County

| Occupancy Type | # Households | Median Income |
| Owner-Occupied | 2,103 (66.7%) | $47,155 |
| Renter-Occupied | 1,051 (33.3%) | $24,699 |
| Average | 3,154 (100.0%) | $43,421 |
Occupancy by Householder Income Bracket in Nevada County

| Income Bracket | Owner-occupied | Renter-occupied |
| Less than $5,000 | 84 (4.0%) | 36 (3.4%) |
| $5,000 to $9,999 | 0 (0.0%) | 92 (8.7%) |
| $10,000 to $14,999 | 150 (7.1%) | 126 (12.0%) |
| $15,000 to $19,999 | 167 (7.9%) | 115 (10.9%) |
| $20,000 to $24,999 | 19 (0.9%) | 173 (16.5%) |
| $25,000 to $34,999 | 206 (9.8%) | 113 (10.7%) |
| $35,000 to $49,999 | 506 (24.1%) | 186 (17.7%) |
| $50,000 to $74,999 | 506 (24.1%) | 197 (18.7%) |
| $75,000 to $99,999 | 210 (10.0%) | 13 (1.2%) |
| $100,000 to $149,999 | 158 (7.5%) | 0 (0.0%) |
| $150,000 or more | 97 (4.6%) | 0 (0.0%) |
| Total | 2,103 (100.0%) | 1,051 (100.0%) |
Monthly Housing Cost Tiers in Nevada County

| Monthly Cost | Owner-occupied | Renter-occupied |
| Less than $300 | 488 (23.2%) | 11 (1.1%) |
| $300 to $499 | 649 (30.9%) | 112 (10.7%) |
| $500 to $799 | 482 (22.9%) | 325 (30.9%) |
| $800 to $999 | 247 (11.7%) | 243 (23.1%) |
| $1,000 to $1,499 | 197 (9.4%) | 146 (13.9%) |
| $1,500 to $1,999 | 16 (0.8%) | 0 (0.0%) |
| $2,000 to $2,499 | 18 (0.9%) | 0 (0.0%) |
| $2,500 to $2,999 | 0 (0.0%) | 0 (0.0%) |
| $3,000 or more | 6 (0.3%) | 4 (0.4%) |
| Total | 2,103 (100.0%) | 1,051 (100.0%) |
Physical Housing Characteristics in Nevada County
Housing Structures in Nevada County

| Structure Type | # Housing Units | % Housing Units |
| Single Unit, Detached | 2,245 | 71.2% |
| Single Unit, Attached | 1 | 0.0% |
| 2 Unit Apartments | 35 | 1.1% |
| 3 or 4 Unit Apartments | 38 | 1.2% |
| 5 to 9 Unit Apartments | 0 | 0.0% |
| 10 or more Apartments | 102 | 3.2% |
| Mobile Home / Other | 733 | 23.2% |
| Total | 3,154 | 100.0% |
Housing Structures by Occupancy in Nevada County

| Structure Type | Owner-occupied | Renter-occupied |
| Single Unit, Detached | 1,601 (71.3%) | 644 (28.7%) |
| Single Unit, Attached | 1 (100.0%) | 0 (0.0%) |
| 2 Unit Apartments | 0 (0.0%) | 35 (100.0%) |
| 3 or 4 Unit Apartments | 0 (0.0%) | 38 (100.0%) |
| 5 to 9 Unit Apartments | 0 (0.0%) | 0 (0.0%) |
| 10 or more Apartments | 0 (0.0%) | 102 (100.0%) |
| Mobile Home / Other | 501 (68.3%) | 232 (31.7%) |
| Total | 2,103 (66.7%) | 1,051 (33.3%) |
Housing Structures by Number of Rooms in Nevada County

| Number of Rooms | Owner-occupied | Renter-occupied |
| 1 Room | 4 (0.2%) | 0 (0.0%) |
| 2 or 3 Rooms | 66 (3.1%) | 98 (9.3%) |
| 4 or 5 Rooms | 686 (32.6%) | 522 (49.7%) |
| 6 or 7 Rooms | 1,126 (53.5%) | 377 (35.9%) |
| 8 or more Rooms | 221 (10.5%) | 54 (5.1%) |
| Total | 2,103 (100.0%) | 1,051 (100.0%) |
Housing Structure by Heating Type in Nevada County

| Heating Type | Owner-occupied | Renter-occupied |
| Utility Gas | 553 (26.3%) | 683 (65.0%) |
| Bottled, Tank, or LP Gas | 274 (13.0%) | 28 (2.7%) |
| Electricity | 1,235 (58.7%) | 274 (26.1%) |
| Fuel Oil or Kerosene | 0 (0.0%) | 0 (0.0%) |
| Coal or Coke | 0 (0.0%) | 0 (0.0%) |
| All other Fuels | 35 (1.7%) | 66 (6.3%) |
| No Fuel Used | 6 (0.3%) | 0 (0.0%) |
| Total | 2,103 (100.0%) | 1,051 (100.0%) |
Household Vehicle Usage in Nevada County

| Vehicles per Household | Owner-occupied | Renter-occupied |
| No Vehicle | 69 (3.3%) | 76 (7.2%) |
| 1 Vehicle | 428 (20.3%) | 631 (60.0%) |
| 2 Vehicles | 912 (43.4%) | 323 (30.7%) |
| 3 or more Vehicles | 694 (33.0%) | 21 (2.0%) |
| Total | 2,103 (100.0%) | 1,051 (100.0%) |
Real Estate & Mortgages in Nevada County
Real Estate and Mortgage Overview in Nevada County
| Characteristic | Without Mortgage | With Mortgage |
| Housing Units | 1,368 | 735 |
| Median Property Value | $77,400 | $87,700 |
| Median Household Income | $46,701 | $68 |
| Monthly Housing Costs | $362 | $6 |
| Real Estate Taxes | $474 | $135 |
Property Value by Mortgage Status in Nevada County

| Property Value | Without Mortgage | With Mortgage |
| Less than $50,000 | 591 (43.2%) | 141 (19.2%) |
| $50,000 to $99,999 | 415 (30.3%) | 362 (49.2%) |
| $100,000 to $299,999 | 345 (25.2%) | 165 (22.5%) |
| $300,000 to $499,999 | 16 (1.2%) | 60 (8.2%) |
| $500,000 to $749,999 | 0 (0.0%) | 0 (0.0%) |
| $750,000 to $999,999 | 0 (0.0%) | 0 (0.0%) |
| $1,000,000 or more | 1 (0.1%) | 7 (0.9%) |
| Total | 1,368 (100.0%) | 735 (100.0%) |
Household Income by Mortgage Status in Nevada County

| Household Income | Without Mortgage | With Mortgage |
| Less than $10,000 | 28 (2.1%) | 0 (0.0%) |
| $10,000 to $24,999 | 225 (16.5%) | 56 (7.6%) |
| $25,000 to $34,999 | 177 (12.9%) | 111 (15.1%) |
| $35,000 to $49,999 | 323 (23.6%) | 29 (4.0%) |
| $50,000 to $74,999 | 359 (26.2%) | 183 (24.9%) |
| $75,000 to $99,999 | 132 (9.7%) | 147 (20.0%) |
| $100,000 to $149,999 | 95 (6.9%) | 78 (10.6%) |
| $150,000 or more | 29 (2.1%) | 63 (8.6%) |
| Total | 1,368 (100.0%) | 735 (100.0%) |
Property Value to Household Income Ratio in Nevada County

| Value-to-Income Ratio | Without Mortgage | With Mortgage |
| Less than 2.0x | 811 (59.3%) | 48,802 (6,639.7%) |
| 2.0x to 2.9x | 282 (20.6%) | 418 (56.9%) |
| 3.0x to 3.9x | 78 (5.7%) | 70 (9.5%) |
| 4.0x or more | 190 (13.9%) | 55 (7.5%) |
| Total | 1,368 (100.0%) | 735 (100.0%) |
Real Estate Taxes by Mortgage Status in Nevada County

| Property Taxes | Without Mortgage | With Mortgage |
| Less than $800 | 758 (55.4%) | 9 (1.2%) |
| $800 to $1,499 | 273 (20.0%) | 428 (58.2%) |
| $800 to $1,499 | 39 (2.9%) | 126 (17.1%) |
| Total | 1,368 (100.0%) | 735 (100.0%) |
Health & Disability in Nevada County
Health Insurance Coverage by Age in Nevada County

| Age Bracket | With Coverage | Without Coverage |
| Under 6 Years | 526 (95.0%) | 28 (5.1%) |
| 6 to 18 Years | 1,304 (97.3%) | 36 (2.7%) |
| 19 to 25 Years | 698 (87.3%) | 102 (12.8%) |
| 26 to 34 Years | 487 (86.2%) | 78 (13.8%) |
| 35 to 44 Years | 857 (91.9%) | 75 (8.1%) |
| 45 to 54 Years | 1,128 (99.0%) | 11 (1.0%) |
| 55 to 64 Years | 1,106 (94.2%) | 68 (5.8%) |
| 65 to 74 Years | 944 (100.0%) | 0 (0.0%) |
| 75 Years and older | 678 (100.0%) | 0 (0.0%) |
| Total | 7,728 (95.1%) | 398 (4.9%) |
Health Insurance Coverage by Citizenship Status in Nevada County

| Citizenship Status | With Coverage | Without Coverage |
| Native Born | 526 (95.0%) | 28 (5.1%) |
| Foreign Born, Citizen | 1,304 (97.3%) | 36 (2.7%) |
| Foreign Born, not a Citizen | 698 (87.3%) | 102 (12.8%) |
Health Insurance Coverage by Household Income in Nevada County
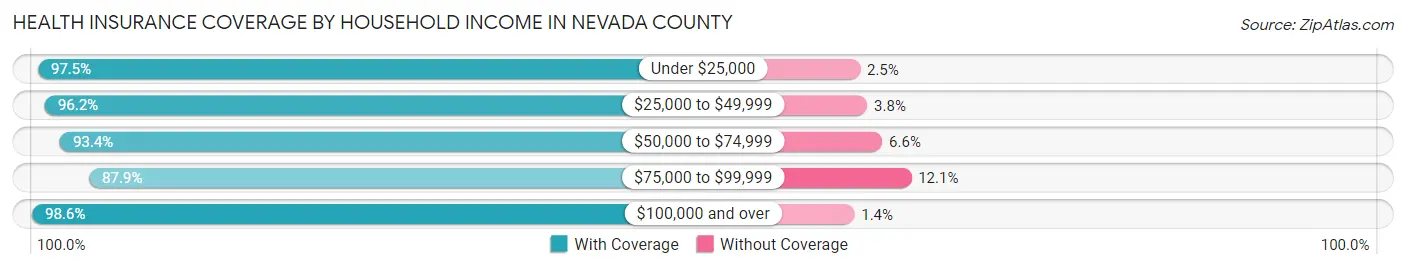
| Household Income | With Coverage | Without Coverage |
| Under $25,000 | 1,926 (97.5%) | 49 (2.5%) |
| $25,000 to $49,999 | 2,399 (96.2%) | 95 (3.8%) |
| $50,000 to $74,999 | 1,873 (93.4%) | 133 (6.6%) |
| $75,000 to $99,999 | 809 (87.9%) | 111 (12.1%) |
| $100,000 and over | 702 (98.6%) | 10 (1.4%) |
Public vs Private Health Insurance Coverage by Age in Nevada County
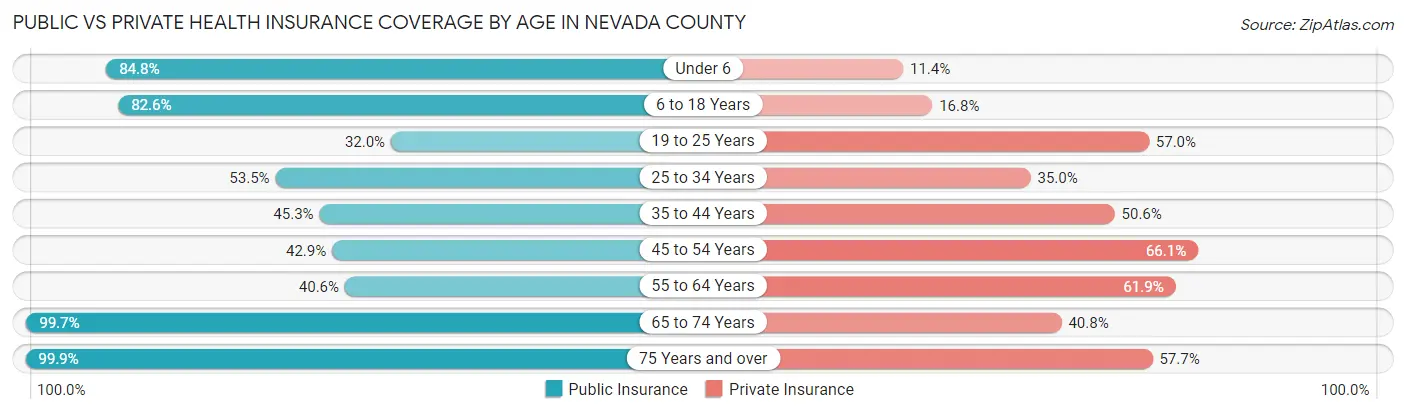
| Age Bracket | Public Insurance | Private Insurance |
| Under 6 | 470 (84.8%) | 63 (11.4%) |
| 6 to 18 Years | 1,107 (82.6%) | 225 (16.8%) |
| 19 to 25 Years | 256 (32.0%) | 456 (57.0%) |
| 25 to 34 Years | 302 (53.4%) | 198 (35.0%) |
| 35 to 44 Years | 422 (45.3%) | 472 (50.6%) |
| 45 to 54 Years | 489 (42.9%) | 753 (66.1%) |
| 55 to 64 Years | 476 (40.6%) | 727 (61.9%) |
| 65 to 74 Years | 941 (99.7%) | 385 (40.8%) |
| 75 Years and over | 677 (99.9%) | 391 (57.7%) |
| Total | 5,140 (63.2%) | 3,670 (45.2%) |
Disability Status by Sex by Age in Nevada County

| Age Bracket | Male | Female |
| Under 5 Years | 0 (0.0%) | 0 (0.0%) |
| 5 to 17 Years | 72 (10.7%) | 48 (6.6%) |
| 18 to 34 Years | 97 (13.3%) | 63 (9.4%) |
| 35 to 64 Years | 512 (32.2%) | 346 (20.9%) |
| 65 to 74 Years | 112 (25.1%) | 197 (39.6%) |
| 75 Years and over | 175 (58.7%) | 195 (51.3%) |
Disability Class by Sex by Age in Nevada County
Disability Class: Hearing Difficulty

| Age Bracket | Male | Female |
| Under 5 Years | 0 (0.0%) | 0 (0.0%) |
| 5 to 17 Years | 17 (2.5%) | 2 (0.3%) |
| 18 to 34 Years | 33 (4.5%) | 0 (0.0%) |
| 35 to 64 Years | 257 (16.2%) | 11 (0.7%) |
| 65 to 74 Years | 38 (8.5%) | 3 (0.6%) |
| 75 Years and over | 137 (46.0%) | 48 (12.6%) |
Disability Class: Vision Difficulty

| Age Bracket | Male | Female |
| Under 5 Years | 0 (0.0%) | 0 (0.0%) |
| 5 to 17 Years | 30 (4.4%) | 32 (4.4%) |
| 18 to 34 Years | 0 (0.0%) | 39 (5.8%) |
| 35 to 64 Years | 192 (12.1%) | 71 (4.3%) |
| 65 to 74 Years | 33 (7.4%) | 72 (14.5%) |
| 75 Years and over | 88 (29.5%) | 63 (16.6%) |
Disability Class: Cognitive Difficulty
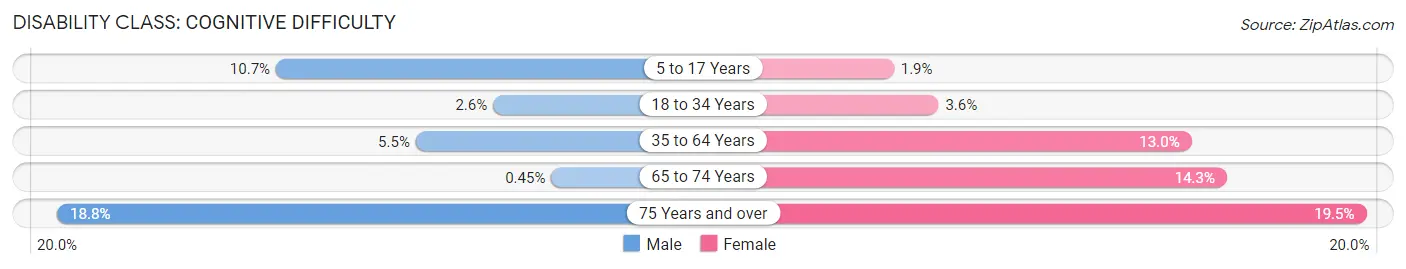
| Age Bracket | Male | Female |
| 5 to 17 Years | 72 (10.7%) | 14 (1.9%) |
| 18 to 34 Years | 19 (2.6%) | 24 (3.6%) |
| 35 to 64 Years | 87 (5.5%) | 215 (13.0%) |
| 65 to 74 Years | 2 (0.4%) | 71 (14.3%) |
| 75 Years and over | 56 (18.8%) | 74 (19.5%) |
Disability Class: Ambulatory Difficulty

| Age Bracket | Male | Female |
| 5 to 17 Years | 0 (0.0%) | 0 (0.0%) |
| 18 to 34 Years | 0 (0.0%) | 3 (0.4%) |
| 35 to 64 Years | 280 (17.6%) | 219 (13.2%) |
| 65 to 74 Years | 67 (15.0%) | 157 (31.6%) |
| 75 Years and over | 134 (45.0%) | 168 (44.2%) |
Disability Class: Self-Care Difficulty

| Age Bracket | Male | Female |
| 5 to 17 Years | 34 (5.0%) | 0 (0.0%) |
| 18 to 34 Years | 33 (4.5%) | 3 (0.4%) |
| 35 to 64 Years | 26 (1.6%) | 63 (3.8%) |
| 65 to 74 Years | 39 (8.7%) | 62 (12.5%) |
| 75 Years and over | 22 (7.4%) | 28 (7.4%) |
Technology Access in Nevada County
Computing Device Access in Nevada County

| Device Type | # Households | % Households |
| Desktop or Laptop | 1,631 | 51.7% |
| Smartphone | 2,299 | 72.9% |
| Tablet | 1,326 | 42.0% |
| No Computing Device | 563 | 17.8% |
| Total | 3,154 | 100.0% |
Internet Access in Nevada County

| Internet Type | # Households | % Households |
| Dial-Up Internet | 0 | 0.0% |
| Broadband Home | 1,309 | 41.5% |
| Cellular Data Only | 515 | 16.3% |
| Satellite Internet | 344 | 10.9% |
| No Internet | 1,021 | 32.4% |
| Total | 3,154 | 100.0% |
Nevada County Summary
Nevada County is located in the southwestern corner of Arkansas, and is bordered by Ouachita County to the north, Columbia County to the east, Lafayette County to the south, and Miller County to the west. The county seat is Prescott, and the county has a total area of 545 square miles.
History
Nevada County was formed in 1871 from parts of Ouachita and Hempstead counties. It was named for the Nevada Territory, which was created in 1861. The first settlers in the area were Native Americans, who were followed by French and Spanish explorers. The first permanent settlers arrived in the early 1800s, and the county was officially organized in 1871.
The county was home to several small towns, including Prescott, Emmet, and Cale. The county seat, Prescott, was founded in 1873 and named after William Hickman Prescott, a prominent Arkansas politician. The town was an important stop on the St. Louis, Iron Mountain and Southern Railway, and was the site of the first courthouse in the county.
Geography
Nevada County is located in the southwestern corner of Arkansas, and is bordered by Ouachita County to the north, Columbia County to the east, Lafayette County to the south, and Miller County to the west. The county has a total area of 545 square miles, and is mostly covered in forests and rolling hills. The county is home to several rivers, including the Ouachita, Little Missouri, and Saline.
The county is home to several state parks, including Cane Creek State Park, which is located in the northern part of the county. The park is home to a variety of wildlife, including deer, turkey, and waterfowl. The park also features a variety of outdoor activities, including camping, fishing, and hiking.
Economy
The economy of Nevada County is largely based on agriculture and timber. The county is home to several large timber companies, and the timber industry is the largest employer in the county. Other major industries in the county include manufacturing, retail, and tourism.
The county is home to several large employers, including Tyson Foods, which has a large poultry processing plant in the county. Other major employers in the county include Walmart, which has a distribution center in the county, and the University of Arkansas at Monticello, which has a campus in the county.
Demographics
As of the 2010 census, Nevada County had a population of 8,997. The population was spread out with 24.3% under the age of 18, 8.2% from 18 to 24, 25.2% from 25 to 44, 28.2% from 45 to 64, and 14.1% who were 65 years of age or older. The median age was 40.3 years.
The median income for a household in the county was $35,945, and the median income for a family was $44,945. The per capita income for the county was $18,945. About 17.2% of the population was below the poverty line.
Conclusion
Nevada County is a rural county located in the southwestern corner of Arkansas. The county is home to several small towns, and the economy is largely based on agriculture and timber. The county is home to several large employers, and the population is mostly made up of people of working age. The median income for a household in the county is slightly below the state average, and the poverty rate is slightly higher than the state average.
Common Questions
What is the Total Population of Nevada County?
Total Population of Nevada County is 8,292.
What is the Total Male Population of Nevada County?
Total Male Population of Nevada County is 4,058.
What is the Total Female Population of Nevada County?
Total Female Population of Nevada County is 4,234.
What is the Ratio of Males per 100 Females in Nevada County?
There are 95.84 Males per 100 Females in Nevada County.
What is the Ratio of Females per 100 Males in Nevada County?
There are 104.34 Females per 100 Males in Nevada County.
What is the Median Population Age in Nevada County?
Median Population Age in Nevada County is 44.7 Years.
What is the Average Family Size in Nevada County
Average Family Size in Nevada County is 3.4 People.
What is the Average Household Size in Nevada County
Average Household Size in Nevada County is 2.6 People.
What is Per Capita Income in Nevada County?
Per Capita income in Nevada County is $22,041.
What is the Median Family Income in Nevada County?
Median Family Income in Nevada County is $47,059.
What is the Median Household income in Nevada County?
Median Household Income in Nevada County is $43,421.
What is Income or Wage Gap in Nevada County?
Income or Wage Gap in Nevada County is 20.9%.
Women in Nevada County earn 79.1 cents for every dollar earned by a man.
What is Family Income Deficit in Nevada County?
Family Income Deficit in Nevada County is $10,045.
Families that are below poverty line in Nevada County earn $10,045 less on average than the poverty threshold level.
What is Inequality or Gini Index in Nevada County?
Inequality or Gini Index in Nevada County is 0.43.
How Large is the Labor Force in Nevada County?
There are 3,380 People in the Labor Forcein in Nevada County.
What is the Percentage of People in the Labor Force in Nevada County?
51.3% of People are in the Labor Force in Nevada County.
What is the Unemployment Rate in Nevada County?
Unemployment Rate in Nevada County is 7.8%.