Logan County, AR
Logan County Map
Logan County Overview
21,247
TOTAL POPULATION
10,501
MALE POPULATION
10,746
FEMALE POPULATION
97.72
MALES / 100 FEMALES
102.33
FEMALES / 100 MALES
43.5
MEDIAN AGE
3.0
AVG FAMILY SIZE
2.5
AVG HOUSEHOLD SIZE
$28,495
PER CAPITA INCOME
$64,891
AVG FAMILY INCOME
$51,131
AVG HOUSEHOLD INCOME
28.1%
WAGE / INCOME GAP [ % ]
71.9¢/ $1
WAGE / INCOME GAP [ $ ]
$10,780
FAMILY INCOME DEFICIT
0.45
INEQUALITY / GINI INDEX
9,805
LABOR FORCE [ PEOPLE ]
56.6%
PERCENT IN LABOR FORCE
5.5%
UNEMPLOYMENT RATE
Logan County Area Codes
Race in Logan County
The most populous races in Logan County are White / Caucasian (19,066 | 89.7%), Two or more Races (1,209 | 5.7%), and Hispanic or Latino (672 | 3.2%).

| Race | # Population | % Population |
| Asian | 388 | 1.8% |
| Black / African American | 336 | 1.6% |
| Hawaiian / Pacific | 0 | 0.0% |
| Hispanic or Latino | 672 | 3.2% |
| Native / Alaskan | 89 | 0.4% |
| White / Caucasian | 19,066 | 89.7% |
| Two or more Races | 1,209 | 5.7% |
| Some other Race | 159 | 0.7% |
| Total | 21,247 | 100.0% |
Ancestry in Logan County
The most populous ancestries reported in Logan County are German (2,335 | 11.0%), American (2,020 | 9.5%), Irish (1,678 | 7.9%), English (1,619 | 7.6%), and Mexican (543 | 2.6%), together accounting for 38.6% of all Logan County residents.

| Ancestry | # Population | % Population |
| Alaska Native | 2 | 0.0% |
| American | 2,020 | 9.5% |
| Apache | 20 | 0.1% |
| Arab | 5 | 0.0% |
| Austrian | 12 | 0.1% |
| Bangladeshi | 224 | 1.1% |
| Blackfeet | 2 | 0.0% |
| British | 93 | 0.4% |
| Burmese | 24 | 0.1% |
| Canadian | 23 | 0.1% |
| Celtic | 12 | 0.1% |
| Cherokee | 312 | 1.5% |
| Cheyenne | 13 | 0.1% |
| Chickasaw | 9 | 0.0% |
| Choctaw | 26 | 0.1% |
| Czech | 15 | 0.1% |
| Czechoslovakian | 7 | 0.0% |
| Danish | 21 | 0.1% |
| Dutch | 180 | 0.9% |
| Dutch West Indian | 13 | 0.1% |
| Eastern European | 28 | 0.1% |
| Egyptian | 3 | 0.0% |
| English | 1,619 | 7.6% |
| European | 214 | 1.0% |
| Finnish | 2 | 0.0% |
| French | 147 | 0.7% |
| French Canadian | 61 | 0.3% |
| German | 2,335 | 11.0% |
| Hungarian | 24 | 0.1% |
| Indian (Asian) | 59 | 0.3% |
| Indonesian | 6 | 0.0% |
| Irish | 1,678 | 7.9% |
| Italian | 237 | 1.1% |
| Korean | 98 | 0.5% |
| Luxembourger | 15 | 0.1% |
| Malaysian | 73 | 0.3% |
| Mexican | 543 | 2.6% |
| Navajo | 3 | 0.0% |
| Northern European | 3 | 0.0% |
| Norwegian | 80 | 0.4% |
| Peruvian | 11 | 0.1% |
| Polish | 94 | 0.4% |
| Portuguese | 21 | 0.1% |
| Puerto Rican | 29 | 0.1% |
| Russian | 3 | 0.0% |
| Scandinavian | 8 | 0.0% |
| Scotch-Irish | 101 | 0.5% |
| Scottish | 293 | 1.4% |
| South American | 11 | 0.1% |
| Spaniard | 11 | 0.1% |
| Spanish | 66 | 0.3% |
| Sri Lankan | 8 | 0.0% |
| Swedish | 36 | 0.2% |
| Swiss | 51 | 0.2% |
| Thai | 1 | 0.0% |
| Ukrainian | 4 | 0.0% |
| Welsh | 20 | 0.1% | View All 57 Rows |
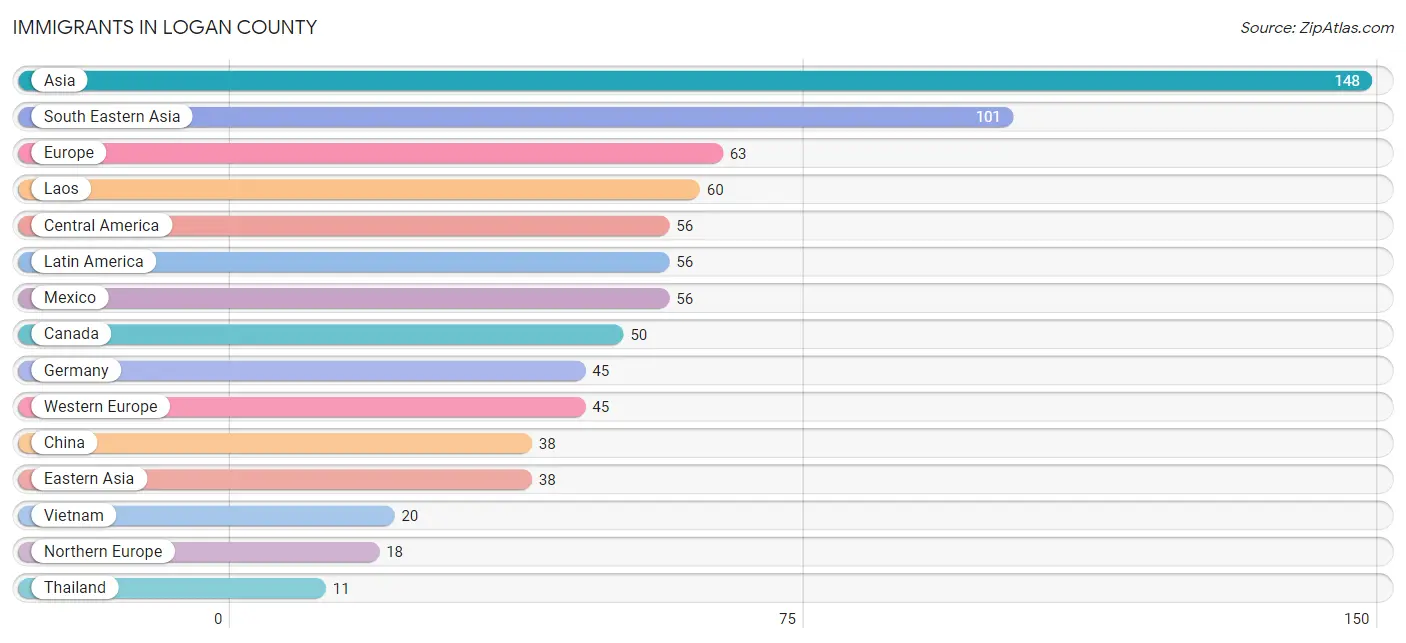
Immigrants in Logan County
The most numerous immigrant groups reported in Logan County came from Asia (148 | 0.7%), South Eastern Asia (101 | 0.5%), Europe (63 | 0.3%), Laos (60 | 0.3%), and Central America (56 | 0.3%), together accounting for 2.0% of all Logan County residents.
| Immigration Origin | # Population | % Population |
| Asia | 148 | 0.7% |
| Canada | 50 | 0.2% |
| Central America | 56 | 0.3% |
| China | 38 | 0.2% |
| Eastern Asia | 38 | 0.2% |
| England | 1 | 0.0% |
| Europe | 63 | 0.3% |
| Germany | 45 | 0.2% |
| India | 9 | 0.0% |
| Laos | 60 | 0.3% |
| Latin America | 56 | 0.3% |
| Mexico | 56 | 0.3% |
| Northern Europe | 18 | 0.1% |
| Philippines | 9 | 0.0% |
| South Central Asia | 9 | 0.0% |
| South Eastern Asia | 101 | 0.5% |
| Thailand | 11 | 0.1% |
| Vietnam | 20 | 0.1% |
| Western Europe | 45 | 0.2% | View All 19 Rows |
Sex and Age in Logan County
Sex and Age in Logan County
The most populous age groups in Logan County are 60 to 64 Years (801 | 7.6%) for men and 55 to 59 Years (886 | 8.2%) for women.

| Age Bracket | Male | Female |
| Under 5 Years | 599 (5.7%) | 651 (6.1%) |
| 5 to 9 Years | 438 (4.2%) | 621 (5.8%) |
| 10 to 14 Years | 769 (7.3%) | 606 (5.6%) |
| 15 to 19 Years | 653 (6.2%) | 552 (5.1%) |
| 20 to 24 Years | 571 (5.4%) | 595 (5.5%) |
| 25 to 29 Years | 597 (5.7%) | 578 (5.4%) |
| 30 to 34 Years | 640 (6.1%) | 651 (6.1%) |
| 35 to 39 Years | 563 (5.4%) | 622 (5.8%) |
| 40 to 44 Years | 717 (6.8%) | 597 (5.6%) |
| 45 to 49 Years | 630 (6.0%) | 661 (6.1%) |
| 50 to 54 Years | 762 (7.3%) | 696 (6.5%) |
| 55 to 59 Years | 776 (7.4%) | 886 (8.2%) |
| 60 to 64 Years | 801 (7.6%) | 759 (7.1%) |
| 65 to 69 Years | 641 (6.1%) | 710 (6.6%) |
| 70 to 74 Years | 563 (5.4%) | 568 (5.3%) |
| 75 to 79 Years | 401 (3.8%) | 493 (4.6%) |
| 80 to 84 Years | 237 (2.3%) | 240 (2.2%) |
| 85 Years and over | 143 (1.4%) | 260 (2.4%) |
| Total | 10,501 (100.0%) | 10,746 (100.0%) |
Families and Households in Logan County
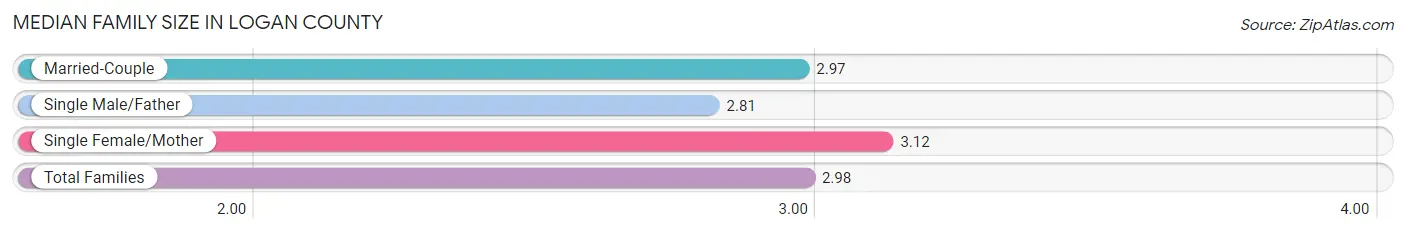
Median Family Size in Logan County
The median family size in Logan County is 2.98 persons per family, with single female/mother families (846 | 14.9%) accounting for the largest median family size of 3.12 persons per family. On the other hand, single male/father families (414 | 7.3%) represent the smallest median family size with 2.81 persons per family.
| Family Type | # Families | Family Size |
| Married-Couple | 4,432 (77.9%) | 2.97 |
| Single Male/Father | 414 (7.3%) | 2.81 |
| Single Female/Mother | 846 (14.9%) | 3.12 |
| Total Families | 5,692 (100.0%) | 2.98 |
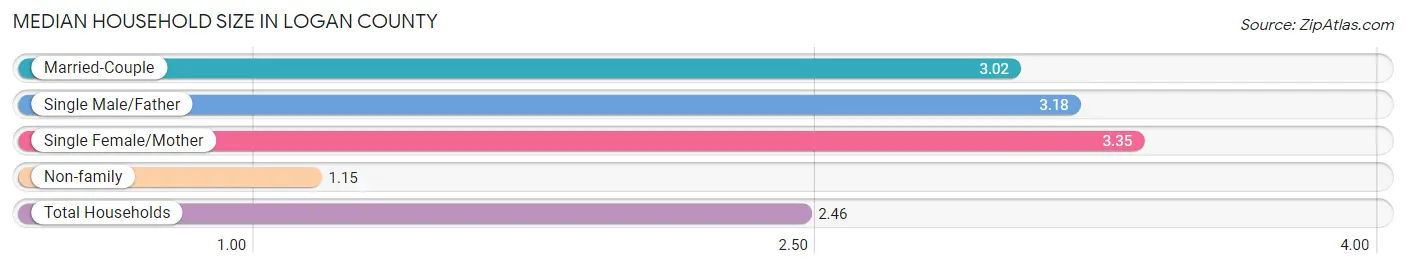
Median Household Size in Logan County
The median household size in Logan County is 2.46 persons per household, with single female/mother households (846 | 10.1%) accounting for the largest median household size of 3.35 persons per household. non-family households (2,713 | 32.3%) represent the smallest median household size with 1.15 persons per household.
| Household Type | # Households | Household Size |
| Married-Couple | 4,432 (52.7%) | 3.02 |
| Single Male/Father | 414 (4.9%) | 3.18 |
| Single Female/Mother | 846 (10.1%) | 3.35 |
| Non-family | 2,713 (32.3%) | 1.15 |
| Total Households | 8,405 (100.0%) | 2.46 |
Household Size by Marriage Status in Logan County
Out of a total of 8,405 households in Logan County, 5,692 (67.7%) are family households, while 2,713 (32.3%) are nonfamily households. The most numerous type of family households are 2-person households, comprising 2,341, and the most common type of nonfamily households are 1-person households, comprising 2,375.

| Household Size | Family Households | Nonfamily Households |
| 1-Person Households | - | 2,375 (28.3%) |
| 2-Person Households | 2,341 (27.9%) | 295 (3.5%) |
| 3-Person Households | 1,565 (18.6%) | 36 (0.4%) |
| 4-Person Households | 929 (11.1%) | 7 (0.1%) |
| 5-Person Households | 520 (6.2%) | 0 (0.0%) |
| 6-Person Households | 168 (2.0%) | 0 (0.0%) |
| 7+ Person Households | 169 (2.0%) | 0 (0.0%) |
| Total | 5,692 (67.7%) | 2,713 (32.3%) |
Female Fertility in Logan County
Fertility by Age in Logan County
Average fertility rate in Logan County is 31.0 births per 1,000 women. Women in the age bracket of 20 to 34 years have the highest fertility rate with 58.0 births per 1,000 women. Women in the age bracket of 20 to 34 years acount for 77.9% of all women with births.
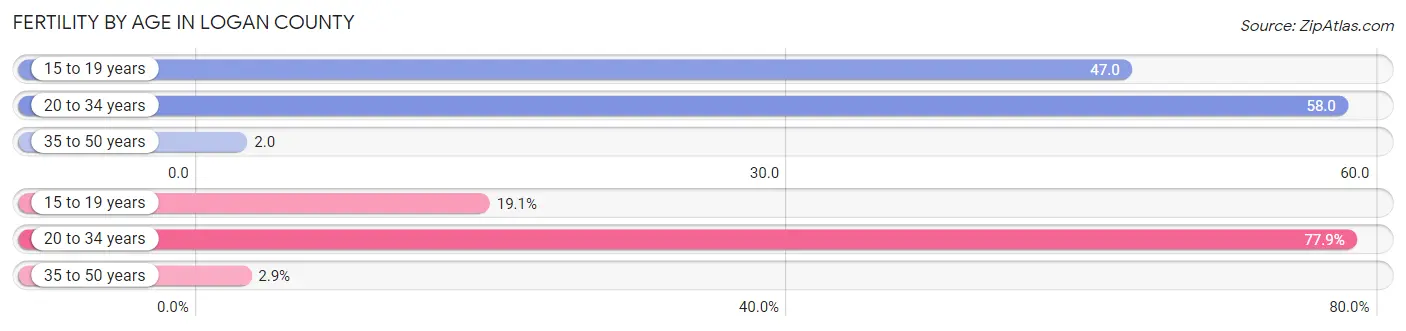
| Age Bracket | Women with Births | Births / 1,000 Women |
| 15 to 19 years | 26 (19.1%) | 47.0 |
| 20 to 34 years | 106 (77.9%) | 58.0 |
| 35 to 50 years | 4 (2.9%) | 2.0 |
| Total | 136 (100.0%) | 31.0 |
Fertility by Age by Marriage Status in Logan County
73.5% of women with births (136) in Logan County are married. The highest percentage of unmarried women with births falls into 15 to 19 years age bracket with 100.0% of them unmarried at the time of birth, while the lowest percentage of unmarried women with births belong to 35 to 50 years age bracket with 0.0% of them unmarried.
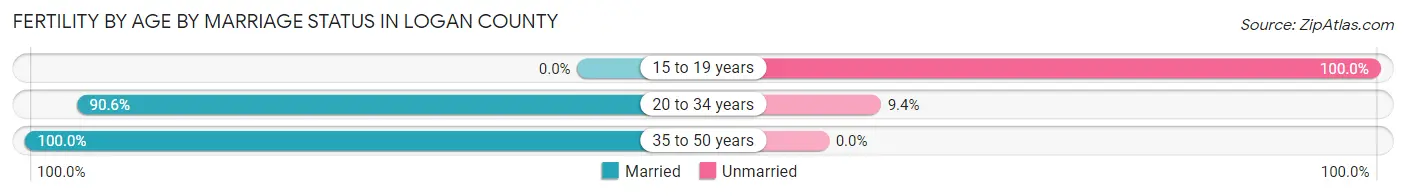
| Age Bracket | Married | Unmarried |
| 15 to 19 years | 0 (0.0%) | 26 (100.0%) |
| 20 to 34 years | 96 (90.6%) | 10 (9.4%) |
| 35 to 50 years | 4 (100.0%) | 0 (0.0%) |
| Total | 100 (73.5%) | 36 (26.5%) |
Fertility by Education in Logan County
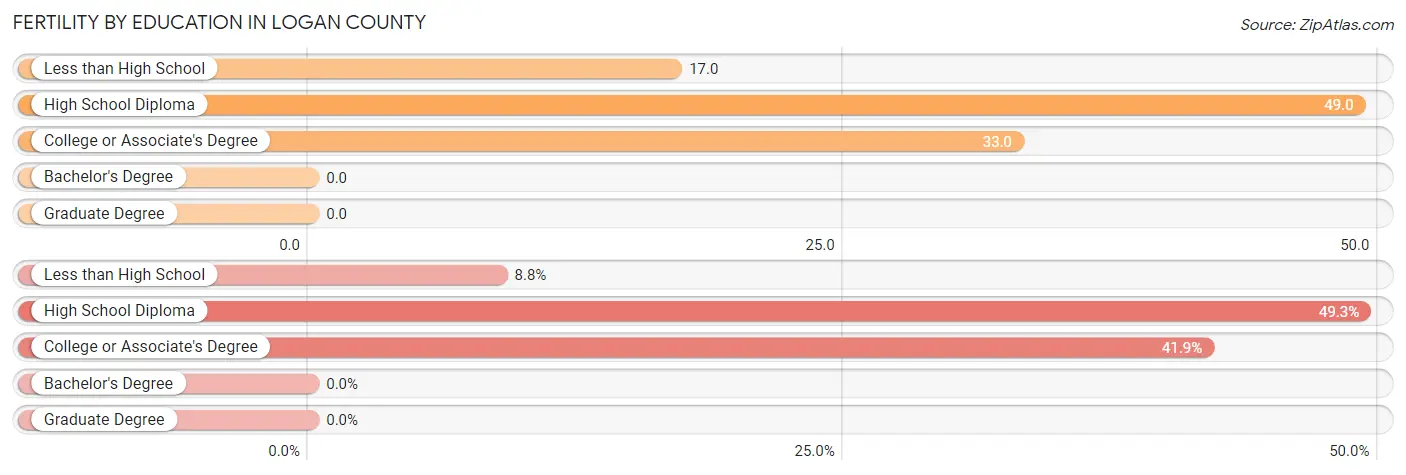
| Educational Attainment | Women with Births | Births / 1,000 Women |
| Less than High School | 12 (8.8%) | 17.0 |
| High School Diploma | 67 (49.3%) | 49.0 |
| College or Associate's Degree | 57 (41.9%) | 33.0 |
| Bachelor's Degree | 0 (0.0%) | 0.0 |
| Graduate Degree | 0 (0.0%) | 0.0 |
| Total | 136 (100.0%) | 31.0 |
Fertility by Education by Marriage Status in Logan County
26.5% of women with births in Logan County are unmarried. Women with the educational attainment of college or associate's degree are most likely to be married with 96.5% of them married at childbirth, while women with the educational attainment of less than high school are least likely to be married with 66.7% of them unmarried at childbirth.

| Educational Attainment | Married | Unmarried |
| Less than High School | 4 (33.3%) | 8 (66.7%) |
| High School Diploma | 41 (61.2%) | 26 (38.8%) |
| College or Associate's Degree | 55 (96.5%) | 2 (3.5%) |
| Bachelor's Degree | 0 (0.0%) | 0 (0.0%) |
| Graduate Degree | 0 (0.0%) | 0 (0.0%) |
| Total | 100 (73.5%) | 36 (26.5%) |
Income in Logan County
Income Overview in Logan County
Per Capita Income in Logan County is $28,495, while median incomes of families and households are $64,891 and $51,131 respectively.
| Characteristic | Number | Measure |
| Per Capita Income | 21,247 | $28,495 |
| Median Family Income | 5,692 | $64,891 |
| Mean Family Income | 5,692 | $77,186 |
| Median Household Income | 8,405 | $51,131 |
| Mean Household Income | 8,405 | $70,242 |
| Income Deficit | 5,692 | $10,780 |
| Wage / Income Gap (%) | 21,247 | 28.14% |
| Wage / Income Gap ($) | 21,247 | 71.86¢ per $1 |
| Gini / Inequality Index | 21,247 | 0.45 |
Earnings by Sex in Logan County
Average Earnings in Logan County are $31,099, $35,689 for men and $25,647 for women, a difference of 28.1%.

| Sex | Number | Average Earnings |
| Male | 5,497 (53.4%) | $35,689 |
| Female | 4,801 (46.6%) | $25,647 |
| Total | 10,298 (100.0%) | $31,099 |
Earnings by Sex by Income Bracket in Logan County
The most common earnings brackets in Logan County are $30,000 to $34,999 for men (650 | 11.8%) and $25,000 to $29,999 for women (505 | 10.5%).

| Income | Male | Female |
| $2,499 or less | 244 (4.4%) | 420 (8.7%) |
| $2,500 to $4,999 | 189 (3.4%) | 149 (3.1%) |
| $5,000 to $7,499 | 98 (1.8%) | 280 (5.8%) |
| $7,500 to $9,999 | 81 (1.5%) | 124 (2.6%) |
| $10,000 to $12,499 | 233 (4.2%) | 243 (5.1%) |
| $12,500 to $14,999 | 149 (2.7%) | 175 (3.6%) |
| $15,000 to $17,499 | 160 (2.9%) | 174 (3.6%) |
| $17,500 to $19,999 | 82 (1.5%) | 156 (3.3%) |
| $20,000 to $22,499 | 234 (4.3%) | 282 (5.9%) |
| $22,500 to $24,999 | 127 (2.3%) | 325 (6.8%) |
| $25,000 to $29,999 | 456 (8.3%) | 505 (10.5%) |
| $30,000 to $34,999 | 650 (11.8%) | 408 (8.5%) |
| $35,000 to $39,999 | 384 (7.0%) | 305 (6.4%) |
| $40,000 to $44,999 | 419 (7.6%) | 249 (5.2%) |
| $45,000 to $49,999 | 371 (6.8%) | 216 (4.5%) |
| $50,000 to $54,999 | 179 (3.3%) | 168 (3.5%) |
| $55,000 to $64,999 | 359 (6.5%) | 181 (3.8%) |
| $65,000 to $74,999 | 273 (5.0%) | 122 (2.5%) |
| $75,000 to $99,999 | 382 (7.0%) | 185 (3.8%) |
| $100,000+ | 427 (7.8%) | 134 (2.8%) |
| Total | 5,497 (100.0%) | 4,801 (100.0%) |
Earnings by Sex by Educational Attainment in Logan County
Average earnings in Logan County are $39,344 for men and $28,416 for women, a difference of 27.8%. Men with an educational attainment of graduate degree enjoy the highest average annual earnings of $55,853, while those with less than high school education earn the least with $34,005. Women with an educational attainment of graduate degree earn the most with the average annual earnings of $60,443, while those with less than high school education have the smallest earnings of $22,344.
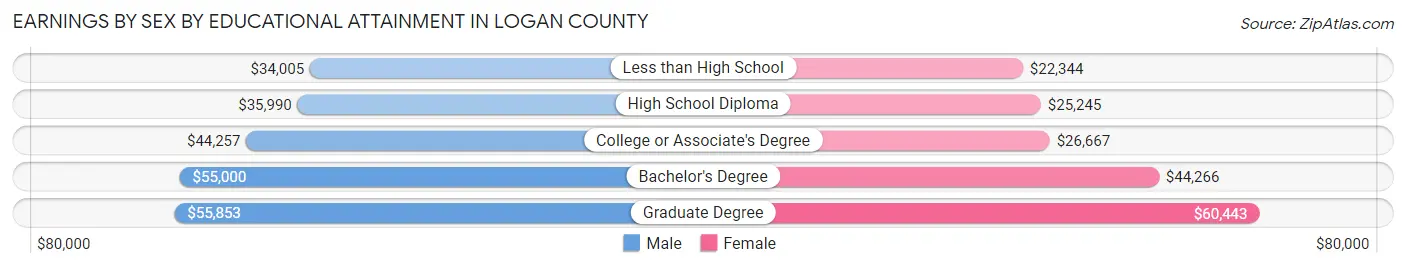
| Educational Attainment | Male Income | Female Income |
| Less than High School | $34,005 | $22,344 |
| High School Diploma | $35,990 | $25,245 |
| College or Associate's Degree | $44,257 | $26,667 |
| Bachelor's Degree | $55,000 | $44,266 |
| Graduate Degree | $55,853 | $60,443 |
| Total | $39,344 | $28,416 |
Family Income in Logan County
Family Income Brackets in Logan County
According to the Logan County family income data, there are 1,252 families falling into the $50,000 to $74,999 income range, which is the most common income bracket and makes up 22.0% of all families. Conversely, the $10,000 to $14,999 income bracket is the least frequent group with only 74 families (1.3%) belonging to this category.

| Income Bracket | # Families | % Families |
| Less than $10,000 | 176 | 3.1% |
| $10,000 to $14,999 | 74 | 1.3% |
| $15,000 to $24,999 | 387 | 6.8% |
| $25,000 to $34,999 | 546 | 9.6% |
| $35,000 to $49,999 | 990 | 17.4% |
| $50,000 to $74,999 | 1,252 | 22.0% |
| $75,000 to $99,999 | 905 | 15.9% |
| $100,000 to $149,999 | 882 | 15.5% |
| $150,000 to $199,999 | 279 | 4.9% |
| $200,000+ | 205 | 3.6% |
Family Income by Famaliy Size in Logan County
5-person families (532 | 9.3%) account for the highest median family income in Logan County with $92,739 per family, while 2-person families (2,578 | 45.3%) have the highest median income of $28,056 per family member.

| Income Bracket | # Families | Median Income |
| 2-Person Families | 2,578 (45.3%) | $56,111 |
| 3-Person Families | 1,398 (24.6%) | $67,553 |
| 4-Person Families | 906 (15.9%) | $68,962 |
| 5-Person Families | 532 (9.3%) | $92,739 |
| 6-Person Families | 199 (3.5%) | $68,456 |
| 7+ Person Families | 79 (1.4%) | $44,514 |
| Total | 5,692 (100.0%) | $64,891 |
Family Income by Number of Earners in Logan County
The median family income in Logan County is $64,891, with families comprising 3+ earners (486) having the highest median family income of $109,444, while families with no earners (1,116) have the lowest median family income of $40,000, accounting for 8.5% and 19.6% of families, respectively.

| Number of Earners | # Families | Median Income |
| No Earners | 1,116 (19.6%) | $40,000 |
| 1 Earner | 1,814 (31.9%) | $47,279 |
| 2 Earners | 2,276 (40.0%) | $81,688 |
| 3+ Earners | 486 (8.5%) | $109,444 |
| Total | 5,692 (100.0%) | $64,891 |
Household Income in Logan County
Household Income Brackets in Logan County
With 1,748 households falling in the category, the $50,000 to $74,999 income range is the most frequent in Logan County, accounting for 20.8% of all households. In contrast, only 261 households (3.1%) fall into the $200,000+ income bracket, making it the least populous group.

| Income Bracket | # Households | % Households |
| Less than $10,000 | 462 | 5.5% |
| $10,000 to $14,999 | 429 | 5.1% |
| $15,000 to $24,999 | 807 | 9.6% |
| $25,000 to $34,999 | 807 | 9.6% |
| $35,000 to $49,999 | 1,572 | 18.7% |
| $50,000 to $74,999 | 1,748 | 20.8% |
| $75,000 to $99,999 | 1,034 | 12.3% |
| $100,000 to $149,999 | 958 | 11.4% |
| $150,000 to $199,999 | 328 | 3.9% |
| $200,000+ | 261 | 3.1% |
Household Income by Householder Age in Logan County
The median household income in Logan County is $51,131, with the highest median household income of $59,306 found in the 45 to 64 years age bracket for the primary householder. A total of 3,234 households (38.5%) fall into this category. Meanwhile, the 65+ years age bracket for the primary householder has the lowest median household income of $39,622, with 2,593 households (30.8%) in this group.

| Income Bracket | # Households | Median Income |
| 15 to 24 Years | 377 (4.5%) | $41,563 |
| 25 to 44 Years | 2,201 (26.2%) | $55,050 |
| 45 to 64 Years | 3,234 (38.5%) | $59,306 |
| 65+ Years | 2,593 (30.8%) | $39,622 |
| Total | 8,405 (100.0%) | $51,131 |
Poverty in Logan County
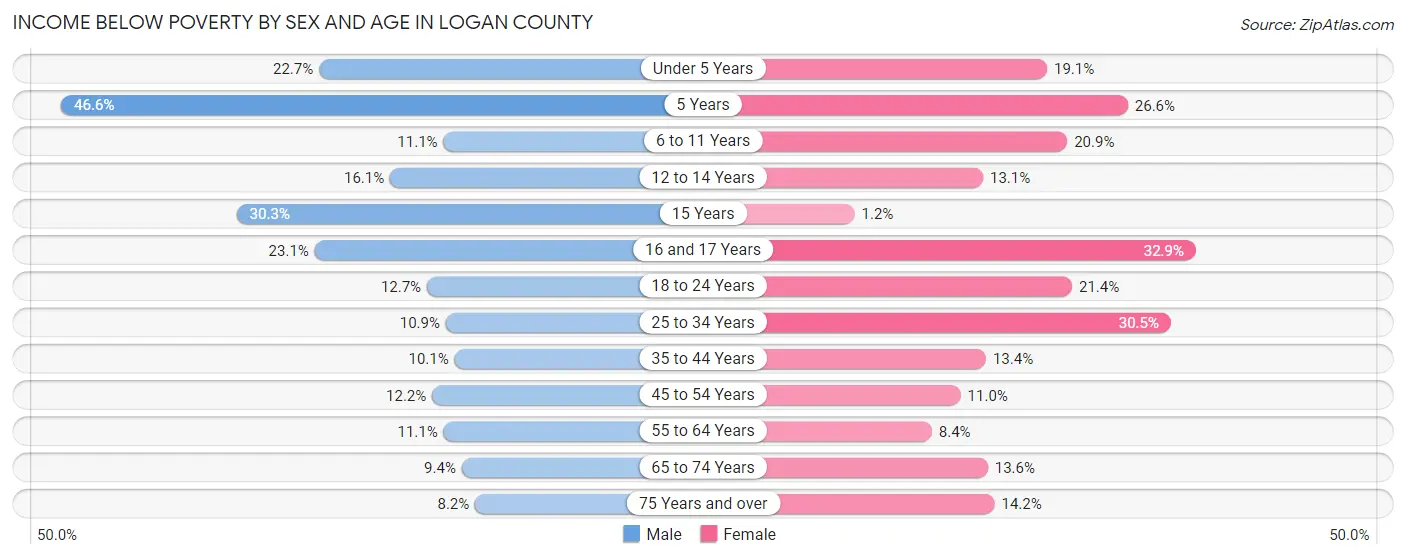
Income Below Poverty by Sex and Age in Logan County
With 12.6% poverty level for males and 16.4% for females among the residents of Logan County, 5 year old males and 16 and 17 year old females are the most vulnerable to poverty, with 55 males (46.6%) and 91 females (32.9%) in their respective age groups living below the poverty level.
| Age Bracket | Male | Female |
| Under 5 Years | 117 (22.7%) | 124 (19.1%) |
| 5 Years | 55 (46.6%) | 30 (26.6%) |
| 6 to 11 Years | 72 (11.1%) | 155 (20.9%) |
| 12 to 14 Years | 69 (16.1%) | 46 (13.1%) |
| 15 Years | 47 (30.3%) | 1 (1.2%) |
| 16 and 17 Years | 66 (23.1%) | 91 (32.9%) |
| 18 to 24 Years | 99 (12.7%) | 168 (21.4%) |
| 25 to 34 Years | 135 (10.9%) | 371 (30.5%) |
| 35 to 44 Years | 126 (10.1%) | 162 (13.4%) |
| 45 to 54 Years | 169 (12.2%) | 148 (11.0%) |
| 55 to 64 Years | 173 (11.1%) | 136 (8.4%) |
| 65 to 74 Years | 113 (9.4%) | 171 (13.6%) |
| 75 Years and over | 62 (8.2%) | 130 (14.2%) |
| Total | 1,303 (12.6%) | 1,733 (16.4%) |
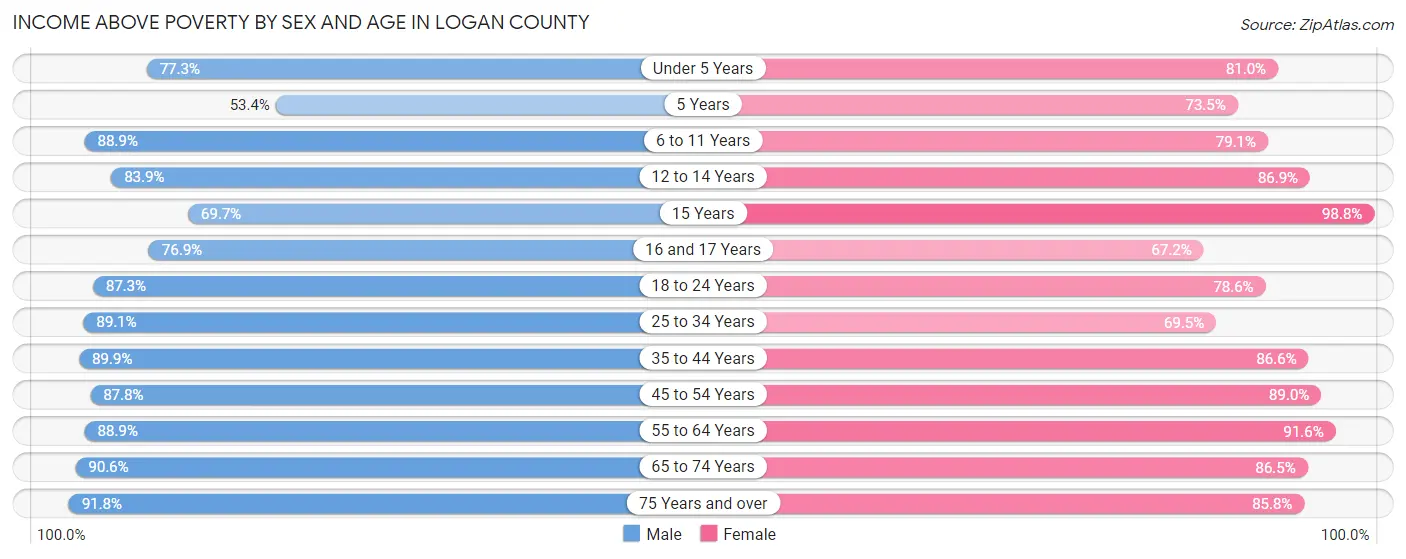
Income Above Poverty by Sex and Age in Logan County
According to the poverty statistics in Logan County, males aged 75 years and over and females aged 15 years are the age groups that are most secure financially, with 91.8% of males and 98.8% of females in these age groups living above the poverty line.
| Age Bracket | Male | Female |
| Under 5 Years | 399 (77.3%) | 527 (80.9%) |
| 5 Years | 63 (53.4%) | 83 (73.5%) |
| 6 to 11 Years | 575 (88.9%) | 586 (79.1%) |
| 12 to 14 Years | 360 (83.9%) | 305 (86.9%) |
| 15 Years | 108 (69.7%) | 83 (98.8%) |
| 16 and 17 Years | 220 (76.9%) | 186 (67.1%) |
| 18 to 24 Years | 683 (87.3%) | 618 (78.6%) |
| 25 to 34 Years | 1,102 (89.1%) | 844 (69.5%) |
| 35 to 44 Years | 1,122 (89.9%) | 1,049 (86.6%) |
| 45 to 54 Years | 1,218 (87.8%) | 1,194 (89.0%) |
| 55 to 64 Years | 1,383 (88.9%) | 1,490 (91.6%) |
| 65 to 74 Years | 1,085 (90.6%) | 1,091 (86.5%) |
| 75 Years and over | 695 (91.8%) | 787 (85.8%) |
| Total | 9,013 (87.4%) | 8,843 (83.6%) |
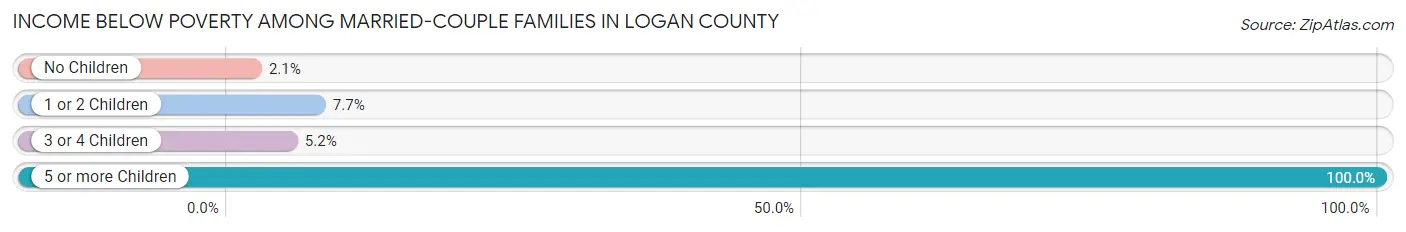
Income Below Poverty Among Married-Couple Families in Logan County
The poverty statistics for married-couple families in Logan County show that 4.9% or 215 of the total 4,432 families live below the poverty line. Families with 5 or more children have the highest poverty rate of 100.0%, comprising of 27 families. On the other hand, families with no children have the lowest poverty rate of 2.1%, which includes 52 families.
| Children | Above Poverty | Below Poverty |
| No Children | 2,453 (97.9%) | 52 (2.1%) |
| 1 or 2 Children | 1,400 (92.3%) | 116 (7.6%) |
| 3 or 4 Children | 364 (94.8%) | 20 (5.2%) |
| 5 or more Children | 0 (0.0%) | 27 (100.0%) |
| Total | 4,217 (95.2%) | 215 (4.9%) |
Income Below Poverty Among Single-Parent Households in Logan County
According to the poverty data in Logan County, 8.0% or 33 single-father households and 31.6% or 267 single-mother households are living below the poverty line. Among single-father households, those with 1 or 2 children have the highest poverty rate, with 26 households (11.9%) experiencing poverty. Likewise, among single-mother households, those with 1 or 2 children have the highest poverty rate, with 181 households (43.8%) falling below the poverty line.

| Children | Single Father | Single Mother |
| No Children | 7 (4.6%) | 1 (0.4%) |
| 1 or 2 Children | 26 (11.9%) | 181 (43.8%) |
| 3 or 4 Children | 0 (0.0%) | 85 (43.1%) |
| 5 or more Children | 0 (0.0%) | 0 (0.0%) |
| Total | 33 (8.0%) | 267 (31.6%) |
Income Below Poverty Among Married-Couple vs Single-Parent Households in Logan County
The poverty data for Logan County shows that 215 of the married-couple family households (4.9%) and 300 of the single-parent households (23.8%) are living below the poverty level. Within the married-couple family households, those with 5 or more children have the highest poverty rate, with 27 households (100.0%) falling below the poverty line. Among the single-parent households, those with 3 or 4 children have the highest poverty rate, with 85 household (40.7%) living below poverty.

| Children | Married-Couple Families | Single-Parent Households |
| No Children | 52 (2.1%) | 8 (2.1%) |
| 1 or 2 Children | 116 (7.6%) | 207 (32.8%) |
| 3 or 4 Children | 20 (5.2%) | 85 (40.7%) |
| 5 or more Children | 27 (100.0%) | 0 (0.0%) |
| Total | 215 (4.9%) | 300 (23.8%) |
Employment Characteristics in Logan County
Employment by Class of Employer in Logan County
Among the 9,042 employed individuals in Logan County, private company employees (5,488 | 60.7%), local government employees (960 | 10.6%), and not-for-profit organizations (816 | 9.0%) make up the most common classes of employment.

| Employer Class | # Employees | % Employees |
| Private Company Employees | 5,488 | 60.7% |
| Self-Employed (Incorporated) | 313 | 3.5% |
| Self-Employed (Not Incorporated) | 554 | 6.1% |
| Not-for-profit Organizations | 816 | 9.0% |
| Local Government Employees | 960 | 10.6% |
| State Government Employees | 651 | 7.2% |
| Federal Government Employees | 214 | 2.4% |
| Unpaid Family Workers | 46 | 0.5% |
| Total | 9,042 | 100.0% |
Employment Status by Age in Logan County
According to the labor force statistics for Logan County, out of the total population over 16 years of age (17,324), 56.6% or 9,805 individuals are in the labor force, with 5.5% or 539 of them unemployed. The age group with the highest labor force participation rate is 30 to 34 years, with 83.0% or 1,072 individuals in the labor force. Within the labor force, the 16 to 19 years age range has the highest percentage of unemployed individuals, with 24.5% or 75 of them being unemployed.

| Age Bracket | In Labor Force | Unemployed |
| 16 to 19 Years | 306 (31.7%) | 75 (24.5%) |
| 20 to 24 Years | 906 (77.7%) | 23 (2.5%) |
| 25 to 29 Years | 909 (77.4%) | 93 (10.2%) |
| 30 to 34 Years | 1,072 (83.0%) | 48 (4.5%) |
| 35 to 44 Years | 2,012 (80.5%) | 235 (11.7%) |
| 45 to 54 Years | 1,952 (71.0%) | 20 (1.0%) |
| 55 to 59 Years | 1,320 (79.4%) | 8 (0.6%) |
| 60 to 64 Years | 764 (49.0%) | 28 (3.7%) |
| 65 to 74 Years | 477 (19.2%) | 11 (2.3%) |
| 75 Years and over | 90 (5.1%) | 0 (0.0%) |
| Total | 9,805 (56.6%) | 539 (5.5%) |
Employment Status by Educational Attainment in Logan County
According to labor force statistics for Logan County, 73.4% of individuals (8,027) out of the total population between 25 and 64 years of age (10,936) are in the labor force, with 5.4% or 433 of them being unemployed. The group with the highest labor force participation rate are those with the educational attainment of bachelor's degree or higher, with 84.9% or 1,379 individuals in the labor force. Within the labor force, individuals with college / associate degree education have the highest percentage of unemployment, with 7.0% or 200 of them being unemployed.

| Educational Attainment | In Labor Force | Unemployed |
| Less than High School | 566 (50.0%) | 52 (4.6%) |
| High School Diploma | 3,233 (70.4%) | 253 (5.5%) |
| College / Associate Degree | 2,850 (79.4%) | 251 (7.0%) |
| Bachelor's Degree or higher | 1,379 (84.9%) | 32 (2.0%) |
| Total | 8,027 (73.4%) | 591 (5.4%) |
Employment Occupations by Sex in Logan County
Management, Business, Science and Arts Occupations
The most common Management, Business, Science and Arts occupations in Logan County are Community & Social Service (905 | 9.8%), Education Instruction & Library (653 | 7.0%), Management (648 | 7.0%), Health Diagnosing & Treating (583 | 6.3%), and Business & Financial (273 | 2.9%).

Management, Business, Science and Arts Occupations by Sex
Within the Management, Business, Science and Arts occupations in Logan County, the most male-oriented occupations are Computers & Mathematics (100.0%), Legal Services & Support (89.8%), and Computers, Engineering & Science (79.2%), while the most female-oriented occupations are Health Diagnosing & Treating (87.8%), Health Technologists (86.0%), and Education Instruction & Library (82.9%).

| Occupation | Male | Female |
| Management | 454 (70.1%) | 194 (29.9%) |
| Business & Financial | 133 (48.7%) | 140 (51.3%) |
| Computers, Engineering & Science | 187 (79.2%) | 49 (20.8%) |
| Computers & Mathematics | 122 (100.0%) | 0 (0.0%) |
| Architecture & Engineering | 39 (73.6%) | 14 (26.4%) |
| Life, Physical & Social Science | 26 (42.6%) | 35 (57.4%) |
| Community & Social Service | 254 (28.1%) | 651 (71.9%) |
| Education, Arts & Media | 64 (42.4%) | 87 (57.6%) |
| Legal Services & Support | 53 (89.8%) | 6 (10.2%) |
| Education Instruction & Library | 112 (17.2%) | 541 (82.9%) |
| Arts, Media & Entertainment | 25 (59.5%) | 17 (40.5%) |
| Health Diagnosing & Treating | 71 (12.2%) | 512 (87.8%) |
| Health Technologists | 34 (14.0%) | 209 (86.0%) |
| Total (Category) | 1,099 (41.5%) | 1,546 (58.5%) |
| Total (Overall) | 5,057 (54.6%) | 4,210 (45.4%) |
Services Occupations
The most common Services occupations in Logan County are Food Preparation & Serving (492 | 5.3%), Cleaning & Maintenance (414 | 4.5%), Healthcare Support (369 | 4.0%), Personal Care & Service (183 | 2.0%), and Security & Protection (86 | 0.9%).

Services Occupations by Sex
Within the Services occupations in Logan County, the most male-oriented occupations are Firefighting & Prevention (89.3%), Security & Protection (77.9%), and Cleaning & Maintenance (73.9%), while the most female-oriented occupations are Personal Care & Service (97.3%), Healthcare Support (68.6%), and Food Preparation & Serving (60.2%).

| Occupation | Male | Female |
| Healthcare Support | 116 (31.4%) | 253 (68.6%) |
| Security & Protection | 67 (77.9%) | 19 (22.1%) |
| Firefighting & Prevention | 25 (89.3%) | 3 (10.7%) |
| Law Enforcement | 42 (72.4%) | 16 (27.6%) |
| Food Preparation & Serving | 196 (39.8%) | 296 (60.2%) |
| Cleaning & Maintenance | 306 (73.9%) | 108 (26.1%) |
| Personal Care & Service | 5 (2.7%) | 178 (97.3%) |
| Total (Category) | 690 (44.7%) | 854 (55.3%) |
| Total (Overall) | 5,057 (54.6%) | 4,210 (45.4%) |
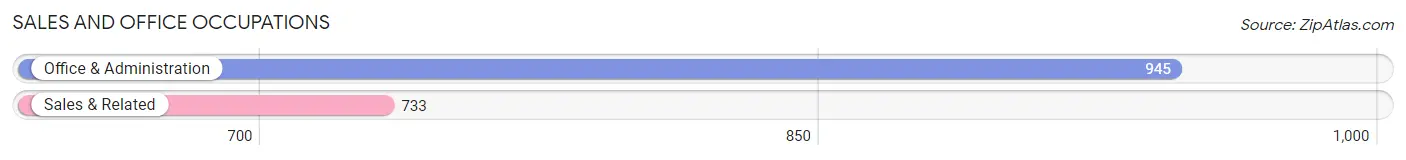
Sales and Office Occupations
The most common Sales and Office occupations in Logan County are Office & Administration (945 | 10.2%), and Sales & Related (733 | 7.9%).
Sales and Office Occupations by Sex

| Occupation | Male | Female |
| Sales & Related | 246 (33.6%) | 487 (66.4%) |
| Office & Administration | 186 (19.7%) | 759 (80.3%) |
| Total (Category) | 432 (25.7%) | 1,246 (74.3%) |
| Total (Overall) | 5,057 (54.6%) | 4,210 (45.4%) |
Natural Resources, Construction and Maintenance Occupations
The most common Natural Resources, Construction and Maintenance occupations in Logan County are Installation, Maintenance & Repair (427 | 4.6%), Construction & Extraction (387 | 4.2%), and Farming, Fishing & Forestry (261 | 2.8%).

Natural Resources, Construction and Maintenance Occupations by Sex

| Occupation | Male | Female |
| Farming, Fishing & Forestry | 200 (76.6%) | 61 (23.4%) |
| Construction & Extraction | 387 (100.0%) | 0 (0.0%) |
| Installation, Maintenance & Repair | 419 (98.1%) | 8 (1.9%) |
| Total (Category) | 1,006 (93.6%) | 69 (6.4%) |
| Total (Overall) | 5,057 (54.6%) | 4,210 (45.4%) |
Production, Transportation and Moving Occupations
The most common Production, Transportation and Moving occupations in Logan County are Production (1,393 | 15.0%), Material Moving (630 | 6.8%), and Transportation (302 | 3.3%).

Production, Transportation and Moving Occupations by Sex

| Occupation | Male | Female |
| Production | 1,004 (72.1%) | 389 (27.9%) |
| Transportation | 285 (94.4%) | 17 (5.6%) |
| Material Moving | 541 (85.9%) | 89 (14.1%) |
| Total (Category) | 1,830 (78.7%) | 495 (21.3%) |
| Total (Overall) | 5,057 (54.6%) | 4,210 (45.4%) |
Employment Industries by Sex in Logan County
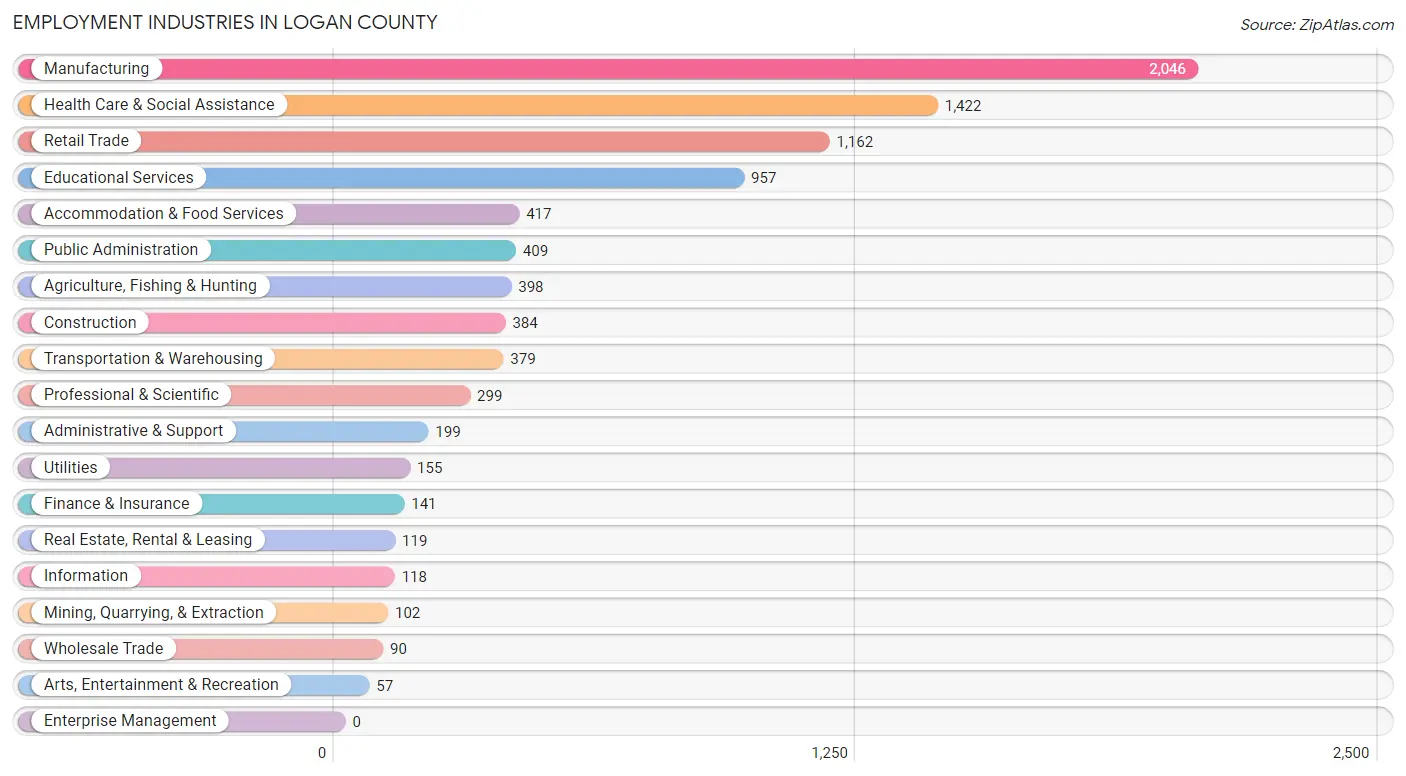
Employment Industries in Logan County
The major employment industries in Logan County include Manufacturing (2,046 | 22.1%), Health Care & Social Assistance (1,422 | 15.3%), Retail Trade (1,162 | 12.5%), Educational Services (957 | 10.3%), and Accommodation & Food Services (417 | 4.5%).
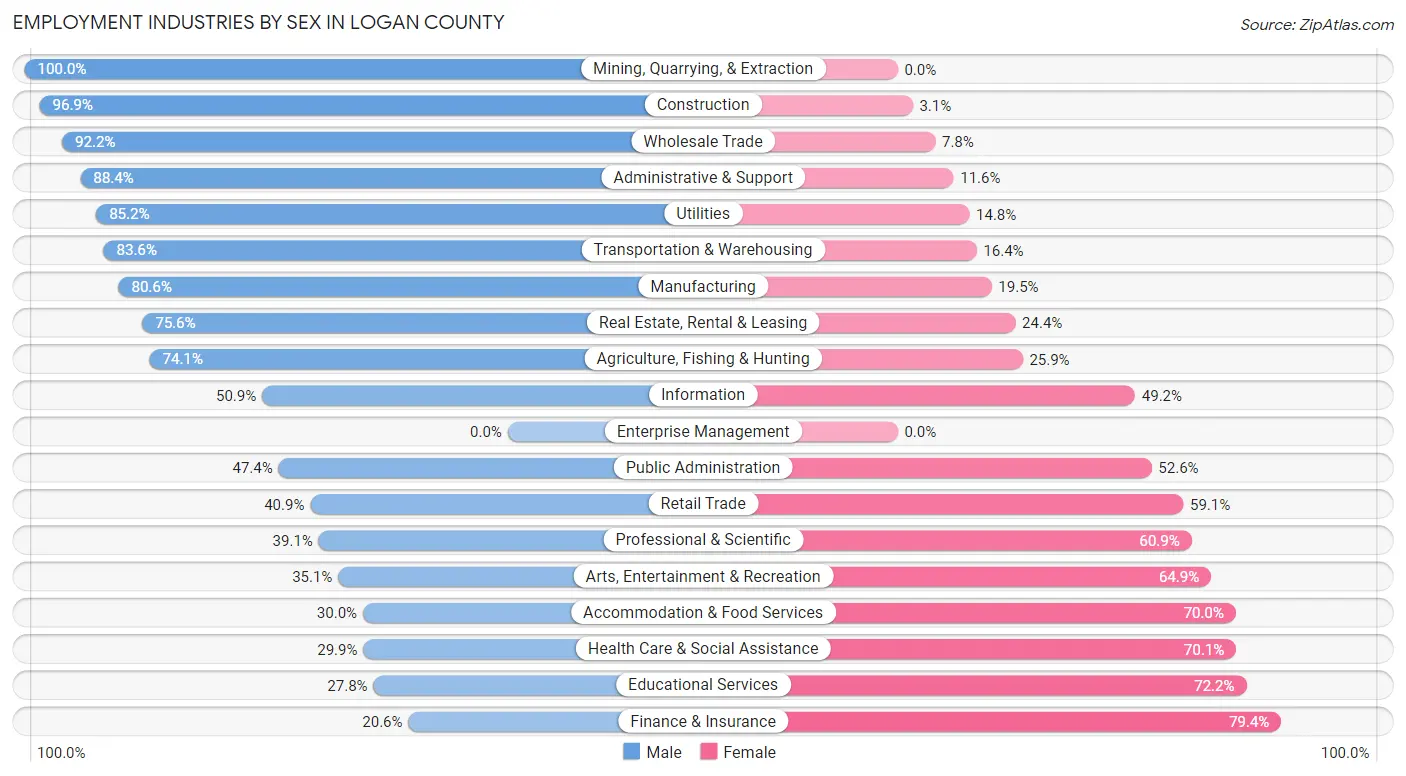
Employment Industries by Sex in Logan County
The Logan County industries that see more men than women are Mining, Quarrying, & Extraction (100.0%), Construction (96.9%), and Wholesale Trade (92.2%), whereas the industries that tend to have a higher number of women are Finance & Insurance (79.4%), Educational Services (72.2%), and Health Care & Social Assistance (70.1%).
| Industry | Male | Female |
| Agriculture, Fishing & Hunting | 295 (74.1%) | 103 (25.9%) |
| Mining, Quarrying, & Extraction | 102 (100.0%) | 0 (0.0%) |
| Construction | 372 (96.9%) | 12 (3.1%) |
| Manufacturing | 1,648 (80.5%) | 398 (19.5%) |
| Wholesale Trade | 83 (92.2%) | 7 (7.8%) |
| Retail Trade | 475 (40.9%) | 687 (59.1%) |
| Transportation & Warehousing | 317 (83.6%) | 62 (16.4%) |
| Utilities | 132 (85.2%) | 23 (14.8%) |
| Information | 60 (50.8%) | 58 (49.1%) |
| Finance & Insurance | 29 (20.6%) | 112 (79.4%) |
| Real Estate, Rental & Leasing | 90 (75.6%) | 29 (24.4%) |
| Professional & Scientific | 117 (39.1%) | 182 (60.9%) |
| Enterprise Management | 0 (0.0%) | 0 (0.0%) |
| Administrative & Support | 176 (88.4%) | 23 (11.6%) |
| Educational Services | 266 (27.8%) | 691 (72.2%) |
| Health Care & Social Assistance | 425 (29.9%) | 997 (70.1%) |
| Arts, Entertainment & Recreation | 20 (35.1%) | 37 (64.9%) |
| Accommodation & Food Services | 125 (30.0%) | 292 (70.0%) |
| Public Administration | 194 (47.4%) | 215 (52.6%) |
| Total | 5,057 (54.6%) | 4,210 (45.4%) |
Education in Logan County
School Enrollment in Logan County
The most common levels of schooling among the 4,485 students in Logan County are middle school (1,244 | 27.7%), high school (907 | 20.2%), and college / undergraduate (826 | 18.4%).

| School Level | # Students | % Students |
| Nursery / Preschool | 392 | 8.7% |
| Kindergarten | 218 | 4.9% |
| Elementary School | 785 | 17.5% |
| Middle School | 1,244 | 27.7% |
| High School | 907 | 20.2% |
| College / Undergraduate | 826 | 18.4% |
| Graduate / Professional | 113 | 2.5% |
| Total | 4,485 | 100.0% |
School Enrollment by Age by Funding Source in Logan County
Out of a total of 4,485 students who are enrolled in schools in Logan County, 556 (12.4%) attend a private institution, while the remaining 3,929 (87.6%) are enrolled in public schools. The age group of 35 years and over has the highest likelihood of being enrolled in private schools, with 77 (33.9% in the age bracket) enrolled. Conversely, the age group of 25 to 34 year olds has the lowest likelihood of being enrolled in a private school, with 278 (100.0% in the age bracket) attending a public institution.

| Age Bracket | Public School | Private School |
| 3 to 4 Year Olds | 220 (66.5%) | 111 (33.5%) |
| 5 to 9 Year Old | 881 (89.4%) | 104 (10.6%) |
| 10 to 14 Year Olds | 1,154 (84.5%) | 212 (15.5%) |
| 15 to 17 Year Olds | 764 (96.3%) | 29 (3.7%) |
| 18 to 19 Year Olds | 191 (98.5%) | 3 (1.5%) |
| 20 to 24 Year Olds | 291 (93.6%) | 20 (6.4%) |
| 25 to 34 Year Olds | 278 (100.0%) | 0 (0.0%) |
| 35 Years and over | 150 (66.1%) | 77 (33.9%) |
| Total | 3,929 (87.6%) | 556 (12.4%) |
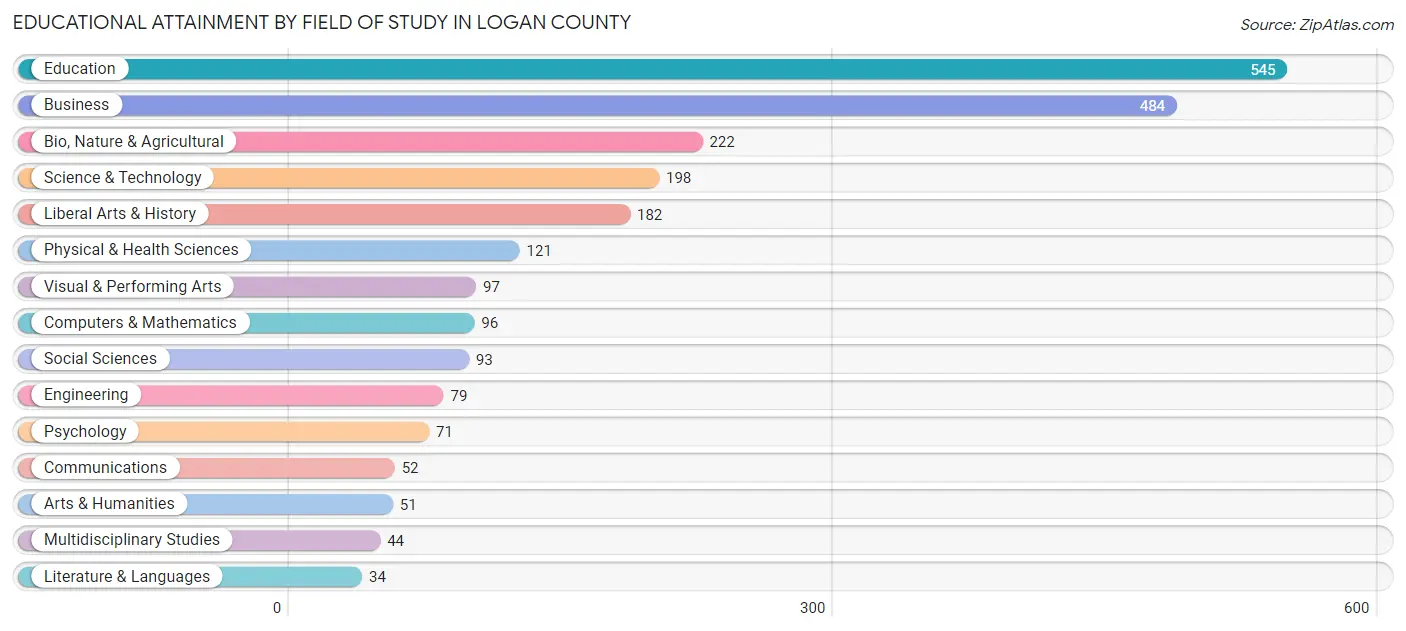
Educational Attainment by Field of Study in Logan County
Education (545 | 23.0%), business (484 | 20.4%), bio, nature & agricultural (222 | 9.4%), science & technology (198 | 8.4%), and liberal arts & history (182 | 7.7%) are the most common fields of study among 2,369 individuals in Logan County who have obtained a bachelor's degree or higher.
| Field of Study | # Graduates | % Graduates |
| Computers & Mathematics | 96 | 4.1% |
| Bio, Nature & Agricultural | 222 | 9.4% |
| Physical & Health Sciences | 121 | 5.1% |
| Psychology | 71 | 3.0% |
| Social Sciences | 93 | 3.9% |
| Engineering | 79 | 3.3% |
| Multidisciplinary Studies | 44 | 1.9% |
| Science & Technology | 198 | 8.4% |
| Business | 484 | 20.4% |
| Education | 545 | 23.0% |
| Literature & Languages | 34 | 1.4% |
| Liberal Arts & History | 182 | 7.7% |
| Visual & Performing Arts | 97 | 4.1% |
| Communications | 52 | 2.2% |
| Arts & Humanities | 51 | 2.1% |
| Total | 2,369 | 100.0% |
Transportation & Commute in Logan County
Vehicle Availability by Sex in Logan County
The most prevalent vehicle ownership categories in Logan County are males with 2 vehicles (1,771, accounting for 36.5%) and females with 2 vehicles (1,413, making up 43.3%).

| Vehicles Available | Male | Female |
| No Vehicle | 281 (5.8%) | 15 (0.4%) |
| 1 Vehicle | 736 (15.2%) | 901 (22.1%) |
| 2 Vehicles | 1,771 (36.5%) | 1,413 (34.6%) |
| 3 Vehicles | 1,142 (23.5%) | 914 (22.4%) |
| 4 Vehicles | 655 (13.5%) | 617 (15.1%) |
| 5 or more Vehicles | 268 (5.5%) | 225 (5.5%) |
| Total | 4,853 (100.0%) | 4,085 (100.0%) |
Commute Time in Logan County
The most frequently occuring commute durations in Logan County are 5 to 9 minutes (1,617 commuters, 18.7%), 10 to 14 minutes (1,253 commuters, 14.5%), and less than 5 minutes (999 commuters, 11.6%).

| Commute Time | # Commuters | % Commuters |
| Less than 5 Minutes | 999 | 11.6% |
| 5 to 9 Minutes | 1,617 | 18.7% |
| 10 to 14 Minutes | 1,253 | 14.5% |
| 15 to 19 Minutes | 809 | 9.3% |
| 20 to 24 Minutes | 561 | 6.5% |
| 25 to 29 Minutes | 314 | 3.6% |
| 30 to 34 Minutes | 822 | 9.5% |
| 35 to 39 Minutes | 206 | 2.4% |
| 40 to 44 Minutes | 238 | 2.8% |
| 45 to 59 Minutes | 909 | 10.5% |
| 60 to 89 Minutes | 705 | 8.2% |
| 90 or more Minutes | 218 | 2.5% |
Commute Time by Sex in Logan County
The most common commute times in Logan County are 5 to 9 minutes (786 commuters, 16.6%) for males and 5 to 9 minutes (831 commuters, 21.2%) for females.

| Commute Time | Male | Female |
| Less than 5 Minutes | 475 (10.1%) | 524 (13.4%) |
| 5 to 9 Minutes | 786 (16.6%) | 831 (21.2%) |
| 10 to 14 Minutes | 630 (13.3%) | 623 (15.9%) |
| 15 to 19 Minutes | 461 (9.8%) | 348 (8.9%) |
| 20 to 24 Minutes | 274 (5.8%) | 287 (7.3%) |
| 25 to 29 Minutes | 157 (3.3%) | 157 (4.0%) |
| 30 to 34 Minutes | 467 (9.9%) | 355 (9.0%) |
| 35 to 39 Minutes | 94 (2.0%) | 112 (2.9%) |
| 40 to 44 Minutes | 162 (3.4%) | 76 (1.9%) |
| 45 to 59 Minutes | 676 (14.3%) | 233 (5.9%) |
| 60 to 89 Minutes | 438 (9.3%) | 267 (6.8%) |
| 90 or more Minutes | 107 (2.3%) | 111 (2.8%) |
Time of Departure to Work by Sex in Logan County
The most frequent times of departure to work in Logan County are 6:00 AM to 6:29 AM (685, 14.5%) for males and 7:00 AM to 7:29 AM (826, 21.0%) for females.

| Time of Departure | Male | Female |
| 12:00 AM to 4:59 AM | 475 (10.1%) | 221 (5.6%) |
| 5:00 AM to 5:29 AM | 341 (7.2%) | 133 (3.4%) |
| 5:30 AM to 5:59 AM | 443 (9.4%) | 250 (6.4%) |
| 6:00 AM to 6:29 AM | 685 (14.5%) | 234 (6.0%) |
| 6:30 AM to 6:59 AM | 577 (12.2%) | 429 (10.9%) |
| 7:00 AM to 7:29 AM | 398 (8.4%) | 826 (21.0%) |
| 7:30 AM to 7:59 AM | 281 (5.9%) | 555 (14.1%) |
| 8:00 AM to 8:29 AM | 249 (5.3%) | 285 (7.3%) |
| 8:30 AM to 8:59 AM | 161 (3.4%) | 157 (4.0%) |
| 9:00 AM to 9:59 AM | 17 (0.4%) | 155 (4.0%) |
| 10:00 AM to 10:59 AM | 20 (0.4%) | 87 (2.2%) |
| 11:00 AM to 11:59 AM | 44 (0.9%) | 33 (0.8%) |
| 12:00 PM to 3:59 PM | 542 (11.5%) | 406 (10.3%) |
| 4:00 PM to 11:59 PM | 494 (10.4%) | 153 (3.9%) |
| Total | 4,727 (100.0%) | 3,924 (100.0%) |
Housing Occupancy in Logan County
Occupancy by Ownership in Logan County
Of the total 8,405 dwellings in Logan County, owner-occupied units account for 6,229 (74.1%), while renter-occupied units make up 2,176 (25.9%).

| Occupancy | # Housing Units | % Housing Units |
| Owner Occupied Housing Units | 6,229 | 74.1% |
| Renter-Occupied Housing Units | 2,176 | 25.9% |
| Total Occupied Housing Units | 8,405 | 100.0% |
Occupancy by Household Size in Logan County

| Household Size | # Housing Units | % Housing Units |
| 1-Person Household | 2,375 | 28.3% |
| 2-Person Household | 2,636 | 31.4% |
| 3-Person Household | 1,601 | 19.1% |
| 4+ Person Household | 1,793 | 21.3% |
| Total Housing Units | 8,405 | 100.0% |
Occupancy by Ownership by Household Size in Logan County
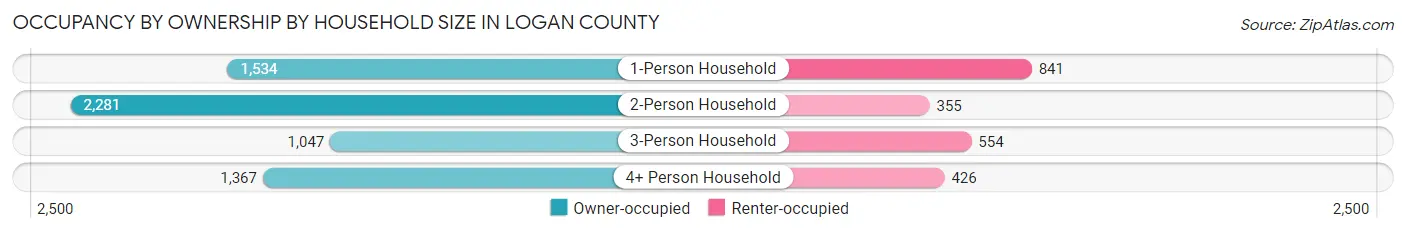
| Household Size | Owner-occupied | Renter-occupied |
| 1-Person Household | 1,534 (64.6%) | 841 (35.4%) |
| 2-Person Household | 2,281 (86.5%) | 355 (13.5%) |
| 3-Person Household | 1,047 (65.4%) | 554 (34.6%) |
| 4+ Person Household | 1,367 (76.2%) | 426 (23.8%) |
| Total Housing Units | 6,229 (74.1%) | 2,176 (25.9%) |
Occupancy by Educational Attainment in Logan County

| Household Size | Owner-occupied | Renter-occupied |
| Less than High School | 526 (57.0%) | 397 (43.0%) |
| High School Diploma | 2,463 (74.9%) | 826 (25.1%) |
| College/Associate Degree | 2,054 (73.9%) | 726 (26.1%) |
| Bachelor's Degree or higher | 1,186 (83.9%) | 227 (16.1%) |
Occupancy by Age of Householder in Logan County

| Age Bracket | # Households | % Households |
| Under 35 Years | 1,393 | 16.6% |
| 35 to 44 Years | 1,185 | 14.1% |
| 45 to 54 Years | 1,468 | 17.5% |
| 55 to 64 Years | 1,766 | 21.0% |
| 65 to 74 Years | 1,478 | 17.6% |
| 75 to 84 Years | 893 | 10.6% |
| 85 Years and Over | 222 | 2.6% |
| Total | 8,405 | 100.0% |
Housing Finances in Logan County
Median Income by Occupancy in Logan County

| Occupancy Type | # Households | Median Income |
| Owner-Occupied | 6,229 (74.1%) | $58,586 |
| Renter-Occupied | 2,176 (25.9%) | $40,915 |
| Average | 8,405 (100.0%) | $51,131 |
Occupancy by Householder Income Bracket in Logan County
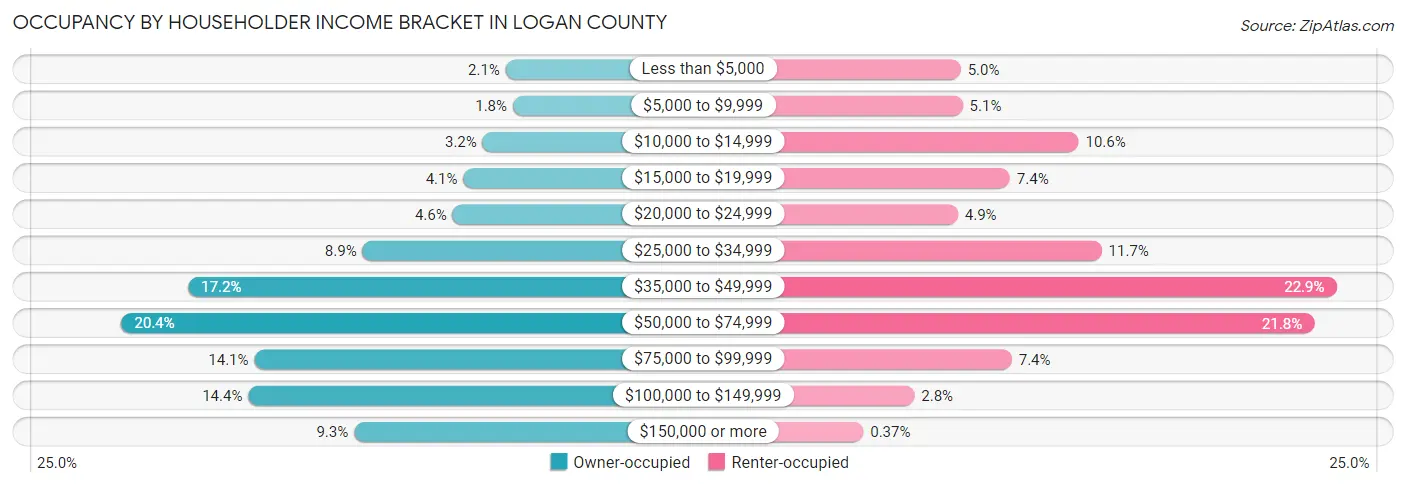
| Income Bracket | Owner-occupied | Renter-occupied |
| Less than $5,000 | 130 (2.1%) | 109 (5.0%) |
| $5,000 to $9,999 | 109 (1.8%) | 111 (5.1%) |
| $10,000 to $14,999 | 199 (3.2%) | 231 (10.6%) |
| $15,000 to $19,999 | 256 (4.1%) | 160 (7.3%) |
| $20,000 to $24,999 | 288 (4.6%) | 106 (4.9%) |
| $25,000 to $34,999 | 555 (8.9%) | 255 (11.7%) |
| $35,000 to $49,999 | 1,072 (17.2%) | 498 (22.9%) |
| $50,000 to $74,999 | 1,270 (20.4%) | 475 (21.8%) |
| $75,000 to $99,999 | 876 (14.1%) | 162 (7.4%) |
| $100,000 to $149,999 | 894 (14.3%) | 61 (2.8%) |
| $150,000 or more | 580 (9.3%) | 8 (0.4%) |
| Total | 6,229 (100.0%) | 2,176 (100.0%) |
Monthly Housing Cost Tiers in Logan County

| Monthly Cost | Owner-occupied | Renter-occupied |
| Less than $300 | 1,141 (18.3%) | 112 (5.1%) |
| $300 to $499 | 1,702 (27.3%) | 164 (7.5%) |
| $500 to $799 | 1,091 (17.5%) | 988 (45.4%) |
| $800 to $999 | 752 (12.1%) | 458 (21.0%) |
| $1,000 to $1,499 | 960 (15.4%) | 65 (3.0%) |
| $1,500 to $1,999 | 315 (5.1%) | 2 (0.1%) |
| $2,000 to $2,499 | 125 (2.0%) | 0 (0.0%) |
| $2,500 to $2,999 | 70 (1.1%) | 0 (0.0%) |
| $3,000 or more | 73 (1.2%) | 0 (0.0%) |
| Total | 6,229 (100.0%) | 2,176 (100.0%) |
Physical Housing Characteristics in Logan County
Housing Structures in Logan County

| Structure Type | # Housing Units | % Housing Units |
| Single Unit, Detached | 6,663 | 79.3% |
| Single Unit, Attached | 115 | 1.4% |
| 2 Unit Apartments | 209 | 2.5% |
| 3 or 4 Unit Apartments | 296 | 3.5% |
| 5 to 9 Unit Apartments | 50 | 0.6% |
| 10 or more Apartments | 113 | 1.3% |
| Mobile Home / Other | 959 | 11.4% |
| Total | 8,405 | 100.0% |
Housing Structures by Occupancy in Logan County

| Structure Type | Owner-occupied | Renter-occupied |
| Single Unit, Detached | 5,500 (82.6%) | 1,163 (17.4%) |
| Single Unit, Attached | 68 (59.1%) | 47 (40.9%) |
| 2 Unit Apartments | 0 (0.0%) | 209 (100.0%) |
| 3 or 4 Unit Apartments | 0 (0.0%) | 296 (100.0%) |
| 5 to 9 Unit Apartments | 0 (0.0%) | 50 (100.0%) |
| 10 or more Apartments | 0 (0.0%) | 113 (100.0%) |
| Mobile Home / Other | 661 (68.9%) | 298 (31.1%) |
| Total | 6,229 (74.1%) | 2,176 (25.9%) |
Housing Structures by Number of Rooms in Logan County

| Number of Rooms | Owner-occupied | Renter-occupied |
| 1 Room | 1 (0.0%) | 39 (1.8%) |
| 2 or 3 Rooms | 107 (1.7%) | 314 (14.4%) |
| 4 or 5 Rooms | 2,245 (36.0%) | 1,236 (56.8%) |
| 6 or 7 Rooms | 2,477 (39.8%) | 496 (22.8%) |
| 8 or more Rooms | 1,399 (22.5%) | 91 (4.2%) |
| Total | 6,229 (100.0%) | 2,176 (100.0%) |
Housing Structure by Heating Type in Logan County

| Heating Type | Owner-occupied | Renter-occupied |
| Utility Gas | 1,804 (29.0%) | 715 (32.9%) |
| Bottled, Tank, or LP Gas | 252 (4.1%) | 79 (3.6%) |
| Electricity | 3,530 (56.7%) | 1,244 (57.2%) |
| Fuel Oil or Kerosene | 32 (0.5%) | 11 (0.5%) |
| Coal or Coke | 0 (0.0%) | 0 (0.0%) |
| All other Fuels | 577 (9.3%) | 127 (5.8%) |
| No Fuel Used | 34 (0.5%) | 0 (0.0%) |
| Total | 6,229 (100.0%) | 2,176 (100.0%) |
Household Vehicle Usage in Logan County

| Vehicles per Household | Owner-occupied | Renter-occupied |
| No Vehicle | 155 (2.5%) | 280 (12.9%) |
| 1 Vehicle | 1,262 (20.3%) | 1,128 (51.8%) |
| 2 Vehicles | 2,515 (40.4%) | 581 (26.7%) |
| 3 or more Vehicles | 2,297 (36.9%) | 187 (8.6%) |
| Total | 6,229 (100.0%) | 2,176 (100.0%) |
Real Estate & Mortgages in Logan County
Real Estate and Mortgage Overview in Logan County
| Characteristic | Without Mortgage | With Mortgage |
| Housing Units | 3,240 | 2,989 |
| Median Property Value | $106,400 | $138,200 |
| Median Household Income | $49,497 | $401 |
| Monthly Housing Costs | $356 | $73 |
| Real Estate Taxes | $601 | $125 |
Property Value by Mortgage Status in Logan County

| Property Value | Without Mortgage | With Mortgage |
| Less than $50,000 | 543 (16.8%) | 84 (2.8%) |
| $50,000 to $99,999 | 973 (30.0%) | 778 (26.0%) |
| $100,000 to $299,999 | 1,532 (47.3%) | 1,802 (60.3%) |
| $300,000 to $499,999 | 131 (4.0%) | 236 (7.9%) |
| $500,000 to $749,999 | 25 (0.8%) | 15 (0.5%) |
| $750,000 to $999,999 | 8 (0.3%) | 39 (1.3%) |
| $1,000,000 or more | 28 (0.9%) | 35 (1.2%) |
| Total | 3,240 (100.0%) | 2,989 (100.0%) |
Household Income by Mortgage Status in Logan County

| Household Income | Without Mortgage | With Mortgage |
| Less than $10,000 | 183 (5.7%) | 29 (1.0%) |
| $10,000 to $24,999 | 506 (15.6%) | 56 (1.9%) |
| $25,000 to $34,999 | 388 (12.0%) | 237 (7.9%) |
| $35,000 to $49,999 | 578 (17.8%) | 167 (5.6%) |
| $50,000 to $74,999 | 686 (21.2%) | 494 (16.5%) |
| $75,000 to $99,999 | 389 (12.0%) | 584 (19.5%) |
| $100,000 to $149,999 | 331 (10.2%) | 487 (16.3%) |
| $150,000 or more | 179 (5.5%) | 563 (18.8%) |
| Total | 3,240 (100.0%) | 2,989 (100.0%) |
Property Value to Household Income Ratio in Logan County

| Value-to-Income Ratio | Without Mortgage | With Mortgage |
| Less than 2.0x | 1,476 (45.6%) | 73,855 (2,470.9%) |
| 2.0x to 2.9x | 689 (21.3%) | 1,559 (52.2%) |
| 3.0x to 3.9x | 319 (9.9%) | 619 (20.7%) |
| 4.0x or more | 699 (21.6%) | 301 (10.1%) |
| Total | 3,240 (100.0%) | 2,989 (100.0%) |
Real Estate Taxes by Mortgage Status in Logan County
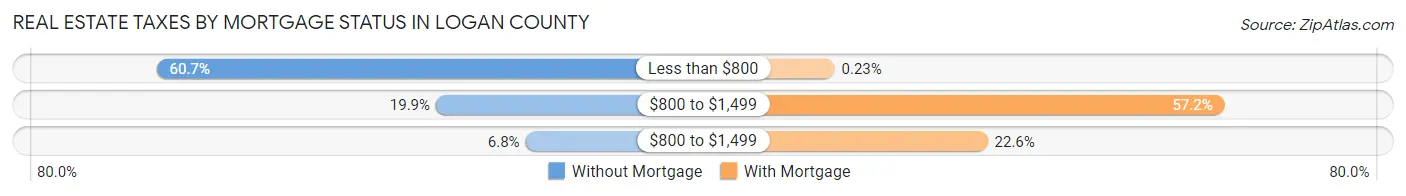
| Property Taxes | Without Mortgage | With Mortgage |
| Less than $800 | 1,967 (60.7%) | 7 (0.2%) |
| $800 to $1,499 | 645 (19.9%) | 1,710 (57.2%) |
| $800 to $1,499 | 221 (6.8%) | 675 (22.6%) |
| Total | 3,240 (100.0%) | 2,989 (100.0%) |
Health & Disability in Logan County
Health Insurance Coverage by Age in Logan County

| Age Bracket | With Coverage | Without Coverage |
| Under 6 Years | 1,475 (99.6%) | 6 (0.4%) |
| 6 to 18 Years | 3,044 (93.3%) | 217 (6.7%) |
| 19 to 25 Years | 1,309 (83.7%) | 255 (16.3%) |
| 26 to 34 Years | 1,910 (86.8%) | 290 (13.2%) |
| 35 to 44 Years | 2,112 (85.9%) | 347 (14.1%) |
| 45 to 54 Years | 2,584 (94.7%) | 145 (5.3%) |
| 55 to 64 Years | 3,042 (95.6%) | 140 (4.4%) |
| 65 to 74 Years | 2,460 (100.0%) | 0 (0.0%) |
| 75 Years and older | 1,672 (99.9%) | 2 (0.1%) |
| Total | 19,608 (93.3%) | 1,402 (6.7%) |
Health Insurance Coverage by Citizenship Status in Logan County

| Citizenship Status | With Coverage | Without Coverage |
| Native Born | 1,475 (99.6%) | 6 (0.4%) |
| Foreign Born, Citizen | 3,044 (93.3%) | 217 (6.7%) |
| Foreign Born, not a Citizen | 1,309 (83.7%) | 255 (16.3%) |
Health Insurance Coverage by Household Income in Logan County

| Household Income | With Coverage | Without Coverage |
| Under $25,000 | 2,453 (94.3%) | 148 (5.7%) |
| $25,000 to $49,999 | 5,256 (89.2%) | 633 (10.7%) |
| $50,000 to $74,999 | 4,273 (92.1%) | 366 (7.9%) |
| $75,000 to $99,999 | 2,610 (97.4%) | 70 (2.6%) |
| $100,000 and over | 4,676 (96.7%) | 160 (3.3%) |
Public vs Private Health Insurance Coverage by Age in Logan County

| Age Bracket | Public Insurance | Private Insurance |
| Under 6 | 1,040 (70.2%) | 481 (32.5%) |
| 6 to 18 Years | 1,718 (52.7%) | 1,625 (49.8%) |
| 19 to 25 Years | 437 (27.9%) | 915 (58.5%) |
| 25 to 34 Years | 724 (32.9%) | 1,316 (59.8%) |
| 35 to 44 Years | 724 (29.4%) | 1,504 (61.2%) |
| 45 to 54 Years | 768 (28.1%) | 2,040 (74.8%) |
| 55 to 64 Years | 841 (26.4%) | 2,391 (75.1%) |
| 65 to 74 Years | 2,425 (98.6%) | 1,239 (50.4%) |
| 75 Years and over | 1,672 (99.9%) | 703 (42.0%) |
| Total | 10,349 (49.3%) | 12,214 (58.1%) |
Disability Status by Sex by Age in Logan County

| Age Bracket | Male | Female |
| Under 5 Years | 0 (0.0%) | 3 (0.5%) |
| 5 to 17 Years | 148 (9.0%) | 96 (6.0%) |
| 18 to 34 Years | 289 (14.3%) | 159 (8.0%) |
| 35 to 64 Years | 961 (22.9%) | 983 (23.5%) |
| 65 to 74 Years | 487 (40.6%) | 453 (35.9%) |
| 75 Years and over | 511 (67.5%) | 544 (59.3%) |
Disability Class by Sex by Age in Logan County
Disability Class: Hearing Difficulty

| Age Bracket | Male | Female |
| Under 5 Years | 0 (0.0%) | 3 (0.5%) |
| 5 to 17 Years | 6 (0.4%) | 37 (2.3%) |
| 18 to 34 Years | 79 (3.9%) | 23 (1.1%) |
| 35 to 64 Years | 335 (8.0%) | 229 (5.5%) |
| 65 to 74 Years | 214 (17.9%) | 121 (9.6%) |
| 75 Years and over | 297 (39.2%) | 210 (22.9%) |
Disability Class: Vision Difficulty

| Age Bracket | Male | Female |
| Under 5 Years | 0 (0.0%) | 0 (0.0%) |
| 5 to 17 Years | 58 (3.5%) | 8 (0.5%) |
| 18 to 34 Years | 35 (1.7%) | 39 (1.9%) |
| 35 to 64 Years | 176 (4.2%) | 155 (3.7%) |
| 65 to 74 Years | 109 (9.1%) | 20 (1.6%) |
| 75 Years and over | 123 (16.3%) | 135 (14.7%) |
Disability Class: Cognitive Difficulty

| Age Bracket | Male | Female |
| 5 to 17 Years | 85 (5.2%) | 54 (3.4%) |
| 18 to 34 Years | 170 (8.4%) | 137 (6.9%) |
| 35 to 64 Years | 430 (10.3%) | 416 (10.0%) |
| 65 to 74 Years | 149 (12.4%) | 89 (7.0%) |
| 75 Years and over | 106 (14.0%) | 116 (12.7%) |
Disability Class: Ambulatory Difficulty
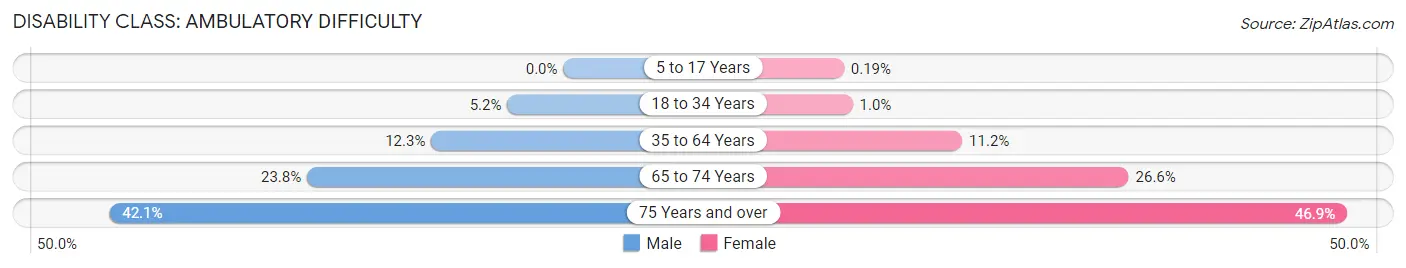
| Age Bracket | Male | Female |
| 5 to 17 Years | 0 (0.0%) | 3 (0.2%) |
| 18 to 34 Years | 105 (5.2%) | 20 (1.0%) |
| 35 to 64 Years | 514 (12.3%) | 467 (11.2%) |
| 65 to 74 Years | 285 (23.8%) | 336 (26.6%) |
| 75 Years and over | 319 (42.1%) | 430 (46.9%) |
Disability Class: Self-Care Difficulty
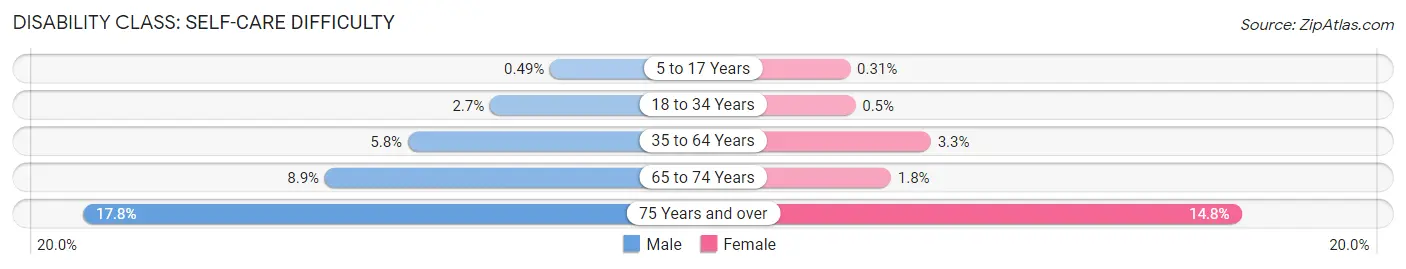
| Age Bracket | Male | Female |
| 5 to 17 Years | 8 (0.5%) | 5 (0.3%) |
| 18 to 34 Years | 55 (2.7%) | 10 (0.5%) |
| 35 to 64 Years | 242 (5.8%) | 138 (3.3%) |
| 65 to 74 Years | 106 (8.8%) | 23 (1.8%) |
| 75 Years and over | 135 (17.8%) | 136 (14.8%) |
Technology Access in Logan County
Computing Device Access in Logan County
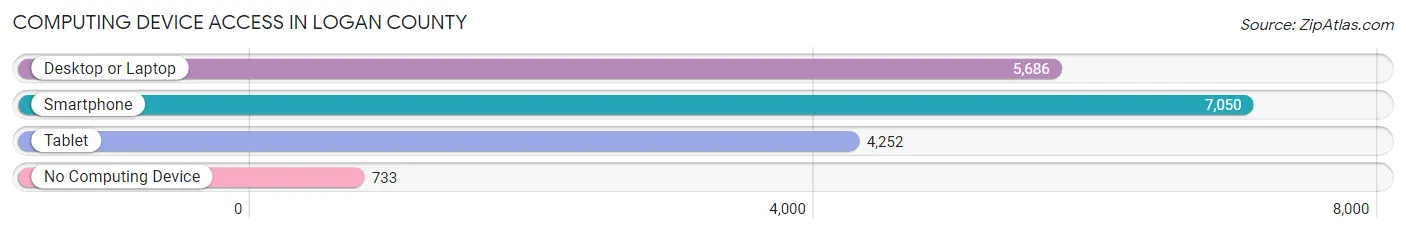
| Device Type | # Households | % Households |
| Desktop or Laptop | 5,686 | 67.6% |
| Smartphone | 7,050 | 83.9% |
| Tablet | 4,252 | 50.6% |
| No Computing Device | 733 | 8.7% |
| Total | 8,405 | 100.0% |
Internet Access in Logan County

| Internet Type | # Households | % Households |
| Dial-Up Internet | 10 | 0.1% |
| Broadband Home | 3,964 | 47.2% |
| Cellular Data Only | 1,394 | 16.6% |
| Satellite Internet | 1,298 | 15.4% |
| No Internet | 1,900 | 22.6% |
| Total | 8,405 | 100.0% |
Logan County Summary
Logan County, Arkansas is located in the western part of the state and is part of the Fort Smith metropolitan area. It is bordered by Franklin County to the north, Scott County to the east, Yell County to the south, and Sebastian County to the west. The county seat is Paris, and the largest city is Booneville. The county was established in 1871 and named for James Logan, a prominent early settler.
Geography
Logan County covers an area of 602 square miles and is located in the Ozark Mountains. The terrain is mostly hilly and forested, with the highest point being Mount Magazine at 2,753 feet. The county is drained by the Petit Jean River and its tributaries. The climate is humid subtropical, with hot, humid summers and mild winters.
Demographics
As of the 2010 census, Logan County had a population of 22,353. The racial makeup of the county was 94.2% White, 1.3% Black or African American, 0.7% Native American, 0.3% Asian, 0.1% Pacific Islander, 2.2% from other races, and 1.3% from two or more races. 4.3% of the population were Hispanic or Latino of any race.
Economy
Logan County’s economy is largely based on agriculture, with the main crops being soybeans, corn, and cotton. Livestock production is also important, with cattle, hogs, and poultry being the main animals raised. Manufacturing is also a major part of the economy, with companies such as Tyson Foods, Simmons Foods, and Unilever having plants in the county. The county also has a growing tourism industry, with attractions such as Mount Magazine State Park and the Arkansas River Valley.
History
Logan County was established in 1871 and named for James Logan, a prominent early settler. The county was originally part of Franklin County, but was split off due to its large size. The first county seat was located in Booneville, but was moved to Paris in 1875.
The county was largely rural until the early 20th century, when the timber and railroad industries began to develop. The timber industry was especially important, with the county producing large amounts of lumber for the rest of the state. The railroad industry also grew, with the St. Louis-San Francisco Railway (Frisco) and the Kansas City Southern Railway both having lines in the county.
The county was also home to several military installations during World War II, including Camp Chaffee and Camp Robinson. These installations brought a large influx of people to the county, and helped to spur economic growth.
Today, Logan County is a largely rural county, with agriculture and manufacturing being the main industries. The county is also home to several tourist attractions, including Mount Magazine State Park and the Arkansas River Valley.
Common Questions
What is the Total Population of Logan County?
Total Population of Logan County is 21,247.
What is the Total Male Population of Logan County?
Total Male Population of Logan County is 10,501.
What is the Total Female Population of Logan County?
Total Female Population of Logan County is 10,746.
What is the Ratio of Males per 100 Females in Logan County?
There are 97.72 Males per 100 Females in Logan County.
What is the Ratio of Females per 100 Males in Logan County?
There are 102.33 Females per 100 Males in Logan County.
What is the Median Population Age in Logan County?
Median Population Age in Logan County is 43.5 Years.
What is the Average Family Size in Logan County
Average Family Size in Logan County is 3.0 People.
What is the Average Household Size in Logan County
Average Household Size in Logan County is 2.5 People.
What is Per Capita Income in Logan County?
Per Capita income in Logan County is $28,495.
What is the Median Family Income in Logan County?
Median Family Income in Logan County is $64,891.
What is the Median Household income in Logan County?
Median Household Income in Logan County is $51,131.
What is Income or Wage Gap in Logan County?
Income or Wage Gap in Logan County is 28.1%.
Women in Logan County earn 71.9 cents for every dollar earned by a man.
What is Family Income Deficit in Logan County?
Family Income Deficit in Logan County is $10,780.
Families that are below poverty line in Logan County earn $10,780 less on average than the poverty threshold level.
What is Inequality or Gini Index in Logan County?
Inequality or Gini Index in Logan County is 0.45.
How Large is the Labor Force in Logan County?
There are 9,805 People in the Labor Forcein in Logan County.
What is the Percentage of People in the Labor Force in Logan County?
56.6% of People are in the Labor Force in Logan County.
What is the Unemployment Rate in Logan County?
Unemployment Rate in Logan County is 5.5%.