Lincoln County, AR
Lincoln County Map
Lincoln County Overview
13,016
TOTAL POPULATION
8,335
MALE POPULATION
4,681
FEMALE POPULATION
178.06
MALES / 100 FEMALES
56.16
FEMALES / 100 MALES
40.6
MEDIAN AGE
3.1
AVG FAMILY SIZE
2.5
AVG HOUSEHOLD SIZE
$18,191
PER CAPITA INCOME
$64,237
AVG FAMILY INCOME
$50,526
AVG HOUSEHOLD INCOME
10.7%
WAGE / INCOME GAP [ % ]
89.3¢/ $1
WAGE / INCOME GAP [ $ ]
0.47
INEQUALITY / GINI INDEX
3,743
LABOR FORCE [ PEOPLE ]
32.9%
PERCENT IN LABOR FORCE
4.0%
UNEMPLOYMENT RATE
Lincoln County Area Codes
Race in Lincoln County
The most populous races in Lincoln County are White / Caucasian (8,250 | 63.4%), Black / African American (3,884 | 29.8%), and Hispanic or Latino (581 | 4.5%).

| Race | # Population | % Population |
| Asian | 0 | 0.0% |
| Black / African American | 3,884 | 29.8% |
| Hawaiian / Pacific | 0 | 0.0% |
| Hispanic or Latino | 581 | 4.5% |
| Native / Alaskan | 62 | 0.5% |
| White / Caucasian | 8,250 | 63.4% |
| Two or more Races | 331 | 2.5% |
| Some other Race | 489 | 3.8% |
| Total | 13,016 | 100.0% |
Ancestry in Lincoln County
The most populous ancestries reported in Lincoln County are American (834 | 6.4%), English (510 | 3.9%), Mexican (487 | 3.7%), Irish (455 | 3.5%), and German (289 | 2.2%), together accounting for 19.8% of all Lincoln County residents.

| Ancestry | # Population | % Population |
| African | 166 | 1.3% |
| American | 834 | 6.4% |
| Blackfeet | 2 | 0.0% |
| Brazilian | 10 | 0.1% |
| British | 45 | 0.4% |
| Cajun | 12 | 0.1% |
| Cherokee | 93 | 0.7% |
| Choctaw | 6 | 0.1% |
| Danish | 13 | 0.1% |
| Dutch | 52 | 0.4% |
| English | 510 | 3.9% |
| European | 74 | 0.6% |
| French | 140 | 1.1% |
| French Canadian | 4 | 0.0% |
| German | 289 | 2.2% |
| Haitian | 11 | 0.1% |
| Hungarian | 5 | 0.0% |
| Indian (Asian) | 11 | 0.1% |
| Irish | 455 | 3.5% |
| Iroquois | 5 | 0.0% |
| Italian | 105 | 0.8% |
| Mexican | 487 | 3.7% |
| Navajo | 5 | 0.0% |
| Northern European | 11 | 0.1% |
| Norwegian | 20 | 0.2% |
| Polish | 14 | 0.1% |
| Portuguese | 31 | 0.2% |
| Puerto Rican | 11 | 0.1% |
| Samoan | 5 | 0.0% |
| Scandinavian | 5 | 0.0% |
| Scotch-Irish | 60 | 0.5% |
| Scottish | 49 | 0.4% |
| Serbian | 7 | 0.1% |
| Spaniard | 13 | 0.1% |
| Spanish | 6 | 0.1% |
| Subsaharan African | 166 | 1.3% |
| Swedish | 11 | 0.1% |
| Swiss | 7 | 0.1% |
| Welsh | 30 | 0.2% | View All 39 Rows |
Immigrants in Lincoln County
The most numerous immigrant groups reported in Lincoln County came from Central America (277 | 2.1%), Latin America (277 | 2.1%), Mexico (277 | 2.1%), Europe (26 | 0.2%), and Northern Europe (17 | 0.1%), together accounting for 6.7% of all Lincoln County residents.

| Immigration Origin | # Population | % Population |
| Central America | 277 | 2.1% |
| Europe | 26 | 0.2% |
| Germany | 9 | 0.1% |
| Latin America | 277 | 2.1% |
| Mexico | 277 | 2.1% |
| Northern Europe | 17 | 0.1% |
| Western Europe | 9 | 0.1% | View All 7 Rows |
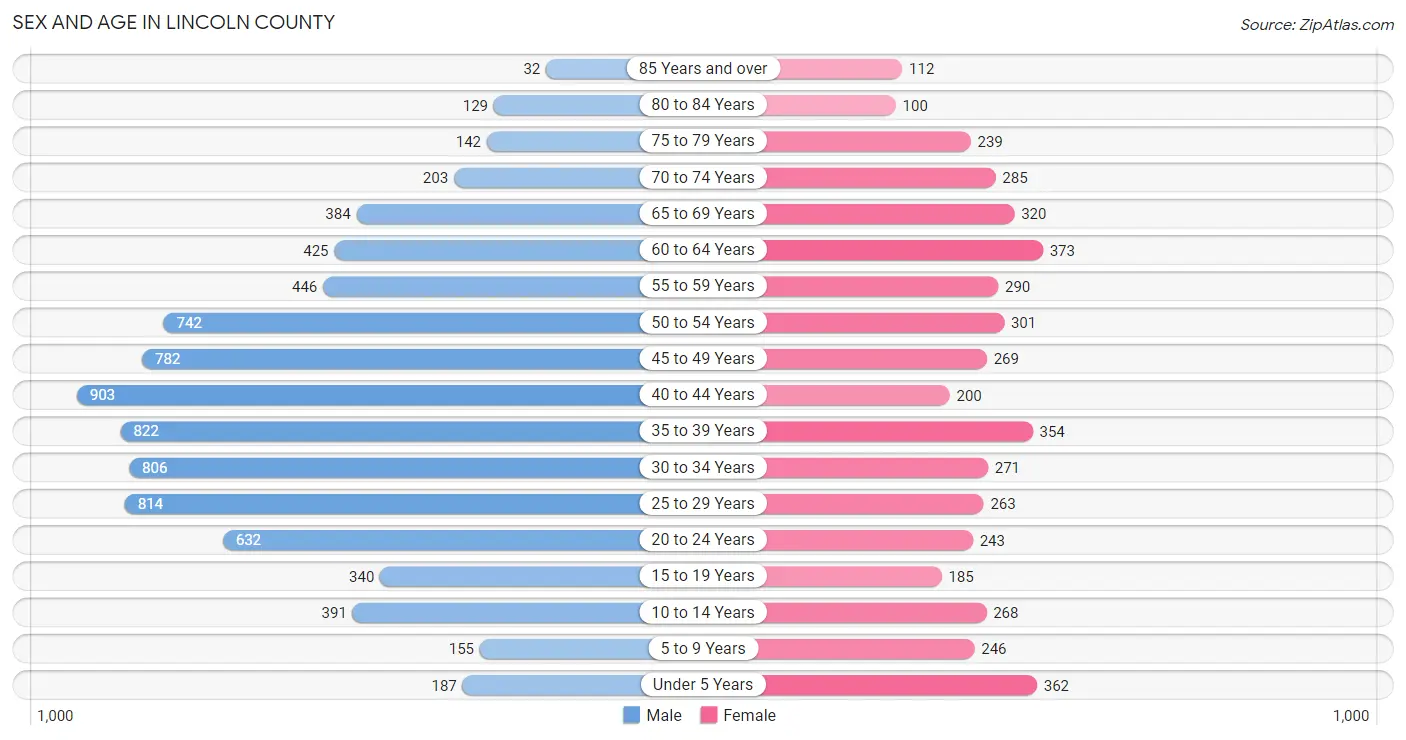
Sex and Age in Lincoln County
Sex and Age in Lincoln County
The most populous age groups in Lincoln County are 40 to 44 Years (903 | 10.8%) for men and 60 to 64 Years (373 | 8.0%) for women.
| Age Bracket | Male | Female |
| Under 5 Years | 187 (2.2%) | 362 (7.7%) |
| 5 to 9 Years | 155 (1.9%) | 246 (5.3%) |
| 10 to 14 Years | 391 (4.7%) | 268 (5.7%) |
| 15 to 19 Years | 340 (4.1%) | 185 (4.0%) |
| 20 to 24 Years | 632 (7.6%) | 243 (5.2%) |
| 25 to 29 Years | 814 (9.8%) | 263 (5.6%) |
| 30 to 34 Years | 806 (9.7%) | 271 (5.8%) |
| 35 to 39 Years | 822 (9.9%) | 354 (7.6%) |
| 40 to 44 Years | 903 (10.8%) | 200 (4.3%) |
| 45 to 49 Years | 782 (9.4%) | 269 (5.8%) |
| 50 to 54 Years | 742 (8.9%) | 301 (6.4%) |
| 55 to 59 Years | 446 (5.3%) | 290 (6.2%) |
| 60 to 64 Years | 425 (5.1%) | 373 (8.0%) |
| 65 to 69 Years | 384 (4.6%) | 320 (6.8%) |
| 70 to 74 Years | 203 (2.4%) | 285 (6.1%) |
| 75 to 79 Years | 142 (1.7%) | 239 (5.1%) |
| 80 to 84 Years | 129 (1.5%) | 100 (2.1%) |
| 85 Years and over | 32 (0.4%) | 112 (2.4%) |
| Total | 8,335 (100.0%) | 4,681 (100.0%) |
Families and Households in Lincoln County
Median Family Size in Lincoln County
The median family size in Lincoln County is 3.09 persons per family, with married-couple families (1,750 | 76.1%) accounting for the largest median family size of 3.19 persons per family. On the other hand, single male/father families (92 | 4.0%) represent the smallest median family size with 1.89 persons per family.

| Family Type | # Families | Family Size |
| Married-Couple | 1,750 (76.1%) | 3.19 |
| Single Male/Father | 92 (4.0%) | 1.89 |
| Single Female/Mother | 458 (19.9%) | 2.97 |
| Total Families | 2,300 (100.0%) | 3.09 |
Median Household Size in Lincoln County
The median household size in Lincoln County is 2.48 persons per household, with married-couple households (1,750 | 51.8%) accounting for the largest median household size of 3.2 persons per household. non-family households (1,078 | 31.9%) represent the smallest median household size with 1.14 persons per household.

| Household Type | # Households | Household Size |
| Married-Couple | 1,750 (51.8%) | 3.20 |
| Single Male/Father | 92 (2.7%) | 1.98 |
| Single Female/Mother | 458 (13.6%) | 3.01 |
| Non-family | 1,078 (31.9%) | 1.14 |
| Total Households | 3,378 (100.0%) | 2.48 |
Household Size by Marriage Status in Lincoln County
Out of a total of 3,378 households in Lincoln County, 2,300 (68.1%) are family households, while 1,078 (31.9%) are nonfamily households. The most numerous type of family households are 2-person households, comprising 1,132, and the most common type of nonfamily households are 1-person households, comprising 943.

| Household Size | Family Households | Nonfamily Households |
| 1-Person Households | - | 943 (27.9%) |
| 2-Person Households | 1,132 (33.5%) | 116 (3.4%) |
| 3-Person Households | 565 (16.7%) | 19 (0.6%) |
| 4-Person Households | 419 (12.4%) | 0 (0.0%) |
| 5-Person Households | 143 (4.2%) | 0 (0.0%) |
| 6-Person Households | 3 (0.1%) | 0 (0.0%) |
| 7+ Person Households | 38 (1.1%) | 0 (0.0%) |
| Total | 2,300 (68.1%) | 1,078 (31.9%) |
Female Fertility in Lincoln County
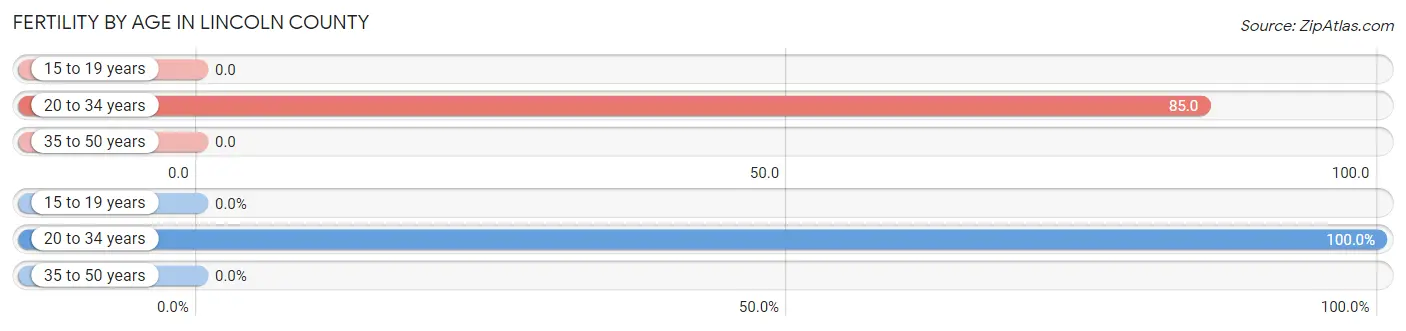
Fertility by Age in Lincoln County
Average fertility rate in Lincoln County is 35.0 births per 1,000 women. Women in the age bracket of 20 to 34 years have the highest fertility rate with 85.0 births per 1,000 women. Women in the age bracket of 20 to 34 years acount for 100.0% of all women with births.
| Age Bracket | Women with Births | Births / 1,000 Women |
| 15 to 19 years | 0 (0.0%) | 0.0 |
| 20 to 34 years | 66 (100.0%) | 85.0 |
| 35 to 50 years | 0 (0.0%) | 0.0 |
| Total | 66 (100.0%) | 35.0 |
Fertility by Age by Marriage Status in Lincoln County
65.2% of women with births (66) in Lincoln County are married. The highest percentage of unmarried women with births falls into 20 to 34 years age bracket with 34.8% of them unmarried at the time of birth, while the lowest percentage of unmarried women with births belong to 20 to 34 years age bracket with 34.9% of them unmarried.

| Age Bracket | Married | Unmarried |
| 15 to 19 years | 0 (0.0%) | 0 (0.0%) |
| 20 to 34 years | 43 (65.1%) | 23 (34.8%) |
| 35 to 50 years | 0 (0.0%) | 0 (0.0%) |
| Total | 43 (65.1%) | 23 (34.8%) |
Fertility by Education in Lincoln County

| Educational Attainment | Women with Births | Births / 1,000 Women |
| Less than High School | 0 (0.0%) | 0.0 |
| High School Diploma | 26 (39.4%) | 48.0 |
| College or Associate's Degree | 30 (45.5%) | 46.0 |
| Bachelor's Degree | 6 (9.1%) | 32.0 |
| Graduate Degree | 4 (6.1%) | 26.0 |
| Total | 66 (100.0%) | 35.0 |
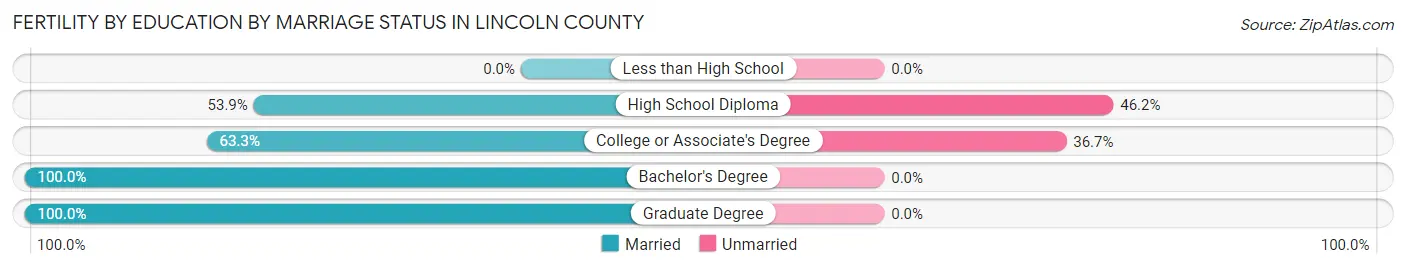
Fertility by Education by Marriage Status in Lincoln County
34.8% of women with births in Lincoln County are unmarried. Women with the educational attainment of bachelor's degree are most likely to be married with 100.0% of them married at childbirth, while women with the educational attainment of high school diploma are least likely to be married with 46.2% of them unmarried at childbirth.
| Educational Attainment | Married | Unmarried |
| Less than High School | 0 (0.0%) | 0 (0.0%) |
| High School Diploma | 14 (53.8%) | 12 (46.2%) |
| College or Associate's Degree | 19 (63.3%) | 11 (36.7%) |
| Bachelor's Degree | 6 (100.0%) | 0 (0.0%) |
| Graduate Degree | 4 (100.0%) | 0 (0.0%) |
| Total | 43 (65.1%) | 23 (34.8%) |
Income in Lincoln County
Income Overview in Lincoln County
Per Capita Income in Lincoln County is $18,191, while median incomes of families and households are $64,237 and $50,526 respectively.
| Characteristic | Number | Measure |
| Per Capita Income | 13,016 | $18,191 |
| Median Family Income | 2,300 | $64,237 |
| Mean Family Income | 2,300 | $79,258 |
| Median Household Income | 3,378 | $50,526 |
| Mean Household Income | 3,378 | $68,575 |
| Income Deficit | 2,300 | $0 |
| Wage / Income Gap (%) | 13,016 | 10.75% |
| Wage / Income Gap ($) | 13,016 | 89.25¢ per $1 |
| Gini / Inequality Index | 13,016 | 0.47 |
Earnings by Sex in Lincoln County
Average Earnings in Lincoln County are $34,948, $37,212 for men and $33,212 for women, a difference of 10.7%.

| Sex | Number | Average Earnings |
| Male | 2,003 (51.4%) | $37,212 |
| Female | 1,897 (48.6%) | $33,212 |
| Total | 3,900 (100.0%) | $34,948 |
Earnings by Sex by Income Bracket in Lincoln County
The most common earnings brackets in Lincoln County are $100,000+ for men (259 | 12.9%) and $40,000 to $44,999 for women (211 | 11.1%).

| Income | Male | Female |
| $2,499 or less | 36 (1.8%) | 108 (5.7%) |
| $2,500 to $4,999 | 88 (4.4%) | 112 (5.9%) |
| $5,000 to $7,499 | 43 (2.1%) | 89 (4.7%) |
| $7,500 to $9,999 | 29 (1.5%) | 41 (2.2%) |
| $10,000 to $12,499 | 148 (7.4%) | 28 (1.5%) |
| $12,500 to $14,999 | 54 (2.7%) | 69 (3.6%) |
| $15,000 to $17,499 | 38 (1.9%) | 77 (4.1%) |
| $17,500 to $19,999 | 33 (1.7%) | 41 (2.2%) |
| $20,000 to $22,499 | 49 (2.5%) | 94 (5.0%) |
| $22,500 to $24,999 | 59 (2.9%) | 76 (4.0%) |
| $25,000 to $29,999 | 231 (11.5%) | 99 (5.2%) |
| $30,000 to $34,999 | 136 (6.8%) | 176 (9.3%) |
| $35,000 to $39,999 | 95 (4.7%) | 126 (6.6%) |
| $40,000 to $44,999 | 60 (3.0%) | 211 (11.1%) |
| $45,000 to $49,999 | 74 (3.7%) | 110 (5.8%) |
| $50,000 to $54,999 | 75 (3.7%) | 107 (5.6%) |
| $55,000 to $64,999 | 175 (8.7%) | 114 (6.0%) |
| $65,000 to $74,999 | 146 (7.3%) | 39 (2.1%) |
| $75,000 to $99,999 | 175 (8.7%) | 114 (6.0%) |
| $100,000+ | 259 (12.9%) | 66 (3.5%) |
| Total | 2,003 (100.0%) | 1,897 (100.0%) |
Earnings by Sex by Educational Attainment in Lincoln County
Average earnings in Lincoln County are $51,176 for men and $34,223 for women, a difference of 33.1%. Men with an educational attainment of less than high school enjoy the highest average annual earnings of $64,896, while those with graduate degree education earn the least with $32,969. Women with an educational attainment of graduate degree earn the most with the average annual earnings of $64,565, while those with high school diploma education have the smallest earnings of $20,668.
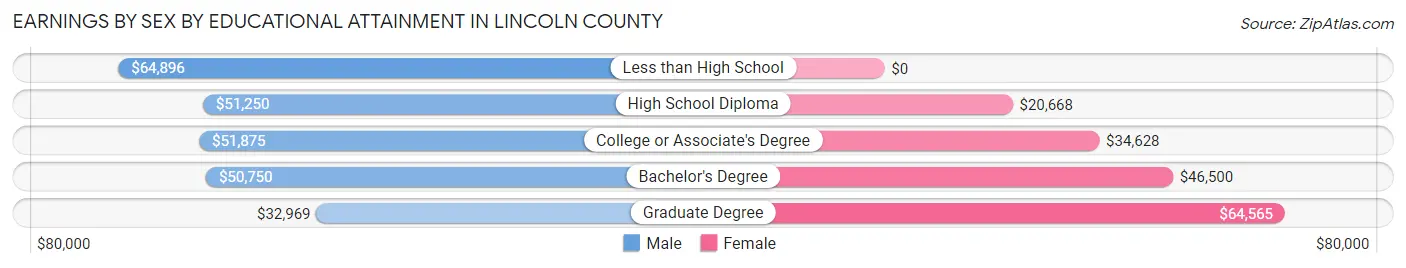
| Educational Attainment | Male Income | Female Income |
| Less than High School | $64,896 | $0 |
| High School Diploma | $51,250 | $20,668 |
| College or Associate's Degree | $51,875 | $34,628 |
| Bachelor's Degree | $50,750 | $46,500 |
| Graduate Degree | $32,969 | $64,565 |
| Total | $51,176 | $34,223 |
Family Income in Lincoln County
Family Income Brackets in Lincoln County
According to the Lincoln County family income data, there are 458 families falling into the $50,000 to $74,999 income range, which is the most common income bracket and makes up 19.9% of all families. Conversely, the $10,000 to $14,999 income bracket is the least frequent group with only 53 families (2.3%) belonging to this category.

| Income Bracket | # Families | % Families |
| Less than $10,000 | 92 | 4.0% |
| $10,000 to $14,999 | 53 | 2.3% |
| $15,000 to $24,999 | 356 | 15.5% |
| $25,000 to $34,999 | 168 | 7.3% |
| $35,000 to $49,999 | 242 | 10.5% |
| $50,000 to $74,999 | 458 | 19.9% |
| $75,000 to $99,999 | 336 | 14.6% |
| $100,000 to $149,999 | 278 | 12.1% |
| $150,000 to $199,999 | 159 | 6.9% |
| $200,000+ | 156 | 6.8% |
Family Income by Famaliy Size in Lincoln County
3-person families (551 | 24.0%) account for the highest median family income in Lincoln County with $70,521 per family, while 2-person families (1,151 | 50.0%) have the highest median income of $29,952 per family member.

| Income Bracket | # Families | Median Income |
| 2-Person Families | 1,151 (50.0%) | $59,904 |
| 3-Person Families | 551 (24.0%) | $70,521 |
| 4-Person Families | 414 (18.0%) | $67,407 |
| 5-Person Families | 152 (6.6%) | $61,250 |
| 6-Person Families | 0 (0.0%) | $0 |
| 7+ Person Families | 32 (1.4%) | $0 |
| Total | 2,300 (100.0%) | $64,237 |
Family Income by Number of Earners in Lincoln County
The median family income in Lincoln County is $64,237, with families comprising 3+ earners (148) having the highest median family income of $181,250, while families with no earners (530) have the lowest median family income of $22,289, accounting for 6.4% and 23.0% of families, respectively.

| Number of Earners | # Families | Median Income |
| No Earners | 530 (23.0%) | $22,289 |
| 1 Earner | 646 (28.1%) | $57,115 |
| 2 Earners | 976 (42.4%) | $84,800 |
| 3+ Earners | 148 (6.4%) | $181,250 |
| Total | 2,300 (100.0%) | $64,237 |
Household Income in Lincoln County
Household Income Brackets in Lincoln County
With 618 households falling in the category, the $50,000 to $74,999 income range is the most frequent in Lincoln County, accounting for 18.3% of all households. In contrast, only 169 households (5.0%) fall into the $150,000 to $199,999 income bracket, making it the least populous group.

| Income Bracket | # Households | % Households |
| Less than $10,000 | 182 | 5.4% |
| $10,000 to $14,999 | 247 | 7.3% |
| $15,000 to $24,999 | 551 | 16.3% |
| $25,000 to $34,999 | 338 | 10.0% |
| $35,000 to $49,999 | 355 | 10.5% |
| $50,000 to $74,999 | 618 | 18.3% |
| $75,000 to $99,999 | 388 | 11.5% |
| $100,000 to $149,999 | 355 | 10.5% |
| $150,000 to $199,999 | 169 | 5.0% |
| $200,000+ | 176 | 5.2% |
Household Income by Householder Age in Lincoln County
The median household income in Lincoln County is $50,526, with the highest median household income of $66,447 found in the 45 to 64 years age bracket for the primary householder. A total of 1,170 households (34.6%) fall into this category. Meanwhile, the 15 to 24 years age bracket for the primary householder has the lowest median household income of $18,730, with 119 households (3.5%) in this group.

| Income Bracket | # Households | Median Income |
| 15 to 24 Years | 119 (3.5%) | $18,730 |
| 25 to 44 Years | 908 (26.9%) | $65,033 |
| 45 to 64 Years | 1,170 (34.6%) | $66,447 |
| 65+ Years | 1,181 (35.0%) | $30,856 |
| Total | 3,378 (100.0%) | $50,526 |
Poverty in Lincoln County
Income Below Poverty by Sex and Age in Lincoln County
With 12.6% poverty level for males and 21.8% for females among the residents of Lincoln County, 5 year old males and under 5 year old females are the most vulnerable to poverty, with 3 males (60.0%) and 172 females (47.5%) in their respective age groups living below the poverty level.
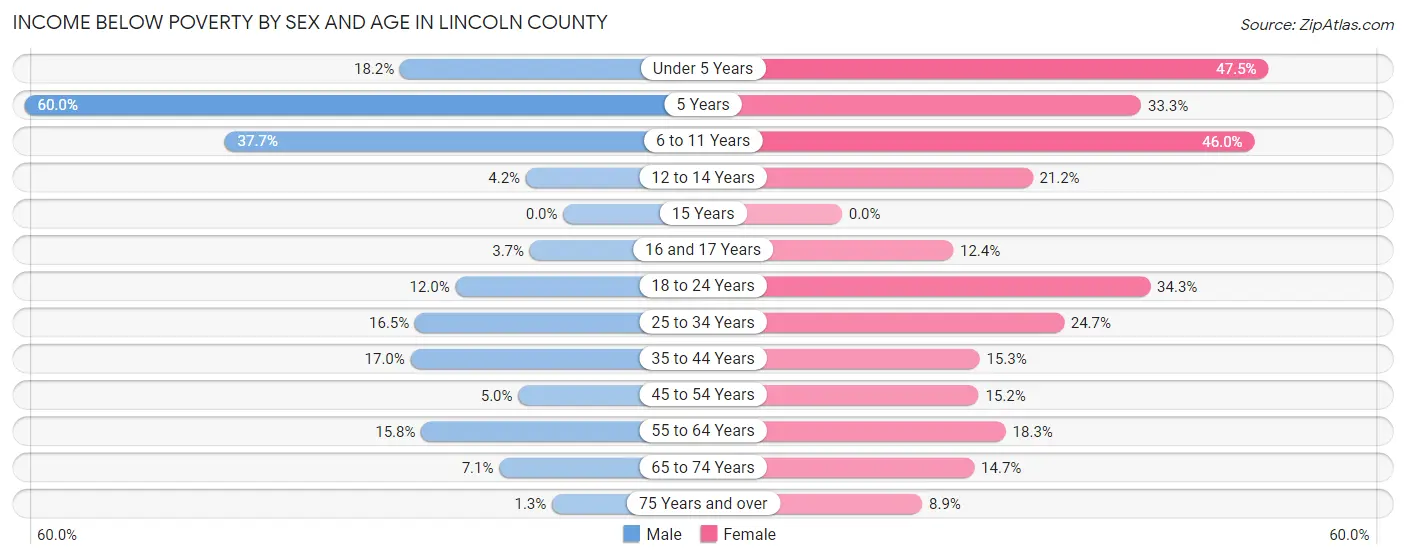
| Age Bracket | Male | Female |
| Under 5 Years | 34 (18.2%) | 172 (47.5%) |
| 5 Years | 3 (60.0%) | 50 (33.3%) |
| 6 to 11 Years | 109 (37.7%) | 85 (46.0%) |
| 12 to 14 Years | 10 (4.2%) | 38 (21.2%) |
| 15 Years | 0 (0.0%) | 0 (0.0%) |
| 16 and 17 Years | 6 (3.7%) | 14 (12.4%) |
| 18 to 24 Years | 49 (12.0%) | 102 (34.3%) |
| 25 to 34 Years | 70 (16.5%) | 132 (24.7%) |
| 35 to 44 Years | 58 (17.0%) | 85 (15.3%) |
| 45 to 54 Years | 26 (5.0%) | 85 (15.2%) |
| 55 to 64 Years | 72 (15.8%) | 121 (18.2%) |
| 65 to 74 Years | 34 (7.1%) | 84 (14.7%) |
| 75 Years and over | 3 (1.3%) | 39 (8.9%) |
| Total | 474 (12.6%) | 1,007 (21.8%) |
Income Above Poverty by Sex and Age in Lincoln County
According to the poverty statistics in Lincoln County, males aged 15 years and females aged 15 years are the age groups that are most secure financially, with 100.0% of males and 100.0% of females in these age groups living above the poverty line.
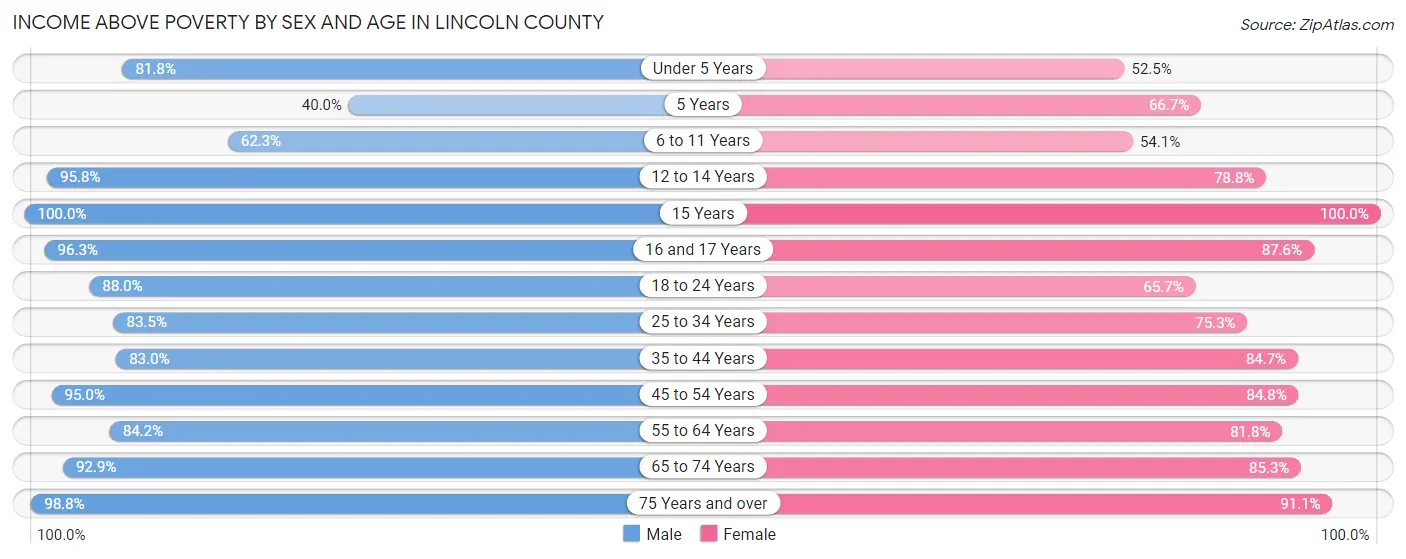
| Age Bracket | Male | Female |
| Under 5 Years | 153 (81.8%) | 190 (52.5%) |
| 5 Years | 2 (40.0%) | 100 (66.7%) |
| 6 to 11 Years | 180 (62.3%) | 100 (54.0%) |
| 12 to 14 Years | 230 (95.8%) | 141 (78.8%) |
| 15 Years | 12 (100.0%) | 18 (100.0%) |
| 16 and 17 Years | 155 (96.3%) | 99 (87.6%) |
| 18 to 24 Years | 359 (88.0%) | 195 (65.7%) |
| 25 to 34 Years | 354 (83.5%) | 402 (75.3%) |
| 35 to 44 Years | 283 (83.0%) | 469 (84.7%) |
| 45 to 54 Years | 493 (95.0%) | 473 (84.8%) |
| 55 to 64 Years | 383 (84.2%) | 542 (81.8%) |
| 65 to 74 Years | 443 (92.9%) | 486 (85.3%) |
| 75 Years and over | 237 (98.8%) | 397 (91.1%) |
| Total | 3,284 (87.4%) | 3,612 (78.2%) |
Income Below Poverty Among Married-Couple Families in Lincoln County
The poverty statistics for married-couple families in Lincoln County show that 8.5% or 149 of the total 1,750 families live below the poverty line. Families with 3 or 4 children have the highest poverty rate of 18.2%, comprising of 14 families. On the other hand, families with no children have the lowest poverty rate of 4.1%, which includes 42 families.

| Children | Above Poverty | Below Poverty |
| No Children | 979 (95.9%) | 42 (4.1%) |
| 1 or 2 Children | 559 (85.7%) | 93 (14.3%) |
| 3 or 4 Children | 63 (81.8%) | 14 (18.2%) |
| 5 or more Children | 0 (0.0%) | 0 (0.0%) |
| Total | 1,601 (91.5%) | 149 (8.5%) |
Income Below Poverty Among Single-Parent Households in Lincoln County
According to the poverty data in Lincoln County, 33.7% or 31 single-father households and 37.8% or 173 single-mother households are living below the poverty line. Among single-father households, those with 1 or 2 children have the highest poverty rate, with 28 households (80.0%) experiencing poverty. Likewise, among single-mother households, those with 3 or 4 children have the highest poverty rate, with 52 households (100.0%) falling below the poverty line.

| Children | Single Father | Single Mother |
| No Children | 3 (5.6%) | 32 (16.3%) |
| 1 or 2 Children | 28 (80.0%) | 61 (33.5%) |
| 3 or 4 Children | 0 (0.0%) | 52 (100.0%) |
| 5 or more Children | 0 (0.0%) | 28 (100.0%) |
| Total | 31 (33.7%) | 173 (37.8%) |
Income Below Poverty Among Married-Couple vs Single-Parent Households in Lincoln County
The poverty data for Lincoln County shows that 149 of the married-couple family households (8.5%) and 204 of the single-parent households (37.1%) are living below the poverty level. Within the married-couple family households, those with 3 or 4 children have the highest poverty rate, with 14 households (18.2%) falling below the poverty line. Among the single-parent households, those with 5 or more children have the highest poverty rate, with 28 household (100.0%) living below poverty.

| Children | Married-Couple Families | Single-Parent Households |
| No Children | 42 (4.1%) | 35 (14.0%) |
| 1 or 2 Children | 93 (14.3%) | 89 (41.0%) |
| 3 or 4 Children | 14 (18.2%) | 52 (94.6%) |
| 5 or more Children | 0 (0.0%) | 28 (100.0%) |
| Total | 149 (8.5%) | 204 (37.1%) |
Employment Characteristics in Lincoln County
Employment by Class of Employer in Lincoln County
Among the 3,550 employed individuals in Lincoln County, private company employees (2,311 | 65.1%), state government employees (368 | 10.4%), and local government employees (354 | 10.0%) make up the most common classes of employment.

| Employer Class | # Employees | % Employees |
| Private Company Employees | 2,311 | 65.1% |
| Self-Employed (Incorporated) | 59 | 1.7% |
| Self-Employed (Not Incorporated) | 269 | 7.6% |
| Not-for-profit Organizations | 110 | 3.1% |
| Local Government Employees | 354 | 10.0% |
| State Government Employees | 368 | 10.4% |
| Federal Government Employees | 54 | 1.5% |
| Unpaid Family Workers | 25 | 0.7% |
| Total | 3,550 | 100.0% |
Employment Status by Age in Lincoln County
According to the labor force statistics for Lincoln County, out of the total population over 16 years of age (11,377), 32.9% or 3,743 individuals are in the labor force, with 4.0% or 150 of them unemployed. The age group with the highest labor force participation rate is 20 to 24 years, with 50.2% or 439 individuals in the labor force. Within the labor force, the 35 to 44 years age range has the highest percentage of unemployed individuals, with 9.9% or 76 of them being unemployed.

| Age Bracket | In Labor Force | Unemployed |
| 16 to 19 Years | 177 (35.8%) | 0 (0.0%) |
| 20 to 24 Years | 439 (50.2%) | 27 (6.2%) |
| 25 to 29 Years | 375 (34.8%) | 0 (0.0%) |
| 30 to 34 Years | 344 (31.9%) | 29 (8.4%) |
| 35 to 44 Years | 768 (33.7%) | 76 (9.9%) |
| 45 to 54 Years | 762 (36.4%) | 0 (0.0%) |
| 55 to 59 Years | 288 (39.1%) | 7 (2.4%) |
| 60 to 64 Years | 282 (35.3%) | 10 (3.5%) |
| 65 to 74 Years | 256 (21.5%) | 0 (0.0%) |
| 75 Years and over | 49 (6.5%) | 0 (0.0%) |
| Total | 3,743 (32.9%) | 150 (4.0%) |
Employment Status by Educational Attainment in Lincoln County
According to labor force statistics for Lincoln County, 35.0% of individuals (2,821) out of the total population between 25 and 64 years of age (8,061) are in the labor force, with 4.3% or 121 of them being unemployed. The group with the highest labor force participation rate are those with the educational attainment of bachelor's degree or higher, with 72.9% or 422 individuals in the labor force. Within the labor force, individuals with college / associate degree education have the highest percentage of unemployment, with 5.9% or 63 of them being unemployed.

| Educational Attainment | In Labor Force | Unemployed |
| Less than High School | 210 (16.9%) | 0 (0.0%) |
| High School Diploma | 1,123 (26.2%) | 197 (4.6%) |
| College / Associate Degree | 1,067 (54.5%) | 115 (5.9%) |
| Bachelor's Degree or higher | 422 (72.9%) | 10 (1.7%) |
| Total | 2,821 (35.0%) | 347 (4.3%) |
Employment Occupations by Sex in Lincoln County
Management, Business, Science and Arts Occupations
The most common Management, Business, Science and Arts occupations in Lincoln County are Management (341 | 9.5%), Health Diagnosing & Treating (282 | 7.9%), Community & Social Service (191 | 5.3%), Education Instruction & Library (168 | 4.7%), and Health Technologists (155 | 4.3%).

Management, Business, Science and Arts Occupations by Sex
Within the Management, Business, Science and Arts occupations in Lincoln County, the most male-oriented occupations are Architecture & Engineering (100.0%), Legal Services & Support (100.0%), and Arts, Media & Entertainment (100.0%), while the most female-oriented occupations are Education, Arts & Media (100.0%), Education Instruction & Library (100.0%), and Community & Social Service (93.7%).

| Occupation | Male | Female |
| Management | 207 (60.7%) | 134 (39.3%) |
| Business & Financial | 11 (7.6%) | 134 (92.4%) |
| Computers, Engineering & Science | 80 (83.3%) | 16 (16.7%) |
| Computers & Mathematics | 49 (75.4%) | 16 (24.6%) |
| Architecture & Engineering | 31 (100.0%) | 0 (0.0%) |
| Life, Physical & Social Science | 0 (0.0%) | 0 (0.0%) |
| Community & Social Service | 12 (6.3%) | 179 (93.7%) |
| Education, Arts & Media | 0 (0.0%) | 11 (100.0%) |
| Legal Services & Support | 5 (100.0%) | 0 (0.0%) |
| Education Instruction & Library | 0 (0.0%) | 168 (100.0%) |
| Arts, Media & Entertainment | 7 (100.0%) | 0 (0.0%) |
| Health Diagnosing & Treating | 21 (7.4%) | 261 (92.5%) |
| Health Technologists | 21 (13.6%) | 134 (86.5%) |
| Total (Category) | 331 (31.4%) | 724 (68.6%) |
| Total (Overall) | 1,814 (50.5%) | 1,777 (49.5%) |
Services Occupations
The most common Services occupations in Lincoln County are Security & Protection (155 | 4.3%), Cleaning & Maintenance (130 | 3.6%), Law Enforcement (125 | 3.5%), Healthcare Support (106 | 2.9%), and Personal Care & Service (80 | 2.2%).

Services Occupations by Sex
Within the Services occupations in Lincoln County, the most male-oriented occupations are Law Enforcement (76.8%), Security & Protection (72.9%), and Cleaning & Maintenance (66.9%), while the most female-oriented occupations are Healthcare Support (100.0%), Food Preparation & Serving (88.7%), and Personal Care & Service (68.8%).

| Occupation | Male | Female |
| Healthcare Support | 0 (0.0%) | 106 (100.0%) |
| Security & Protection | 113 (72.9%) | 42 (27.1%) |
| Firefighting & Prevention | 17 (56.7%) | 13 (43.3%) |
| Law Enforcement | 96 (76.8%) | 29 (23.2%) |
| Food Preparation & Serving | 6 (11.3%) | 47 (88.7%) |
| Cleaning & Maintenance | 87 (66.9%) | 43 (33.1%) |
| Personal Care & Service | 25 (31.2%) | 55 (68.8%) |
| Total (Category) | 231 (44.1%) | 293 (55.9%) |
| Total (Overall) | 1,814 (50.5%) | 1,777 (49.5%) |
Sales and Office Occupations
The most common Sales and Office occupations in Lincoln County are Office & Administration (451 | 12.6%), and Sales & Related (304 | 8.5%).

Sales and Office Occupations by Sex

| Occupation | Male | Female |
| Sales & Related | 152 (50.0%) | 152 (50.0%) |
| Office & Administration | 24 (5.3%) | 427 (94.7%) |
| Total (Category) | 176 (23.3%) | 579 (76.7%) |
| Total (Overall) | 1,814 (50.5%) | 1,777 (49.5%) |
Natural Resources, Construction and Maintenance Occupations
The most common Natural Resources, Construction and Maintenance occupations in Lincoln County are Construction & Extraction (231 | 6.4%), Installation, Maintenance & Repair (212 | 5.9%), and Farming, Fishing & Forestry (107 | 3.0%).

Natural Resources, Construction and Maintenance Occupations by Sex
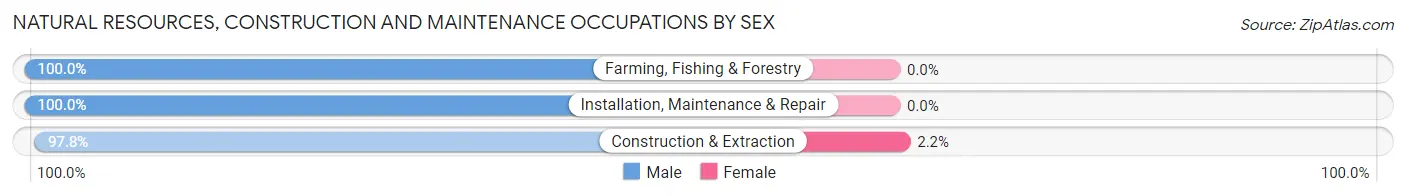
| Occupation | Male | Female |
| Farming, Fishing & Forestry | 107 (100.0%) | 0 (0.0%) |
| Construction & Extraction | 226 (97.8%) | 5 (2.2%) |
| Installation, Maintenance & Repair | 212 (100.0%) | 0 (0.0%) |
| Total (Category) | 545 (99.1%) | 5 (0.9%) |
| Total (Overall) | 1,814 (50.5%) | 1,777 (49.5%) |
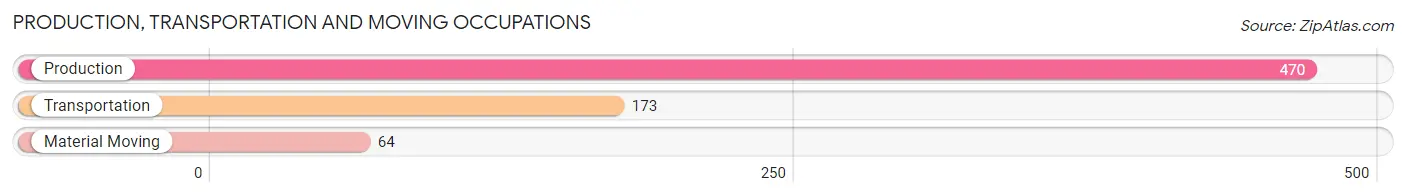
Production, Transportation and Moving Occupations
The most common Production, Transportation and Moving occupations in Lincoln County are Production (470 | 13.1%), Transportation (173 | 4.8%), and Material Moving (64 | 1.8%).
Production, Transportation and Moving Occupations by Sex

| Occupation | Male | Female |
| Production | 346 (73.6%) | 124 (26.4%) |
| Transportation | 145 (83.8%) | 28 (16.2%) |
| Material Moving | 40 (62.5%) | 24 (37.5%) |
| Total (Category) | 531 (75.1%) | 176 (24.9%) |
| Total (Overall) | 1,814 (50.5%) | 1,777 (49.5%) |
Employment Industries by Sex in Lincoln County
Employment Industries in Lincoln County
The major employment industries in Lincoln County include Manufacturing (594 | 16.5%), Health Care & Social Assistance (567 | 15.8%), Public Administration (377 | 10.5%), Retail Trade (330 | 9.2%), and Educational Services (318 | 8.9%).

Employment Industries by Sex in Lincoln County
The Lincoln County industries that see more men than women are Wholesale Trade (100.0%), Agriculture, Fishing & Hunting (97.3%), and Construction (93.4%), whereas the industries that tend to have a higher number of women are Health Care & Social Assistance (98.1%), Finance & Insurance (83.8%), and Information (83.1%).

| Industry | Male | Female |
| Agriculture, Fishing & Hunting | 212 (97.3%) | 6 (2.8%) |
| Mining, Quarrying, & Extraction | 0 (0.0%) | 0 (0.0%) |
| Construction | 239 (93.4%) | 17 (6.6%) |
| Manufacturing | 488 (82.2%) | 106 (17.8%) |
| Wholesale Trade | 43 (100.0%) | 0 (0.0%) |
| Retail Trade | 181 (54.8%) | 149 (45.2%) |
| Transportation & Warehousing | 115 (84.6%) | 21 (15.4%) |
| Utilities | 41 (78.8%) | 11 (21.1%) |
| Information | 14 (16.9%) | 69 (83.1%) |
| Finance & Insurance | 28 (16.2%) | 145 (83.8%) |
| Real Estate, Rental & Leasing | 18 (78.3%) | 5 (21.7%) |
| Professional & Scientific | 29 (33.7%) | 57 (66.3%) |
| Enterprise Management | 0 (0.0%) | 0 (0.0%) |
| Administrative & Support | 12 (29.3%) | 29 (70.7%) |
| Educational Services | 66 (20.7%) | 252 (79.2%) |
| Health Care & Social Assistance | 11 (1.9%) | 556 (98.1%) |
| Arts, Entertainment & Recreation | 33 (76.7%) | 10 (23.3%) |
| Accommodation & Food Services | 33 (36.3%) | 58 (63.7%) |
| Public Administration | 149 (39.5%) | 228 (60.5%) |
| Total | 1,814 (50.5%) | 1,777 (49.5%) |
Education in Lincoln County
School Enrollment in Lincoln County
The most common levels of schooling among the 1,891 students in Lincoln County are high school (616 | 32.6%), middle school (500 | 26.4%), and college / undergraduate (277 | 14.6%).

| School Level | # Students | % Students |
| Nursery / Preschool | 39 | 2.1% |
| Kindergarten | 162 | 8.6% |
| Elementary School | 260 | 13.8% |
| Middle School | 500 | 26.4% |
| High School | 616 | 32.6% |
| College / Undergraduate | 277 | 14.6% |
| Graduate / Professional | 37 | 2.0% |
| Total | 1,891 | 100.0% |
School Enrollment by Age by Funding Source in Lincoln County
Out of a total of 1,891 students who are enrolled in schools in Lincoln County, 463 (24.5%) attend a private institution, while the remaining 1,428 (75.5%) are enrolled in public schools. The age group of 3 to 4 year olds has the highest likelihood of being enrolled in private schools, with 34 (100.0% in the age bracket) enrolled. Conversely, the age group of 10 to 14 year olds has the lowest likelihood of being enrolled in a private school, with 643 (100.0% in the age bracket) attending a public institution.

| Age Bracket | Public School | Private School |
| 3 to 4 Year Olds | 0 (0.0%) | 34 (100.0%) |
| 5 to 9 Year Old | 304 (92.4%) | 25 (7.6%) |
| 10 to 14 Year Olds | 643 (100.0%) | 0 (0.0%) |
| 15 to 17 Year Olds | 264 (91.3%) | 25 (8.6%) |
| 18 to 19 Year Olds | 106 (100.0%) | 0 (0.0%) |
| 20 to 24 Year Olds | 54 (28.7%) | 134 (71.3%) |
| 25 to 34 Year Olds | 28 (21.9%) | 100 (78.1%) |
| 35 Years and over | 28 (16.1%) | 146 (83.9%) |
| Total | 1,428 (75.5%) | 463 (24.5%) |
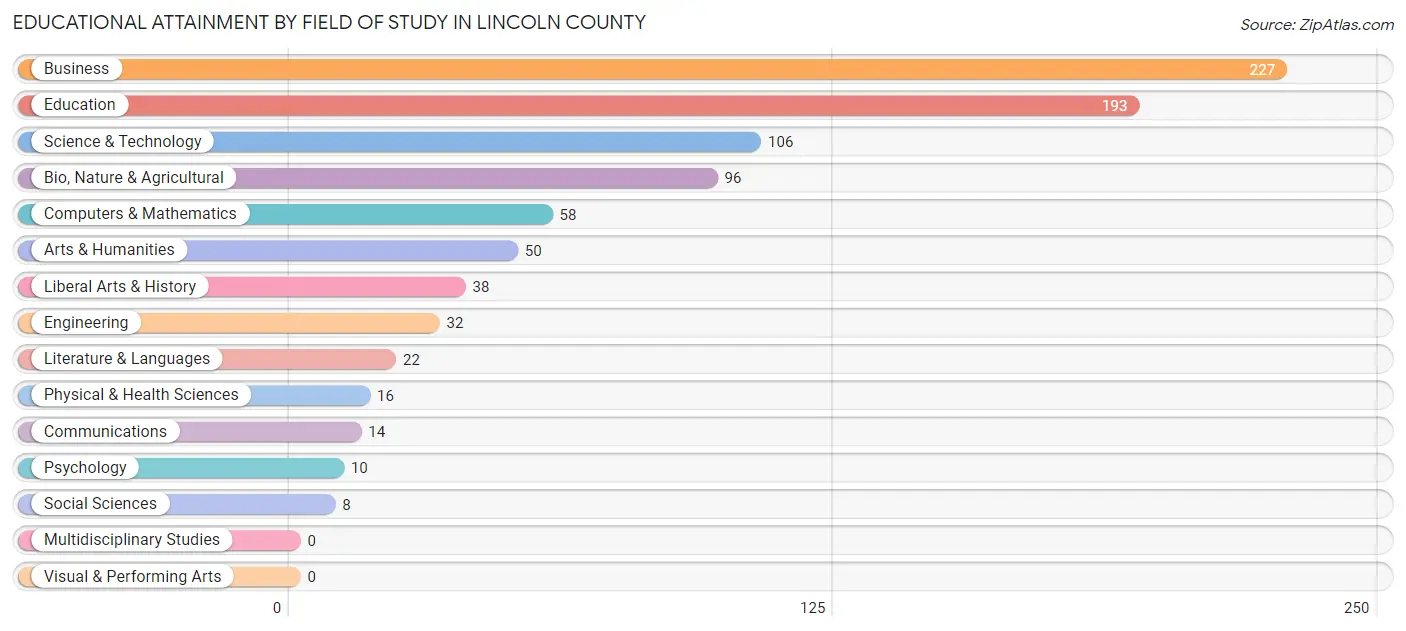
Educational Attainment by Field of Study in Lincoln County
Business (227 | 26.1%), education (193 | 22.2%), science & technology (106 | 12.2%), bio, nature & agricultural (96 | 11.0%), and computers & mathematics (58 | 6.7%) are the most common fields of study among 870 individuals in Lincoln County who have obtained a bachelor's degree or higher.
| Field of Study | # Graduates | % Graduates |
| Computers & Mathematics | 58 | 6.7% |
| Bio, Nature & Agricultural | 96 | 11.0% |
| Physical & Health Sciences | 16 | 1.8% |
| Psychology | 10 | 1.1% |
| Social Sciences | 8 | 0.9% |
| Engineering | 32 | 3.7% |
| Multidisciplinary Studies | 0 | 0.0% |
| Science & Technology | 106 | 12.2% |
| Business | 227 | 26.1% |
| Education | 193 | 22.2% |
| Literature & Languages | 22 | 2.5% |
| Liberal Arts & History | 38 | 4.4% |
| Visual & Performing Arts | 0 | 0.0% |
| Communications | 14 | 1.6% |
| Arts & Humanities | 50 | 5.8% |
| Total | 870 | 100.0% |
Transportation & Commute in Lincoln County
Vehicle Availability by Sex in Lincoln County
The most prevalent vehicle ownership categories in Lincoln County are males with 2 vehicles (533, accounting for 29.6%) and females with 2 vehicles (642, making up 30.5%).

| Vehicles Available | Male | Female |
| No Vehicle | 16 (0.9%) | 26 (1.5%) |
| 1 Vehicle | 385 (21.4%) | 478 (27.4%) |
| 2 Vehicles | 533 (29.6%) | 642 (36.7%) |
| 3 Vehicles | 372 (20.6%) | 392 (22.4%) |
| 4 Vehicles | 256 (14.2%) | 127 (7.3%) |
| 5 or more Vehicles | 240 (13.3%) | 83 (4.8%) |
| Total | 1,802 (100.0%) | 1,748 (100.0%) |
Commute Time in Lincoln County
The most frequently occuring commute durations in Lincoln County are 30 to 34 minutes (713 commuters, 20.9%), 15 to 19 minutes (483 commuters, 14.1%), and 20 to 24 minutes (468 commuters, 13.7%).

| Commute Time | # Commuters | % Commuters |
| Less than 5 Minutes | 149 | 4.4% |
| 5 to 9 Minutes | 463 | 13.6% |
| 10 to 14 Minutes | 299 | 8.7% |
| 15 to 19 Minutes | 483 | 14.1% |
| 20 to 24 Minutes | 468 | 13.7% |
| 25 to 29 Minutes | 180 | 5.3% |
| 30 to 34 Minutes | 713 | 20.9% |
| 35 to 39 Minutes | 161 | 4.7% |
| 40 to 44 Minutes | 150 | 4.4% |
| 45 to 59 Minutes | 202 | 5.9% |
| 60 to 89 Minutes | 113 | 3.3% |
| 90 or more Minutes | 36 | 1.1% |
Commute Time by Sex in Lincoln County
The most common commute times in Lincoln County are 30 to 34 minutes (487 commuters, 28.3%) for males and 15 to 19 minutes (297 commuters, 17.5%) for females.

| Commute Time | Male | Female |
| Less than 5 Minutes | 75 (4.4%) | 74 (4.4%) |
| 5 to 9 Minutes | 176 (10.2%) | 287 (16.9%) |
| 10 to 14 Minutes | 100 (5.8%) | 199 (11.7%) |
| 15 to 19 Minutes | 186 (10.8%) | 297 (17.5%) |
| 20 to 24 Minutes | 327 (19.0%) | 141 (8.3%) |
| 25 to 29 Minutes | 42 (2.4%) | 138 (8.1%) |
| 30 to 34 Minutes | 487 (28.3%) | 226 (13.3%) |
| 35 to 39 Minutes | 55 (3.2%) | 106 (6.2%) |
| 40 to 44 Minutes | 94 (5.5%) | 56 (3.3%) |
| 45 to 59 Minutes | 115 (6.7%) | 87 (5.1%) |
| 60 to 89 Minutes | 53 (3.1%) | 60 (3.5%) |
| 90 or more Minutes | 8 (0.5%) | 28 (1.7%) |
Time of Departure to Work by Sex in Lincoln County
The most frequent times of departure to work in Lincoln County are 7:00 AM to 7:29 AM (325, 18.9%) for males and 7:30 AM to 7:59 AM (461, 27.1%) for females.

| Time of Departure | Male | Female |
| 12:00 AM to 4:59 AM | 132 (7.7%) | 9 (0.5%) |
| 5:00 AM to 5:29 AM | 150 (8.7%) | 13 (0.8%) |
| 5:30 AM to 5:59 AM | 88 (5.1%) | 105 (6.2%) |
| 6:00 AM to 6:29 AM | 305 (17.7%) | 188 (11.1%) |
| 6:30 AM to 6:59 AM | 240 (14.0%) | 195 (11.5%) |
| 7:00 AM to 7:29 AM | 325 (18.9%) | 351 (20.7%) |
| 7:30 AM to 7:59 AM | 180 (10.5%) | 461 (27.1%) |
| 8:00 AM to 8:29 AM | 36 (2.1%) | 63 (3.7%) |
| 8:30 AM to 8:59 AM | 16 (0.9%) | 67 (3.9%) |
| 9:00 AM to 9:59 AM | 41 (2.4%) | 43 (2.5%) |
| 10:00 AM to 10:59 AM | 0 (0.0%) | 74 (4.4%) |
| 11:00 AM to 11:59 AM | 25 (1.5%) | 21 (1.2%) |
| 12:00 PM to 3:59 PM | 33 (1.9%) | 59 (3.5%) |
| 4:00 PM to 11:59 PM | 147 (8.6%) | 50 (2.9%) |
| Total | 1,718 (100.0%) | 1,699 (100.0%) |
Housing Occupancy in Lincoln County
Occupancy by Ownership in Lincoln County
Of the total 3,378 dwellings in Lincoln County, owner-occupied units account for 2,655 (78.6%), while renter-occupied units make up 723 (21.4%).

| Occupancy | # Housing Units | % Housing Units |
| Owner Occupied Housing Units | 2,655 | 78.6% |
| Renter-Occupied Housing Units | 723 | 21.4% |
| Total Occupied Housing Units | 3,378 | 100.0% |
Occupancy by Household Size in Lincoln County

| Household Size | # Housing Units | % Housing Units |
| 1-Person Household | 943 | 27.9% |
| 2-Person Household | 1,248 | 36.9% |
| 3-Person Household | 584 | 17.3% |
| 4+ Person Household | 603 | 17.8% |
| Total Housing Units | 3,378 | 100.0% |
Occupancy by Ownership by Household Size in Lincoln County

| Household Size | Owner-occupied | Renter-occupied |
| 1-Person Household | 674 (71.5%) | 269 (28.5%) |
| 2-Person Household | 1,053 (84.4%) | 195 (15.6%) |
| 3-Person Household | 549 (94.0%) | 35 (6.0%) |
| 4+ Person Household | 379 (62.8%) | 224 (37.1%) |
| Total Housing Units | 2,655 (78.6%) | 723 (21.4%) |
Occupancy by Educational Attainment in Lincoln County
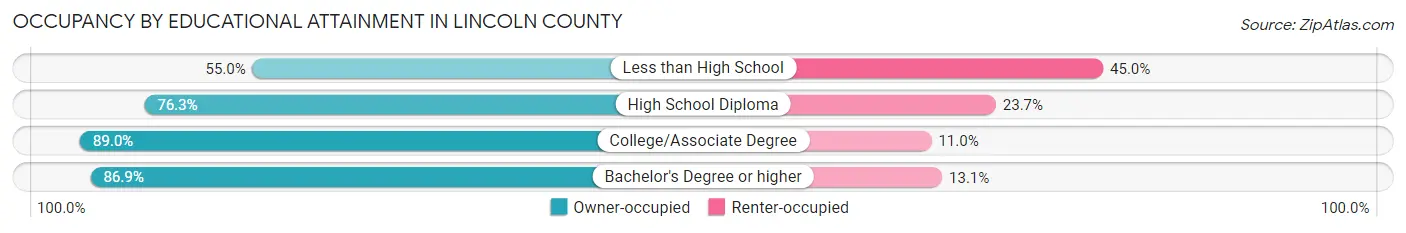
| Household Size | Owner-occupied | Renter-occupied |
| Less than High School | 269 (55.0%) | 220 (45.0%) |
| High School Diploma | 1,054 (76.3%) | 328 (23.7%) |
| College/Associate Degree | 933 (89.0%) | 115 (11.0%) |
| Bachelor's Degree or higher | 399 (86.9%) | 60 (13.1%) |
Occupancy by Age of Householder in Lincoln County
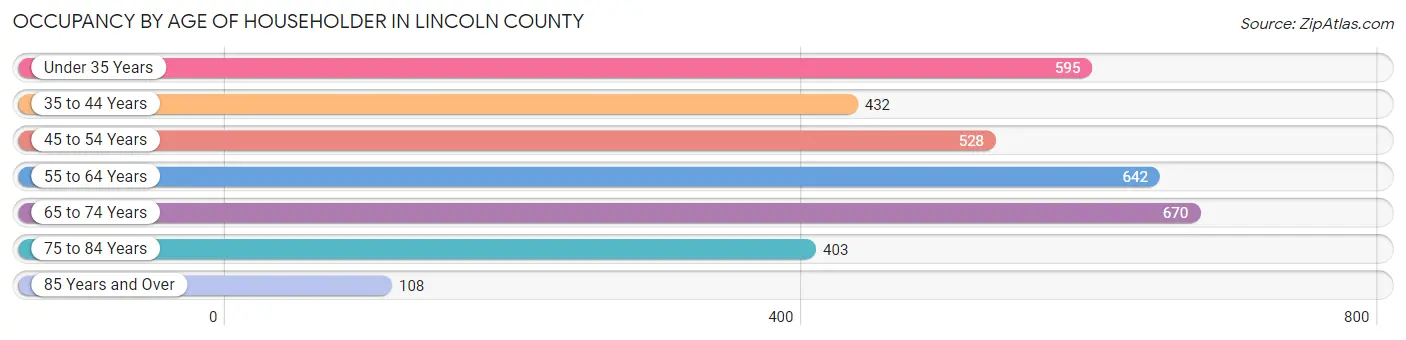
| Age Bracket | # Households | % Households |
| Under 35 Years | 595 | 17.6% |
| 35 to 44 Years | 432 | 12.8% |
| 45 to 54 Years | 528 | 15.6% |
| 55 to 64 Years | 642 | 19.0% |
| 65 to 74 Years | 670 | 19.8% |
| 75 to 84 Years | 403 | 11.9% |
| 85 Years and Over | 108 | 3.2% |
| Total | 3,378 | 100.0% |
Housing Finances in Lincoln County
Median Income by Occupancy in Lincoln County

| Occupancy Type | # Households | Median Income |
| Owner-Occupied | 2,655 (78.6%) | $56,332 |
| Renter-Occupied | 723 (21.4%) | $24,766 |
| Average | 3,378 (100.0%) | $50,526 |
Occupancy by Householder Income Bracket in Lincoln County

| Income Bracket | Owner-occupied | Renter-occupied |
| Less than $5,000 | 80 (3.0%) | 85 (11.8%) |
| $5,000 to $9,999 | 4 (0.2%) | 13 (1.8%) |
| $10,000 to $14,999 | 155 (5.8%) | 92 (12.7%) |
| $15,000 to $19,999 | 180 (6.8%) | 106 (14.7%) |
| $20,000 to $24,999 | 194 (7.3%) | 70 (9.7%) |
| $25,000 to $34,999 | 256 (9.6%) | 82 (11.3%) |
| $35,000 to $49,999 | 319 (12.0%) | 37 (5.1%) |
| $50,000 to $74,999 | 513 (19.3%) | 106 (14.7%) |
| $75,000 to $99,999 | 307 (11.6%) | 81 (11.2%) |
| $100,000 to $149,999 | 341 (12.8%) | 14 (1.9%) |
| $150,000 or more | 306 (11.5%) | 37 (5.1%) |
| Total | 2,655 (100.0%) | 723 (100.0%) |
Monthly Housing Cost Tiers in Lincoln County

| Monthly Cost | Owner-occupied | Renter-occupied |
| Less than $300 | 346 (13.0%) | 39 (5.4%) |
| $300 to $499 | 749 (28.2%) | 75 (10.4%) |
| $500 to $799 | 785 (29.6%) | 253 (35.0%) |
| $800 to $999 | 196 (7.4%) | 90 (12.4%) |
| $1,000 to $1,499 | 348 (13.1%) | 49 (6.8%) |
| $1,500 to $1,999 | 160 (6.0%) | 18 (2.5%) |
| $2,000 to $2,499 | 27 (1.0%) | 0 (0.0%) |
| $2,500 to $2,999 | 23 (0.9%) | 0 (0.0%) |
| $3,000 or more | 21 (0.8%) | 0 (0.0%) |
| Total | 2,655 (100.0%) | 723 (100.0%) |
Physical Housing Characteristics in Lincoln County
Housing Structures in Lincoln County

| Structure Type | # Housing Units | % Housing Units |
| Single Unit, Detached | 2,269 | 67.2% |
| Single Unit, Attached | 3 | 0.1% |
| 2 Unit Apartments | 26 | 0.8% |
| 3 or 4 Unit Apartments | 24 | 0.7% |
| 5 to 9 Unit Apartments | 7 | 0.2% |
| 10 or more Apartments | 41 | 1.2% |
| Mobile Home / Other | 1,008 | 29.8% |
| Total | 3,378 | 100.0% |
Housing Structures by Occupancy in Lincoln County

| Structure Type | Owner-occupied | Renter-occupied |
| Single Unit, Detached | 1,867 (82.3%) | 402 (17.7%) |
| Single Unit, Attached | 3 (100.0%) | 0 (0.0%) |
| 2 Unit Apartments | 7 (26.9%) | 19 (73.1%) |
| 3 or 4 Unit Apartments | 0 (0.0%) | 24 (100.0%) |
| 5 to 9 Unit Apartments | 0 (0.0%) | 7 (100.0%) |
| 10 or more Apartments | 0 (0.0%) | 41 (100.0%) |
| Mobile Home / Other | 778 (77.2%) | 230 (22.8%) |
| Total | 2,655 (78.6%) | 723 (21.4%) |
Housing Structures by Number of Rooms in Lincoln County

| Number of Rooms | Owner-occupied | Renter-occupied |
| 1 Room | 22 (0.8%) | 34 (4.7%) |
| 2 or 3 Rooms | 65 (2.5%) | 17 (2.4%) |
| 4 or 5 Rooms | 887 (33.4%) | 566 (78.3%) |
| 6 or 7 Rooms | 1,006 (37.9%) | 83 (11.5%) |
| 8 or more Rooms | 675 (25.4%) | 23 (3.2%) |
| Total | 2,655 (100.0%) | 723 (100.0%) |
Housing Structure by Heating Type in Lincoln County

| Heating Type | Owner-occupied | Renter-occupied |
| Utility Gas | 600 (22.6%) | 190 (26.3%) |
| Bottled, Tank, or LP Gas | 351 (13.2%) | 40 (5.5%) |
| Electricity | 1,654 (62.3%) | 487 (67.4%) |
| Fuel Oil or Kerosene | 0 (0.0%) | 0 (0.0%) |
| Coal or Coke | 0 (0.0%) | 0 (0.0%) |
| All other Fuels | 50 (1.9%) | 6 (0.8%) |
| No Fuel Used | 0 (0.0%) | 0 (0.0%) |
| Total | 2,655 (100.0%) | 723 (100.0%) |
Household Vehicle Usage in Lincoln County

| Vehicles per Household | Owner-occupied | Renter-occupied |
| No Vehicle | 82 (3.1%) | 81 (11.2%) |
| 1 Vehicle | 724 (27.3%) | 454 (62.8%) |
| 2 Vehicles | 1,091 (41.1%) | 134 (18.5%) |
| 3 or more Vehicles | 758 (28.5%) | 54 (7.5%) |
| Total | 2,655 (100.0%) | 723 (100.0%) |
Real Estate & Mortgages in Lincoln County
Real Estate and Mortgage Overview in Lincoln County
| Characteristic | Without Mortgage | With Mortgage |
| Housing Units | 1,623 | 1,032 |
| Median Property Value | $109,300 | $115,100 |
| Median Household Income | $48,885 | $158 |
| Monthly Housing Costs | $429 | $21 |
| Real Estate Taxes | $603 | $102 |
Property Value by Mortgage Status in Lincoln County

| Property Value | Without Mortgage | With Mortgage |
| Less than $50,000 | 430 (26.5%) | 99 (9.6%) |
| $50,000 to $99,999 | 323 (19.9%) | 296 (28.7%) |
| $100,000 to $299,999 | 704 (43.4%) | 456 (44.2%) |
| $300,000 to $499,999 | 123 (7.6%) | 181 (17.5%) |
| $500,000 to $749,999 | 43 (2.6%) | 0 (0.0%) |
| $750,000 to $999,999 | 0 (0.0%) | 0 (0.0%) |
| $1,000,000 or more | 0 (0.0%) | 0 (0.0%) |
| Total | 1,623 (100.0%) | 1,032 (100.0%) |
Household Income by Mortgage Status in Lincoln County
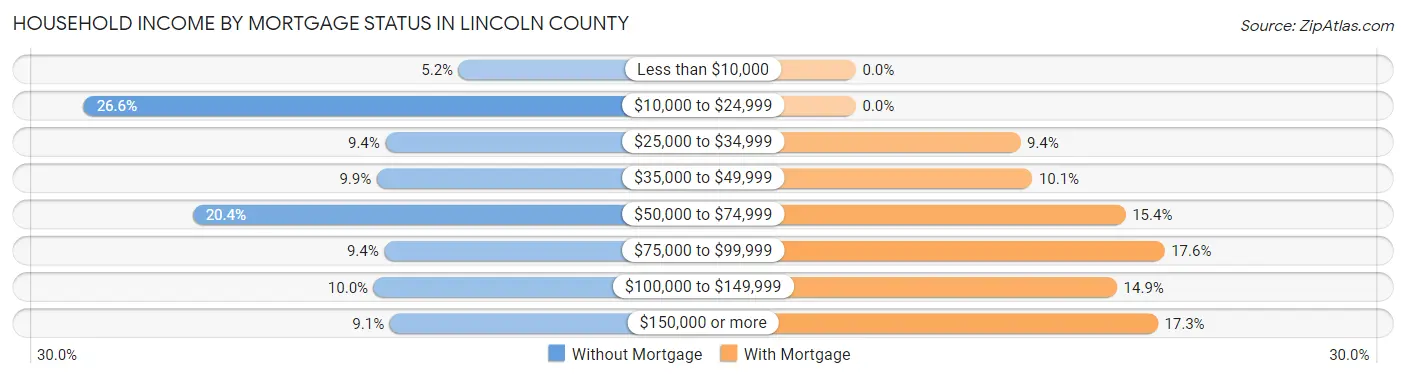
| Household Income | Without Mortgage | With Mortgage |
| Less than $10,000 | 84 (5.2%) | 0 (0.0%) |
| $10,000 to $24,999 | 432 (26.6%) | 0 (0.0%) |
| $25,000 to $34,999 | 152 (9.4%) | 97 (9.4%) |
| $35,000 to $49,999 | 160 (9.9%) | 104 (10.1%) |
| $50,000 to $74,999 | 331 (20.4%) | 159 (15.4%) |
| $75,000 to $99,999 | 153 (9.4%) | 182 (17.6%) |
| $100,000 to $149,999 | 163 (10.0%) | 154 (14.9%) |
| $150,000 or more | 148 (9.1%) | 178 (17.2%) |
| Total | 1,623 (100.0%) | 1,032 (100.0%) |
Property Value to Household Income Ratio in Lincoln County

| Value-to-Income Ratio | Without Mortgage | With Mortgage |
| Less than 2.0x | 758 (46.7%) | 67,267 (6,518.1%) |
| 2.0x to 2.9x | 307 (18.9%) | 520 (50.4%) |
| 3.0x to 3.9x | 153 (9.4%) | 229 (22.2%) |
| 4.0x or more | 396 (24.4%) | 122 (11.8%) |
| Total | 1,623 (100.0%) | 1,032 (100.0%) |
Real Estate Taxes by Mortgage Status in Lincoln County

| Property Taxes | Without Mortgage | With Mortgage |
| Less than $800 | 792 (48.8%) | 0 (0.0%) |
| $800 to $1,499 | 323 (19.9%) | 546 (52.9%) |
| $800 to $1,499 | 270 (16.6%) | 164 (15.9%) |
| Total | 1,623 (100.0%) | 1,032 (100.0%) |
Health & Disability in Lincoln County
Health Insurance Coverage by Age in Lincoln County

| Age Bracket | With Coverage | Without Coverage |
| Under 6 Years | 571 (81.1%) | 133 (18.9%) |
| 6 to 18 Years | 1,353 (96.0%) | 56 (4.0%) |
| 19 to 25 Years | 470 (82.3%) | 101 (17.7%) |
| 26 to 34 Years | 776 (87.0%) | 116 (13.0%) |
| 35 to 44 Years | 873 (97.5%) | 22 (2.5%) |
| 45 to 54 Years | 937 (87.0%) | 140 (13.0%) |
| 55 to 64 Years | 996 (89.1%) | 122 (10.9%) |
| 65 to 74 Years | 1,047 (100.0%) | 0 (0.0%) |
| 75 Years and older | 676 (100.0%) | 0 (0.0%) |
| Total | 7,699 (91.8%) | 690 (8.2%) |
Health Insurance Coverage by Citizenship Status in Lincoln County

| Citizenship Status | With Coverage | Without Coverage |
| Native Born | 571 (81.1%) | 133 (18.9%) |
| Foreign Born, Citizen | 1,353 (96.0%) | 56 (4.0%) |
| Foreign Born, not a Citizen | 470 (82.3%) | 101 (17.7%) |
Health Insurance Coverage by Household Income in Lincoln County
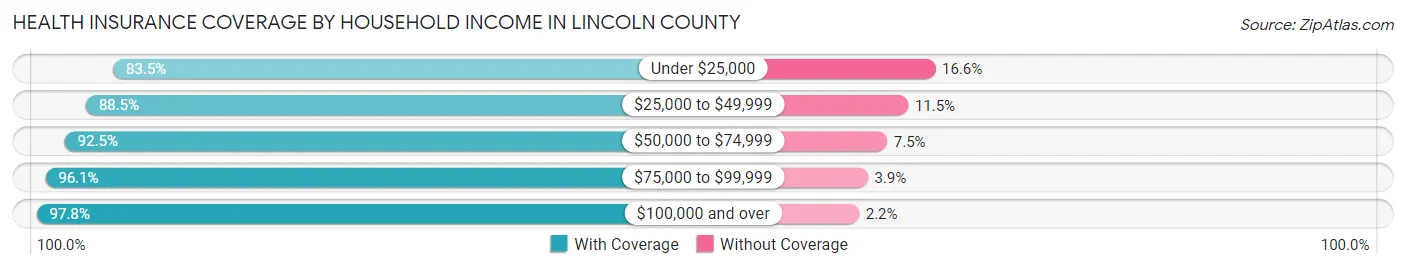
| Household Income | With Coverage | Without Coverage |
| Under $25,000 | 1,492 (83.5%) | 296 (16.6%) |
| $25,000 to $49,999 | 1,321 (88.5%) | 171 (11.5%) |
| $50,000 to $74,999 | 1,563 (92.5%) | 127 (7.5%) |
| $75,000 to $99,999 | 1,141 (96.1%) | 46 (3.9%) |
| $100,000 and over | 2,182 (97.8%) | 50 (2.2%) |
Public vs Private Health Insurance Coverage by Age in Lincoln County

| Age Bracket | Public Insurance | Private Insurance |
| Under 6 | 237 (33.7%) | 341 (48.4%) |
| 6 to 18 Years | 483 (34.3%) | 938 (66.6%) |
| 19 to 25 Years | 47 (8.2%) | 436 (76.4%) |
| 25 to 34 Years | 201 (22.5%) | 580 (65.0%) |
| 35 to 44 Years | 235 (26.3%) | 680 (76.0%) |
| 45 to 54 Years | 145 (13.5%) | 833 (77.3%) |
| 55 to 64 Years | 292 (26.1%) | 773 (69.1%) |
| 65 to 74 Years | 1,018 (97.2%) | 436 (41.6%) |
| 75 Years and over | 676 (100.0%) | 270 (39.9%) |
| Total | 3,334 (39.7%) | 5,287 (63.0%) |
Disability Status by Sex by Age in Lincoln County

| Age Bracket | Male | Female |
| Under 5 Years | 0 (0.0%) | 0 (0.0%) |
| 5 to 17 Years | 36 (5.0%) | 32 (5.0%) |
| 18 to 34 Years | 36 (4.3%) | 74 (8.9%) |
| 35 to 64 Years | 284 (21.6%) | 240 (13.5%) |
| 65 to 74 Years | 245 (51.4%) | 235 (41.2%) |
| 75 Years and over | 164 (68.3%) | 148 (33.9%) |
Disability Class by Sex by Age in Lincoln County
Disability Class: Hearing Difficulty

| Age Bracket | Male | Female |
| Under 5 Years | 0 (0.0%) | 0 (0.0%) |
| 5 to 17 Years | 8 (1.1%) | 8 (1.2%) |
| 18 to 34 Years | 0 (0.0%) | 5 (0.6%) |
| 35 to 64 Years | 94 (7.1%) | 36 (2.0%) |
| 65 to 74 Years | 135 (28.3%) | 34 (6.0%) |
| 75 Years and over | 73 (30.4%) | 21 (4.8%) |
Disability Class: Vision Difficulty

| Age Bracket | Male | Female |
| Under 5 Years | 0 (0.0%) | 0 (0.0%) |
| 5 to 17 Years | 8 (1.1%) | 8 (1.2%) |
| 18 to 34 Years | 8 (1.0%) | 9 (1.1%) |
| 35 to 64 Years | 37 (2.8%) | 27 (1.5%) |
| 65 to 74 Years | 60 (12.6%) | 26 (4.6%) |
| 75 Years and over | 14 (5.8%) | 39 (8.9%) |
Disability Class: Cognitive Difficulty

| Age Bracket | Male | Female |
| 5 to 17 Years | 36 (5.0%) | 32 (5.0%) |
| 18 to 34 Years | 36 (4.3%) | 73 (8.8%) |
| 35 to 64 Years | 171 (13.0%) | 99 (5.6%) |
| 65 to 74 Years | 72 (15.1%) | 40 (7.0%) |
| 75 Years and over | 53 (22.1%) | 29 (6.7%) |
Disability Class: Ambulatory Difficulty
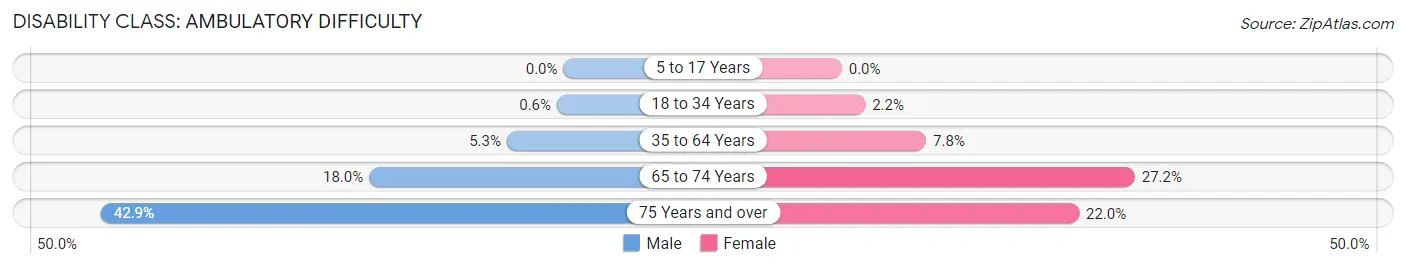
| Age Bracket | Male | Female |
| 5 to 17 Years | 0 (0.0%) | 0 (0.0%) |
| 18 to 34 Years | 5 (0.6%) | 18 (2.2%) |
| 35 to 64 Years | 69 (5.2%) | 139 (7.8%) |
| 65 to 74 Years | 86 (18.0%) | 155 (27.2%) |
| 75 Years and over | 103 (42.9%) | 96 (22.0%) |
Disability Class: Self-Care Difficulty

| Age Bracket | Male | Female |
| 5 to 17 Years | 8 (1.1%) | 8 (1.2%) |
| 18 to 34 Years | 5 (0.6%) | 5 (0.6%) |
| 35 to 64 Years | 19 (1.4%) | 25 (1.4%) |
| 65 to 74 Years | 28 (5.9%) | 59 (10.3%) |
| 75 Years and over | 51 (21.2%) | 29 (6.7%) |
Technology Access in Lincoln County
Computing Device Access in Lincoln County

| Device Type | # Households | % Households |
| Desktop or Laptop | 1,768 | 52.3% |
| Smartphone | 2,538 | 75.1% |
| Tablet | 1,694 | 50.1% |
| No Computing Device | 643 | 19.0% |
| Total | 3,378 | 100.0% |
Internet Access in Lincoln County

| Internet Type | # Households | % Households |
| Dial-Up Internet | 20 | 0.6% |
| Broadband Home | 983 | 29.1% |
| Cellular Data Only | 614 | 18.2% |
| Satellite Internet | 334 | 9.9% |
| No Internet | 1,411 | 41.8% |
| Total | 3,378 | 100.0% |
Lincoln County Summary
Lincoln County is located in the southeastern corner of Arkansas, and is bordered by Desha County to the north, Arkansas County to the east, Jefferson County to the south, and Drew County to the west. The county seat is Star City, and the county has a total area of 590 square miles. As of the 2010 census, the population was 14,134, making it the second least populous county in the state.
History
Lincoln County was formed in 1871 from parts of Arkansas and Desha counties. It was named for Abraham Lincoln, the 16th President of the United States. The county was originally home to the Quapaw, Tunica, and Caddo tribes, who were later displaced by European settlers.
The first settlers in the area were mostly farmers, who were attracted to the fertile soil and abundant wildlife. The county was largely agricultural until the early 20th century, when the timber industry began to take off. The timber industry was a major source of employment for many years, and the county was home to several sawmills and lumber companies.
In the late 20th century, the county began to diversify its economy, with the development of manufacturing and tourism. The county is now home to several manufacturing plants, as well as a number of tourist attractions, including the Arkansas Post National Memorial, the Arkansas Post Museum, and the Arkansas Post State Park.
Geography
Lincoln County is located in the southeastern corner of Arkansas, and is bordered by Desha County to the north, Arkansas County to the east, Jefferson County to the south, and Drew County to the west. The county has a total area of 590 square miles, and is mostly flat, with some rolling hills in the northern part of the county. The county is drained by the Arkansas River, which forms the western boundary of the county.
The county is home to several state parks, including Arkansas Post State Park, which is located on the Arkansas River, and White Oak Lake State Park, which is located in the northern part of the county. The county is also home to several wildlife management areas, including the White Oak Lake Wildlife Management Area, which is located in the northern part of the county.
Economy
Lincoln County has a diversified economy, with a mix of agriculture, manufacturing, and tourism. The county is home to several manufacturing plants, including a Tyson Foods poultry processing plant, a Georgia-Pacific lumber mill, and a Georgia-Pacific paper mill. The county is also home to several tourist attractions, including the Arkansas Post National Memorial, the Arkansas Post Museum, and the Arkansas Post State Park.
Agriculture is still an important part of the county’s economy, with the main crops being soybeans, cotton, corn, and rice. The county is also home to several livestock operations, including cattle, hogs, and poultry.
Demographics
As of the 2010 census, the population of Lincoln County was 14,134, making it the second least populous county in the state. The population is spread out, with the largest city being Star City, which has a population of 2,845. The county is predominantly white, with African Americans making up the largest minority group, at 16.3% of the population. The median household income in the county is $35,945, and the median home value is $90,400.
Conclusion
Lincoln County is located in the southeastern corner of Arkansas, and is bordered by Desha County to the north, Arkansas County to the east, Jefferson County to the south, and Drew County to the west. The county has a total area of 590 square miles, and is mostly flat, with some rolling hills in the northern part of the county. The county has a diversified economy, with a mix of agriculture, manufacturing, and tourism. As of the 2010 census, the population of Lincoln County was 14,134, making it the second least populous county in the state. The county is predominantly white, with African Americans making up the largest minority group, at 16.3% of the population. The median household income in the county is $35,945, and the median home value is $90,400.
Common Questions
What is the Total Population of Lincoln County?
Total Population of Lincoln County is 13,016.
What is the Total Male Population of Lincoln County?
Total Male Population of Lincoln County is 8,335.
What is the Total Female Population of Lincoln County?
Total Female Population of Lincoln County is 4,681.
What is the Ratio of Males per 100 Females in Lincoln County?
There are 178.06 Males per 100 Females in Lincoln County.
What is the Ratio of Females per 100 Males in Lincoln County?
There are 56.16 Females per 100 Males in Lincoln County.
What is the Median Population Age in Lincoln County?
Median Population Age in Lincoln County is 40.6 Years.
What is the Average Family Size in Lincoln County
Average Family Size in Lincoln County is 3.1 People.
What is the Average Household Size in Lincoln County
Average Household Size in Lincoln County is 2.5 People.
What is Per Capita Income in Lincoln County?
Per Capita income in Lincoln County is $18,191.
What is the Median Family Income in Lincoln County?
Median Family Income in Lincoln County is $64,237.
What is the Median Household income in Lincoln County?
Median Household Income in Lincoln County is $50,526.
What is Income or Wage Gap in Lincoln County?
Income or Wage Gap in Lincoln County is 10.7%.
Women in Lincoln County earn 89.3 cents for every dollar earned by a man.
What is Inequality or Gini Index in Lincoln County?
Inequality or Gini Index in Lincoln County is 0.47.
How Large is the Labor Force in Lincoln County?
There are 3,743 People in the Labor Forcein in Lincoln County.
What is the Percentage of People in the Labor Force in Lincoln County?
32.9% of People are in the Labor Force in Lincoln County.
What is the Unemployment Rate in Lincoln County?
Unemployment Rate in Lincoln County is 4.0%.