Independence County, AR
Independence County Map
Independence County Overview
37,910
TOTAL POPULATION
18,947
MALE POPULATION
18,963
FEMALE POPULATION
99.92
MALES / 100 FEMALES
100.08
FEMALES / 100 MALES
39.1
MEDIAN AGE
3.1
AVG FAMILY SIZE
2.6
AVG HOUSEHOLD SIZE
$27,867
PER CAPITA INCOME
$62,620
AVG FAMILY INCOME
$52,361
AVG HOUSEHOLD INCOME
19.0%
WAGE / INCOME GAP [ % ]
81.0¢/ $1
WAGE / INCOME GAP [ $ ]
$9,910
FAMILY INCOME DEFICIT
0.48
INEQUALITY / GINI INDEX
16,962
LABOR FORCE [ PEOPLE ]
56.7%
PERCENT IN LABOR FORCE
5.2%
UNEMPLOYMENT RATE
Race in Independence County
The most populous races in Independence County are White / Caucasian (32,862 | 86.7%), Hispanic or Latino (2,696 | 7.1%), and Two or more Races (2,367 | 6.2%).

| Race | # Population | % Population |
| Asian | 274 | 0.7% |
| Black / African American | 727 | 1.9% |
| Hawaiian / Pacific | 127 | 0.3% |
| Hispanic or Latino | 2,696 | 7.1% |
| Native / Alaskan | 122 | 0.3% |
| White / Caucasian | 32,862 | 86.7% |
| Two or more Races | 2,367 | 6.2% |
| Some other Race | 1,431 | 3.8% |
| Total | 37,910 | 100.0% |
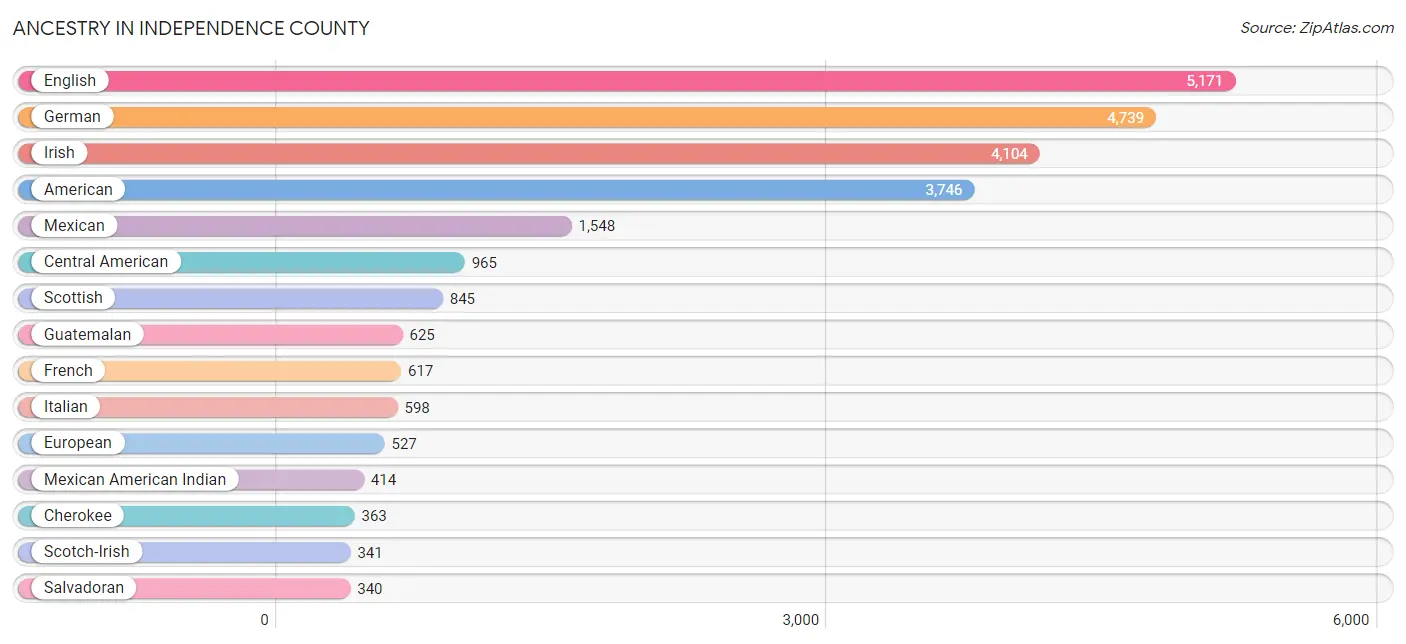
Ancestry in Independence County
The most populous ancestries reported in Independence County are English (5,171 | 13.6%), German (4,739 | 12.5%), Irish (4,104 | 10.8%), American (3,746 | 9.9%), and Mexican (1,548 | 4.1%), together accounting for 50.9% of all Independence County residents.
| Ancestry | # Population | % Population |
| African | 36 | 0.1% |
| American | 3,746 | 9.9% |
| Arab | 6 | 0.0% |
| Argentinean | 4 | 0.0% |
| Austrian | 31 | 0.1% |
| Belgian | 9 | 0.0% |
| Bhutanese | 14 | 0.0% |
| Blackfeet | 26 | 0.1% |
| British | 61 | 0.2% |
| Burmese | 12 | 0.0% |
| Central American | 965 | 2.5% |
| Central American Indian | 26 | 0.1% |
| Cherokee | 363 | 1.0% |
| Chippewa | 20 | 0.1% |
| Choctaw | 46 | 0.1% |
| Creek | 4 | 0.0% |
| Croatian | 2 | 0.0% |
| Cuban | 91 | 0.2% |
| Czech | 26 | 0.1% |
| Danish | 21 | 0.1% |
| Dutch | 259 | 0.7% |
| Eastern European | 7 | 0.0% |
| Egyptian | 6 | 0.0% |
| English | 5,171 | 13.6% |
| European | 527 | 1.4% |
| Fijian | 124 | 0.3% |
| Finnish | 32 | 0.1% |
| French | 617 | 1.6% |
| French Canadian | 46 | 0.1% |
| German | 4,739 | 12.5% |
| Greek | 61 | 0.2% |
| Guatemalan | 625 | 1.7% |
| Hungarian | 18 | 0.1% |
| Icelander | 2 | 0.0% |
| Indian (Asian) | 42 | 0.1% |
| Irish | 4,104 | 10.8% |
| Iroquois | 32 | 0.1% |
| Italian | 598 | 1.6% |
| Japanese | 13 | 0.0% |
| Korean | 72 | 0.2% |
| Lithuanian | 2 | 0.0% |
| Lumbee | 21 | 0.1% |
| Mexican | 1,548 | 4.1% |
| Mexican American Indian | 414 | 1.1% |
| Native Hawaiian | 10 | 0.0% |
| Navajo | 3 | 0.0% |
| Northern European | 17 | 0.0% |
| Norwegian | 124 | 0.3% |
| Pakistani | 7 | 0.0% |
| Polish | 236 | 0.6% |
| Portuguese | 5 | 0.0% |
| Puerto Rican | 12 | 0.0% |
| Romanian | 56 | 0.2% |
| Russian | 25 | 0.1% |
| Salvadoran | 340 | 0.9% |
| Scandinavian | 62 | 0.2% |
| Scotch-Irish | 341 | 0.9% |
| Scottish | 845 | 2.2% |
| Sioux | 13 | 0.0% |
| Slavic | 1 | 0.0% |
| Slovak | 7 | 0.0% |
| South African | 25 | 0.1% |
| South American | 4 | 0.0% |
| Spaniard | 19 | 0.1% |
| Sri Lankan | 113 | 0.3% |
| Subsaharan African | 61 | 0.2% |
| Swedish | 27 | 0.1% |
| Swiss | 49 | 0.1% |
| Thai | 27 | 0.1% |
| Welsh | 122 | 0.3% | View All 70 Rows |
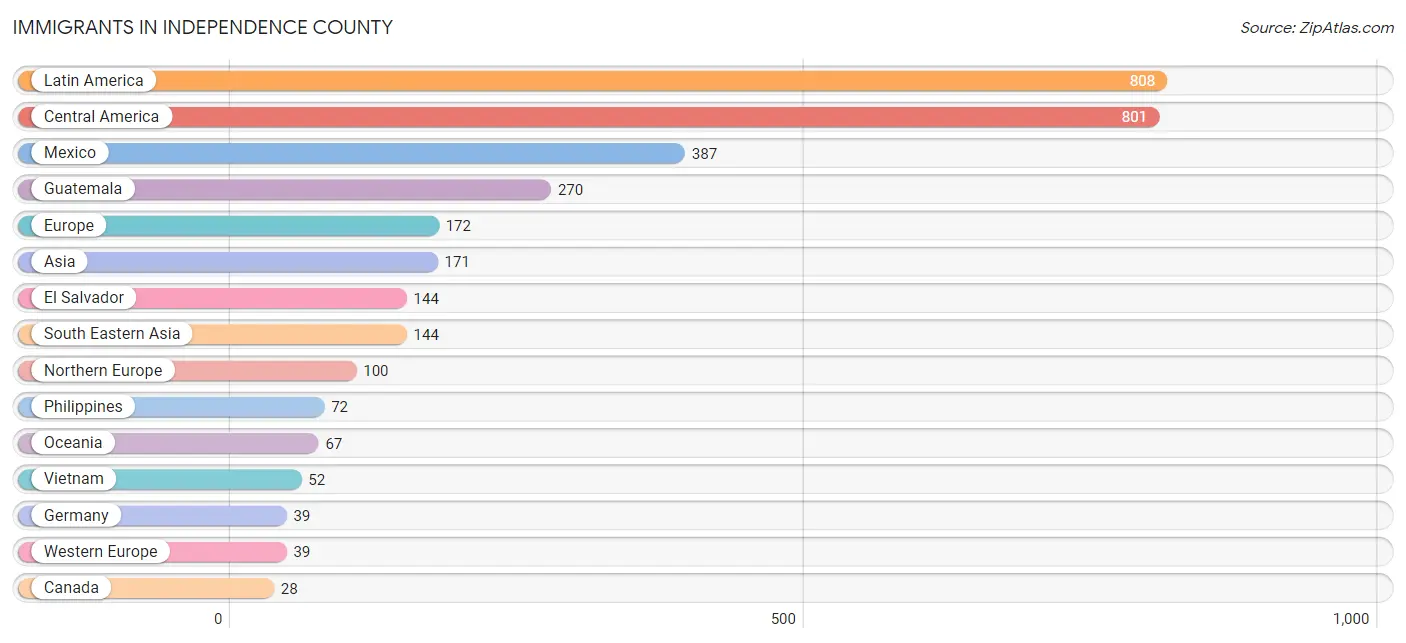
Immigrants in Independence County
The most numerous immigrant groups reported in Independence County came from Latin America (808 | 2.1%), Central America (801 | 2.1%), Mexico (387 | 1.0%), Guatemala (270 | 0.7%), and Europe (172 | 0.4%), together accounting for 6.4% of all Independence County residents.
| Immigration Origin | # Population | % Population |
| Africa | 25 | 0.1% |
| Argentina | 4 | 0.0% |
| Asia | 171 | 0.4% |
| Cambodia | 13 | 0.0% |
| Canada | 28 | 0.1% |
| Caribbean | 3 | 0.0% |
| Central America | 801 | 2.1% |
| Croatia | 2 | 0.0% |
| Cuba | 3 | 0.0% |
| Eastern Europe | 13 | 0.0% |
| El Salvador | 144 | 0.4% |
| England | 8 | 0.0% |
| Europe | 172 | 0.4% |
| Germany | 39 | 0.1% |
| Greece | 1 | 0.0% |
| Guatemala | 270 | 0.7% |
| India | 27 | 0.1% |
| Ireland | 8 | 0.0% |
| Latin America | 808 | 2.1% |
| Mexico | 387 | 1.0% |
| Northern Europe | 100 | 0.3% |
| Norway | 3 | 0.0% |
| Oceania | 67 | 0.2% |
| Philippines | 72 | 0.2% |
| Poland | 11 | 0.0% |
| South Africa | 25 | 0.1% |
| South America | 4 | 0.0% |
| South Central Asia | 27 | 0.1% |
| South Eastern Asia | 144 | 0.4% |
| Southern Europe | 20 | 0.1% |
| Spain | 19 | 0.1% |
| Thailand | 7 | 0.0% |
| Vietnam | 52 | 0.1% |
| Western Europe | 39 | 0.1% | View All 34 Rows |
Sex and Age in Independence County
Sex and Age in Independence County
The most populous age groups in Independence County are 35 to 39 Years (1,426 | 7.5%) for men and 10 to 14 Years (1,444 | 7.6%) for women.
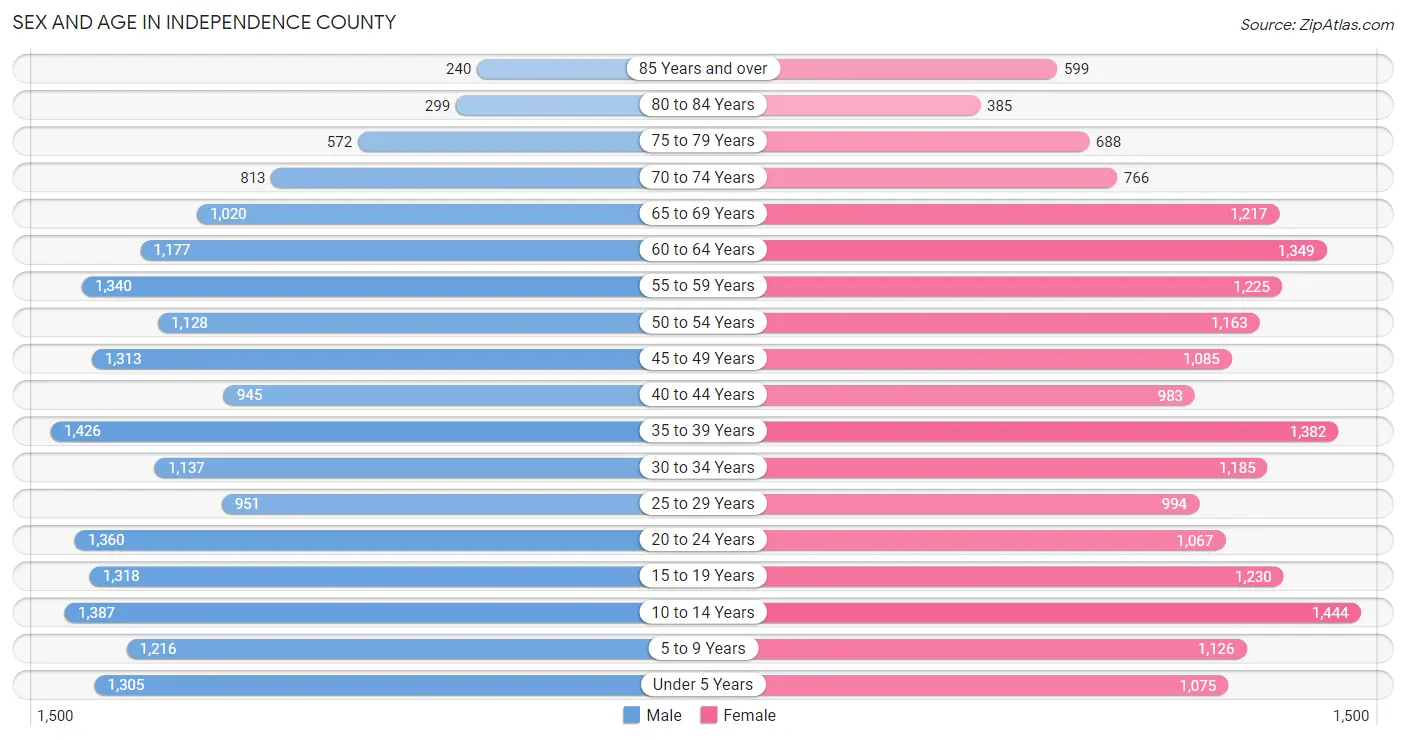
| Age Bracket | Male | Female |
| Under 5 Years | 1,305 (6.9%) | 1,075 (5.7%) |
| 5 to 9 Years | 1,216 (6.4%) | 1,126 (5.9%) |
| 10 to 14 Years | 1,387 (7.3%) | 1,444 (7.6%) |
| 15 to 19 Years | 1,318 (7.0%) | 1,230 (6.5%) |
| 20 to 24 Years | 1,360 (7.2%) | 1,067 (5.6%) |
| 25 to 29 Years | 951 (5.0%) | 994 (5.2%) |
| 30 to 34 Years | 1,137 (6.0%) | 1,185 (6.2%) |
| 35 to 39 Years | 1,426 (7.5%) | 1,382 (7.3%) |
| 40 to 44 Years | 945 (5.0%) | 983 (5.2%) |
| 45 to 49 Years | 1,313 (6.9%) | 1,085 (5.7%) |
| 50 to 54 Years | 1,128 (5.9%) | 1,163 (6.1%) |
| 55 to 59 Years | 1,340 (7.1%) | 1,225 (6.5%) |
| 60 to 64 Years | 1,177 (6.2%) | 1,349 (7.1%) |
| 65 to 69 Years | 1,020 (5.4%) | 1,217 (6.4%) |
| 70 to 74 Years | 813 (4.3%) | 766 (4.0%) |
| 75 to 79 Years | 572 (3.0%) | 688 (3.6%) |
| 80 to 84 Years | 299 (1.6%) | 385 (2.0%) |
| 85 Years and over | 240 (1.3%) | 599 (3.2%) |
| Total | 18,947 (100.0%) | 18,963 (100.0%) |
Families and Households in Independence County
Median Family Size in Independence County
The median family size in Independence County is 3.10 persons per family, with single female/mother families (1,477 | 15.0%) accounting for the largest median family size of 3.13 persons per family. On the other hand, single male/father families (759 | 7.7%) represent the smallest median family size with 2.95 persons per family.
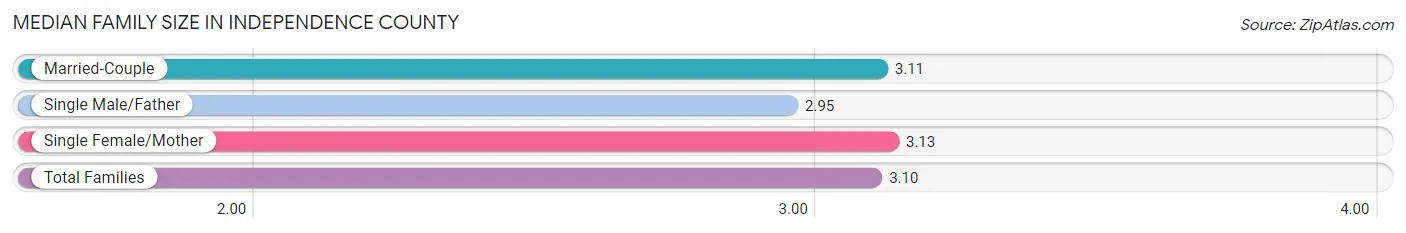
| Family Type | # Families | Family Size |
| Married-Couple | 7,575 (77.2%) | 3.11 |
| Single Male/Father | 759 (7.7%) | 2.95 |
| Single Female/Mother | 1,477 (15.0%) | 3.13 |
| Total Families | 9,811 (100.0%) | 3.10 |
Median Household Size in Independence County
The median household size in Independence County is 2.56 persons per household, with single male/father households (759 | 5.3%) accounting for the largest median household size of 3.68 persons per household. non-family households (4,606 | 32.0%) represent the smallest median household size with 1.18 persons per household.
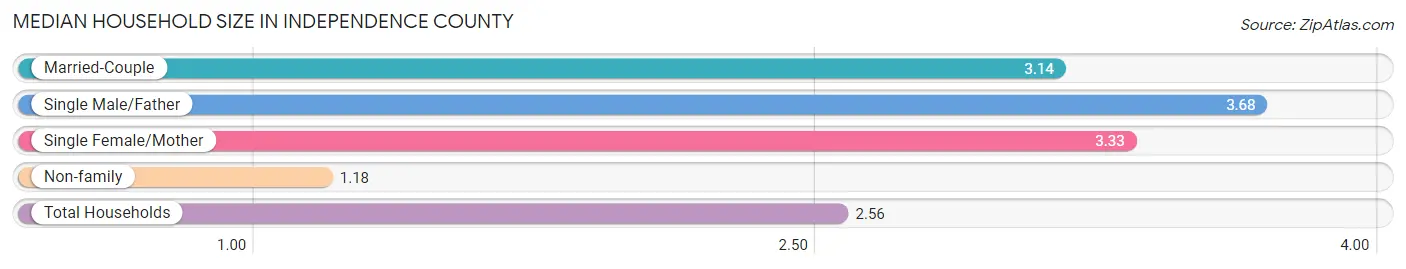
| Household Type | # Households | Household Size |
| Married-Couple | 7,575 (52.5%) | 3.14 |
| Single Male/Father | 759 (5.3%) | 3.68 |
| Single Female/Mother | 1,477 (10.2%) | 3.33 |
| Non-family | 4,606 (32.0%) | 1.18 |
| Total Households | 14,417 (100.0%) | 2.56 |
Household Size by Marriage Status in Independence County
Out of a total of 14,417 households in Independence County, 9,811 (68.0%) are family households, while 4,606 (32.0%) are nonfamily households. The most numerous type of family households are 2-person households, comprising 4,407, and the most common type of nonfamily households are 1-person households, comprising 3,943.
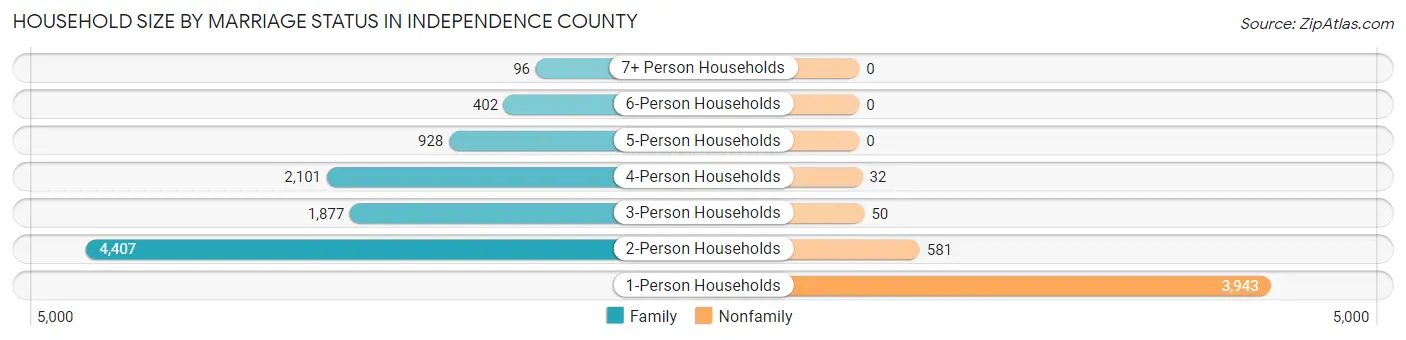
| Household Size | Family Households | Nonfamily Households |
| 1-Person Households | - | 3,943 (27.4%) |
| 2-Person Households | 4,407 (30.6%) | 581 (4.0%) |
| 3-Person Households | 1,877 (13.0%) | 50 (0.4%) |
| 4-Person Households | 2,101 (14.6%) | 32 (0.2%) |
| 5-Person Households | 928 (6.4%) | 0 (0.0%) |
| 6-Person Households | 402 (2.8%) | 0 (0.0%) |
| 7+ Person Households | 96 (0.7%) | 0 (0.0%) |
| Total | 9,811 (68.0%) | 4,606 (32.0%) |
Female Fertility in Independence County
Fertility by Age in Independence County
Average fertility rate in Independence County is 46.0 births per 1,000 women. Women in the age bracket of 20 to 34 years have the highest fertility rate with 84.0 births per 1,000 women. Women in the age bracket of 20 to 34 years acount for 72.0% of all women with births.
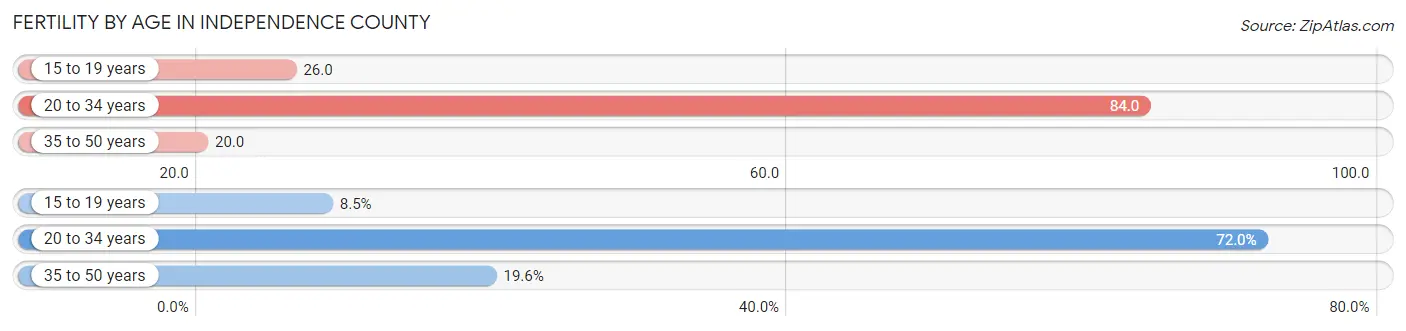
| Age Bracket | Women with Births | Births / 1,000 Women |
| 15 to 19 years | 32 (8.5%) | 26.0 |
| 20 to 34 years | 272 (72.0%) | 84.0 |
| 35 to 50 years | 74 (19.6%) | 20.0 |
| Total | 378 (100.0%) | 46.0 |
Fertility by Age by Marriage Status in Independence County
79.9% of women with births (378) in Independence County are married. The highest percentage of unmarried women with births falls into 15 to 19 years age bracket with 81.2% of them unmarried at the time of birth, while the lowest percentage of unmarried women with births belong to 35 to 50 years age bracket with 0.0% of them unmarried.
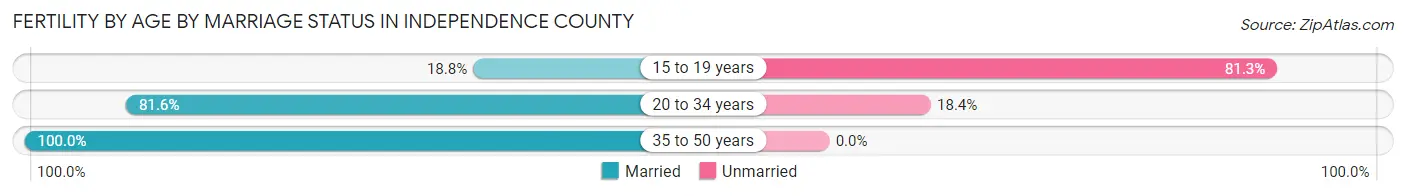
| Age Bracket | Married | Unmarried |
| 15 to 19 years | 6 (18.8%) | 26 (81.2%) |
| 20 to 34 years | 222 (81.6%) | 50 (18.4%) |
| 35 to 50 years | 74 (100.0%) | 0 (0.0%) |
| Total | 302 (79.9%) | 76 (20.1%) |
Fertility by Education in Independence County
Average fertility rate in Independence County is 46.0 births per 1,000 women. Women with the education attainment of high school diploma have the highest fertility rate of 98.0 births per 1,000 women, while women with the education attainment of bachelor's degree have the lowest fertility at 8.0 births per 1,000 women. Women with the education attainment of high school diploma represent 46.8% of all women with births.
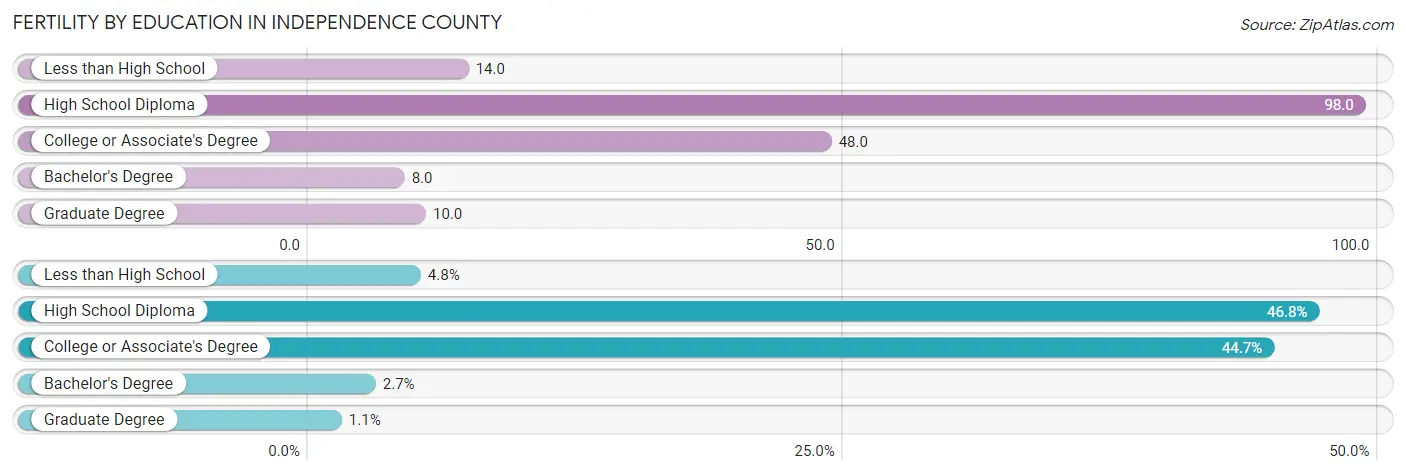
| Educational Attainment | Women with Births | Births / 1,000 Women |
| Less than High School | 18 (4.8%) | 14.0 |
| High School Diploma | 177 (46.8%) | 98.0 |
| College or Associate's Degree | 169 (44.7%) | 48.0 |
| Bachelor's Degree | 10 (2.6%) | 8.0 |
| Graduate Degree | 4 (1.1%) | 10.0 |
| Total | 378 (100.0%) | 46.0 |
Fertility by Education by Marriage Status in Independence County
20.1% of women with births in Independence County are unmarried. Women with the educational attainment of less than high school are most likely to be married with 100.0% of them married at childbirth, while women with the educational attainment of college or associate's degree are least likely to be married with 24.3% of them unmarried at childbirth.
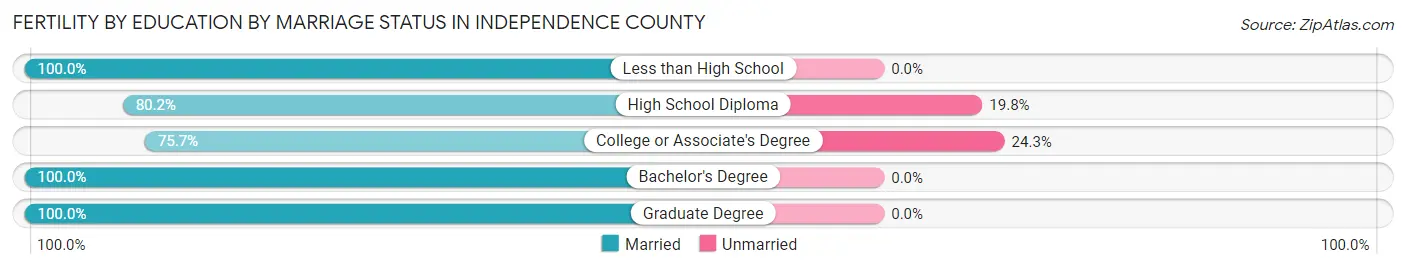
| Educational Attainment | Married | Unmarried |
| Less than High School | 18 (100.0%) | 0 (0.0%) |
| High School Diploma | 142 (80.2%) | 35 (19.8%) |
| College or Associate's Degree | 128 (75.7%) | 41 (24.3%) |
| Bachelor's Degree | 10 (100.0%) | 0 (0.0%) |
| Graduate Degree | 4 (100.0%) | 0 (0.0%) |
| Total | 302 (79.9%) | 76 (20.1%) |
Income in Independence County
Income Overview in Independence County
Per Capita Income in Independence County is $27,867, while median incomes of families and households are $62,620 and $52,361 respectively.
| Characteristic | Number | Measure |
| Per Capita Income | 37,910 | $27,867 |
| Median Family Income | 9,811 | $62,620 |
| Mean Family Income | 9,811 | $84,971 |
| Median Household Income | 14,417 | $52,361 |
| Mean Household Income | 14,417 | $71,260 |
| Income Deficit | 9,811 | $9,910 |
| Wage / Income Gap (%) | 37,910 | 18.97% |
| Wage / Income Gap ($) | 37,910 | 81.03¢ per $1 |
| Gini / Inequality Index | 37,910 | 0.48 |
Earnings by Sex in Independence County
Average Earnings in Independence County are $31,308, $34,767 for men and $28,172 for women, a difference of 19.0%.
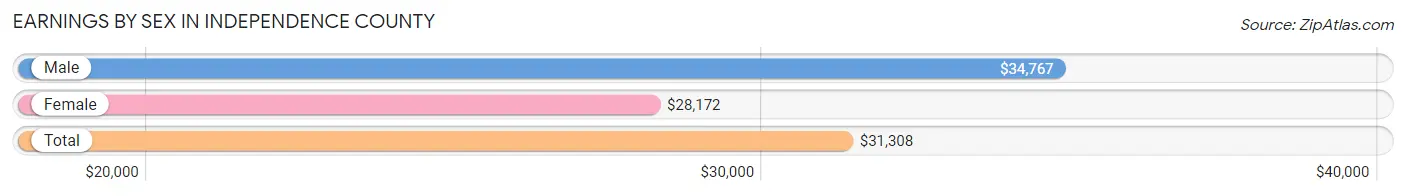
| Sex | Number | Average Earnings |
| Male | 9,708 (52.8%) | $34,767 |
| Female | 8,675 (47.2%) | $28,172 |
| Total | 18,383 (100.0%) | $31,308 |
Earnings by Sex by Income Bracket in Independence County
The most common earnings brackets in Independence County are $100,000+ for men (871 | 9.0%) and $25,000 to $29,999 for women (775 | 8.9%).
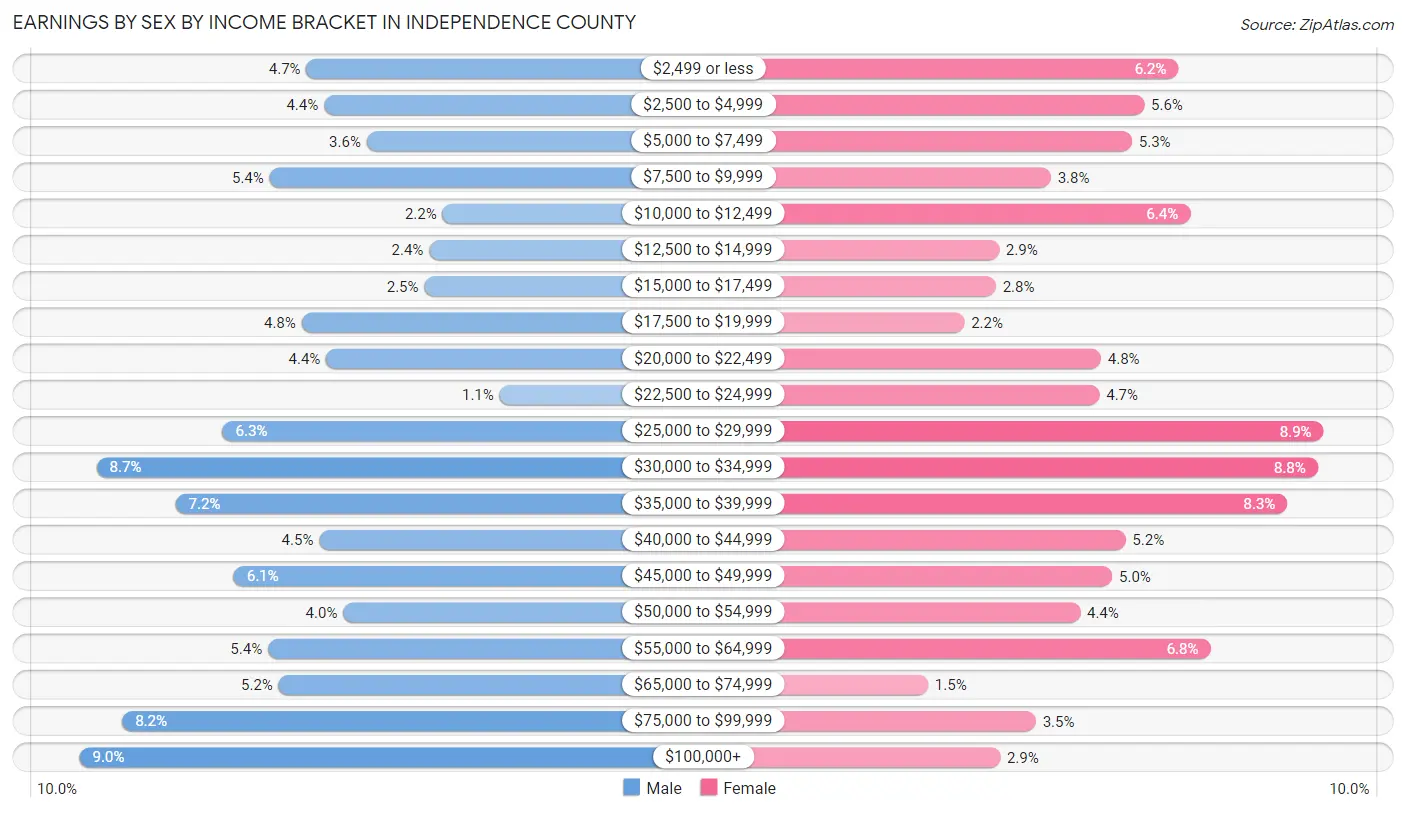
| Income | Male | Female |
| $2,499 or less | 458 (4.7%) | 539 (6.2%) |
| $2,500 to $4,999 | 426 (4.4%) | 483 (5.6%) |
| $5,000 to $7,499 | 349 (3.6%) | 463 (5.3%) |
| $7,500 to $9,999 | 525 (5.4%) | 331 (3.8%) |
| $10,000 to $12,499 | 211 (2.2%) | 558 (6.4%) |
| $12,500 to $14,999 | 235 (2.4%) | 247 (2.9%) |
| $15,000 to $17,499 | 244 (2.5%) | 242 (2.8%) |
| $17,500 to $19,999 | 467 (4.8%) | 191 (2.2%) |
| $20,000 to $22,499 | 422 (4.3%) | 413 (4.8%) |
| $22,500 to $24,999 | 107 (1.1%) | 410 (4.7%) |
| $25,000 to $29,999 | 611 (6.3%) | 775 (8.9%) |
| $30,000 to $34,999 | 840 (8.6%) | 765 (8.8%) |
| $35,000 to $39,999 | 696 (7.2%) | 716 (8.3%) |
| $40,000 to $44,999 | 435 (4.5%) | 453 (5.2%) |
| $45,000 to $49,999 | 590 (6.1%) | 431 (5.0%) |
| $50,000 to $54,999 | 391 (4.0%) | 379 (4.4%) |
| $55,000 to $64,999 | 528 (5.4%) | 591 (6.8%) |
| $65,000 to $74,999 | 509 (5.2%) | 132 (1.5%) |
| $75,000 to $99,999 | 793 (8.2%) | 307 (3.5%) |
| $100,000+ | 871 (9.0%) | 249 (2.9%) |
| Total | 9,708 (100.0%) | 8,675 (100.0%) |
Earnings by Sex by Educational Attainment in Independence County
Average earnings in Independence County are $40,437 for men and $31,830 for women, a difference of 21.3%. Men with an educational attainment of graduate degree enjoy the highest average annual earnings of $70,104, while those with less than high school education earn the least with $24,265. Women with an educational attainment of graduate degree earn the most with the average annual earnings of $57,292, while those with high school diploma education have the smallest earnings of $24,211.
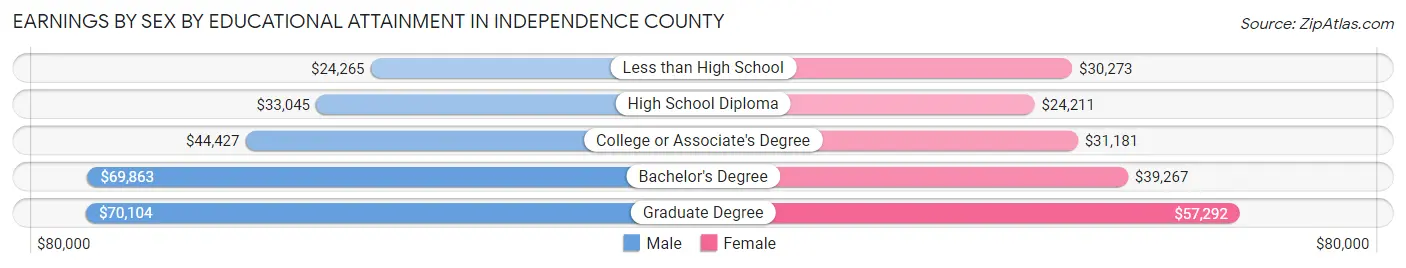
| Educational Attainment | Male Income | Female Income |
| Less than High School | $24,265 | $30,273 |
| High School Diploma | $33,045 | $24,211 |
| College or Associate's Degree | $44,427 | $31,181 |
| Bachelor's Degree | $69,863 | $39,267 |
| Graduate Degree | $70,104 | $57,292 |
| Total | $40,437 | $31,830 |
Family Income in Independence County
Family Income Brackets in Independence County
According to the Independence County family income data, there are 2,217 families falling into the $50,000 to $74,999 income range, which is the most common income bracket and makes up 22.6% of all families. Conversely, the $10,000 to $14,999 income bracket is the least frequent group with only 186 families (1.9%) belonging to this category.
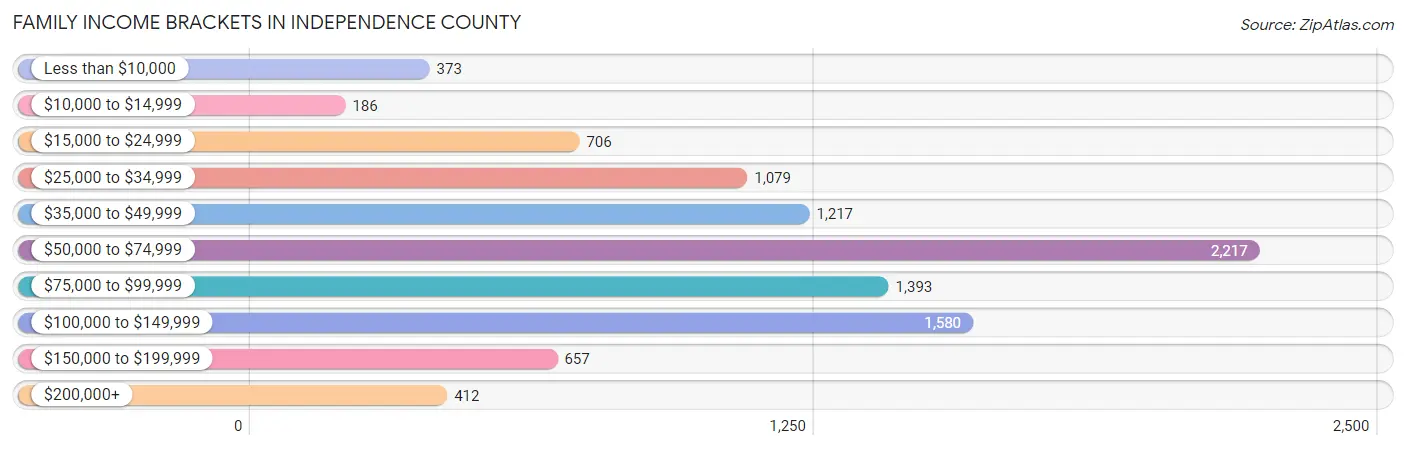
| Income Bracket | # Families | % Families |
| Less than $10,000 | 373 | 3.8% |
| $10,000 to $14,999 | 186 | 1.9% |
| $15,000 to $24,999 | 706 | 7.2% |
| $25,000 to $34,999 | 1,079 | 11.0% |
| $35,000 to $49,999 | 1,217 | 12.4% |
| $50,000 to $74,999 | 2,217 | 22.6% |
| $75,000 to $99,999 | 1,393 | 14.2% |
| $100,000 to $149,999 | 1,580 | 16.1% |
| $150,000 to $199,999 | 657 | 6.7% |
| $200,000+ | 412 | 4.2% |
Family Income by Famaliy Size in Independence County
4-person families (1,917 | 19.5%) account for the highest median family income in Independence County with $96,517 per family, while 2-person families (4,761 | 48.5%) have the highest median income of $28,802 per family member.
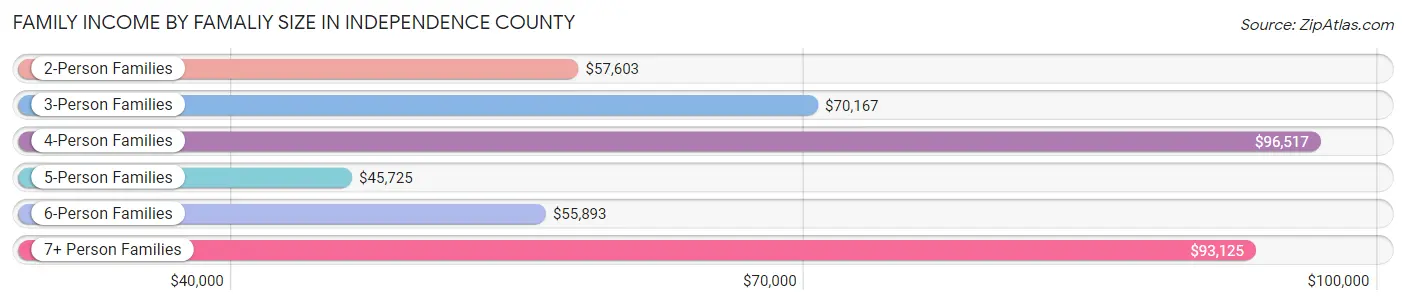
| Income Bracket | # Families | Median Income |
| 2-Person Families | 4,761 (48.5%) | $57,603 |
| 3-Person Families | 1,834 (18.7%) | $70,167 |
| 4-Person Families | 1,917 (19.5%) | $96,517 |
| 5-Person Families | 863 (8.8%) | $45,725 |
| 6-Person Families | 366 (3.7%) | $55,893 |
| 7+ Person Families | 70 (0.7%) | $93,125 |
| Total | 9,811 (100.0%) | $62,620 |
Family Income by Number of Earners in Independence County
The median family income in Independence County is $62,620, with families comprising 3+ earners (1,245) having the highest median family income of $104,181, while families with no earners (1,686) have the lowest median family income of $31,771, accounting for 12.7% and 17.2% of families, respectively.
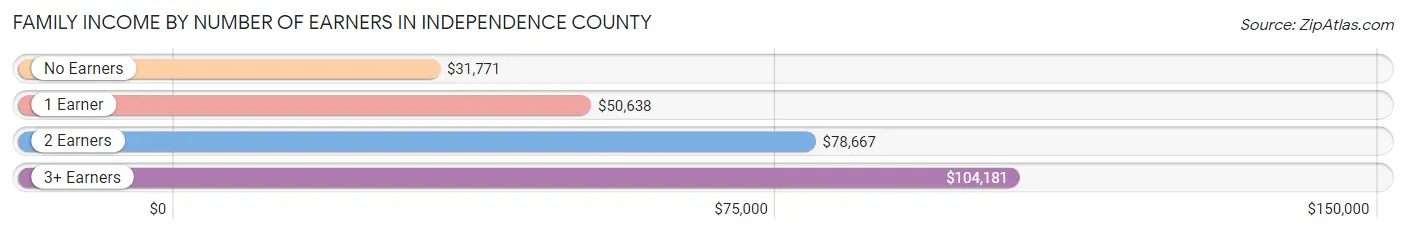
| Number of Earners | # Families | Median Income |
| No Earners | 1,686 (17.2%) | $31,771 |
| 1 Earner | 3,168 (32.3%) | $50,638 |
| 2 Earners | 3,712 (37.8%) | $78,667 |
| 3+ Earners | 1,245 (12.7%) | $104,181 |
| Total | 9,811 (100.0%) | $62,620 |
Household Income in Independence County
Household Income Brackets in Independence County
With 2,898 households falling in the category, the $50,000 to $74,999 income range is the most frequent in Independence County, accounting for 20.1% of all households. In contrast, only 447 households (3.1%) fall into the $200,000+ income bracket, making it the least populous group.

| Income Bracket | # Households | % Households |
| Less than $10,000 | 807 | 5.6% |
| $10,000 to $14,999 | 966 | 6.7% |
| $15,000 to $24,999 | 1,557 | 10.8% |
| $25,000 to $34,999 | 1,788 | 12.4% |
| $35,000 to $49,999 | 1,788 | 12.4% |
| $50,000 to $74,999 | 2,898 | 20.1% |
| $75,000 to $99,999 | 1,701 | 11.8% |
| $100,000 to $149,999 | 1,730 | 12.0% |
| $150,000 to $199,999 | 706 | 4.9% |
| $200,000+ | 447 | 3.1% |
Household Income by Householder Age in Independence County
The median household income in Independence County is $52,361, with the highest median household income of $63,839 found in the 25 to 44 years age bracket for the primary householder. A total of 4,392 households (30.5%) fall into this category. Meanwhile, the 15 to 24 years age bracket for the primary householder has the lowest median household income of $39,234, with 517 households (3.6%) in this group.
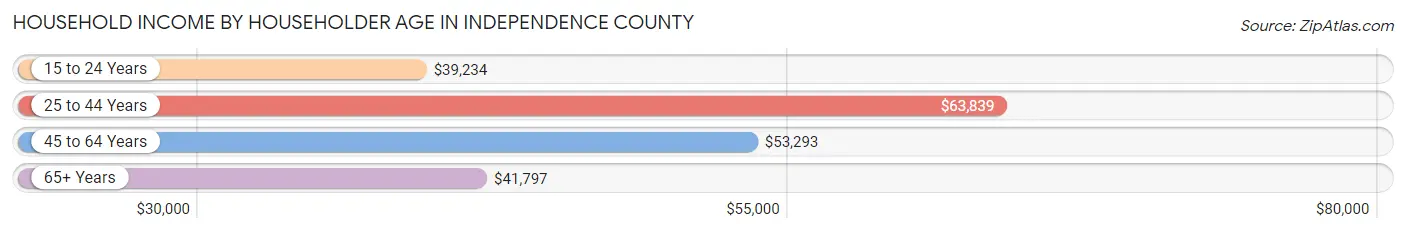
| Income Bracket | # Households | Median Income |
| 15 to 24 Years | 517 (3.6%) | $39,234 |
| 25 to 44 Years | 4,392 (30.5%) | $63,839 |
| 45 to 64 Years | 5,420 (37.6%) | $53,293 |
| 65+ Years | 4,088 (28.4%) | $41,797 |
| Total | 14,417 (100.0%) | $52,361 |
Poverty in Independence County
Income Below Poverty by Sex and Age in Independence County
With 19.5% poverty level for males and 19.2% for females among the residents of Independence County, 16 and 17 year old males and 12 to 14 year old females are the most vulnerable to poverty, with 179 males (36.2%) and 275 females (34.5%) in their respective age groups living below the poverty level.
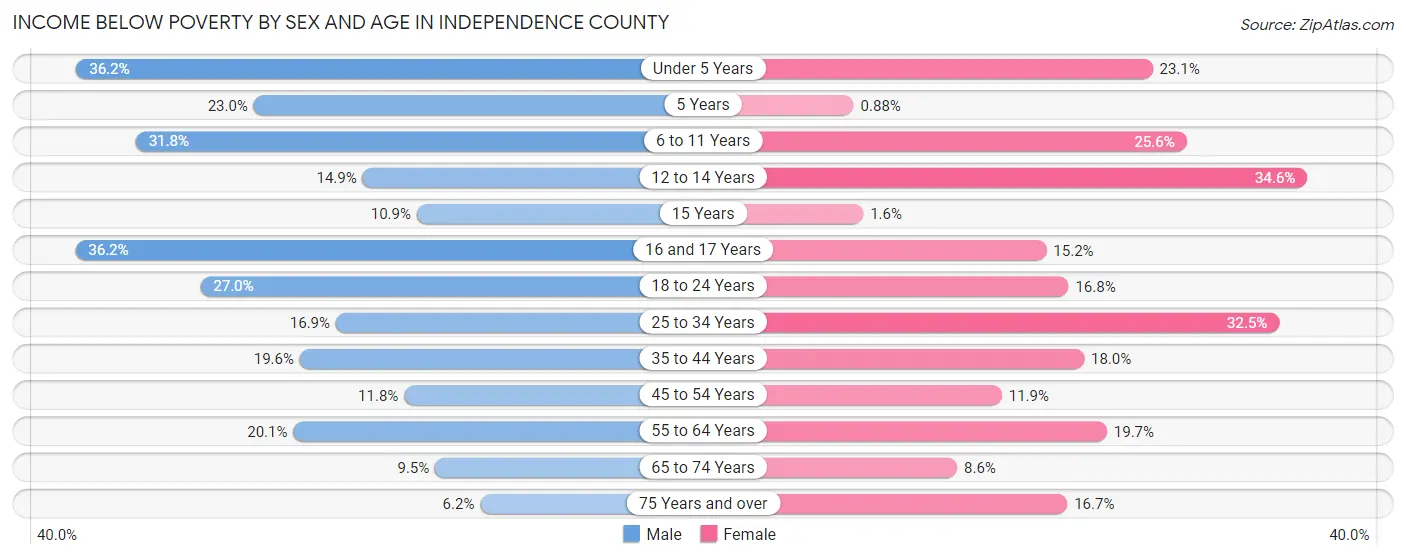
| Age Bracket | Male | Female |
| Under 5 Years | 448 (36.2%) | 248 (23.1%) |
| 5 Years | 63 (23.0%) | 2 (0.9%) |
| 6 to 11 Years | 460 (31.8%) | 377 (25.6%) |
| 12 to 14 Years | 123 (14.9%) | 275 (34.5%) |
| 15 Years | 26 (10.9%) | 3 (1.6%) |
| 16 and 17 Years | 179 (36.2%) | 82 (15.2%) |
| 18 to 24 Years | 457 (27.0%) | 234 (16.8%) |
| 25 to 34 Years | 349 (16.9%) | 706 (32.5%) |
| 35 to 44 Years | 460 (19.6%) | 424 (18.0%) |
| 45 to 54 Years | 288 (11.8%) | 266 (11.9%) |
| 55 to 64 Years | 499 (20.1%) | 505 (19.7%) |
| 65 to 74 Years | 172 (9.5%) | 163 (8.6%) |
| 75 Years and over | 65 (6.2%) | 250 (16.7%) |
| Total | 3,589 (19.5%) | 3,535 (19.2%) |
Income Above Poverty by Sex and Age in Independence County
According to the poverty statistics in Independence County, males aged 75 years and over and females aged 5 years are the age groups that are most secure financially, with 93.8% of males and 99.1% of females in these age groups living above the poverty line.
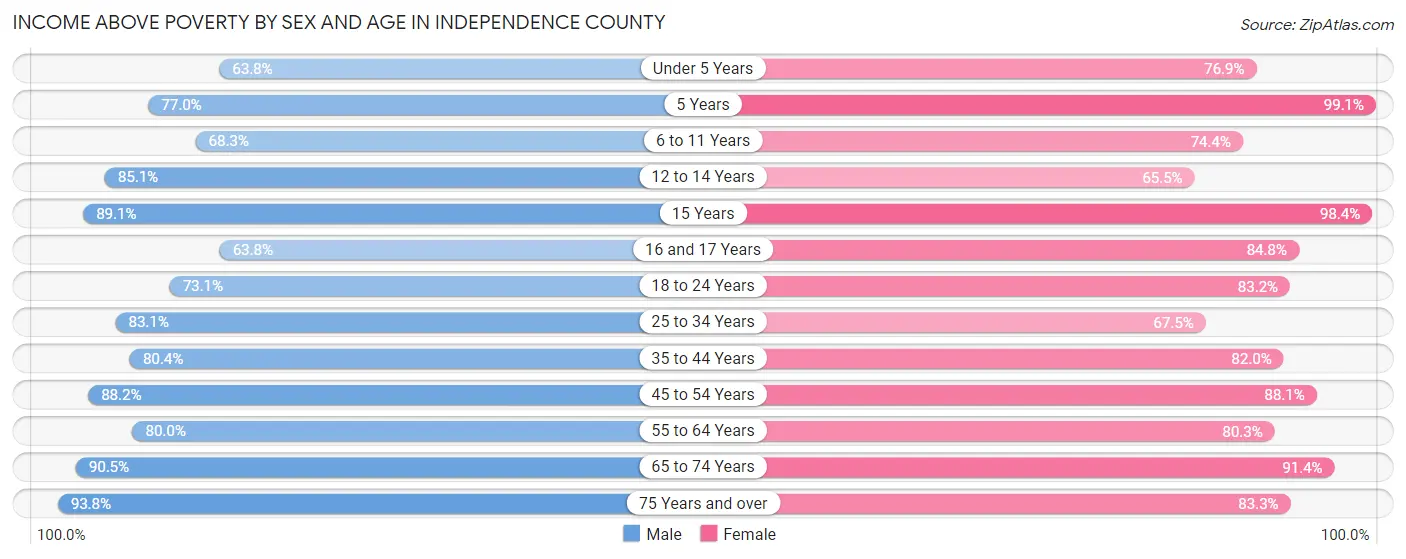
| Age Bracket | Male | Female |
| Under 5 Years | 791 (63.8%) | 827 (76.9%) |
| 5 Years | 211 (77.0%) | 225 (99.1%) |
| 6 to 11 Years | 989 (68.2%) | 1,096 (74.4%) |
| 12 to 14 Years | 702 (85.1%) | 521 (65.4%) |
| 15 Years | 213 (89.1%) | 186 (98.4%) |
| 16 and 17 Years | 315 (63.8%) | 458 (84.8%) |
| 18 to 24 Years | 1,239 (73.1%) | 1,156 (83.2%) |
| 25 to 34 Years | 1,717 (83.1%) | 1,468 (67.5%) |
| 35 to 44 Years | 1,890 (80.4%) | 1,933 (82.0%) |
| 45 to 54 Years | 2,149 (88.2%) | 1,974 (88.1%) |
| 55 to 64 Years | 1,990 (79.9%) | 2,061 (80.3%) |
| 65 to 74 Years | 1,634 (90.5%) | 1,742 (91.4%) |
| 75 Years and over | 989 (93.8%) | 1,243 (83.3%) |
| Total | 14,829 (80.5%) | 14,890 (80.8%) |
Income Below Poverty Among Married-Couple Families in Independence County
The poverty statistics for married-couple families in Independence County show that 10.1% or 764 of the total 7,575 families live below the poverty line. Families with 3 or 4 children have the highest poverty rate of 57.5%, comprising of 412 families. On the other hand, families with no children have the lowest poverty rate of 4.1%, which includes 169 families.
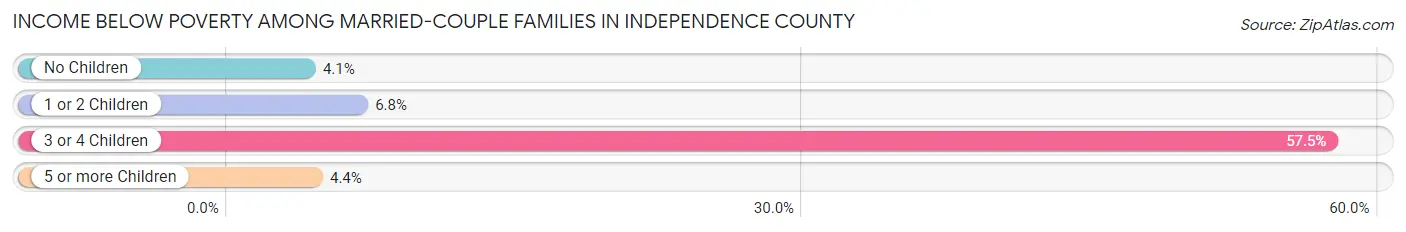
| Children | Above Poverty | Below Poverty |
| No Children | 3,984 (95.9%) | 169 (4.1%) |
| 1 or 2 Children | 2,479 (93.2%) | 181 (6.8%) |
| 3 or 4 Children | 305 (42.5%) | 412 (57.5%) |
| 5 or more Children | 43 (95.6%) | 2 (4.4%) |
| Total | 6,811 (89.9%) | 764 (10.1%) |
Income Below Poverty Among Single-Parent Households in Independence County
According to the poverty data in Independence County, 21.1% or 160 single-father households and 32.3% or 477 single-mother households are living below the poverty line. Among single-father households, those with 3 or 4 children have the highest poverty rate, with 20 households (41.7%) experiencing poverty. Likewise, among single-mother households, those with 3 or 4 children have the highest poverty rate, with 107 households (75.3%) falling below the poverty line.
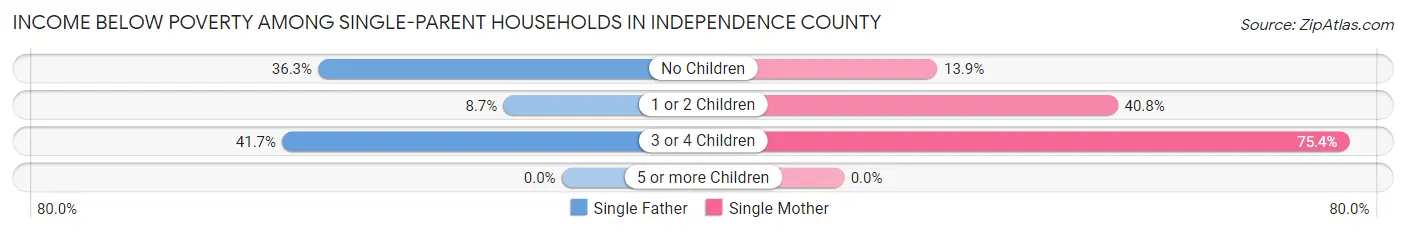
| Children | Single Father | Single Mother |
| No Children | 110 (36.3%) | 88 (13.9%) |
| 1 or 2 Children | 30 (8.7%) | 282 (40.8%) |
| 3 or 4 Children | 20 (41.7%) | 107 (75.3%) |
| 5 or more Children | 0 (0.0%) | 0 (0.0%) |
| Total | 160 (21.1%) | 477 (32.3%) |
Income Below Poverty Among Married-Couple vs Single-Parent Households in Independence County
The poverty data for Independence County shows that 764 of the married-couple family households (10.1%) and 637 of the single-parent households (28.5%) are living below the poverty level. Within the married-couple family households, those with 3 or 4 children have the highest poverty rate, with 412 households (57.5%) falling below the poverty line. Among the single-parent households, those with 3 or 4 children have the highest poverty rate, with 127 household (66.8%) living below poverty.
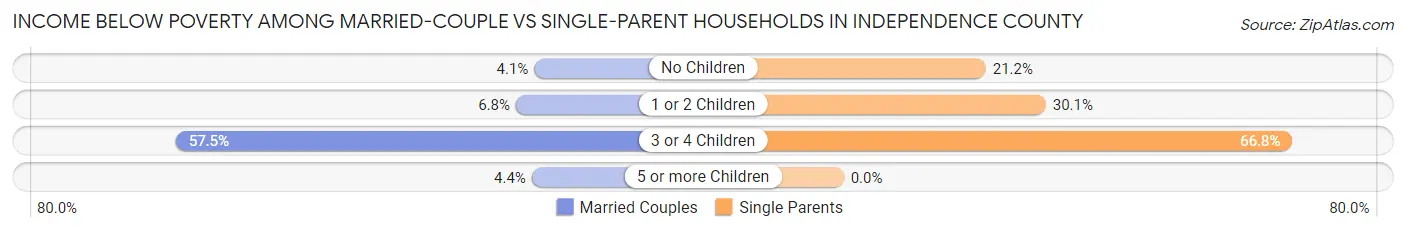
| Children | Married-Couple Families | Single-Parent Households |
| No Children | 169 (4.1%) | 198 (21.2%) |
| 1 or 2 Children | 181 (6.8%) | 312 (30.1%) |
| 3 or 4 Children | 412 (57.5%) | 127 (66.8%) |
| 5 or more Children | 2 (4.4%) | 0 (0.0%) |
| Total | 764 (10.1%) | 637 (28.5%) |
Employment Characteristics in Independence County
Employment by Class of Employer in Independence County
Among the 15,894 employed individuals in Independence County, private company employees (10,688 | 67.2%), state government employees (1,418 | 8.9%), and not-for-profit organizations (1,325 | 8.3%) make up the most common classes of employment.
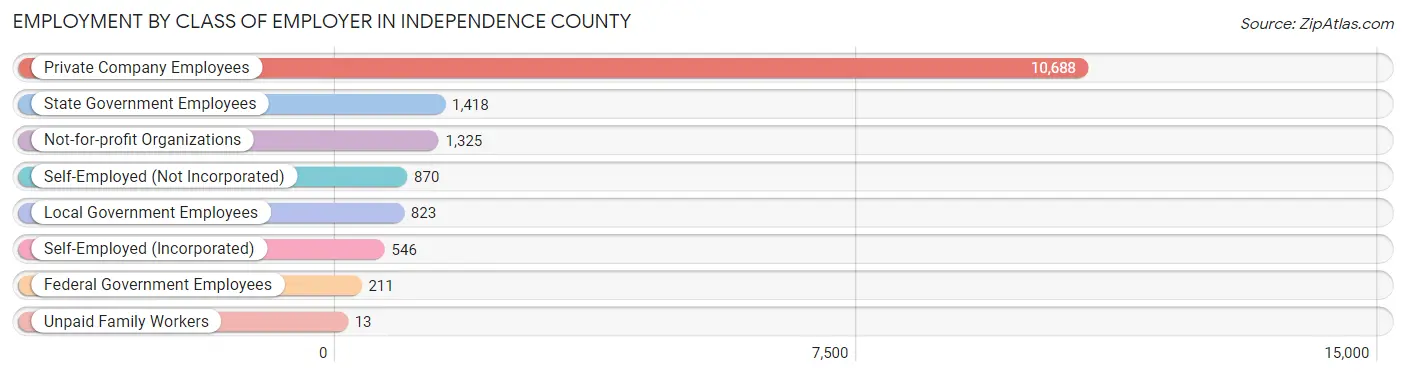
| Employer Class | # Employees | % Employees |
| Private Company Employees | 10,688 | 67.2% |
| Self-Employed (Incorporated) | 546 | 3.4% |
| Self-Employed (Not Incorporated) | 870 | 5.5% |
| Not-for-profit Organizations | 1,325 | 8.3% |
| Local Government Employees | 823 | 5.2% |
| State Government Employees | 1,418 | 8.9% |
| Federal Government Employees | 211 | 1.3% |
| Unpaid Family Workers | 13 | 0.1% |
| Total | 15,894 | 100.0% |
Employment Status by Age in Independence County
According to the labor force statistics for Independence County, out of the total population over 16 years of age (29,916), 56.7% or 16,962 individuals are in the labor force, with 5.2% or 882 of them unemployed. The age group with the highest labor force participation rate is 45 to 54 years, with 80.1% or 3,756 individuals in the labor force. Within the labor force, the 20 to 24 years age range has the highest percentage of unemployed individuals, with 19.1% or 337 of them being unemployed.
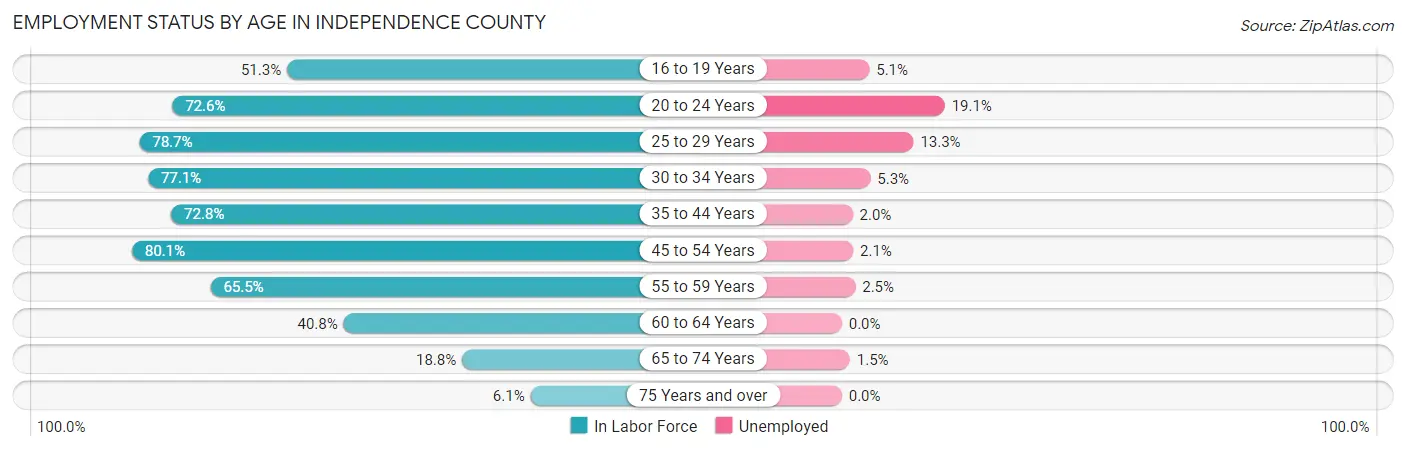
| Age Bracket | In Labor Force | Unemployed |
| 16 to 19 Years | 1,081 (51.3%) | 55 (5.1%) |
| 20 to 24 Years | 1,762 (72.6%) | 337 (19.1%) |
| 25 to 29 Years | 1,531 (78.7%) | 204 (13.3%) |
| 30 to 34 Years | 1,790 (77.1%) | 95 (5.3%) |
| 35 to 44 Years | 3,448 (72.8%) | 69 (2.0%) |
| 45 to 54 Years | 3,756 (80.1%) | 79 (2.1%) |
| 55 to 59 Years | 1,680 (65.5%) | 42 (2.5%) |
| 60 to 64 Years | 1,031 (40.8%) | 0 (0.0%) |
| 65 to 74 Years | 717 (18.8%) | 11 (1.5%) |
| 75 Years and over | 170 (6.1%) | 0 (0.0%) |
| Total | 16,962 (56.7%) | 882 (5.2%) |
Employment Status by Educational Attainment in Independence County
According to labor force statistics for Independence County, 70.5% of individuals (13,242) out of the total population between 25 and 64 years of age (18,783) are in the labor force, with 3.7% or 490 of them being unemployed. The group with the highest labor force participation rate are those with the educational attainment of bachelor's degree or higher, with 87.0% or 2,734 individuals in the labor force. Within the labor force, individuals with less than high school education have the highest percentage of unemployment, with 5.4% or 52 of them being unemployed.
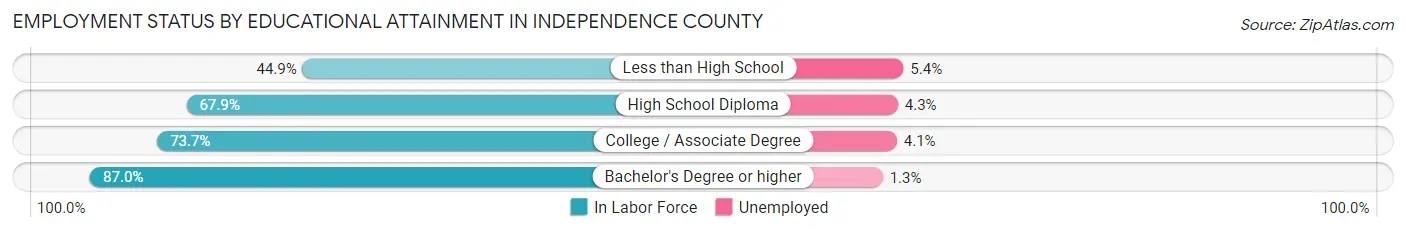
| Educational Attainment | In Labor Force | Unemployed |
| Less than High School | 964 (44.9%) | 116 (5.4%) |
| High School Diploma | 4,710 (67.9%) | 298 (4.3%) |
| College / Associate Degree | 4,833 (73.7%) | 269 (4.1%) |
| Bachelor's Degree or higher | 2,734 (87.0%) | 41 (1.3%) |
| Total | 13,242 (70.5%) | 695 (3.7%) |
Employment Occupations by Sex in Independence County
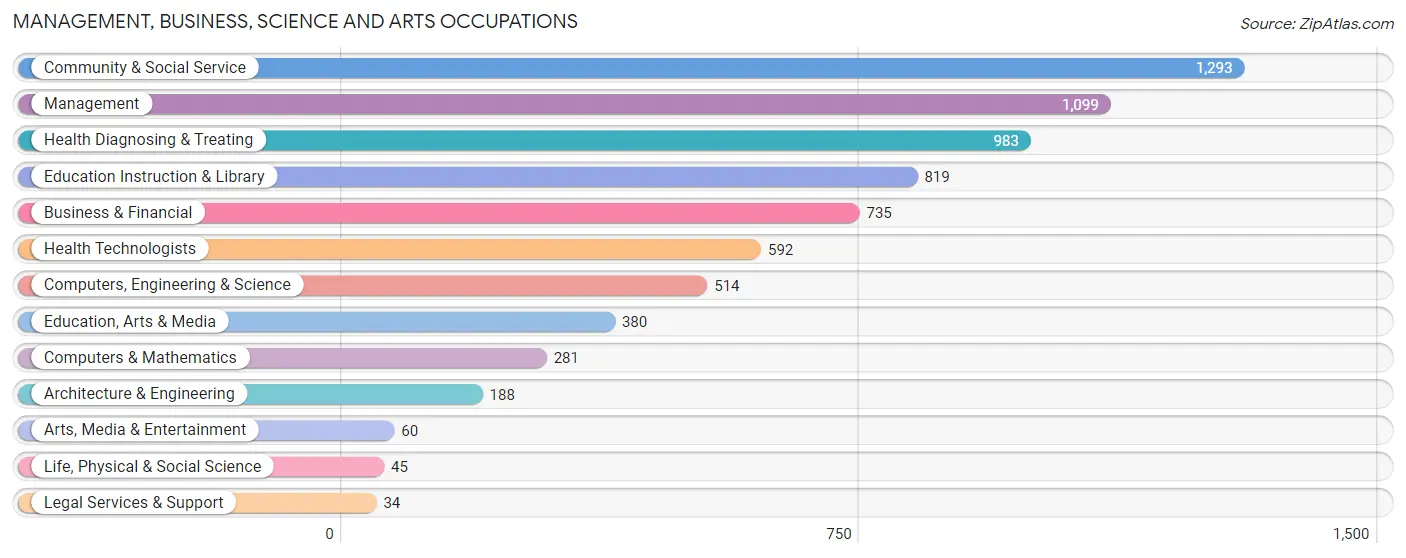
Management, Business, Science and Arts Occupations
The most common Management, Business, Science and Arts occupations in Independence County are Community & Social Service (1,293 | 8.1%), Management (1,099 | 6.9%), Health Diagnosing & Treating (983 | 6.1%), Education Instruction & Library (819 | 5.1%), and Business & Financial (735 | 4.6%).
Management, Business, Science and Arts Occupations by Sex
Within the Management, Business, Science and Arts occupations in Independence County, the most male-oriented occupations are Computers & Mathematics (100.0%), Architecture & Engineering (100.0%), and Legal Services & Support (100.0%), while the most female-oriented occupations are Education Instruction & Library (77.7%), Health Diagnosing & Treating (73.8%), and Business & Financial (71.3%).
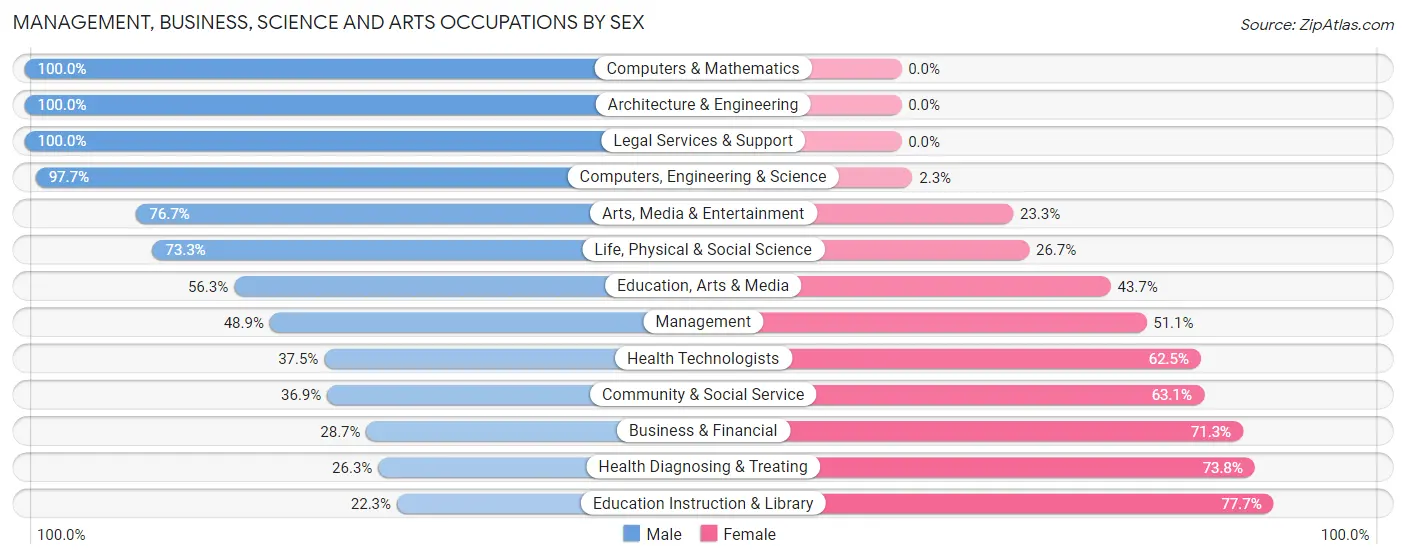
| Occupation | Male | Female |
| Management | 537 (48.9%) | 562 (51.1%) |
| Business & Financial | 211 (28.7%) | 524 (71.3%) |
| Computers, Engineering & Science | 502 (97.7%) | 12 (2.3%) |
| Computers & Mathematics | 281 (100.0%) | 0 (0.0%) |
| Architecture & Engineering | 188 (100.0%) | 0 (0.0%) |
| Life, Physical & Social Science | 33 (73.3%) | 12 (26.7%) |
| Community & Social Service | 477 (36.9%) | 816 (63.1%) |
| Education, Arts & Media | 214 (56.3%) | 166 (43.7%) |
| Legal Services & Support | 34 (100.0%) | 0 (0.0%) |
| Education Instruction & Library | 183 (22.3%) | 636 (77.7%) |
| Arts, Media & Entertainment | 46 (76.7%) | 14 (23.3%) |
| Health Diagnosing & Treating | 258 (26.3%) | 725 (73.8%) |
| Health Technologists | 222 (37.5%) | 370 (62.5%) |
| Total (Category) | 1,985 (42.9%) | 2,639 (57.1%) |
| Total (Overall) | 8,438 (52.6%) | 7,599 (47.4%) |
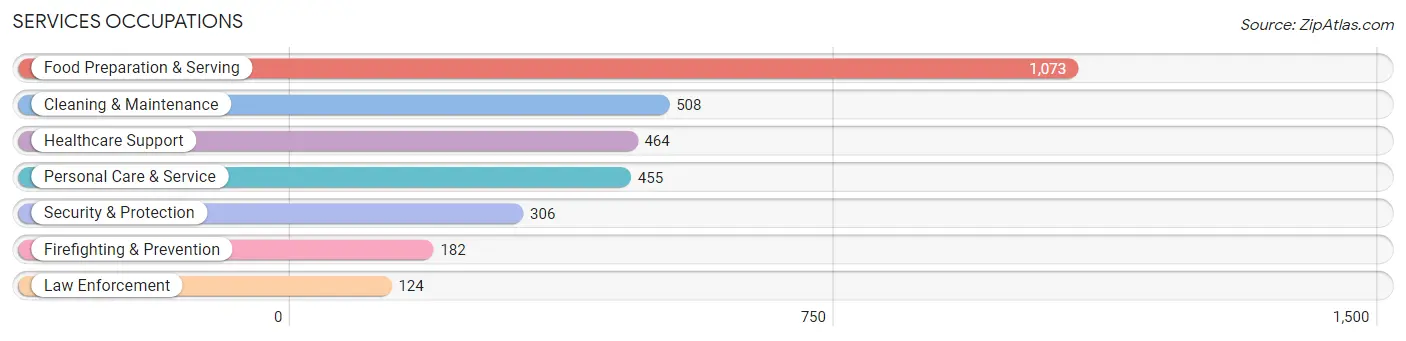
Services Occupations
The most common Services occupations in Independence County are Food Preparation & Serving (1,073 | 6.7%), Cleaning & Maintenance (508 | 3.2%), Healthcare Support (464 | 2.9%), Personal Care & Service (455 | 2.8%), and Security & Protection (306 | 1.9%).
Services Occupations by Sex
Within the Services occupations in Independence County, the most male-oriented occupations are Firefighting & Prevention (68.7%), Security & Protection (64.4%), and Cleaning & Maintenance (62.4%), while the most female-oriented occupations are Healthcare Support (92.5%), Personal Care & Service (78.2%), and Food Preparation & Serving (49.4%).
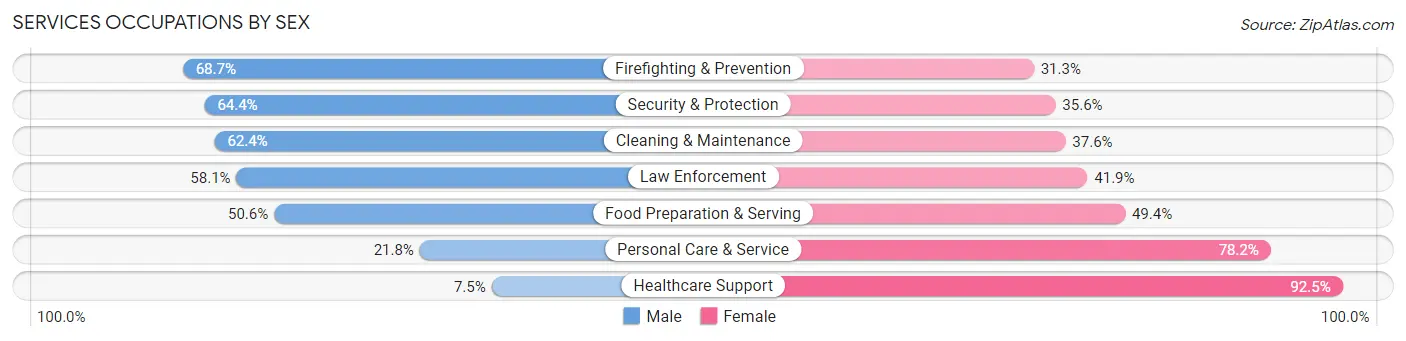
| Occupation | Male | Female |
| Healthcare Support | 35 (7.5%) | 429 (92.5%) |
| Security & Protection | 197 (64.4%) | 109 (35.6%) |
| Firefighting & Prevention | 125 (68.7%) | 57 (31.3%) |
| Law Enforcement | 72 (58.1%) | 52 (41.9%) |
| Food Preparation & Serving | 543 (50.6%) | 530 (49.4%) |
| Cleaning & Maintenance | 317 (62.4%) | 191 (37.6%) |
| Personal Care & Service | 99 (21.8%) | 356 (78.2%) |
| Total (Category) | 1,191 (42.4%) | 1,615 (57.6%) |
| Total (Overall) | 8,438 (52.6%) | 7,599 (47.4%) |
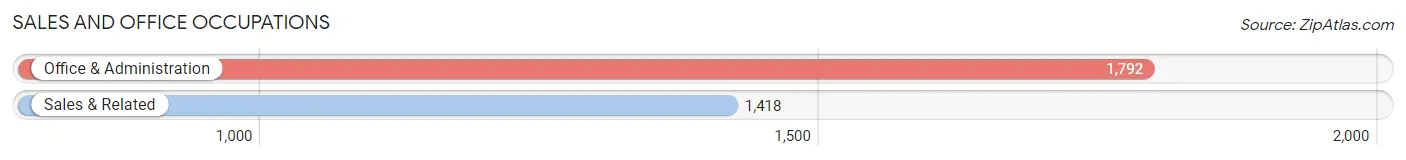
Sales and Office Occupations
The most common Sales and Office occupations in Independence County are Office & Administration (1,792 | 11.2%), and Sales & Related (1,418 | 8.8%).
Sales and Office Occupations by Sex
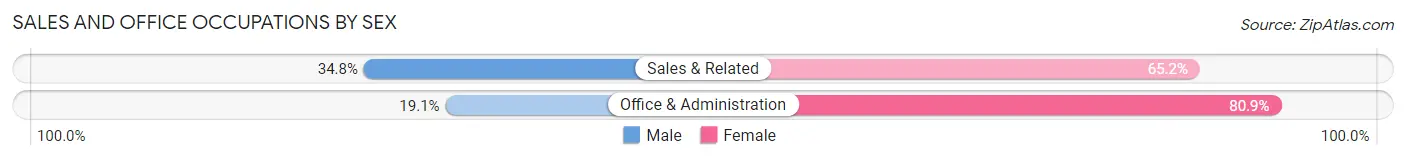
| Occupation | Male | Female |
| Sales & Related | 493 (34.8%) | 925 (65.2%) |
| Office & Administration | 342 (19.1%) | 1,450 (80.9%) |
| Total (Category) | 835 (26.0%) | 2,375 (74.0%) |
| Total (Overall) | 8,438 (52.6%) | 7,599 (47.4%) |
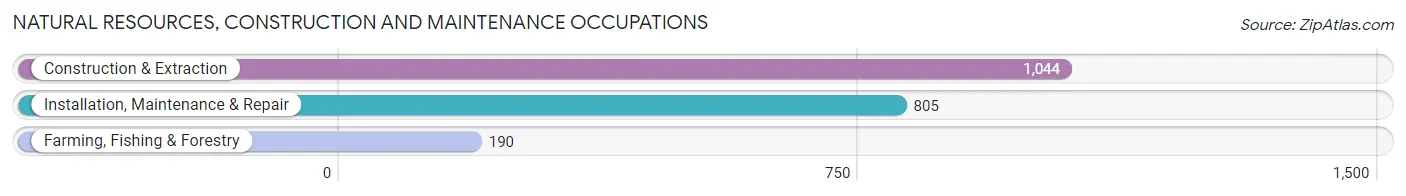
Natural Resources, Construction and Maintenance Occupations
The most common Natural Resources, Construction and Maintenance occupations in Independence County are Construction & Extraction (1,044 | 6.5%), Installation, Maintenance & Repair (805 | 5.0%), and Farming, Fishing & Forestry (190 | 1.2%).
Natural Resources, Construction and Maintenance Occupations by Sex
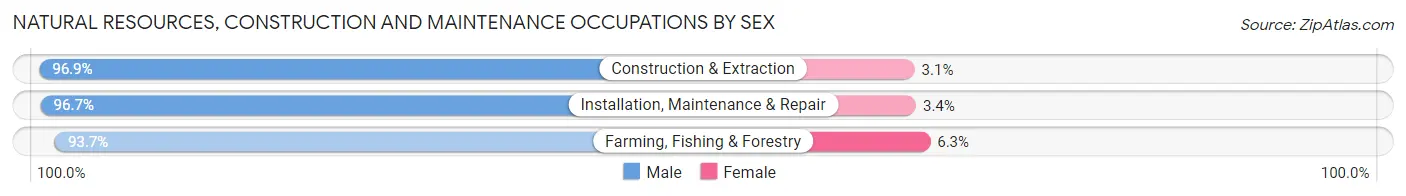
| Occupation | Male | Female |
| Farming, Fishing & Forestry | 178 (93.7%) | 12 (6.3%) |
| Construction & Extraction | 1,012 (96.9%) | 32 (3.1%) |
| Installation, Maintenance & Repair | 778 (96.7%) | 27 (3.4%) |
| Total (Category) | 1,968 (96.5%) | 71 (3.5%) |
| Total (Overall) | 8,438 (52.6%) | 7,599 (47.4%) |
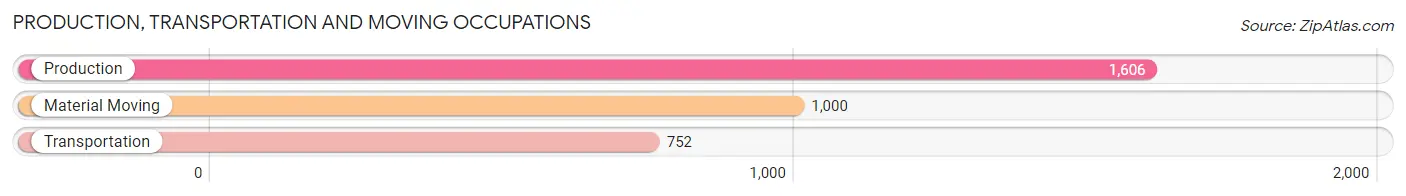
Production, Transportation and Moving Occupations
The most common Production, Transportation and Moving occupations in Independence County are Production (1,606 | 10.0%), Material Moving (1,000 | 6.2%), and Transportation (752 | 4.7%).
Production, Transportation and Moving Occupations by Sex
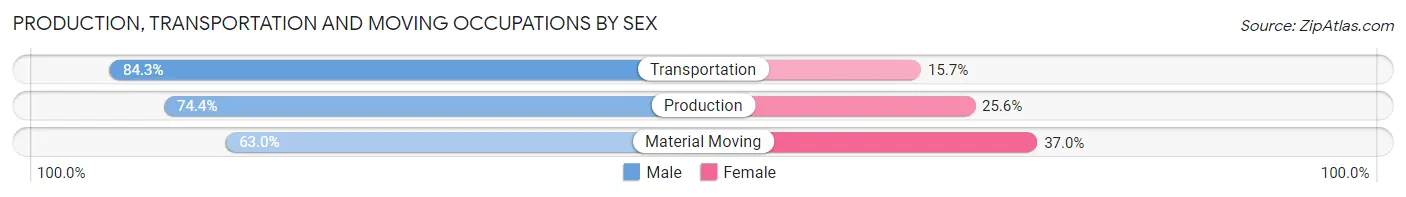
| Occupation | Male | Female |
| Production | 1,195 (74.4%) | 411 (25.6%) |
| Transportation | 634 (84.3%) | 118 (15.7%) |
| Material Moving | 630 (63.0%) | 370 (37.0%) |
| Total (Category) | 2,459 (73.2%) | 899 (26.8%) |
| Total (Overall) | 8,438 (52.6%) | 7,599 (47.4%) |
Employment Industries by Sex in Independence County
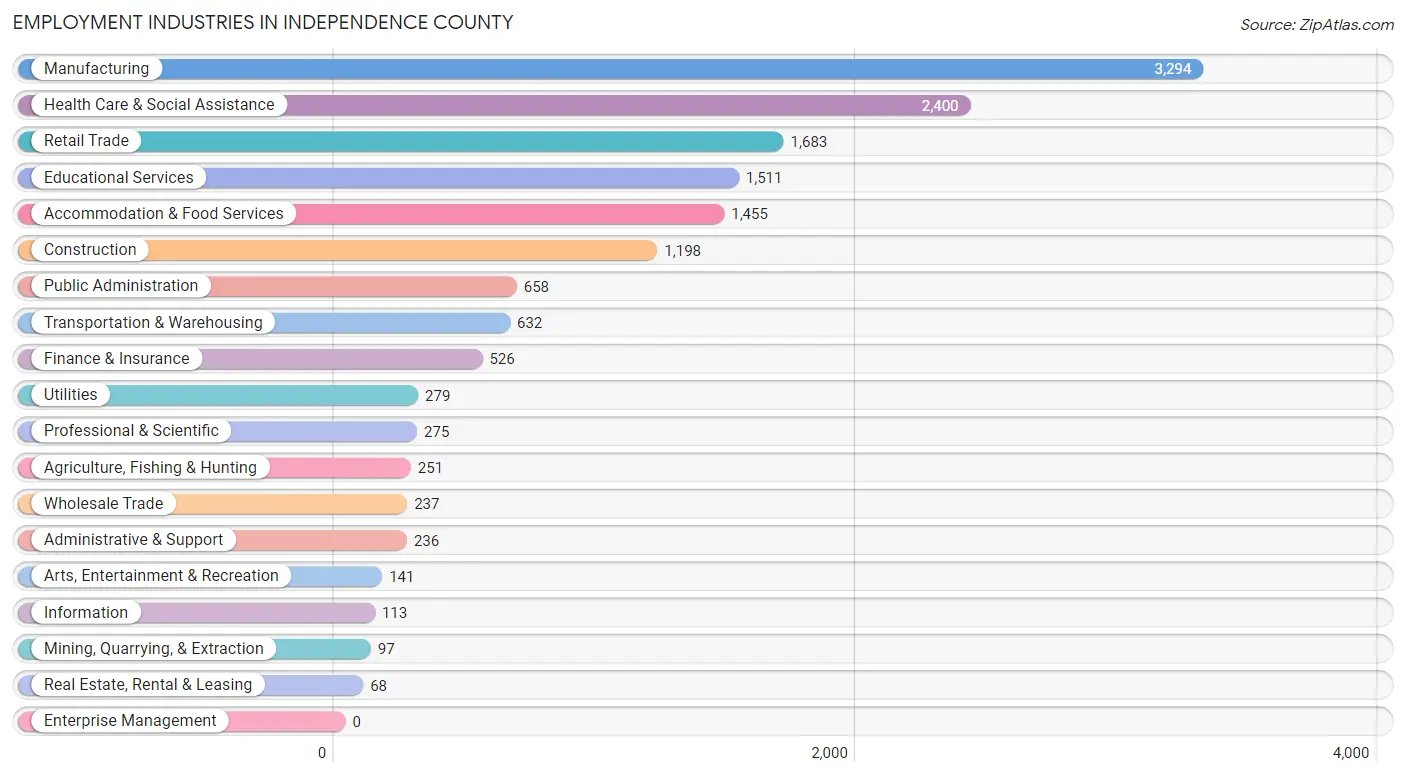
Employment Industries in Independence County
The major employment industries in Independence County include Manufacturing (3,294 | 20.5%), Health Care & Social Assistance (2,400 | 15.0%), Retail Trade (1,683 | 10.5%), Educational Services (1,511 | 9.4%), and Accommodation & Food Services (1,455 | 9.1%).
Employment Industries by Sex in Independence County
The Independence County industries that see more men than women are Mining, Quarrying, & Extraction (100.0%), Agriculture, Fishing & Hunting (96.8%), and Utilities (90.0%), whereas the industries that tend to have a higher number of women are Health Care & Social Assistance (81.8%), Finance & Insurance (81.0%), and Real Estate, Rental & Leasing (70.6%).
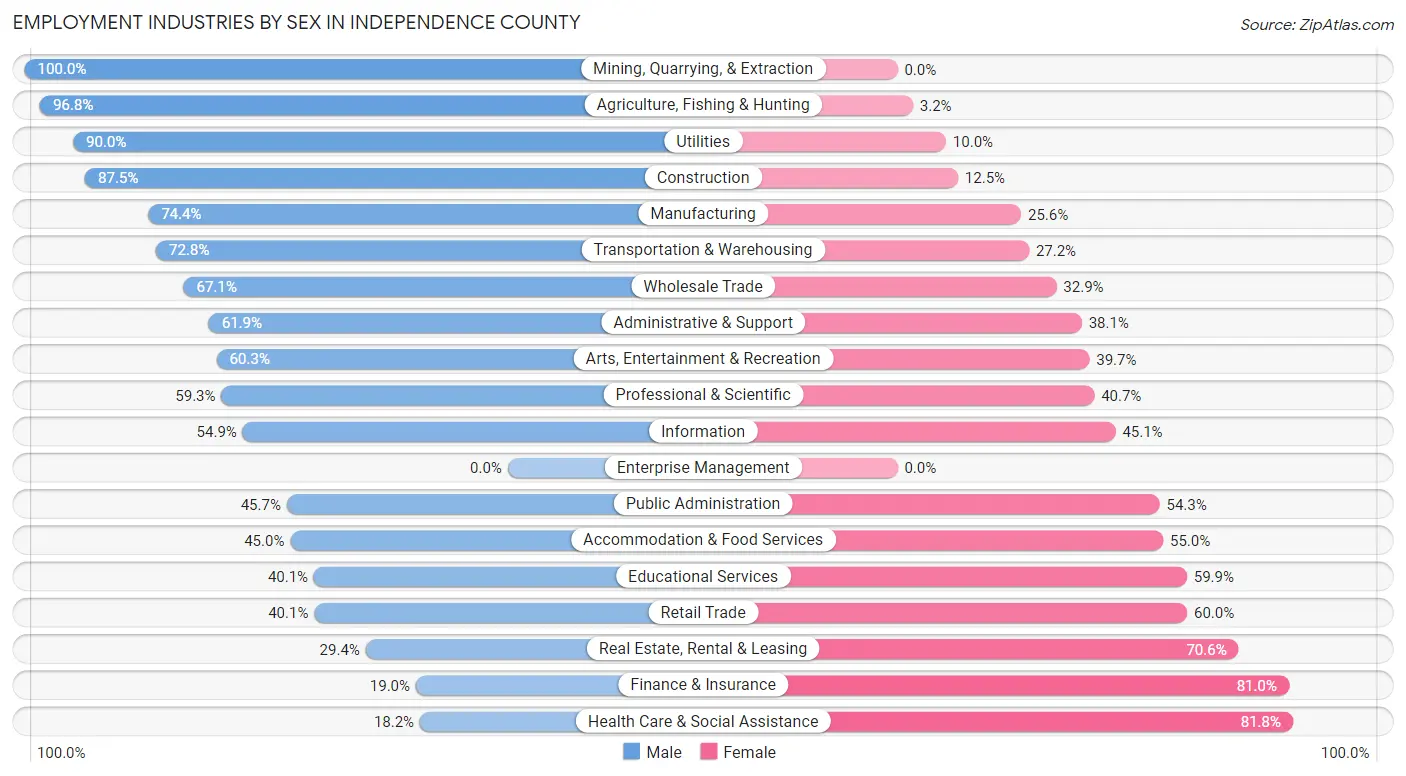
| Industry | Male | Female |
| Agriculture, Fishing & Hunting | 243 (96.8%) | 8 (3.2%) |
| Mining, Quarrying, & Extraction | 97 (100.0%) | 0 (0.0%) |
| Construction | 1,048 (87.5%) | 150 (12.5%) |
| Manufacturing | 2,451 (74.4%) | 843 (25.6%) |
| Wholesale Trade | 159 (67.1%) | 78 (32.9%) |
| Retail Trade | 674 (40.1%) | 1,009 (60.0%) |
| Transportation & Warehousing | 460 (72.8%) | 172 (27.2%) |
| Utilities | 251 (90.0%) | 28 (10.0%) |
| Information | 62 (54.9%) | 51 (45.1%) |
| Finance & Insurance | 100 (19.0%) | 426 (81.0%) |
| Real Estate, Rental & Leasing | 20 (29.4%) | 48 (70.6%) |
| Professional & Scientific | 163 (59.3%) | 112 (40.7%) |
| Enterprise Management | 0 (0.0%) | 0 (0.0%) |
| Administrative & Support | 146 (61.9%) | 90 (38.1%) |
| Educational Services | 606 (40.1%) | 905 (59.9%) |
| Health Care & Social Assistance | 436 (18.2%) | 1,964 (81.8%) |
| Arts, Entertainment & Recreation | 85 (60.3%) | 56 (39.7%) |
| Accommodation & Food Services | 655 (45.0%) | 800 (55.0%) |
| Public Administration | 301 (45.7%) | 357 (54.3%) |
| Total | 8,438 (52.6%) | 7,599 (47.4%) |
Education in Independence County
School Enrollment in Independence County
The most common levels of schooling among the 9,005 students in Independence County are middle school (2,140 | 23.8%), high school (2,019 | 22.4%), and college / undergraduate (1,951 | 21.7%).
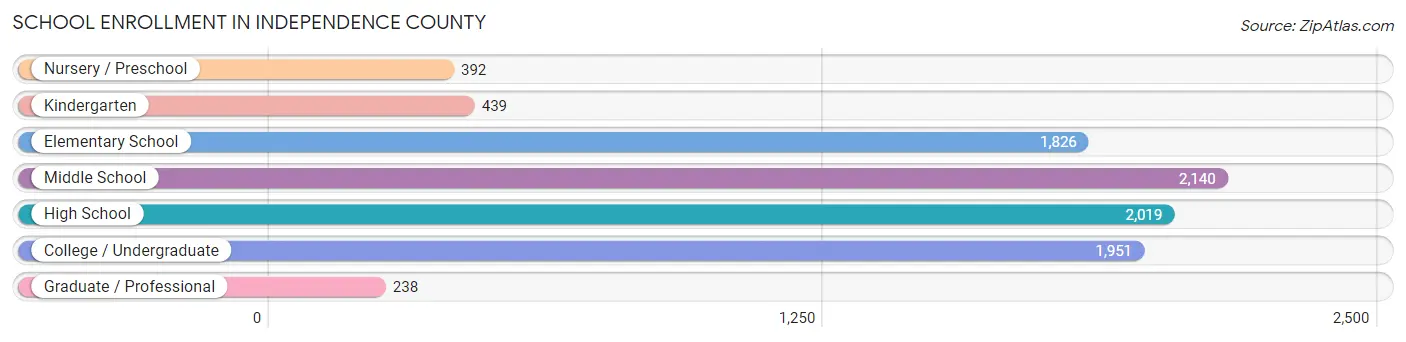
| School Level | # Students | % Students |
| Nursery / Preschool | 392 | 4.3% |
| Kindergarten | 439 | 4.9% |
| Elementary School | 1,826 | 20.3% |
| Middle School | 2,140 | 23.8% |
| High School | 2,019 | 22.4% |
| College / Undergraduate | 1,951 | 21.7% |
| Graduate / Professional | 238 | 2.6% |
| Total | 9,005 | 100.0% |
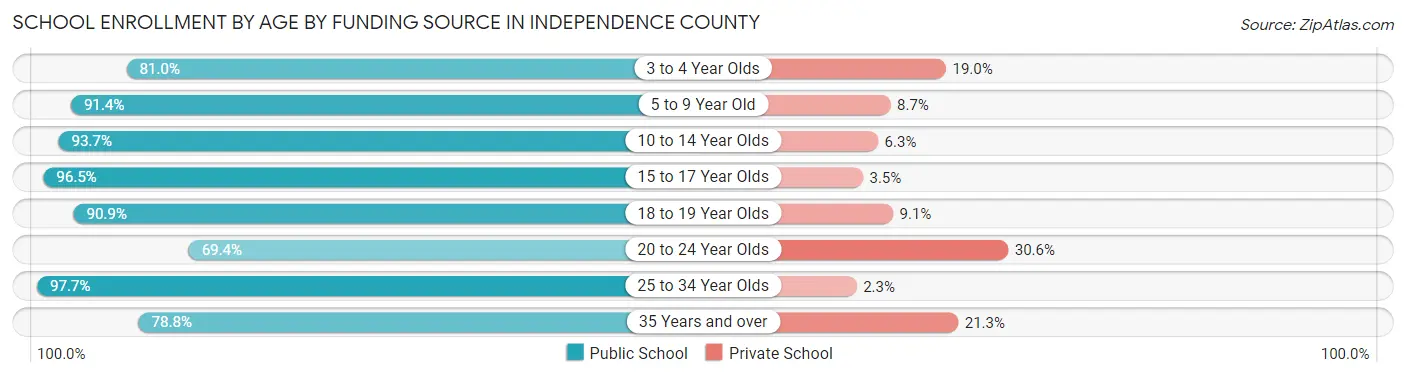
School Enrollment by Age by Funding Source in Independence County
Out of a total of 9,005 students who are enrolled in schools in Independence County, 919 (10.2%) attend a private institution, while the remaining 8,086 (89.8%) are enrolled in public schools. The age group of 20 to 24 year olds has the highest likelihood of being enrolled in private schools, with 310 (30.6% in the age bracket) enrolled. Conversely, the age group of 25 to 34 year olds has the lowest likelihood of being enrolled in a private school, with 335 (97.7% in the age bracket) attending a public institution.
| Age Bracket | Public School | Private School |
| 3 to 4 Year Olds | 239 (81.0%) | 56 (19.0%) |
| 5 to 9 Year Old | 1,774 (91.3%) | 168 (8.6%) |
| 10 to 14 Year Olds | 2,635 (93.7%) | 178 (6.3%) |
| 15 to 17 Year Olds | 1,349 (96.5%) | 49 (3.5%) |
| 18 to 19 Year Olds | 757 (90.9%) | 76 (9.1%) |
| 20 to 24 Year Olds | 704 (69.4%) | 310 (30.6%) |
| 25 to 34 Year Olds | 335 (97.7%) | 8 (2.3%) |
| 35 Years and over | 289 (78.7%) | 78 (21.2%) |
| Total | 8,086 (89.8%) | 919 (10.2%) |
Educational Attainment by Field of Study in Independence County
Education (1,111 | 23.6%), business (734 | 15.6%), arts & humanities (361 | 7.7%), social sciences (338 | 7.2%), and bio, nature & agricultural (330 | 7.0%) are the most common fields of study among 4,703 individuals in Independence County who have obtained a bachelor's degree or higher.
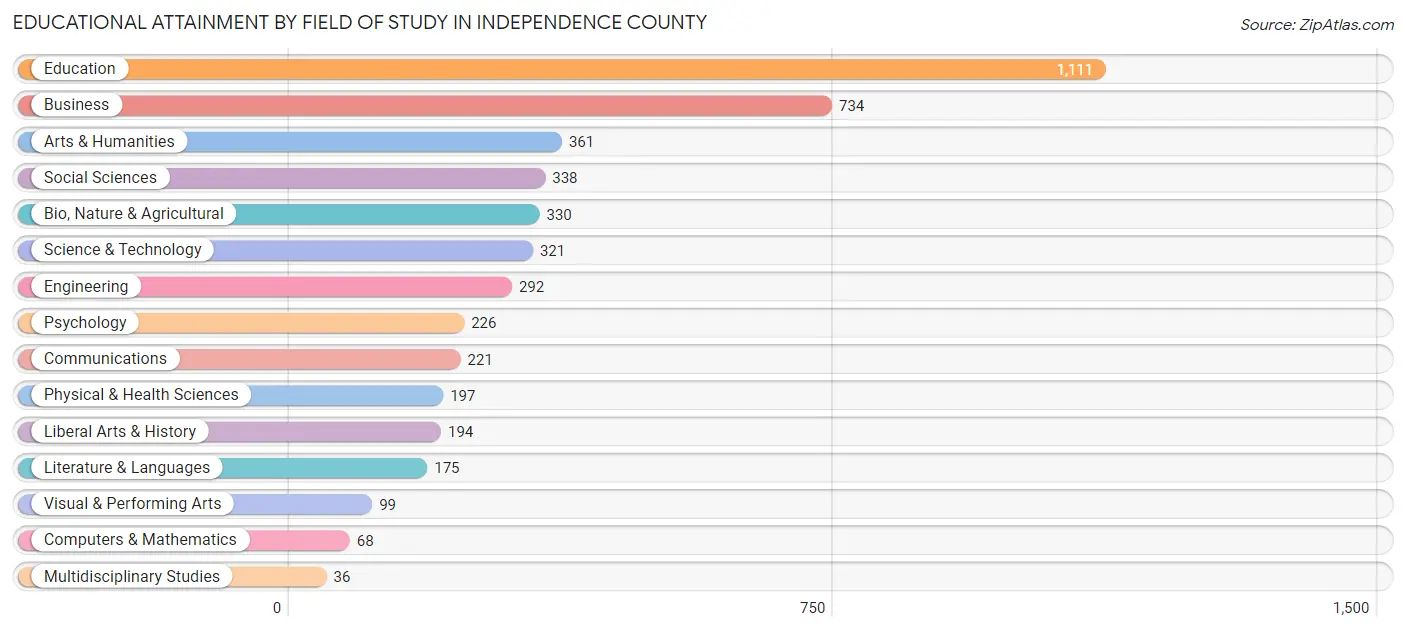
| Field of Study | # Graduates | % Graduates |
| Computers & Mathematics | 68 | 1.5% |
| Bio, Nature & Agricultural | 330 | 7.0% |
| Physical & Health Sciences | 197 | 4.2% |
| Psychology | 226 | 4.8% |
| Social Sciences | 338 | 7.2% |
| Engineering | 292 | 6.2% |
| Multidisciplinary Studies | 36 | 0.8% |
| Science & Technology | 321 | 6.8% |
| Business | 734 | 15.6% |
| Education | 1,111 | 23.6% |
| Literature & Languages | 175 | 3.7% |
| Liberal Arts & History | 194 | 4.1% |
| Visual & Performing Arts | 99 | 2.1% |
| Communications | 221 | 4.7% |
| Arts & Humanities | 361 | 7.7% |
| Total | 4,703 | 100.0% |
Transportation & Commute in Independence County
Vehicle Availability by Sex in Independence County
The most prevalent vehicle ownership categories in Independence County are males with 2 vehicles (3,580, accounting for 43.4%) and females with 2 vehicles (3,031, making up 47.9%).
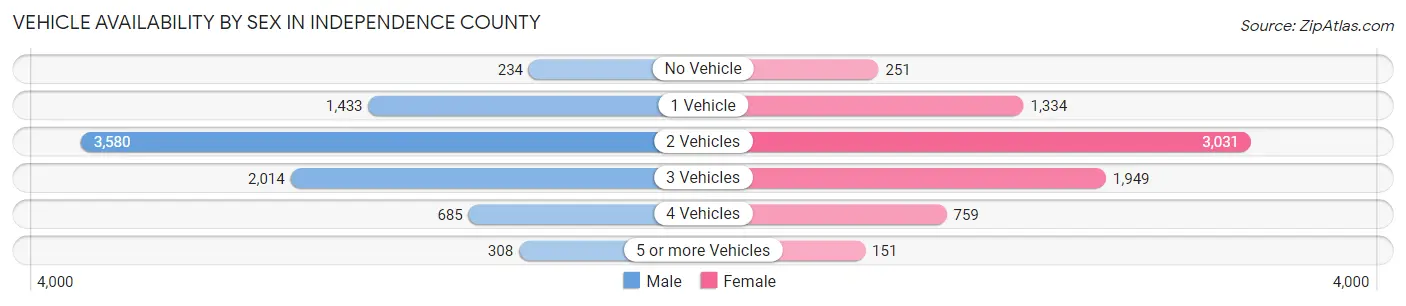
| Vehicles Available | Male | Female |
| No Vehicle | 234 (2.8%) | 251 (3.4%) |
| 1 Vehicle | 1,433 (17.4%) | 1,334 (17.8%) |
| 2 Vehicles | 3,580 (43.4%) | 3,031 (40.6%) |
| 3 Vehicles | 2,014 (24.4%) | 1,949 (26.1%) |
| 4 Vehicles | 685 (8.3%) | 759 (10.2%) |
| 5 or more Vehicles | 308 (3.7%) | 151 (2.0%) |
| Total | 8,254 (100.0%) | 7,475 (100.0%) |
Commute Time in Independence County
The most frequently occuring commute durations in Independence County are 15 to 19 minutes (3,142 commuters, 20.6%), 5 to 9 minutes (2,850 commuters, 18.7%), and 10 to 14 minutes (2,493 commuters, 16.4%).
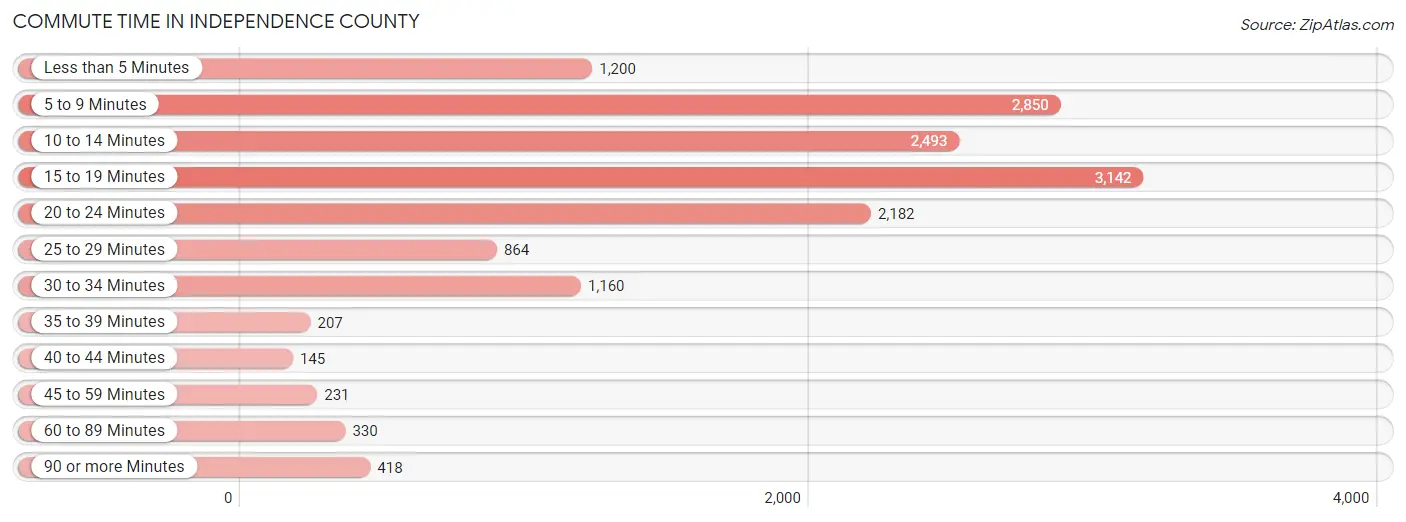
| Commute Time | # Commuters | % Commuters |
| Less than 5 Minutes | 1,200 | 7.9% |
| 5 to 9 Minutes | 2,850 | 18.7% |
| 10 to 14 Minutes | 2,493 | 16.4% |
| 15 to 19 Minutes | 3,142 | 20.6% |
| 20 to 24 Minutes | 2,182 | 14.3% |
| 25 to 29 Minutes | 864 | 5.7% |
| 30 to 34 Minutes | 1,160 | 7.6% |
| 35 to 39 Minutes | 207 | 1.4% |
| 40 to 44 Minutes | 145 | 0.9% |
| 45 to 59 Minutes | 231 | 1.5% |
| 60 to 89 Minutes | 330 | 2.2% |
| 90 or more Minutes | 418 | 2.8% |
Commute Time by Sex in Independence County
The most common commute times in Independence County are 15 to 19 minutes (1,757 commuters, 21.5%) for males and 15 to 19 minutes (1,385 commuters, 19.6%) for females.
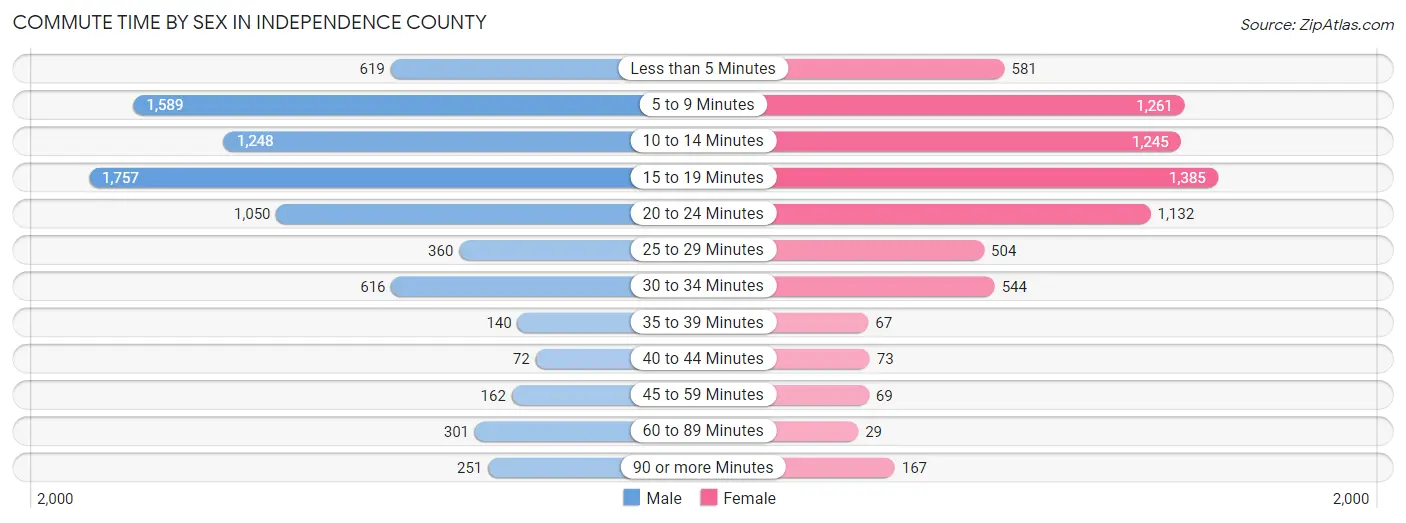
| Commute Time | Male | Female |
| Less than 5 Minutes | 619 (7.6%) | 581 (8.2%) |
| 5 to 9 Minutes | 1,589 (19.5%) | 1,261 (17.9%) |
| 10 to 14 Minutes | 1,248 (15.3%) | 1,245 (17.6%) |
| 15 to 19 Minutes | 1,757 (21.5%) | 1,385 (19.6%) |
| 20 to 24 Minutes | 1,050 (12.9%) | 1,132 (16.0%) |
| 25 to 29 Minutes | 360 (4.4%) | 504 (7.1%) |
| 30 to 34 Minutes | 616 (7.5%) | 544 (7.7%) |
| 35 to 39 Minutes | 140 (1.7%) | 67 (0.9%) |
| 40 to 44 Minutes | 72 (0.9%) | 73 (1.0%) |
| 45 to 59 Minutes | 162 (2.0%) | 69 (1.0%) |
| 60 to 89 Minutes | 301 (3.7%) | 29 (0.4%) |
| 90 or more Minutes | 251 (3.1%) | 167 (2.4%) |
Time of Departure to Work by Sex in Independence County
The most frequent times of departure to work in Independence County are 7:00 AM to 7:29 AM (1,219, 14.9%) for males and 7:30 AM to 7:59 AM (1,681, 23.8%) for females.

| Time of Departure | Male | Female |
| 12:00 AM to 4:59 AM | 860 (10.5%) | 470 (6.7%) |
| 5:00 AM to 5:29 AM | 445 (5.4%) | 267 (3.8%) |
| 5:30 AM to 5:59 AM | 496 (6.1%) | 207 (2.9%) |
| 6:00 AM to 6:29 AM | 1,053 (12.9%) | 516 (7.3%) |
| 6:30 AM to 6:59 AM | 1,034 (12.7%) | 673 (9.5%) |
| 7:00 AM to 7:29 AM | 1,219 (14.9%) | 1,315 (18.6%) |
| 7:30 AM to 7:59 AM | 790 (9.7%) | 1,681 (23.8%) |
| 8:00 AM to 8:29 AM | 444 (5.4%) | 376 (5.3%) |
| 8:30 AM to 8:59 AM | 25 (0.3%) | 219 (3.1%) |
| 9:00 AM to 9:59 AM | 166 (2.0%) | 193 (2.7%) |
| 10:00 AM to 10:59 AM | 143 (1.8%) | 149 (2.1%) |
| 11:00 AM to 11:59 AM | 30 (0.4%) | 139 (2.0%) |
| 12:00 PM to 3:59 PM | 666 (8.2%) | 459 (6.5%) |
| 4:00 PM to 11:59 PM | 794 (9.7%) | 393 (5.6%) |
| Total | 8,165 (100.0%) | 7,057 (100.0%) |
Housing Occupancy in Independence County
Occupancy by Ownership in Independence County
Of the total 14,417 dwellings in Independence County, owner-occupied units account for 10,006 (69.4%), while renter-occupied units make up 4,411 (30.6%).
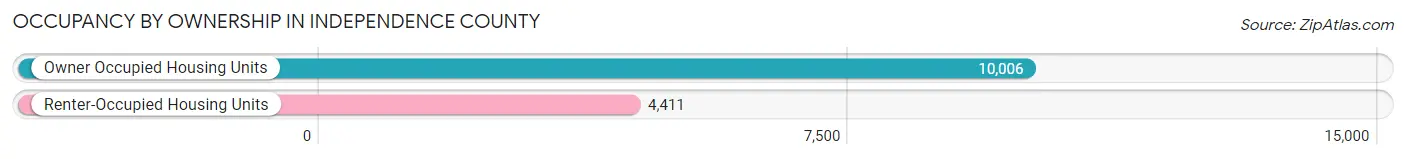
| Occupancy | # Housing Units | % Housing Units |
| Owner Occupied Housing Units | 10,006 | 69.4% |
| Renter-Occupied Housing Units | 4,411 | 30.6% |
| Total Occupied Housing Units | 14,417 | 100.0% |
Occupancy by Household Size in Independence County
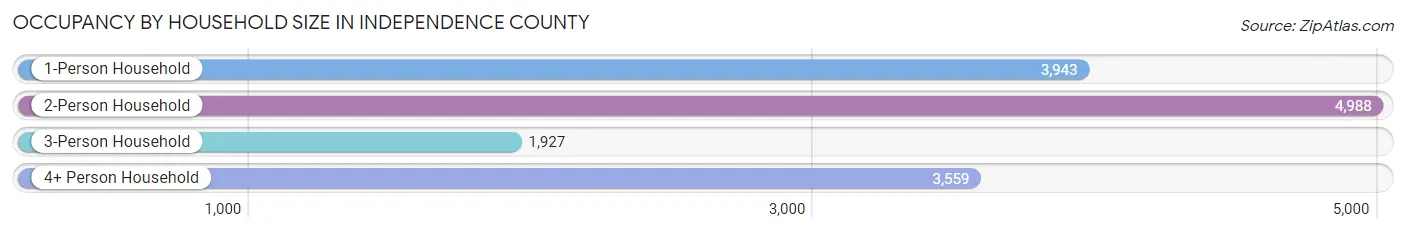
| Household Size | # Housing Units | % Housing Units |
| 1-Person Household | 3,943 | 27.4% |
| 2-Person Household | 4,988 | 34.6% |
| 3-Person Household | 1,927 | 13.4% |
| 4+ Person Household | 3,559 | 24.7% |
| Total Housing Units | 14,417 | 100.0% |
Occupancy by Ownership by Household Size in Independence County
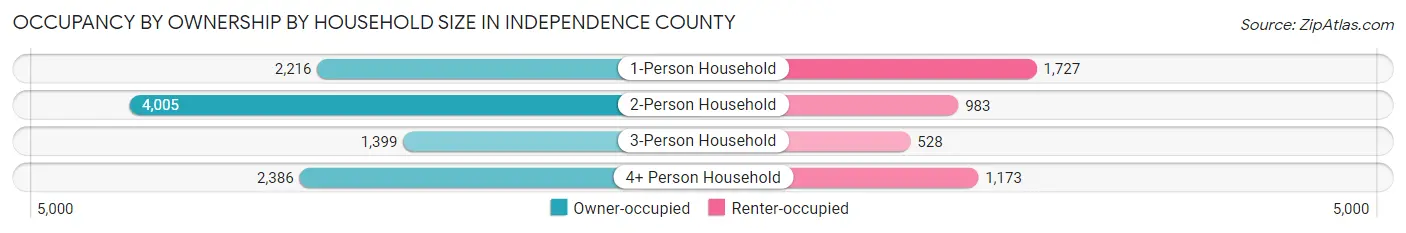
| Household Size | Owner-occupied | Renter-occupied |
| 1-Person Household | 2,216 (56.2%) | 1,727 (43.8%) |
| 2-Person Household | 4,005 (80.3%) | 983 (19.7%) |
| 3-Person Household | 1,399 (72.6%) | 528 (27.4%) |
| 4+ Person Household | 2,386 (67.0%) | 1,173 (33.0%) |
| Total Housing Units | 10,006 (69.4%) | 4,411 (30.6%) |
Occupancy by Educational Attainment in Independence County
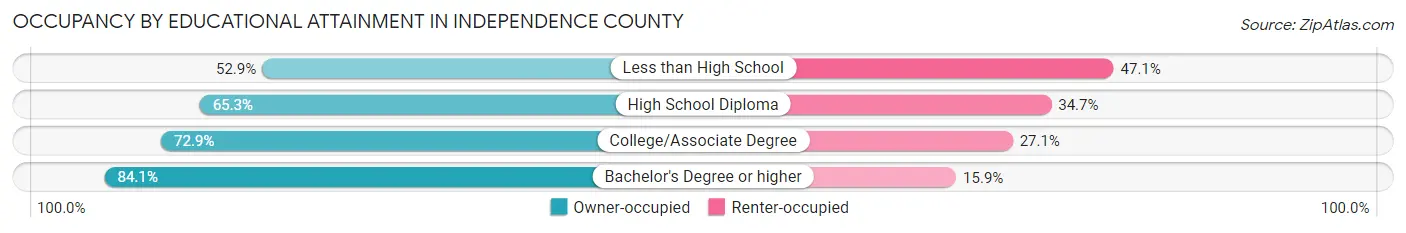
| Household Size | Owner-occupied | Renter-occupied |
| Less than High School | 1,005 (52.9%) | 894 (47.1%) |
| High School Diploma | 3,439 (65.3%) | 1,829 (34.7%) |
| College/Associate Degree | 3,503 (72.9%) | 1,300 (27.1%) |
| Bachelor's Degree or higher | 2,059 (84.1%) | 388 (15.9%) |
Occupancy by Age of Householder in Independence County
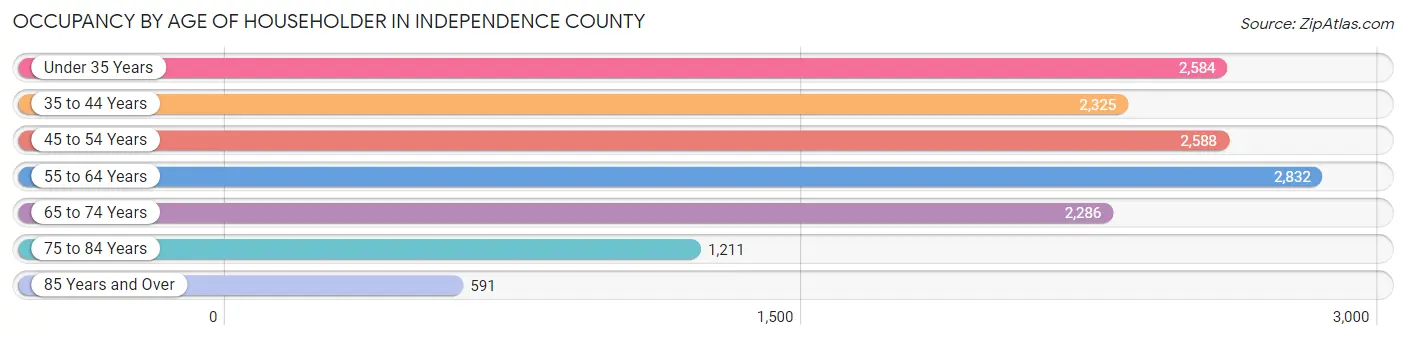
| Age Bracket | # Households | % Households |
| Under 35 Years | 2,584 | 17.9% |
| 35 to 44 Years | 2,325 | 16.1% |
| 45 to 54 Years | 2,588 | 17.9% |
| 55 to 64 Years | 2,832 | 19.6% |
| 65 to 74 Years | 2,286 | 15.9% |
| 75 to 84 Years | 1,211 | 8.4% |
| 85 Years and Over | 591 | 4.1% |
| Total | 14,417 | 100.0% |
Housing Finances in Independence County
Median Income by Occupancy in Independence County
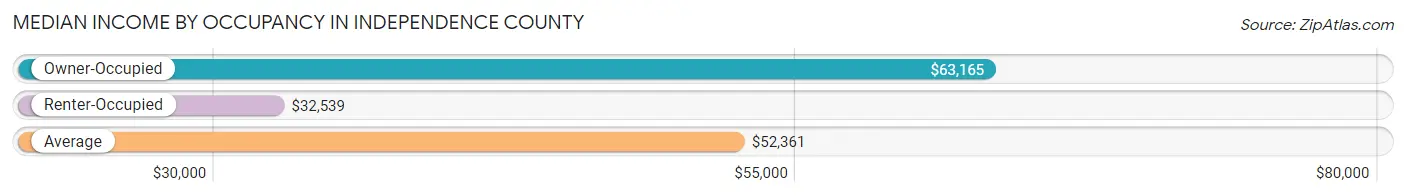
| Occupancy Type | # Households | Median Income |
| Owner-Occupied | 10,006 (69.4%) | $63,165 |
| Renter-Occupied | 4,411 (30.6%) | $32,539 |
| Average | 14,417 (100.0%) | $52,361 |
Occupancy by Householder Income Bracket in Independence County

| Income Bracket | Owner-occupied | Renter-occupied |
| Less than $5,000 | 178 (1.8%) | 261 (5.9%) |
| $5,000 to $9,999 | 205 (2.1%) | 167 (3.8%) |
| $10,000 to $14,999 | 504 (5.0%) | 469 (10.6%) |
| $15,000 to $19,999 | 291 (2.9%) | 649 (14.7%) |
| $20,000 to $24,999 | 356 (3.6%) | 262 (5.9%) |
| $25,000 to $34,999 | 1,175 (11.7%) | 618 (14.0%) |
| $35,000 to $49,999 | 1,061 (10.6%) | 733 (16.6%) |
| $50,000 to $74,999 | 2,159 (21.6%) | 743 (16.8%) |
| $75,000 to $99,999 | 1,429 (14.3%) | 271 (6.1%) |
| $100,000 to $149,999 | 1,560 (15.6%) | 177 (4.0%) |
| $150,000 or more | 1,088 (10.9%) | 61 (1.4%) |
| Total | 10,006 (100.0%) | 4,411 (100.0%) |
Monthly Housing Cost Tiers in Independence County
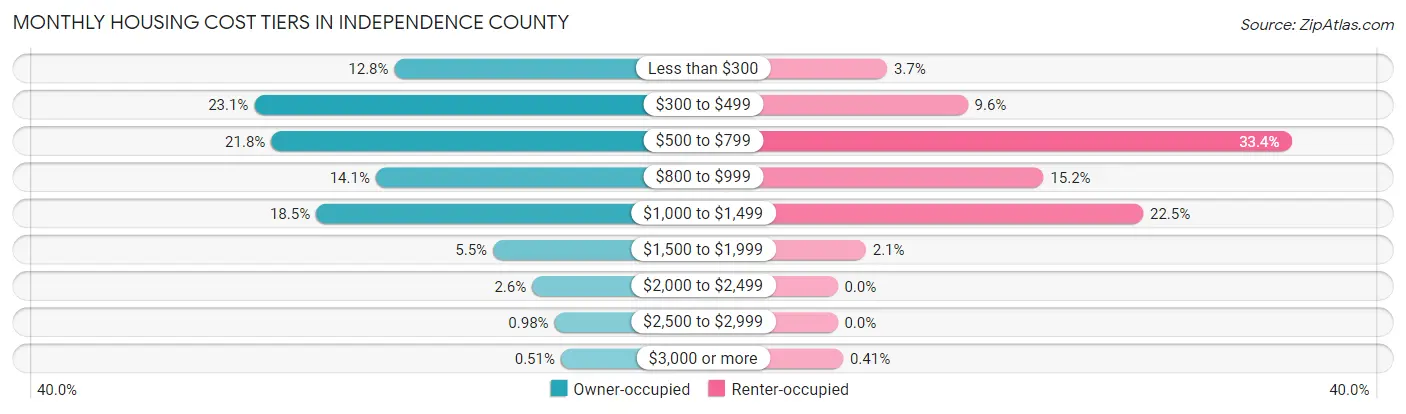
| Monthly Cost | Owner-occupied | Renter-occupied |
| Less than $300 | 1,278 (12.8%) | 161 (3.6%) |
| $300 to $499 | 2,310 (23.1%) | 423 (9.6%) |
| $500 to $799 | 2,185 (21.8%) | 1,474 (33.4%) |
| $800 to $999 | 1,415 (14.1%) | 669 (15.2%) |
| $1,000 to $1,499 | 1,855 (18.5%) | 993 (22.5%) |
| $1,500 to $1,999 | 551 (5.5%) | 92 (2.1%) |
| $2,000 to $2,499 | 263 (2.6%) | 0 (0.0%) |
| $2,500 to $2,999 | 98 (1.0%) | 0 (0.0%) |
| $3,000 or more | 51 (0.5%) | 18 (0.4%) |
| Total | 10,006 (100.0%) | 4,411 (100.0%) |
Physical Housing Characteristics in Independence County
Housing Structures in Independence County
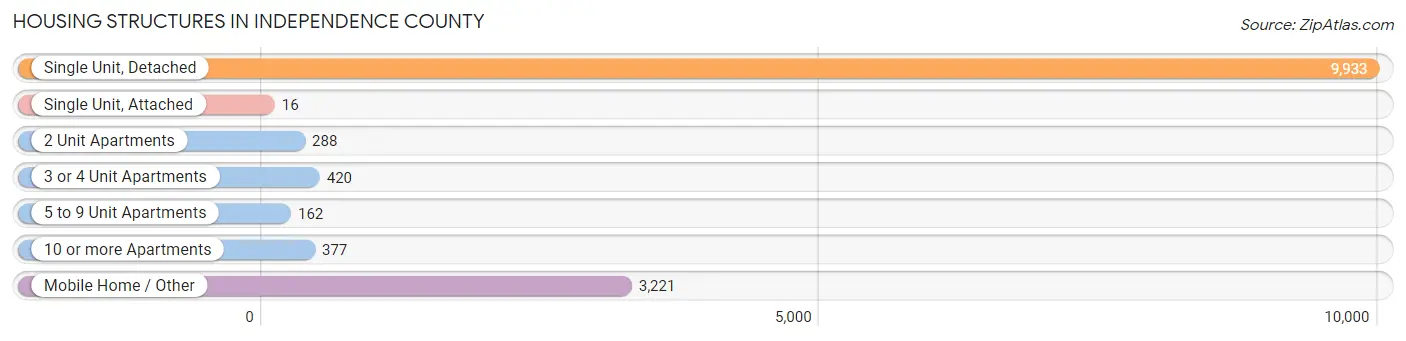
| Structure Type | # Housing Units | % Housing Units |
| Single Unit, Detached | 9,933 | 68.9% |
| Single Unit, Attached | 16 | 0.1% |
| 2 Unit Apartments | 288 | 2.0% |
| 3 or 4 Unit Apartments | 420 | 2.9% |
| 5 to 9 Unit Apartments | 162 | 1.1% |
| 10 or more Apartments | 377 | 2.6% |
| Mobile Home / Other | 3,221 | 22.3% |
| Total | 14,417 | 100.0% |
Housing Structures by Occupancy in Independence County
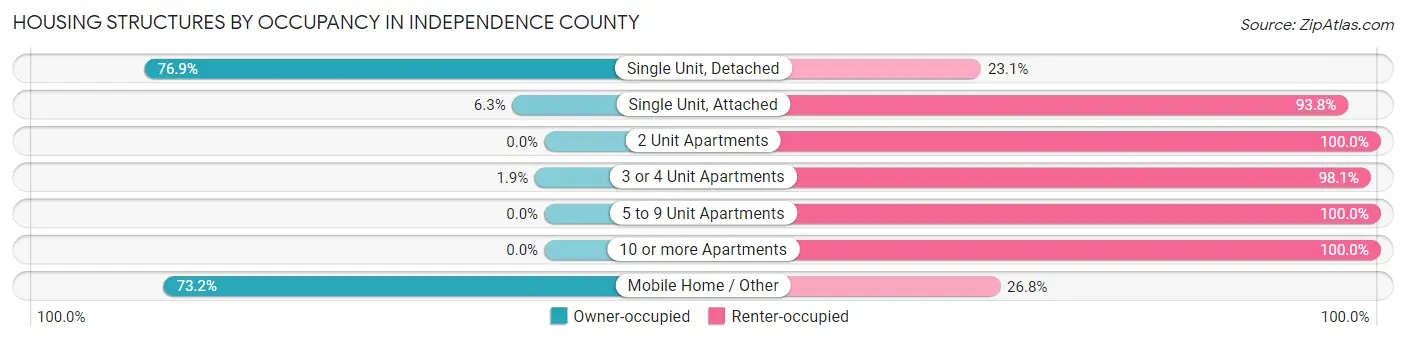
| Structure Type | Owner-occupied | Renter-occupied |
| Single Unit, Detached | 7,638 (76.9%) | 2,295 (23.1%) |
| Single Unit, Attached | 1 (6.2%) | 15 (93.8%) |
| 2 Unit Apartments | 0 (0.0%) | 288 (100.0%) |
| 3 or 4 Unit Apartments | 8 (1.9%) | 412 (98.1%) |
| 5 to 9 Unit Apartments | 0 (0.0%) | 162 (100.0%) |
| 10 or more Apartments | 0 (0.0%) | 377 (100.0%) |
| Mobile Home / Other | 2,359 (73.2%) | 862 (26.8%) |
| Total | 10,006 (69.4%) | 4,411 (30.6%) |
Housing Structures by Number of Rooms in Independence County
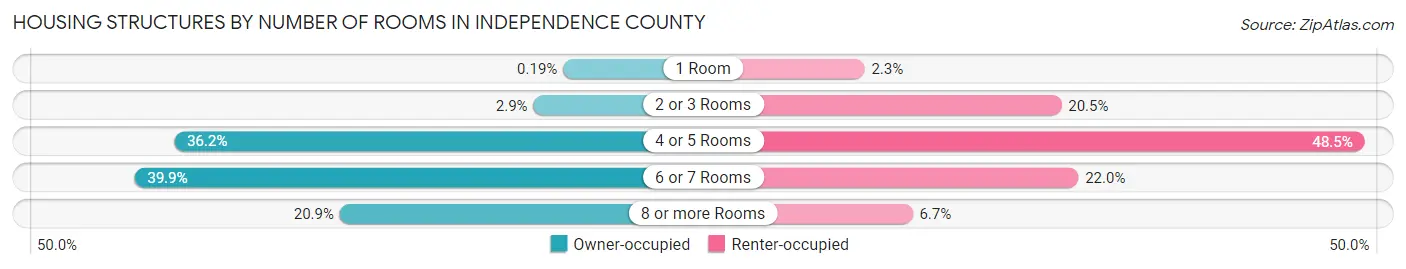
| Number of Rooms | Owner-occupied | Renter-occupied |
| 1 Room | 19 (0.2%) | 100 (2.3%) |
| 2 or 3 Rooms | 294 (2.9%) | 903 (20.5%) |
| 4 or 5 Rooms | 3,620 (36.2%) | 2,140 (48.5%) |
| 6 or 7 Rooms | 3,987 (39.9%) | 972 (22.0%) |
| 8 or more Rooms | 2,086 (20.8%) | 296 (6.7%) |
| Total | 10,006 (100.0%) | 4,411 (100.0%) |
Housing Structure by Heating Type in Independence County
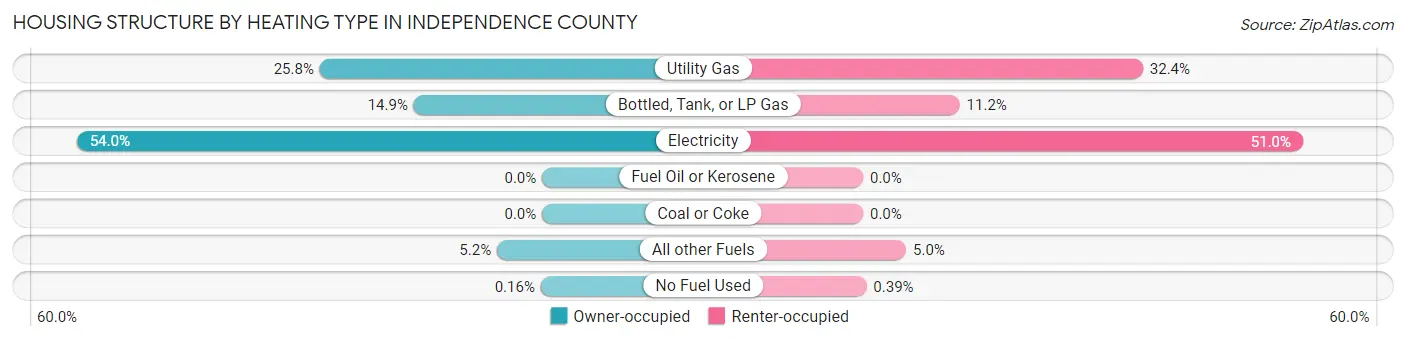
| Heating Type | Owner-occupied | Renter-occupied |
| Utility Gas | 2,580 (25.8%) | 1,431 (32.4%) |
| Bottled, Tank, or LP Gas | 1,489 (14.9%) | 494 (11.2%) |
| Electricity | 5,398 (53.9%) | 2,249 (51.0%) |
| Fuel Oil or Kerosene | 0 (0.0%) | 0 (0.0%) |
| Coal or Coke | 0 (0.0%) | 0 (0.0%) |
| All other Fuels | 523 (5.2%) | 220 (5.0%) |
| No Fuel Used | 16 (0.2%) | 17 (0.4%) |
| Total | 10,006 (100.0%) | 4,411 (100.0%) |
Household Vehicle Usage in Independence County
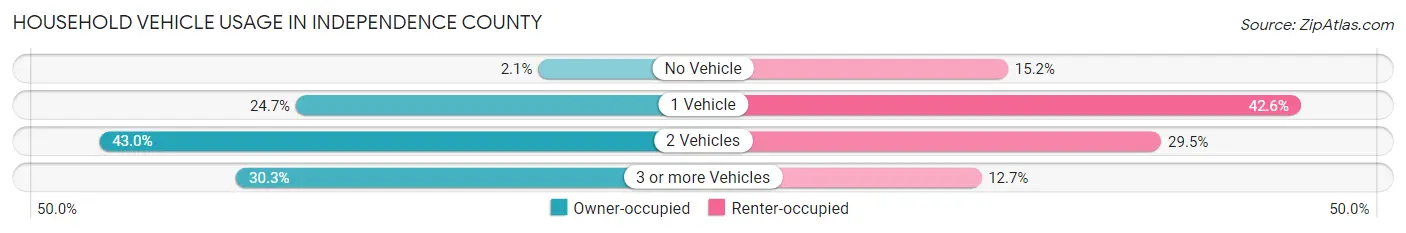
| Vehicles per Household | Owner-occupied | Renter-occupied |
| No Vehicle | 205 (2.1%) | 671 (15.2%) |
| 1 Vehicle | 2,468 (24.7%) | 1,877 (42.5%) |
| 2 Vehicles | 4,306 (43.0%) | 1,302 (29.5%) |
| 3 or more Vehicles | 3,027 (30.2%) | 561 (12.7%) |
| Total | 10,006 (100.0%) | 4,411 (100.0%) |
Real Estate & Mortgages in Independence County
Real Estate and Mortgage Overview in Independence County
| Characteristic | Without Mortgage | With Mortgage |
| Housing Units | 4,686 | 5,320 |
| Median Property Value | $90,300 | $132,700 |
| Median Household Income | $51,095 | $767 |
| Monthly Housing Costs | $382 | $51 |
| Real Estate Taxes | $572 | $519 |
Property Value by Mortgage Status in Independence County
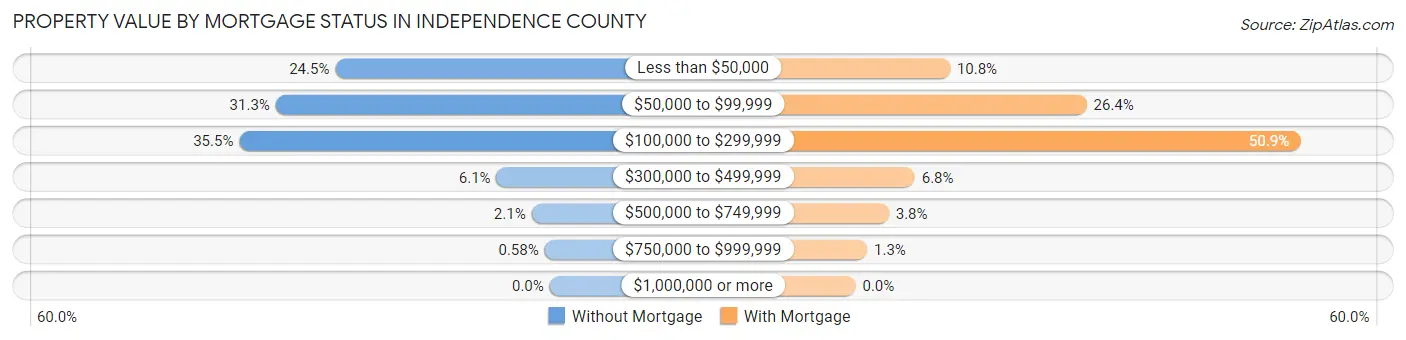
| Property Value | Without Mortgage | With Mortgage |
| Less than $50,000 | 1,148 (24.5%) | 574 (10.8%) |
| $50,000 to $99,999 | 1,467 (31.3%) | 1,405 (26.4%) |
| $100,000 to $299,999 | 1,662 (35.5%) | 2,709 (50.9%) |
| $300,000 to $499,999 | 285 (6.1%) | 360 (6.8%) |
| $500,000 to $749,999 | 97 (2.1%) | 202 (3.8%) |
| $750,000 to $999,999 | 27 (0.6%) | 70 (1.3%) |
| $1,000,000 or more | 0 (0.0%) | 0 (0.0%) |
| Total | 4,686 (100.0%) | 5,320 (100.0%) |
Household Income by Mortgage Status in Independence County
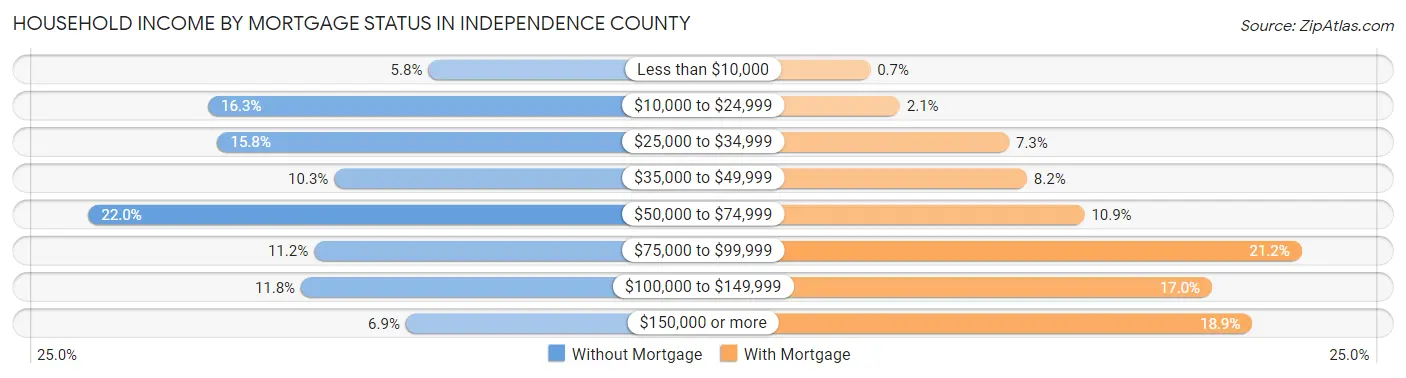
| Household Income | Without Mortgage | With Mortgage |
| Less than $10,000 | 271 (5.8%) | 37 (0.7%) |
| $10,000 to $24,999 | 762 (16.3%) | 112 (2.1%) |
| $25,000 to $34,999 | 741 (15.8%) | 389 (7.3%) |
| $35,000 to $49,999 | 481 (10.3%) | 434 (8.2%) |
| $50,000 to $74,999 | 1,029 (22.0%) | 580 (10.9%) |
| $75,000 to $99,999 | 526 (11.2%) | 1,130 (21.2%) |
| $100,000 to $149,999 | 555 (11.8%) | 903 (17.0%) |
| $150,000 or more | 321 (6.9%) | 1,005 (18.9%) |
| Total | 4,686 (100.0%) | 5,320 (100.0%) |
Property Value to Household Income Ratio in Independence County
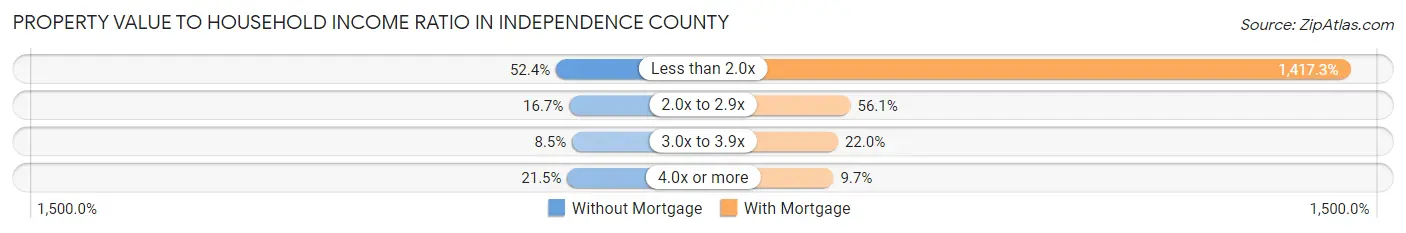
| Value-to-Income Ratio | Without Mortgage | With Mortgage |
| Less than 2.0x | 2,457 (52.4%) | 75,399 (1,417.3%) |
| 2.0x to 2.9x | 780 (16.7%) | 2,985 (56.1%) |
| 3.0x to 3.9x | 396 (8.5%) | 1,171 (22.0%) |
| 4.0x or more | 1,006 (21.5%) | 516 (9.7%) |
| Total | 4,686 (100.0%) | 5,320 (100.0%) |
Real Estate Taxes by Mortgage Status in Independence County
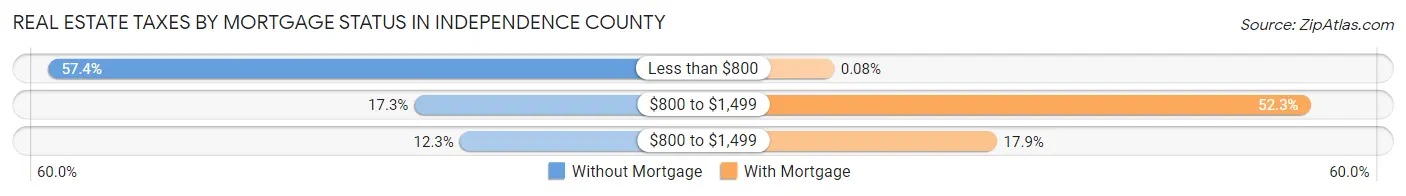
| Property Taxes | Without Mortgage | With Mortgage |
| Less than $800 | 2,689 (57.4%) | 4 (0.1%) |
| $800 to $1,499 | 811 (17.3%) | 2,783 (52.3%) |
| $800 to $1,499 | 578 (12.3%) | 954 (17.9%) |
| Total | 4,686 (100.0%) | 5,320 (100.0%) |
Health & Disability in Independence County
Health Insurance Coverage by Age in Independence County
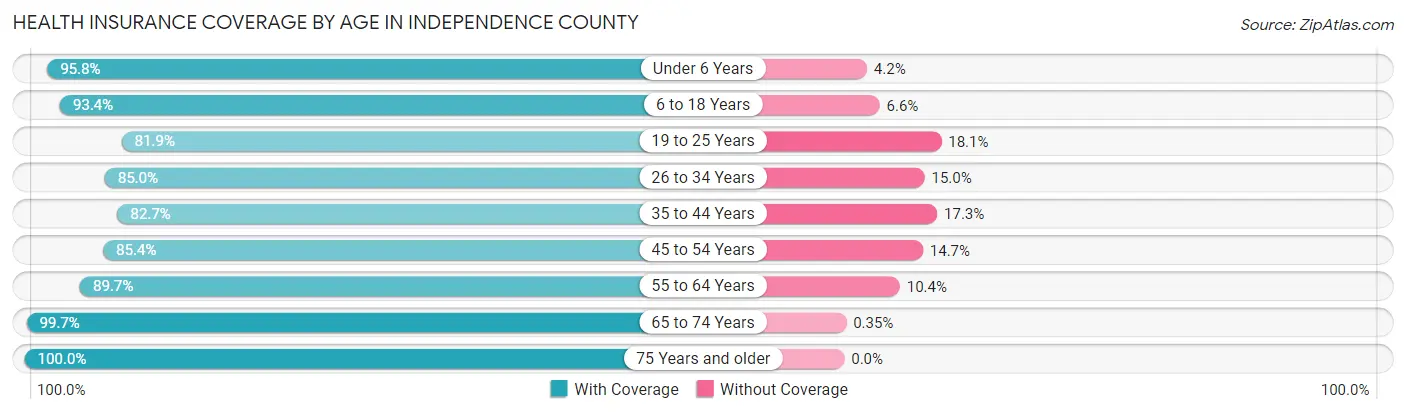
| Age Bracket | With Coverage | Without Coverage |
| Under 6 Years | 2,792 (95.8%) | 123 (4.2%) |
| 6 to 18 Years | 6,233 (93.4%) | 439 (6.6%) |
| 19 to 25 Years | 2,894 (81.9%) | 639 (18.1%) |
| 26 to 34 Years | 3,024 (85.0%) | 532 (15.0%) |
| 35 to 44 Years | 3,892 (82.7%) | 815 (17.3%) |
| 45 to 54 Years | 3,992 (85.4%) | 685 (14.6%) |
| 55 to 64 Years | 4,532 (89.6%) | 523 (10.3%) |
| 65 to 74 Years | 3,698 (99.7%) | 13 (0.4%) |
| 75 Years and older | 2,547 (100.0%) | 0 (0.0%) |
| Total | 33,604 (89.9%) | 3,769 (10.1%) |
Health Insurance Coverage by Citizenship Status in Independence County
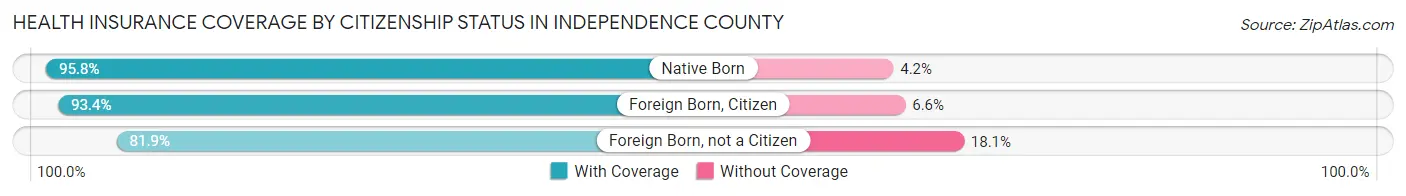
| Citizenship Status | With Coverage | Without Coverage |
| Native Born | 2,792 (95.8%) | 123 (4.2%) |
| Foreign Born, Citizen | 6,233 (93.4%) | 439 (6.6%) |
| Foreign Born, not a Citizen | 2,894 (81.9%) | 639 (18.1%) |
Health Insurance Coverage by Household Income in Independence County
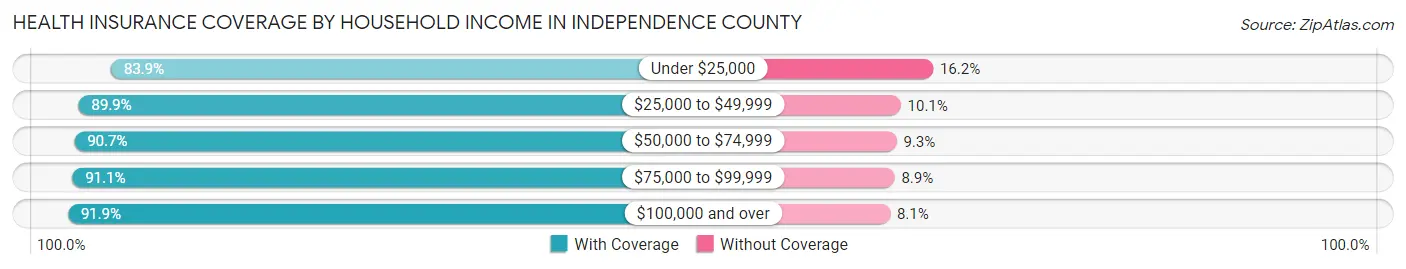
| Household Income | With Coverage | Without Coverage |
| Under $25,000 | 4,939 (83.9%) | 951 (16.2%) |
| $25,000 to $49,999 | 7,719 (89.9%) | 865 (10.1%) |
| $50,000 to $74,999 | 7,084 (90.7%) | 726 (9.3%) |
| $75,000 to $99,999 | 4,843 (91.1%) | 475 (8.9%) |
| $100,000 and over | 8,489 (91.9%) | 747 (8.1%) |
Public vs Private Health Insurance Coverage by Age in Independence County
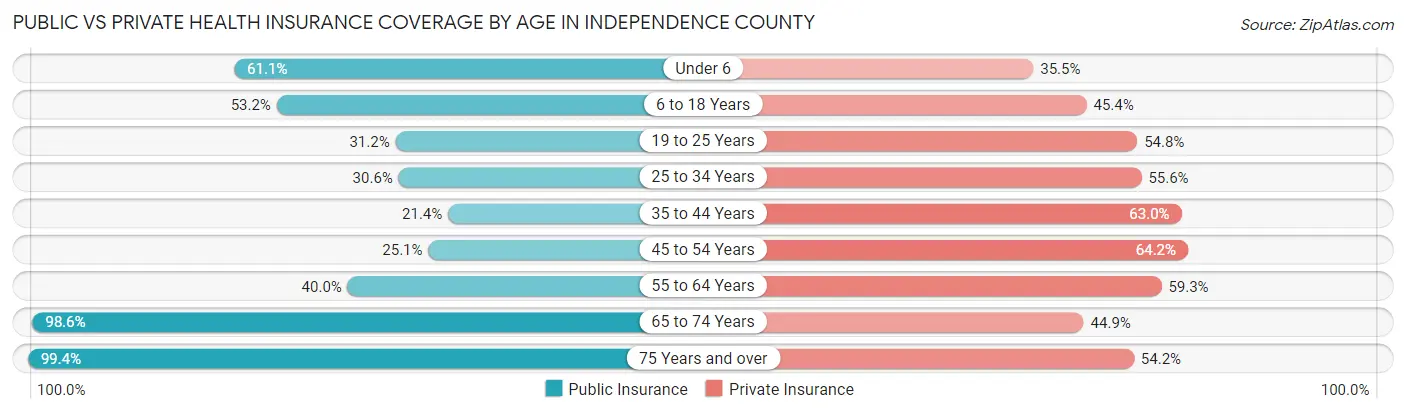
| Age Bracket | Public Insurance | Private Insurance |
| Under 6 | 1,781 (61.1%) | 1,036 (35.5%) |
| 6 to 18 Years | 3,550 (53.2%) | 3,031 (45.4%) |
| 19 to 25 Years | 1,101 (31.2%) | 1,937 (54.8%) |
| 25 to 34 Years | 1,087 (30.6%) | 1,978 (55.6%) |
| 35 to 44 Years | 1,007 (21.4%) | 2,967 (63.0%) |
| 45 to 54 Years | 1,172 (25.1%) | 3,004 (64.2%) |
| 55 to 64 Years | 2,024 (40.0%) | 2,999 (59.3%) |
| 65 to 74 Years | 3,658 (98.6%) | 1,666 (44.9%) |
| 75 Years and over | 2,532 (99.4%) | 1,381 (54.2%) |
| Total | 17,912 (47.9%) | 19,999 (53.5%) |
Disability Status by Sex by Age in Independence County
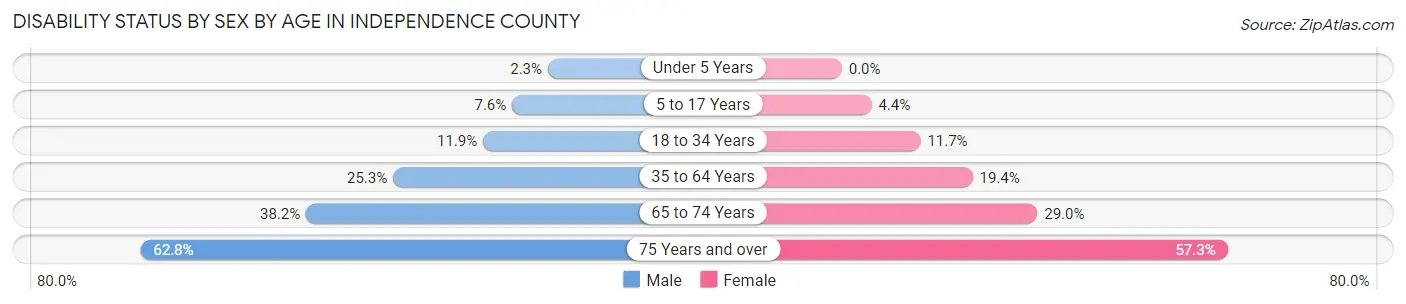
| Age Bracket | Male | Female |
| Under 5 Years | 30 (2.3%) | 0 (0.0%) |
| 5 to 17 Years | 253 (7.6%) | 145 (4.4%) |
| 18 to 34 Years | 470 (11.9%) | 436 (11.7%) |
| 35 to 64 Years | 1,840 (25.3%) | 1,390 (19.4%) |
| 65 to 74 Years | 690 (38.2%) | 553 (29.0%) |
| 75 Years and over | 662 (62.8%) | 855 (57.3%) |
Disability Class by Sex by Age in Independence County
Disability Class: Hearing Difficulty
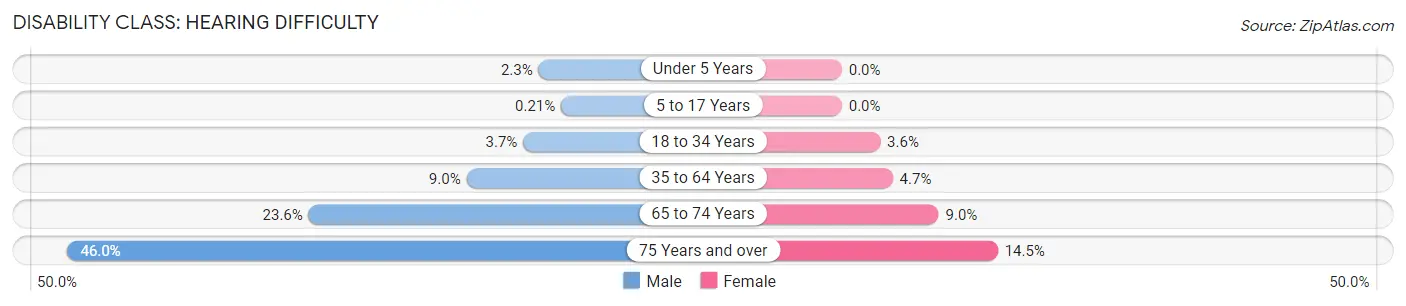
| Age Bracket | Male | Female |
| Under 5 Years | 30 (2.3%) | 0 (0.0%) |
| 5 to 17 Years | 7 (0.2%) | 0 (0.0%) |
| 18 to 34 Years | 147 (3.7%) | 133 (3.6%) |
| 35 to 64 Years | 654 (9.0%) | 338 (4.7%) |
| 65 to 74 Years | 427 (23.6%) | 171 (9.0%) |
| 75 Years and over | 485 (46.0%) | 216 (14.5%) |
Disability Class: Vision Difficulty
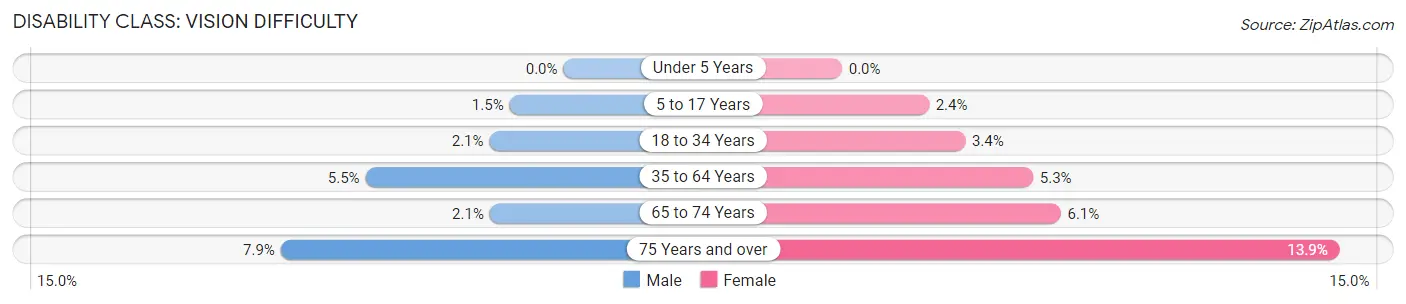
| Age Bracket | Male | Female |
| Under 5 Years | 0 (0.0%) | 0 (0.0%) |
| 5 to 17 Years | 50 (1.5%) | 80 (2.4%) |
| 18 to 34 Years | 81 (2.1%) | 128 (3.4%) |
| 35 to 64 Years | 401 (5.5%) | 381 (5.3%) |
| 65 to 74 Years | 37 (2.1%) | 116 (6.1%) |
| 75 Years and over | 83 (7.9%) | 207 (13.9%) |
Disability Class: Cognitive Difficulty
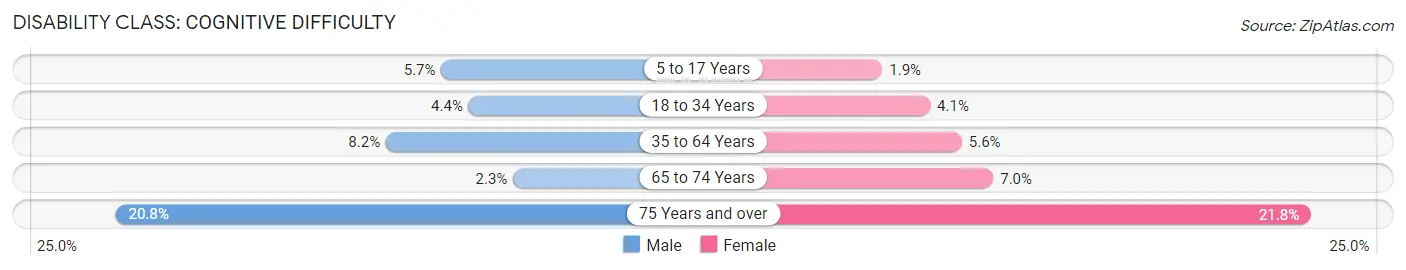
| Age Bracket | Male | Female |
| 5 to 17 Years | 188 (5.7%) | 62 (1.9%) |
| 18 to 34 Years | 173 (4.4%) | 153 (4.1%) |
| 35 to 64 Years | 599 (8.2%) | 399 (5.6%) |
| 65 to 74 Years | 42 (2.3%) | 134 (7.0%) |
| 75 Years and over | 219 (20.8%) | 325 (21.8%) |
Disability Class: Ambulatory Difficulty
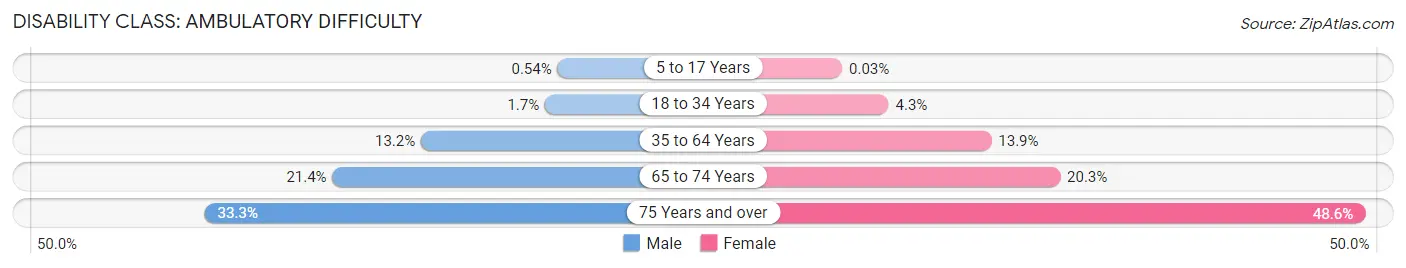
| Age Bracket | Male | Female |
| 5 to 17 Years | 18 (0.5%) | 1 (0.0%) |
| 18 to 34 Years | 67 (1.7%) | 162 (4.3%) |
| 35 to 64 Years | 961 (13.2%) | 994 (13.9%) |
| 65 to 74 Years | 387 (21.4%) | 386 (20.3%) |
| 75 Years and over | 351 (33.3%) | 725 (48.6%) |
Disability Class: Self-Care Difficulty
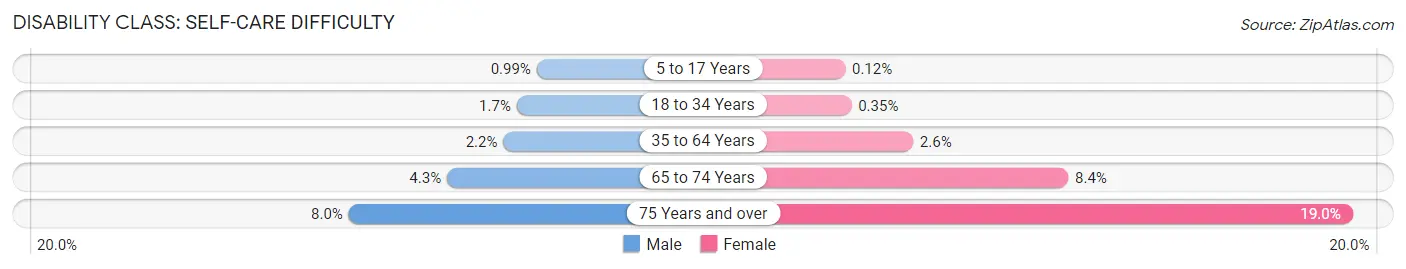
| Age Bracket | Male | Female |
| 5 to 17 Years | 33 (1.0%) | 4 (0.1%) |
| 18 to 34 Years | 68 (1.7%) | 13 (0.4%) |
| 35 to 64 Years | 162 (2.2%) | 189 (2.6%) |
| 65 to 74 Years | 78 (4.3%) | 160 (8.4%) |
| 75 Years and over | 84 (8.0%) | 283 (19.0%) |
Technology Access in Independence County
Computing Device Access in Independence County
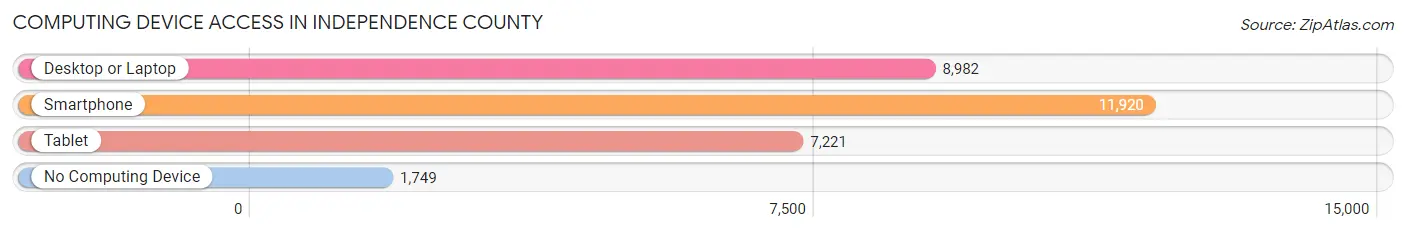
| Device Type | # Households | % Households |
| Desktop or Laptop | 8,982 | 62.3% |
| Smartphone | 11,920 | 82.7% |
| Tablet | 7,221 | 50.1% |
| No Computing Device | 1,749 | 12.1% |
| Total | 14,417 | 100.0% |
Internet Access in Independence County
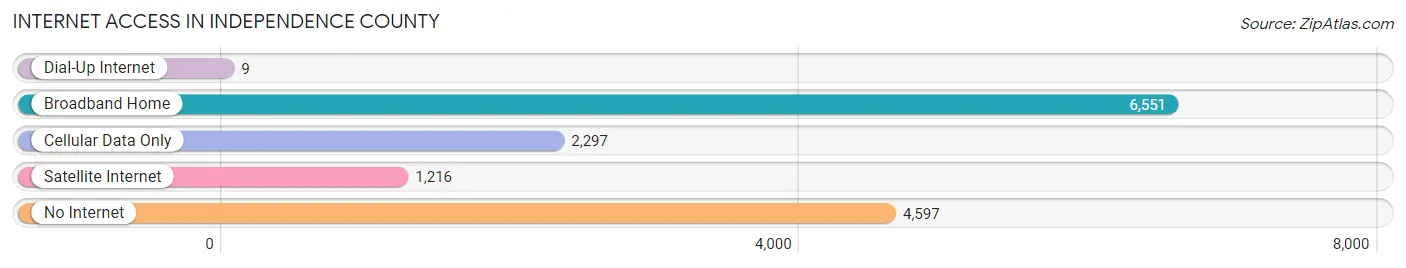
| Internet Type | # Households | % Households |
| Dial-Up Internet | 9 | 0.1% |
| Broadband Home | 6,551 | 45.4% |
| Cellular Data Only | 2,297 | 15.9% |
| Satellite Internet | 1,216 | 8.4% |
| No Internet | 4,597 | 31.9% |
| Total | 14,417 | 100.0% |
Independence County Summary
Independence County, Arkansas is located in the northeast corner of the state and is part of the Arkansas Delta region. It is bordered by White County to the north, Jackson County to the east, Woodruff County to the south, and Sharp and Lawrence Counties to the west. The county seat is Batesville, which is also the largest city in the county.
Geography
Independence County covers an area of 645 square miles and is mostly flat with some rolling hills. The terrain is mostly covered in farmland, with some wooded areas. The White River runs through the county, and there are several small creeks and streams. The county is located in the Mississippi Alluvial Plain, which is a flat, fertile region of the state.
The climate of Independence County is humid subtropical, with hot, humid summers and mild winters. The average annual temperature is around 64°F, and the average annual precipitation is around 48 inches.
Demographics
As of the 2010 census, Independence County had a population of 36,647. The population is mostly white (86.3%), with small percentages of African American (10.3%), Hispanic (2.2%), and other races (1.2%). The median household income is $37,845, and the median age is 40.
Economy
The economy of Independence County is largely based on agriculture. The county is home to several large farms, and the main crops grown are soybeans, cotton, corn, and wheat. The county also has a thriving timber industry, and there are several sawmills and wood-processing plants in the area.
In addition to agriculture, Independence County has a growing manufacturing sector. The county is home to several factories that produce automotive parts, furniture, and other products. The county also has a thriving tourism industry, with several popular attractions, such as the White River National Wildlife Refuge and the Ozark National Forest.
Conclusion
Independence County, Arkansas is a rural county located in the northeast corner of the state. It is mostly flat with some rolling hills, and the terrain is mostly covered in farmland. The population is mostly white, and the economy is largely based on agriculture. The county also has a growing manufacturing sector and a thriving tourism industry.
Common Questions
What is the Total Population of Independence County?
Total Population of Independence County is 37,910.
What is the Total Male Population of Independence County?
Total Male Population of Independence County is 18,947.
What is the Total Female Population of Independence County?
Total Female Population of Independence County is 18,963.
What is the Ratio of Males per 100 Females in Independence County?
There are 99.92 Males per 100 Females in Independence County.
What is the Ratio of Females per 100 Males in Independence County?
There are 100.08 Females per 100 Males in Independence County.
What is the Median Population Age in Independence County?
Median Population Age in Independence County is 39.1 Years.
What is the Average Family Size in Independence County
Average Family Size in Independence County is 3.1 People.
What is the Average Household Size in Independence County
Average Household Size in Independence County is 2.6 People.
What is Per Capita Income in Independence County?
Per Capita income in Independence County is $27,867.
What is the Median Family Income in Independence County?
Median Family Income in Independence County is $62,620.
What is the Median Household income in Independence County?
Median Household Income in Independence County is $52,361.
What is Income or Wage Gap in Independence County?
Income or Wage Gap in Independence County is 19.0%.
Women in Independence County earn 81.0 cents for every dollar earned by a man.
What is Family Income Deficit in Independence County?
Family Income Deficit in Independence County is $9,910.
Families that are below poverty line in Independence County earn $9,910 less on average than the poverty threshold level.
What is Inequality or Gini Index in Independence County?
Inequality or Gini Index in Independence County is 0.48.
How Large is the Labor Force in Independence County?
There are 16,962 People in the Labor Forcein in Independence County.
What is the Percentage of People in the Labor Force in Independence County?
56.7% of People are in the Labor Force in Independence County.
What is the Unemployment Rate in Independence County?
Unemployment Rate in Independence County is 5.2%.