Howard County, AR
Howard County Map
Howard County Overview
12,779
TOTAL POPULATION
6,099
MALE POPULATION
6,680
FEMALE POPULATION
91.30
MALES / 100 FEMALES
109.53
FEMALES / 100 MALES
39.7
MEDIAN AGE
3.0
AVG FAMILY SIZE
2.4
AVG HOUSEHOLD SIZE
$25,458
PER CAPITA INCOME
$56,071
AVG FAMILY INCOME
$44,824
AVG HOUSEHOLD INCOME
17.7%
WAGE / INCOME GAP [ % ]
82.3¢/ $1
WAGE / INCOME GAP [ $ ]
$10,176
FAMILY INCOME DEFICIT
0.45
INEQUALITY / GINI INDEX
5,700
LABOR FORCE [ PEOPLE ]
57.5%
PERCENT IN LABOR FORCE
6.4%
UNEMPLOYMENT RATE
Howard County Area Codes
Race in Howard County
The most populous races in Howard County are White / Caucasian (8,227 | 64.4%), Black / African American (2,770 | 21.7%), and Hispanic or Latino (1,708 | 13.4%).

| Race | # Population | % Population |
| Asian | 104 | 0.8% |
| Black / African American | 2,770 | 21.7% |
| Hawaiian / Pacific | 27 | 0.2% |
| Hispanic or Latino | 1,708 | 13.4% |
| Native / Alaskan | 27 | 0.2% |
| White / Caucasian | 8,227 | 64.4% |
| Two or more Races | 322 | 2.5% |
| Some other Race | 1,302 | 10.2% |
| Total | 12,779 | 100.0% |
Ancestry in Howard County
The most populous ancestries reported in Howard County are Mexican (1,569 | 12.3%), English (1,018 | 8.0%), Irish (985 | 7.7%), German (889 | 7.0%), and American (763 | 6.0%), together accounting for 40.9% of all Howard County residents.

| Ancestry | # Population | % Population |
| African | 89 | 0.7% |
| American | 763 | 6.0% |
| Armenian | 2 | 0.0% |
| Bhutanese | 11 | 0.1% |
| British | 50 | 0.4% |
| Bulgarian | 13 | 0.1% |
| Central American | 130 | 1.0% |
| Cherokee | 51 | 0.4% |
| Cheyenne | 2 | 0.0% |
| Choctaw | 8 | 0.1% |
| Colombian | 9 | 0.1% |
| Creek | 5 | 0.0% |
| Czech | 32 | 0.3% |
| Dutch | 57 | 0.4% |
| English | 1,018 | 8.0% |
| European | 92 | 0.7% |
| Fijian | 27 | 0.2% |
| French | 66 | 0.5% |
| French Canadian | 1 | 0.0% |
| German | 889 | 7.0% |
| Honduran | 114 | 0.9% |
| Indian (Asian) | 84 | 0.7% |
| Irish | 985 | 7.7% |
| Italian | 47 | 0.4% |
| Korean | 20 | 0.2% |
| Mexican | 1,569 | 12.3% |
| Nigerian | 9 | 0.1% |
| Norwegian | 59 | 0.5% |
| Polish | 44 | 0.3% |
| Russian | 10 | 0.1% |
| Salvadoran | 16 | 0.1% |
| Scandinavian | 16 | 0.1% |
| Scotch-Irish | 12 | 0.1% |
| Scottish | 183 | 1.4% |
| Sierra Leonean | 9 | 0.1% |
| South American | 9 | 0.1% |
| Subsaharan African | 98 | 0.8% |
| Swedish | 57 | 0.4% |
| Swiss | 286 | 2.2% |
| Ukrainian | 9 | 0.1% |
| Welsh | 11 | 0.1% | View All 41 Rows |
Immigrants in Howard County
The most numerous immigrant groups reported in Howard County came from Latin America (998 | 7.8%), Central America (989 | 7.7%), Mexico (923 | 7.2%), Asia (84 | 0.7%), and China (84 | 0.7%), together accounting for 24.1% of all Howard County residents.

| Immigration Origin | # Population | % Population |
| Africa | 14 | 0.1% |
| Asia | 84 | 0.7% |
| Australia | 11 | 0.1% |
| Central America | 989 | 7.7% |
| China | 84 | 0.7% |
| Colombia | 9 | 0.1% |
| Eastern Asia | 84 | 0.7% |
| El Salvador | 16 | 0.1% |
| Europe | 64 | 0.5% |
| Germany | 64 | 0.5% |
| Honduras | 50 | 0.4% |
| Hong Kong | 27 | 0.2% |
| Latin America | 998 | 7.8% |
| Mexico | 923 | 7.2% |
| Oceania | 11 | 0.1% |
| South America | 9 | 0.1% |
| Western Europe | 64 | 0.5% | View All 17 Rows |
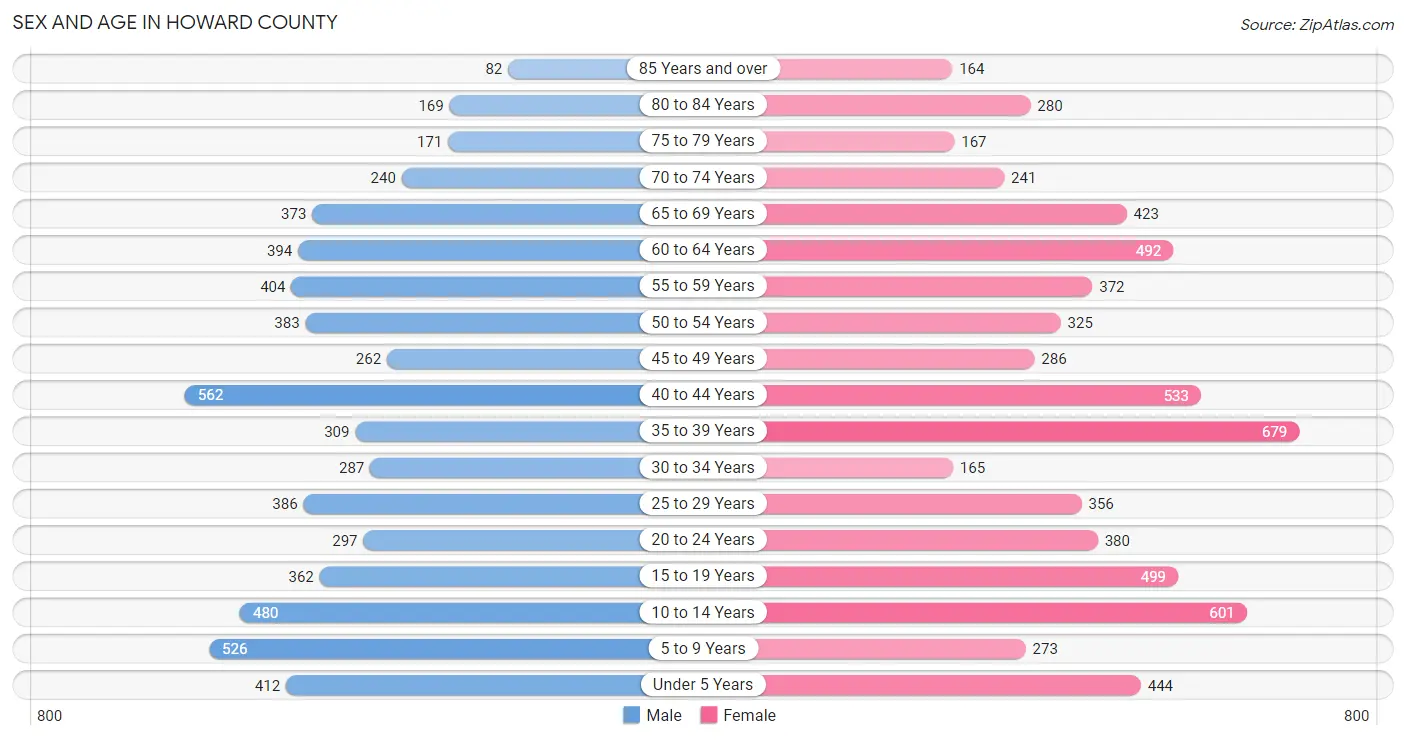
Sex and Age in Howard County
Sex and Age in Howard County
The most populous age groups in Howard County are 40 to 44 Years (562 | 9.2%) for men and 35 to 39 Years (679 | 10.2%) for women.
| Age Bracket | Male | Female |
| Under 5 Years | 412 (6.8%) | 444 (6.7%) |
| 5 to 9 Years | 526 (8.6%) | 273 (4.1%) |
| 10 to 14 Years | 480 (7.9%) | 601 (9.0%) |
| 15 to 19 Years | 362 (5.9%) | 499 (7.5%) |
| 20 to 24 Years | 297 (4.9%) | 380 (5.7%) |
| 25 to 29 Years | 386 (6.3%) | 356 (5.3%) |
| 30 to 34 Years | 287 (4.7%) | 165 (2.5%) |
| 35 to 39 Years | 309 (5.1%) | 679 (10.2%) |
| 40 to 44 Years | 562 (9.2%) | 533 (8.0%) |
| 45 to 49 Years | 262 (4.3%) | 286 (4.3%) |
| 50 to 54 Years | 383 (6.3%) | 325 (4.9%) |
| 55 to 59 Years | 404 (6.6%) | 372 (5.6%) |
| 60 to 64 Years | 394 (6.5%) | 492 (7.4%) |
| 65 to 69 Years | 373 (6.1%) | 423 (6.3%) |
| 70 to 74 Years | 240 (3.9%) | 241 (3.6%) |
| 75 to 79 Years | 171 (2.8%) | 167 (2.5%) |
| 80 to 84 Years | 169 (2.8%) | 280 (4.2%) |
| 85 Years and over | 82 (1.3%) | 164 (2.5%) |
| Total | 6,099 (100.0%) | 6,680 (100.0%) |
Families and Households in Howard County
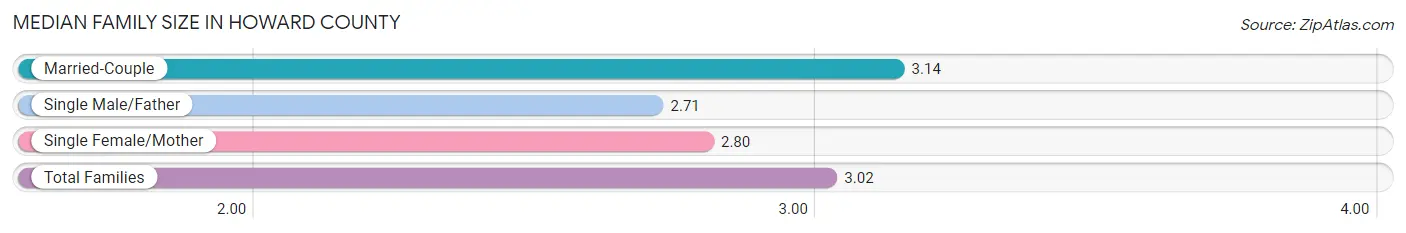
Median Family Size in Howard County
The median family size in Howard County is 3.02 persons per family, with married-couple families (2,373 | 67.3%) accounting for the largest median family size of 3.14 persons per family. On the other hand, single male/father families (272 | 7.7%) represent the smallest median family size with 2.71 persons per family.
| Family Type | # Families | Family Size |
| Married-Couple | 2,373 (67.3%) | 3.14 |
| Single Male/Father | 272 (7.7%) | 2.71 |
| Single Female/Mother | 879 (24.9%) | 2.80 |
| Total Families | 3,524 (100.0%) | 3.02 |
Median Household Size in Howard County
The median household size in Howard County is 2.41 persons per household, with married-couple households (2,373 | 45.4%) accounting for the largest median household size of 3.16 persons per household. non-family households (1,700 | 32.5%) represent the smallest median household size with 1.08 persons per household.

| Household Type | # Households | Household Size |
| Married-Couple | 2,373 (45.4%) | 3.16 |
| Single Male/Father | 272 (5.2%) | 2.75 |
| Single Female/Mother | 879 (16.8%) | 2.85 |
| Non-family | 1,700 (32.5%) | 1.08 |
| Total Households | 5,224 (100.0%) | 2.41 |
Household Size by Marriage Status in Howard County
Out of a total of 5,224 households in Howard County, 3,524 (67.5%) are family households, while 1,700 (32.5%) are nonfamily households. The most numerous type of family households are 2-person households, comprising 1,616, and the most common type of nonfamily households are 1-person households, comprising 1,514.

| Household Size | Family Households | Nonfamily Households |
| 1-Person Households | - | 1,514 (29.0%) |
| 2-Person Households | 1,616 (30.9%) | 174 (3.3%) |
| 3-Person Households | 897 (17.2%) | 12 (0.2%) |
| 4-Person Households | 581 (11.1%) | 0 (0.0%) |
| 5-Person Households | 253 (4.8%) | 0 (0.0%) |
| 6-Person Households | 81 (1.5%) | 0 (0.0%) |
| 7+ Person Households | 96 (1.8%) | 0 (0.0%) |
| Total | 3,524 (67.5%) | 1,700 (32.5%) |
Female Fertility in Howard County
Fertility by Age in Howard County
Average fertility rate in Howard County is 52.0 births per 1,000 women. Women in the age bracket of 20 to 34 years have the highest fertility rate with 119.0 births per 1,000 women. Women in the age bracket of 20 to 34 years acount for 69.5% of all women with births.

| Age Bracket | Women with Births | Births / 1,000 Women |
| 15 to 19 years | 29 (18.8%) | 58.0 |
| 20 to 34 years | 107 (69.5%) | 119.0 |
| 35 to 50 years | 18 (11.7%) | 12.0 |
| Total | 154 (100.0%) | 52.0 |
Fertility by Age by Marriage Status in Howard County
51.9% of women with births (154) in Howard County are married. The highest percentage of unmarried women with births falls into 15 to 19 years age bracket with 100.0% of them unmarried at the time of birth, while the lowest percentage of unmarried women with births belong to 35 to 50 years age bracket with 0.0% of them unmarried.

| Age Bracket | Married | Unmarried |
| 15 to 19 years | 0 (0.0%) | 29 (100.0%) |
| 20 to 34 years | 62 (57.9%) | 45 (42.1%) |
| 35 to 50 years | 18 (100.0%) | 0 (0.0%) |
| Total | 80 (51.9%) | 74 (48.0%) |
Fertility by Education in Howard County

| Educational Attainment | Women with Births | Births / 1,000 Women |
| Less than High School | 42 (27.3%) | 59.0 |
| High School Diploma | 37 (24.0%) | 34.0 |
| College or Associate's Degree | 53 (34.4%) | 87.0 |
| Bachelor's Degree | 22 (14.3%) | 63.0 |
| Graduate Degree | 0 (0.0%) | 0.0 |
| Total | 154 (100.0%) | 52.0 |
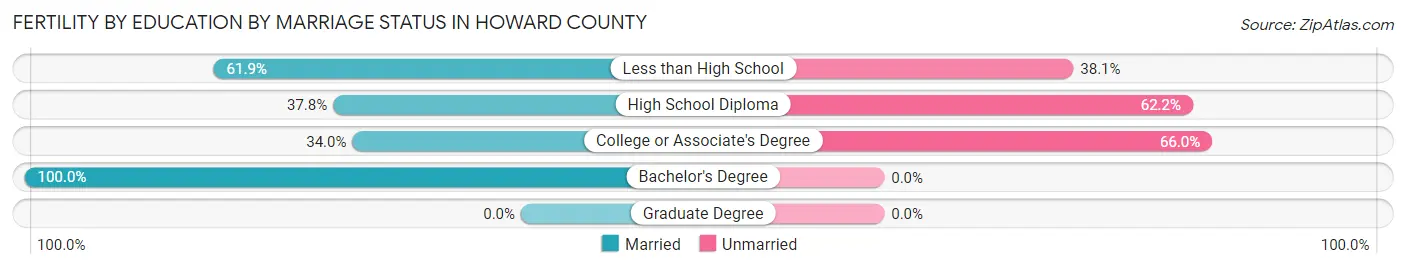
Fertility by Education by Marriage Status in Howard County
48.0% of women with births in Howard County are unmarried. Women with the educational attainment of bachelor's degree are most likely to be married with 100.0% of them married at childbirth, while women with the educational attainment of college or associate's degree are least likely to be married with 66.0% of them unmarried at childbirth.
| Educational Attainment | Married | Unmarried |
| Less than High School | 26 (61.9%) | 16 (38.1%) |
| High School Diploma | 14 (37.8%) | 23 (62.2%) |
| College or Associate's Degree | 18 (34.0%) | 35 (66.0%) |
| Bachelor's Degree | 22 (100.0%) | 0 (0.0%) |
| Graduate Degree | 0 (0.0%) | 0 (0.0%) |
| Total | 80 (51.9%) | 74 (48.0%) |
Income in Howard County
Income Overview in Howard County
Per Capita Income in Howard County is $25,458, while median incomes of families and households are $56,071 and $44,824 respectively.
| Characteristic | Number | Measure |
| Per Capita Income | 12,779 | $25,458 |
| Median Family Income | 3,524 | $56,071 |
| Mean Family Income | 3,524 | $75,580 |
| Median Household Income | 5,224 | $44,824 |
| Mean Household Income | 5,224 | $61,924 |
| Income Deficit | 3,524 | $10,176 |
| Wage / Income Gap (%) | 12,779 | 17.74% |
| Wage / Income Gap ($) | 12,779 | 82.26¢ per $1 |
| Gini / Inequality Index | 12,779 | 0.45 |
Earnings by Sex in Howard County
Average Earnings in Howard County are $30,574, $34,075 for men and $28,029 for women, a difference of 17.7%.

| Sex | Number | Average Earnings |
| Male | 2,995 (50.7%) | $34,075 |
| Female | 2,916 (49.3%) | $28,029 |
| Total | 5,911 (100.0%) | $30,574 |
Earnings by Sex by Income Bracket in Howard County
The most common earnings brackets in Howard County are $30,000 to $34,999 for men (347 | 11.6%) and $25,000 to $29,999 for women (363 | 12.4%).

| Income | Male | Female |
| $2,499 or less | 266 (8.9%) | 244 (8.4%) |
| $2,500 to $4,999 | 93 (3.1%) | 85 (2.9%) |
| $5,000 to $7,499 | 18 (0.6%) | 94 (3.2%) |
| $7,500 to $9,999 | 15 (0.5%) | 99 (3.4%) |
| $10,000 to $12,499 | 46 (1.5%) | 66 (2.3%) |
| $12,500 to $14,999 | 79 (2.6%) | 86 (2.9%) |
| $15,000 to $17,499 | 37 (1.2%) | 150 (5.1%) |
| $17,500 to $19,999 | 76 (2.5%) | 85 (2.9%) |
| $20,000 to $22,499 | 106 (3.5%) | 64 (2.2%) |
| $22,500 to $24,999 | 296 (9.9%) | 323 (11.1%) |
| $25,000 to $29,999 | 164 (5.5%) | 363 (12.4%) |
| $30,000 to $34,999 | 347 (11.6%) | 276 (9.5%) |
| $35,000 to $39,999 | 150 (5.0%) | 145 (5.0%) |
| $40,000 to $44,999 | 201 (6.7%) | 181 (6.2%) |
| $45,000 to $49,999 | 136 (4.5%) | 120 (4.1%) |
| $50,000 to $54,999 | 141 (4.7%) | 158 (5.4%) |
| $55,000 to $64,999 | 137 (4.6%) | 167 (5.7%) |
| $65,000 to $74,999 | 115 (3.8%) | 74 (2.5%) |
| $75,000 to $99,999 | 235 (7.9%) | 42 (1.4%) |
| $100,000+ | 337 (11.3%) | 94 (3.2%) |
| Total | 2,995 (100.0%) | 2,916 (100.0%) |
Earnings by Sex by Educational Attainment in Howard County
Average earnings in Howard County are $38,878 for men and $29,831 for women, a difference of 23.3%. Men with an educational attainment of bachelor's degree enjoy the highest average annual earnings of $54,115, while those with less than high school education earn the least with $31,613. Women with an educational attainment of bachelor's degree earn the most with the average annual earnings of $50,000, while those with high school diploma education have the smallest earnings of $24,163.

| Educational Attainment | Male Income | Female Income |
| Less than High School | $31,613 | $27,847 |
| High School Diploma | $33,372 | $24,163 |
| College or Associate's Degree | $42,287 | $29,810 |
| Bachelor's Degree | $54,115 | $50,000 |
| Graduate Degree | - | - |
| Total | $38,878 | $29,831 |
Family Income in Howard County
Family Income Brackets in Howard County
According to the Howard County family income data, there are 768 families falling into the $50,000 to $74,999 income range, which is the most common income bracket and makes up 21.8% of all families. Conversely, the $150,000 to $199,999 income bracket is the least frequent group with only 92 families (2.6%) belonging to this category.

| Income Bracket | # Families | % Families |
| Less than $10,000 | 109 | 3.1% |
| $10,000 to $14,999 | 106 | 3.0% |
| $15,000 to $24,999 | 405 | 11.5% |
| $25,000 to $34,999 | 398 | 11.3% |
| $35,000 to $49,999 | 440 | 12.5% |
| $50,000 to $74,999 | 768 | 21.8% |
| $75,000 to $99,999 | 500 | 14.2% |
| $100,000 to $149,999 | 532 | 15.1% |
| $150,000 to $199,999 | 92 | 2.6% |
| $200,000+ | 173 | 4.9% |
Family Income by Famaliy Size in Howard County
6-person families (76 | 2.2%) account for the highest median family income in Howard County with $114,028 per family, while 2-person families (1,664 | 47.2%) have the highest median income of $28,906 per family member.

| Income Bracket | # Families | Median Income |
| 2-Person Families | 1,664 (47.2%) | $57,813 |
| 3-Person Families | 873 (24.8%) | $45,625 |
| 4-Person Families | 572 (16.2%) | $76,682 |
| 5-Person Families | 243 (6.9%) | $56,066 |
| 6-Person Families | 76 (2.2%) | $114,028 |
| 7+ Person Families | 96 (2.7%) | $0 |
| Total | 3,524 (100.0%) | $56,071 |
Family Income by Number of Earners in Howard County
The median family income in Howard County is $56,071, with families comprising 2 earners (1,380) having the highest median family income of $84,344, while families with 1 earner (1,253) have the lowest median family income of $35,139, accounting for 39.2% and 35.6% of families, respectively.
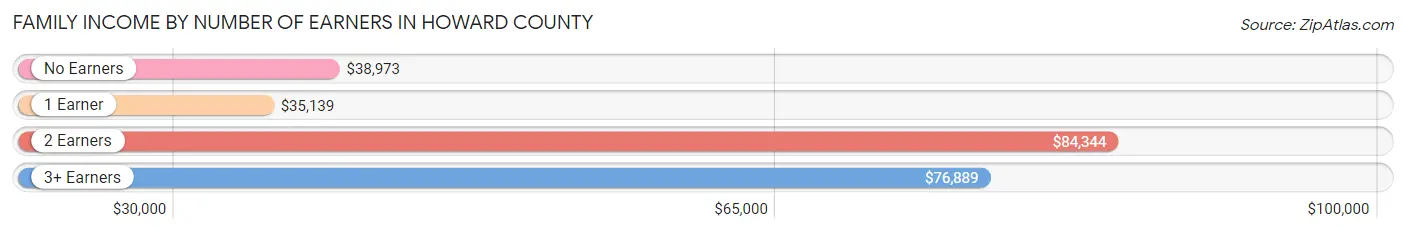
| Number of Earners | # Families | Median Income |
| No Earners | 611 (17.3%) | $38,973 |
| 1 Earner | 1,253 (35.6%) | $35,139 |
| 2 Earners | 1,380 (39.2%) | $84,344 |
| 3+ Earners | 280 (8.0%) | $76,889 |
| Total | 3,524 (100.0%) | $56,071 |
Household Income in Howard County
Household Income Brackets in Howard County
With 1,003 households falling in the category, the $50,000 to $74,999 income range is the most frequent in Howard County, accounting for 19.2% of all households. In contrast, only 94 households (1.8%) fall into the $150,000 to $199,999 income bracket, making it the least populous group.
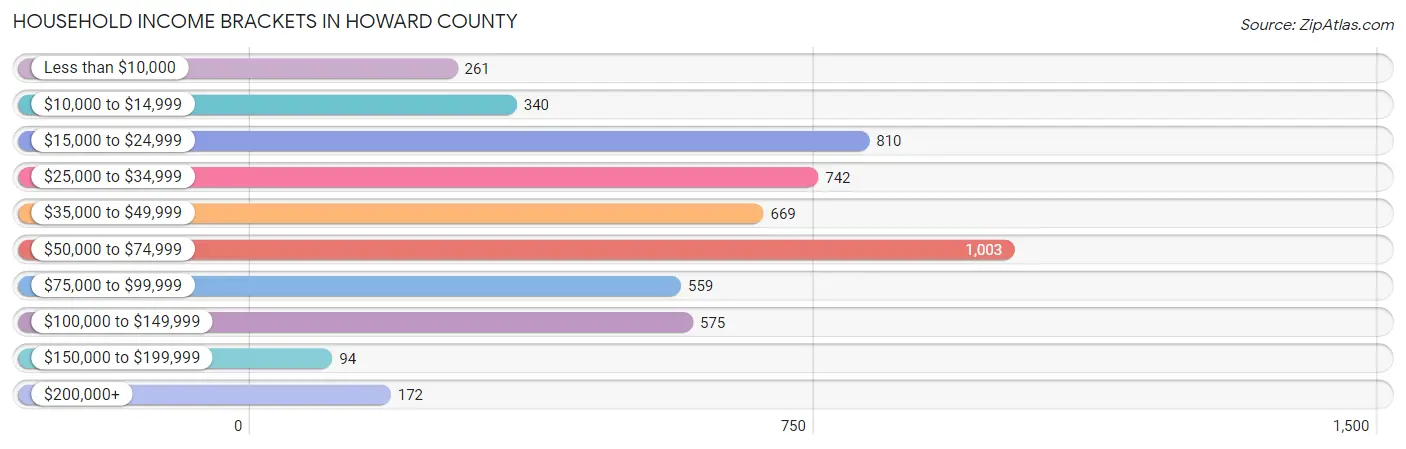
| Income Bracket | # Households | % Households |
| Less than $10,000 | 261 | 5.0% |
| $10,000 to $14,999 | 340 | 6.5% |
| $15,000 to $24,999 | 810 | 15.5% |
| $25,000 to $34,999 | 742 | 14.2% |
| $35,000 to $49,999 | 669 | 12.8% |
| $50,000 to $74,999 | 1,003 | 19.2% |
| $75,000 to $99,999 | 559 | 10.7% |
| $100,000 to $149,999 | 575 | 11.0% |
| $150,000 to $199,999 | 94 | 1.8% |
| $200,000+ | 172 | 3.3% |
Household Income by Householder Age in Howard County
The median household income in Howard County is $44,824, with the highest median household income of $55,389 found in the 45 to 64 years age bracket for the primary householder. A total of 1,735 households (33.2%) fall into this category. Meanwhile, the 15 to 24 years age bracket for the primary householder has the lowest median household income of $30,132, with 58 households (1.1%) in this group.

| Income Bracket | # Households | Median Income |
| 15 to 24 Years | 58 (1.1%) | $30,132 |
| 25 to 44 Years | 1,818 (34.8%) | $43,667 |
| 45 to 64 Years | 1,735 (33.2%) | $55,389 |
| 65+ Years | 1,613 (30.9%) | $38,513 |
| Total | 5,224 (100.0%) | $44,824 |
Poverty in Howard County
Income Below Poverty by Sex and Age in Howard County
With 13.6% poverty level for males and 22.6% for females among the residents of Howard County, 12 to 14 year old males and 15 year old females are the most vulnerable to poverty, with 60 males (23.8%) and 69 females (77.5%) in their respective age groups living below the poverty level.
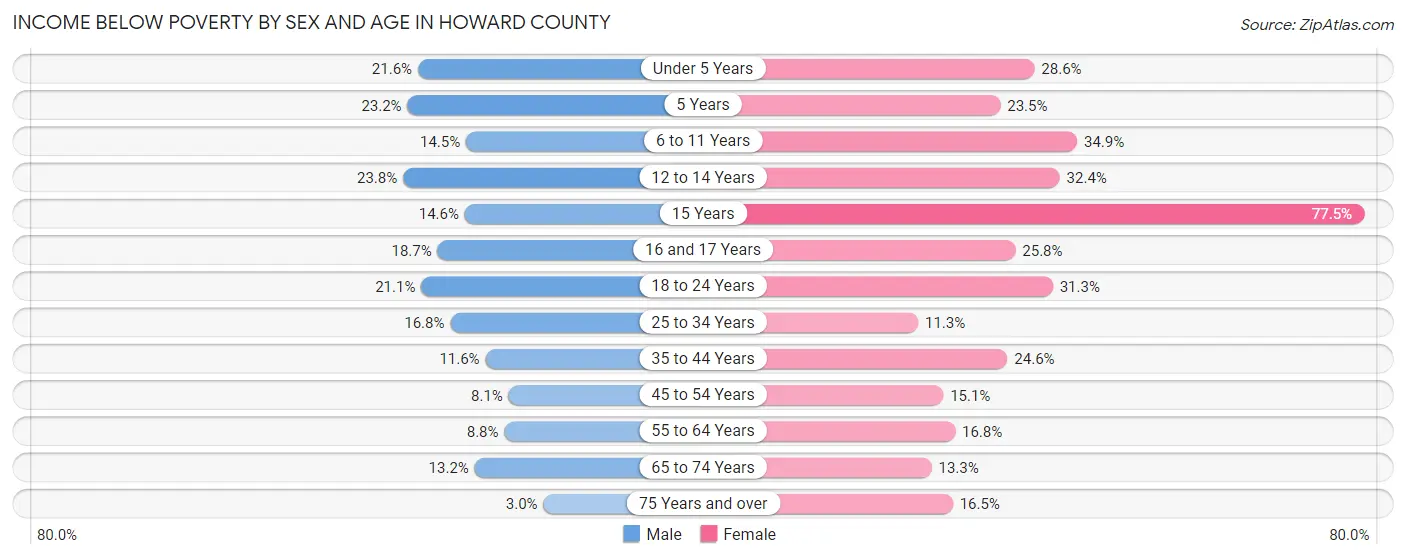
| Age Bracket | Male | Female |
| Under 5 Years | 89 (21.6%) | 127 (28.6%) |
| 5 Years | 25 (23.2%) | 4 (23.5%) |
| 6 to 11 Years | 90 (14.4%) | 153 (34.9%) |
| 12 to 14 Years | 60 (23.8%) | 131 (32.4%) |
| 15 Years | 6 (14.6%) | 69 (77.5%) |
| 16 and 17 Years | 34 (18.7%) | 67 (25.8%) |
| 18 to 24 Years | 92 (21.1%) | 166 (31.3%) |
| 25 to 34 Years | 113 (16.8%) | 59 (11.3%) |
| 35 to 44 Years | 99 (11.6%) | 298 (24.6%) |
| 45 to 54 Years | 52 (8.1%) | 92 (15.1%) |
| 55 to 64 Years | 69 (8.8%) | 143 (16.8%) |
| 65 to 74 Years | 79 (13.2%) | 88 (13.3%) |
| 75 Years and over | 12 (3.0%) | 84 (16.5%) |
| Total | 820 (13.6%) | 1,481 (22.6%) |
Income Above Poverty by Sex and Age in Howard County
According to the poverty statistics in Howard County, males aged 75 years and over and females aged 25 to 34 years are the age groups that are most secure financially, with 97.0% of males and 88.7% of females in these age groups living above the poverty line.

| Age Bracket | Male | Female |
| Under 5 Years | 323 (78.4%) | 317 (71.4%) |
| 5 Years | 83 (76.8%) | 13 (76.5%) |
| 6 to 11 Years | 533 (85.6%) | 285 (65.1%) |
| 12 to 14 Years | 192 (76.2%) | 274 (67.6%) |
| 15 Years | 35 (85.4%) | 20 (22.5%) |
| 16 and 17 Years | 148 (81.3%) | 193 (74.2%) |
| 18 to 24 Years | 344 (78.9%) | 364 (68.7%) |
| 25 to 34 Years | 560 (83.2%) | 462 (88.7%) |
| 35 to 44 Years | 757 (88.4%) | 914 (75.4%) |
| 45 to 54 Years | 588 (91.9%) | 519 (84.9%) |
| 55 to 64 Years | 719 (91.2%) | 707 (83.2%) |
| 65 to 74 Years | 521 (86.8%) | 572 (86.7%) |
| 75 Years and over | 394 (97.0%) | 426 (83.5%) |
| Total | 5,197 (86.4%) | 5,066 (77.4%) |
Income Below Poverty Among Married-Couple Families in Howard County
The poverty statistics for married-couple families in Howard County show that 7.5% or 178 of the total 2,373 families live below the poverty line. Families with 1 or 2 children have the highest poverty rate of 10.2%, comprising of 74 families. On the other hand, families with 3 or 4 children have the lowest poverty rate of 0.0%, which includes 0 families.

| Children | Above Poverty | Below Poverty |
| No Children | 1,312 (92.7%) | 104 (7.3%) |
| 1 or 2 Children | 649 (89.8%) | 74 (10.2%) |
| 3 or 4 Children | 212 (100.0%) | 0 (0.0%) |
| 5 or more Children | 22 (100.0%) | 0 (0.0%) |
| Total | 2,195 (92.5%) | 178 (7.5%) |
Income Below Poverty Among Single-Parent Households in Howard County
According to the poverty data in Howard County, 21.0% or 57 single-father households and 35.7% or 314 single-mother households are living below the poverty line. Among single-father households, those with 3 or 4 children have the highest poverty rate, with 7 households (100.0%) experiencing poverty. Likewise, among single-mother households, those with 5 or more children have the highest poverty rate, with 56 households (100.0%) falling below the poverty line.
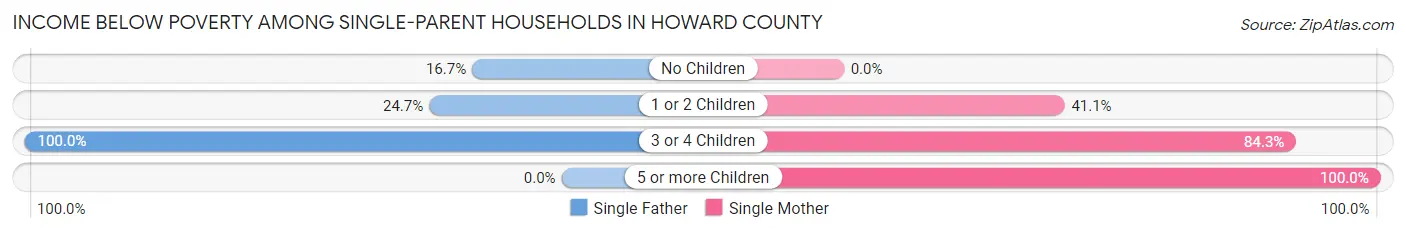
| Children | Single Father | Single Mother |
| No Children | 32 (16.7%) | 0 (0.0%) |
| 1 or 2 Children | 18 (24.7%) | 183 (41.1%) |
| 3 or 4 Children | 7 (100.0%) | 75 (84.3%) |
| 5 or more Children | 0 (0.0%) | 56 (100.0%) |
| Total | 57 (21.0%) | 314 (35.7%) |
Income Below Poverty Among Married-Couple vs Single-Parent Households in Howard County
The poverty data for Howard County shows that 178 of the married-couple family households (7.5%) and 371 of the single-parent households (32.2%) are living below the poverty level. Within the married-couple family households, those with 1 or 2 children have the highest poverty rate, with 74 households (10.2%) falling below the poverty line. Among the single-parent households, those with 5 or more children have the highest poverty rate, with 56 household (100.0%) living below poverty.

| Children | Married-Couple Families | Single-Parent Households |
| No Children | 104 (7.3%) | 32 (6.7%) |
| 1 or 2 Children | 74 (10.2%) | 201 (38.8%) |
| 3 or 4 Children | 0 (0.0%) | 82 (85.4%) |
| 5 or more Children | 0 (0.0%) | 56 (100.0%) |
| Total | 178 (7.5%) | 371 (32.2%) |
Employment Characteristics in Howard County
Employment by Class of Employer in Howard County
Among the 5,285 employed individuals in Howard County, private company employees (3,718 | 70.4%), local government employees (418 | 7.9%), and self-employed (not incorporated) (415 | 7.9%) make up the most common classes of employment.
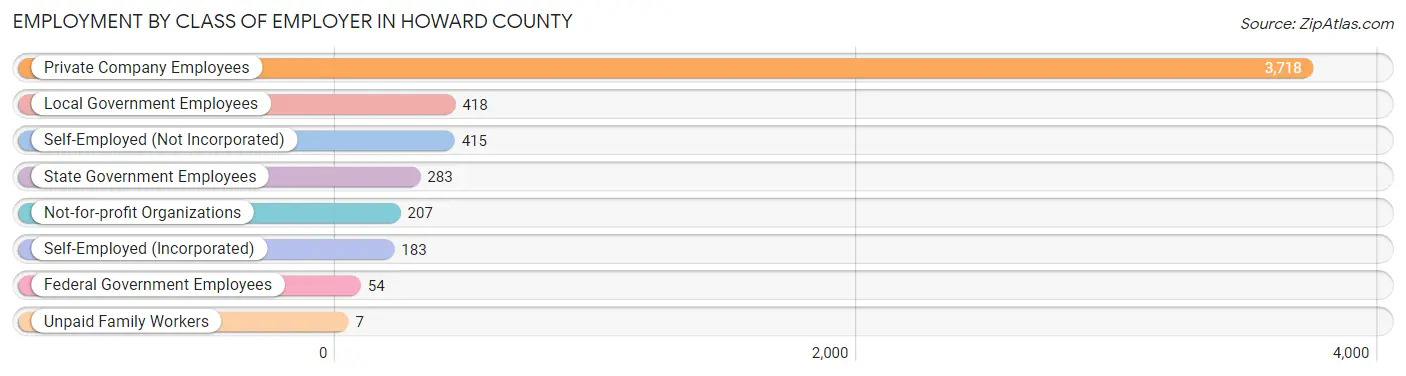
| Employer Class | # Employees | % Employees |
| Private Company Employees | 3,718 | 70.4% |
| Self-Employed (Incorporated) | 183 | 3.5% |
| Self-Employed (Not Incorporated) | 415 | 7.9% |
| Not-for-profit Organizations | 207 | 3.9% |
| Local Government Employees | 418 | 7.9% |
| State Government Employees | 283 | 5.3% |
| Federal Government Employees | 54 | 1.0% |
| Unpaid Family Workers | 7 | 0.1% |
| Total | 5,285 | 100.0% |
Employment Status by Age in Howard County
According to the labor force statistics for Howard County, out of the total population over 16 years of age (9,913), 57.5% or 5,700 individuals are in the labor force, with 6.4% or 365 of them unemployed. The age group with the highest labor force participation rate is 30 to 34 years, with 84.5% or 382 individuals in the labor force. Within the labor force, the 16 to 19 years age range has the highest percentage of unemployed individuals, with 27.5% or 57 of them being unemployed.

| Age Bracket | In Labor Force | Unemployed |
| 16 to 19 Years | 207 (28.3%) | 57 (27.5%) |
| 20 to 24 Years | 508 (75.0%) | 95 (18.7%) |
| 25 to 29 Years | 618 (83.3%) | 12 (1.9%) |
| 30 to 34 Years | 382 (84.5%) | 11 (2.9%) |
| 35 to 44 Years | 1,643 (78.9%) | 90 (5.5%) |
| 45 to 54 Years | 951 (75.7%) | 44 (4.6%) |
| 55 to 59 Years | 549 (70.7%) | 45 (8.2%) |
| 60 to 64 Years | 362 (40.9%) | 3 (0.8%) |
| 65 to 74 Years | 370 (29.0%) | 0 (0.0%) |
| 75 Years and over | 113 (10.9%) | 9 (8.0%) |
| Total | 5,700 (57.5%) | 365 (6.4%) |
Employment Status by Educational Attainment in Howard County
According to labor force statistics for Howard County, 72.7% of individuals (4,504) out of the total population between 25 and 64 years of age (6,195) are in the labor force, with 4.6% or 207 of them being unemployed. The group with the highest labor force participation rate are those with the educational attainment of bachelor's degree or higher, with 86.7% or 818 individuals in the labor force. Within the labor force, individuals with less than high school education have the highest percentage of unemployment, with 12.7% or 55 of them being unemployed.

| Educational Attainment | In Labor Force | Unemployed |
| Less than High School | 434 (61.8%) | 89 (12.7%) |
| High School Diploma | 1,830 (67.1%) | 202 (7.4%) |
| College / Associate Degree | 1,426 (78.2%) | 9 (0.5%) |
| Bachelor's Degree or higher | 818 (86.7%) | 10 (1.1%) |
| Total | 4,504 (72.7%) | 285 (4.6%) |
Employment Occupations by Sex in Howard County
Management, Business, Science and Arts Occupations
The most common Management, Business, Science and Arts occupations in Howard County are Community & Social Service (550 | 10.3%), Education Instruction & Library (420 | 7.9%), Management (409 | 7.7%), Health Diagnosing & Treating (250 | 4.7%), and Computers, Engineering & Science (178 | 3.3%).

Management, Business, Science and Arts Occupations by Sex
Within the Management, Business, Science and Arts occupations in Howard County, the most male-oriented occupations are Architecture & Engineering (100.0%), Life, Physical & Social Science (100.0%), and Arts, Media & Entertainment (100.0%), while the most female-oriented occupations are Business & Financial (97.0%), Health Diagnosing & Treating (93.6%), and Health Technologists (90.9%).

| Occupation | Male | Female |
| Management | 298 (72.9%) | 111 (27.1%) |
| Business & Financial | 2 (3.0%) | 64 (97.0%) |
| Computers, Engineering & Science | 108 (60.7%) | 70 (39.3%) |
| Computers & Mathematics | 41 (36.9%) | 70 (63.1%) |
| Architecture & Engineering | 47 (100.0%) | 0 (0.0%) |
| Life, Physical & Social Science | 20 (100.0%) | 0 (0.0%) |
| Community & Social Service | 179 (32.6%) | 371 (67.4%) |
| Education, Arts & Media | 49 (57.7%) | 36 (42.3%) |
| Legal Services & Support | 0 (0.0%) | 0 (0.0%) |
| Education Instruction & Library | 85 (20.2%) | 335 (79.8%) |
| Arts, Media & Entertainment | 45 (100.0%) | 0 (0.0%) |
| Health Diagnosing & Treating | 16 (6.4%) | 234 (93.6%) |
| Health Technologists | 11 (9.1%) | 110 (90.9%) |
| Total (Category) | 603 (41.5%) | 850 (58.5%) |
| Total (Overall) | 2,709 (50.8%) | 2,628 (49.2%) |
Services Occupations
The most common Services occupations in Howard County are Cleaning & Maintenance (424 | 7.9%), Food Preparation & Serving (237 | 4.4%), Personal Care & Service (107 | 2.0%), Healthcare Support (86 | 1.6%), and Security & Protection (79 | 1.5%).

Services Occupations by Sex
Within the Services occupations in Howard County, the most male-oriented occupations are Law Enforcement (100.0%), Security & Protection (92.4%), and Firefighting & Prevention (88.0%), while the most female-oriented occupations are Personal Care & Service (86.9%), Healthcare Support (69.8%), and Food Preparation & Serving (57.8%).

| Occupation | Male | Female |
| Healthcare Support | 26 (30.2%) | 60 (69.8%) |
| Security & Protection | 73 (92.4%) | 6 (7.6%) |
| Firefighting & Prevention | 44 (88.0%) | 6 (12.0%) |
| Law Enforcement | 29 (100.0%) | 0 (0.0%) |
| Food Preparation & Serving | 100 (42.2%) | 137 (57.8%) |
| Cleaning & Maintenance | 342 (80.7%) | 82 (19.3%) |
| Personal Care & Service | 14 (13.1%) | 93 (86.9%) |
| Total (Category) | 555 (59.5%) | 378 (40.5%) |
| Total (Overall) | 2,709 (50.8%) | 2,628 (49.2%) |
Sales and Office Occupations
The most common Sales and Office occupations in Howard County are Office & Administration (576 | 10.8%), and Sales & Related (311 | 5.8%).

Sales and Office Occupations by Sex
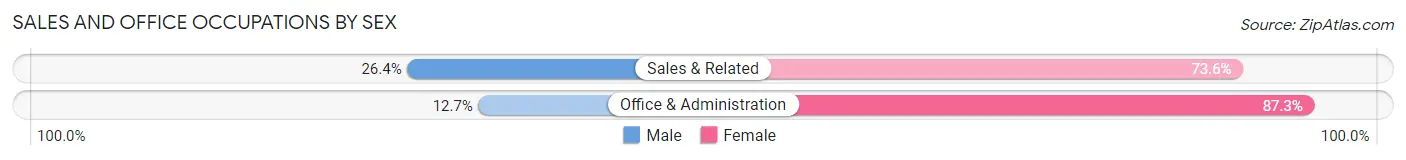
| Occupation | Male | Female |
| Sales & Related | 82 (26.4%) | 229 (73.6%) |
| Office & Administration | 73 (12.7%) | 503 (87.3%) |
| Total (Category) | 155 (17.5%) | 732 (82.5%) |
| Total (Overall) | 2,709 (50.8%) | 2,628 (49.2%) |
Natural Resources, Construction and Maintenance Occupations
The most common Natural Resources, Construction and Maintenance occupations in Howard County are Installation, Maintenance & Repair (322 | 6.0%), Farming, Fishing & Forestry (273 | 5.1%), and Construction & Extraction (207 | 3.9%).
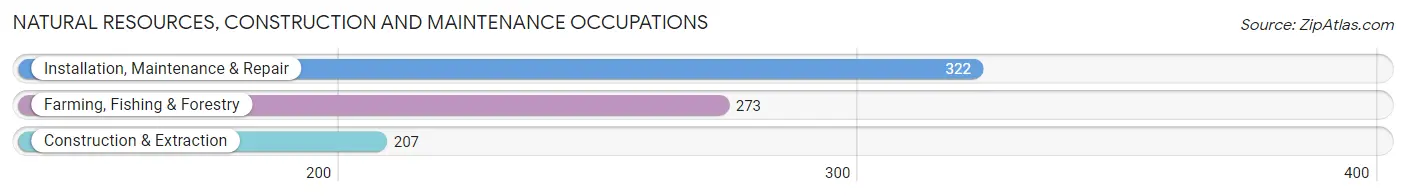
Natural Resources, Construction and Maintenance Occupations by Sex

| Occupation | Male | Female |
| Farming, Fishing & Forestry | 179 (65.6%) | 94 (34.4%) |
| Construction & Extraction | 207 (100.0%) | 0 (0.0%) |
| Installation, Maintenance & Repair | 306 (95.0%) | 16 (5.0%) |
| Total (Category) | 692 (86.3%) | 110 (13.7%) |
| Total (Overall) | 2,709 (50.8%) | 2,628 (49.2%) |
Production, Transportation and Moving Occupations
The most common Production, Transportation and Moving occupations in Howard County are Production (783 | 14.7%), Material Moving (351 | 6.6%), and Transportation (128 | 2.4%).

Production, Transportation and Moving Occupations by Sex

| Occupation | Male | Female |
| Production | 343 (43.8%) | 440 (56.2%) |
| Transportation | 118 (92.2%) | 10 (7.8%) |
| Material Moving | 243 (69.2%) | 108 (30.8%) |
| Total (Category) | 704 (55.8%) | 558 (44.2%) |
| Total (Overall) | 2,709 (50.8%) | 2,628 (49.2%) |
Employment Industries by Sex in Howard County
Employment Industries in Howard County
The major employment industries in Howard County include Manufacturing (1,775 | 33.3%), Educational Services (592 | 11.1%), Health Care & Social Assistance (547 | 10.2%), Agriculture, Fishing & Hunting (526 | 9.9%), and Retail Trade (371 | 7.0%).

Employment Industries by Sex in Howard County
The Howard County industries that see more men than women are Mining, Quarrying, & Extraction (100.0%), Real Estate, Rental & Leasing (92.0%), and Construction (84.1%), whereas the industries that tend to have a higher number of women are Finance & Insurance (100.0%), Arts, Entertainment & Recreation (100.0%), and Health Care & Social Assistance (80.4%).

| Industry | Male | Female |
| Agriculture, Fishing & Hunting | 400 (76.0%) | 126 (23.9%) |
| Mining, Quarrying, & Extraction | 4 (100.0%) | 0 (0.0%) |
| Construction | 217 (84.1%) | 41 (15.9%) |
| Manufacturing | 1,086 (61.2%) | 689 (38.8%) |
| Wholesale Trade | 50 (80.6%) | 12 (19.4%) |
| Retail Trade | 119 (32.1%) | 252 (67.9%) |
| Transportation & Warehousing | 51 (60.7%) | 33 (39.3%) |
| Utilities | 36 (54.5%) | 30 (45.5%) |
| Information | 99 (66.9%) | 49 (33.1%) |
| Finance & Insurance | 0 (0.0%) | 104 (100.0%) |
| Real Estate, Rental & Leasing | 23 (92.0%) | 2 (8.0%) |
| Professional & Scientific | 0 (0.0%) | 0 (0.0%) |
| Enterprise Management | 0 (0.0%) | 0 (0.0%) |
| Administrative & Support | 68 (63.0%) | 40 (37.0%) |
| Educational Services | 160 (27.0%) | 432 (73.0%) |
| Health Care & Social Assistance | 107 (19.6%) | 440 (80.4%) |
| Arts, Entertainment & Recreation | 0 (0.0%) | 46 (100.0%) |
| Accommodation & Food Services | 142 (52.8%) | 127 (47.2%) |
| Public Administration | 106 (58.9%) | 74 (41.1%) |
| Total | 2,709 (50.8%) | 2,628 (49.2%) |
Education in Howard County
School Enrollment in Howard County
The most common levels of schooling among the 3,127 students in Howard County are middle school (812 | 26.0%), elementary school (796 | 25.5%), and high school (734 | 23.5%).

| School Level | # Students | % Students |
| Nursery / Preschool | 309 | 9.9% |
| Kindergarten | 110 | 3.5% |
| Elementary School | 796 | 25.5% |
| Middle School | 812 | 26.0% |
| High School | 734 | 23.5% |
| College / Undergraduate | 292 | 9.3% |
| Graduate / Professional | 74 | 2.4% |
| Total | 3,127 | 100.0% |
School Enrollment by Age by Funding Source in Howard County
Out of a total of 3,127 students who are enrolled in schools in Howard County, 278 (8.9%) attend a private institution, while the remaining 2,849 (91.1%) are enrolled in public schools. The age group of 3 to 4 year olds has the highest likelihood of being enrolled in private schools, with 71 (30.2% in the age bracket) enrolled. Conversely, the age group of 15 to 17 year olds has the lowest likelihood of being enrolled in a private school, with 528 (100.0% in the age bracket) attending a public institution.
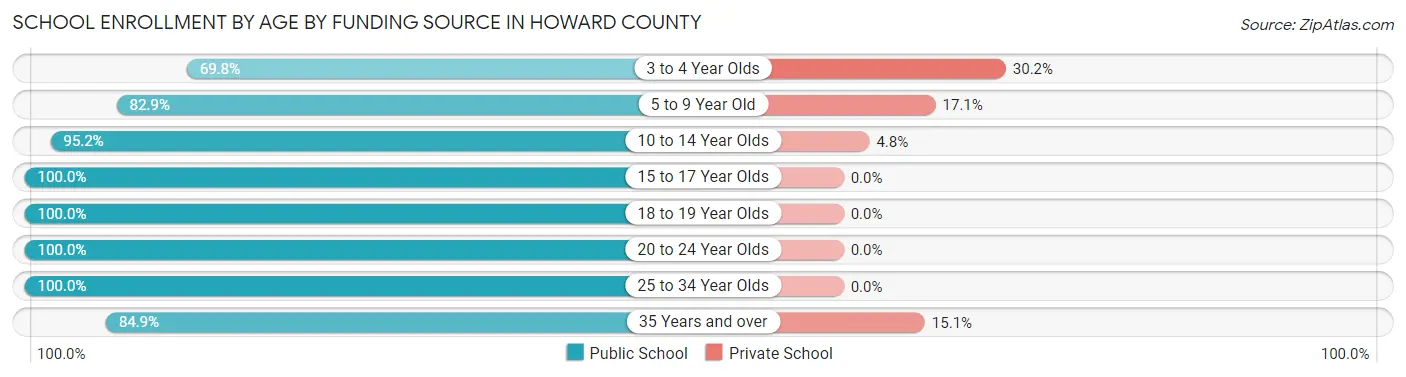
| Age Bracket | Public School | Private School |
| 3 to 4 Year Olds | 164 (69.8%) | 71 (30.2%) |
| 5 to 9 Year Old | 658 (82.9%) | 136 (17.1%) |
| 10 to 14 Year Olds | 1,029 (95.2%) | 52 (4.8%) |
| 15 to 17 Year Olds | 528 (100.0%) | 0 (0.0%) |
| 18 to 19 Year Olds | 196 (100.0%) | 0 (0.0%) |
| 20 to 24 Year Olds | 91 (100.0%) | 0 (0.0%) |
| 25 to 34 Year Olds | 83 (100.0%) | 0 (0.0%) |
| 35 Years and over | 101 (84.9%) | 18 (15.1%) |
| Total | 2,849 (91.1%) | 278 (8.9%) |
Educational Attainment by Field of Study in Howard County
Education (280 | 21.1%), business (192 | 14.4%), science & technology (175 | 13.2%), psychology (123 | 9.3%), and bio, nature & agricultural (102 | 7.7%) are the most common fields of study among 1,329 individuals in Howard County who have obtained a bachelor's degree or higher.

| Field of Study | # Graduates | % Graduates |
| Computers & Mathematics | 73 | 5.5% |
| Bio, Nature & Agricultural | 102 | 7.7% |
| Physical & Health Sciences | 55 | 4.1% |
| Psychology | 123 | 9.3% |
| Social Sciences | 91 | 6.9% |
| Engineering | 37 | 2.8% |
| Multidisciplinary Studies | 0 | 0.0% |
| Science & Technology | 175 | 13.2% |
| Business | 192 | 14.4% |
| Education | 280 | 21.1% |
| Literature & Languages | 41 | 3.1% |
| Liberal Arts & History | 57 | 4.3% |
| Visual & Performing Arts | 47 | 3.5% |
| Communications | 0 | 0.0% |
| Arts & Humanities | 56 | 4.2% |
| Total | 1,329 | 100.0% |
Transportation & Commute in Howard County
Vehicle Availability by Sex in Howard County
The most prevalent vehicle ownership categories in Howard County are males with 2 vehicles (925, accounting for 34.4%) and females with 2 vehicles (941, making up 35.6%).

| Vehicles Available | Male | Female |
| No Vehicle | 26 (1.0%) | 61 (2.4%) |
| 1 Vehicle | 327 (12.2%) | 581 (22.4%) |
| 2 Vehicles | 925 (34.4%) | 941 (36.2%) |
| 3 Vehicles | 839 (31.2%) | 648 (24.9%) |
| 4 Vehicles | 396 (14.7%) | 253 (9.7%) |
| 5 or more Vehicles | 172 (6.4%) | 114 (4.4%) |
| Total | 2,685 (100.0%) | 2,598 (100.0%) |
Commute Time in Howard County
The most frequently occuring commute durations in Howard County are 5 to 9 minutes (1,299 commuters, 25.3%), 10 to 14 minutes (1,077 commuters, 20.9%), and 15 to 19 minutes (719 commuters, 14.0%).

| Commute Time | # Commuters | % Commuters |
| Less than 5 Minutes | 260 | 5.1% |
| 5 to 9 Minutes | 1,299 | 25.3% |
| 10 to 14 Minutes | 1,077 | 20.9% |
| 15 to 19 Minutes | 719 | 14.0% |
| 20 to 24 Minutes | 418 | 8.1% |
| 25 to 29 Minutes | 57 | 1.1% |
| 30 to 34 Minutes | 469 | 9.1% |
| 35 to 39 Minutes | 87 | 1.7% |
| 40 to 44 Minutes | 170 | 3.3% |
| 45 to 59 Minutes | 275 | 5.3% |
| 60 to 89 Minutes | 204 | 4.0% |
| 90 or more Minutes | 108 | 2.1% |
Commute Time by Sex in Howard County
The most common commute times in Howard County are 5 to 9 minutes (602 commuters, 23.4%) for males and 5 to 9 minutes (697 commuters, 27.2%) for females.

| Commute Time | Male | Female |
| Less than 5 Minutes | 65 (2.5%) | 195 (7.6%) |
| 5 to 9 Minutes | 602 (23.4%) | 697 (27.2%) |
| 10 to 14 Minutes | 548 (21.3%) | 529 (20.6%) |
| 15 to 19 Minutes | 352 (13.7%) | 367 (14.3%) |
| 20 to 24 Minutes | 184 (7.1%) | 234 (9.1%) |
| 25 to 29 Minutes | 26 (1.0%) | 31 (1.2%) |
| 30 to 34 Minutes | 288 (11.2%) | 181 (7.0%) |
| 35 to 39 Minutes | 10 (0.4%) | 77 (3.0%) |
| 40 to 44 Minutes | 139 (5.4%) | 31 (1.2%) |
| 45 to 59 Minutes | 126 (4.9%) | 149 (5.8%) |
| 60 to 89 Minutes | 152 (5.9%) | 52 (2.0%) |
| 90 or more Minutes | 85 (3.3%) | 23 (0.9%) |
Time of Departure to Work by Sex in Howard County
The most frequent times of departure to work in Howard County are 12:00 AM to 4:59 AM (576, 22.4%) for males and 7:00 AM to 7:29 AM (445, 17.3%) for females.
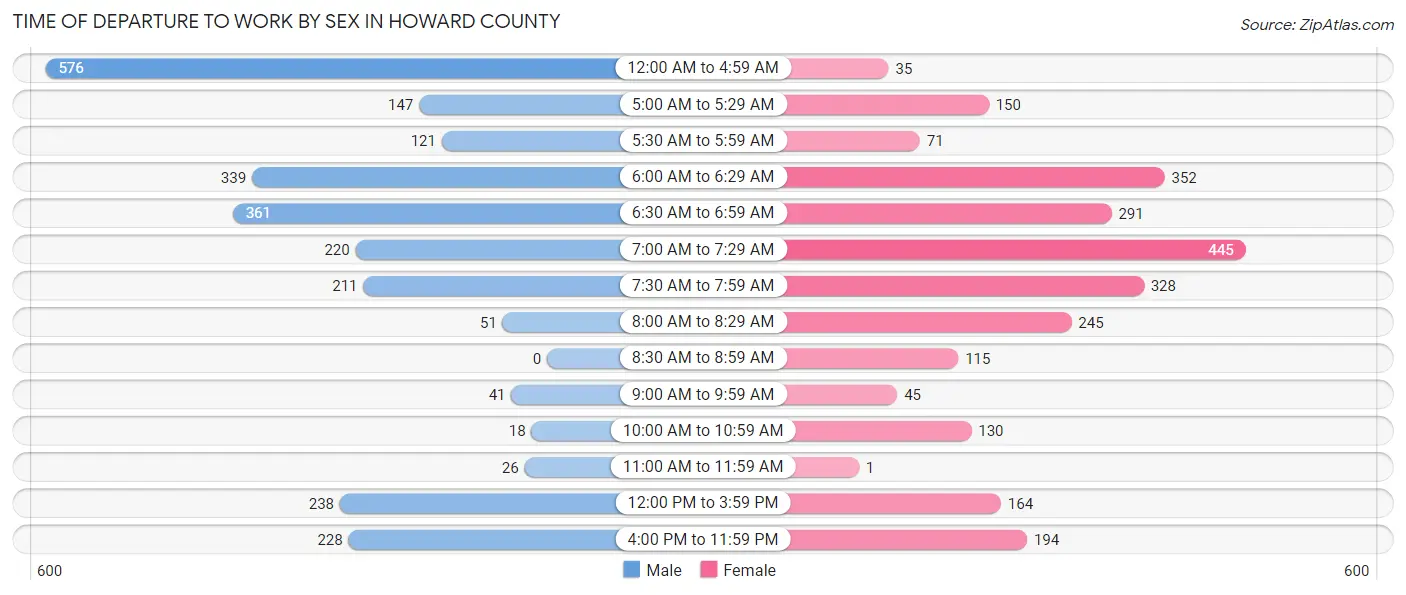
| Time of Departure | Male | Female |
| 12:00 AM to 4:59 AM | 576 (22.4%) | 35 (1.4%) |
| 5:00 AM to 5:29 AM | 147 (5.7%) | 150 (5.9%) |
| 5:30 AM to 5:59 AM | 121 (4.7%) | 71 (2.8%) |
| 6:00 AM to 6:29 AM | 339 (13.2%) | 352 (13.7%) |
| 6:30 AM to 6:59 AM | 361 (14.0%) | 291 (11.3%) |
| 7:00 AM to 7:29 AM | 220 (8.5%) | 445 (17.3%) |
| 7:30 AM to 7:59 AM | 211 (8.2%) | 328 (12.8%) |
| 8:00 AM to 8:29 AM | 51 (2.0%) | 245 (9.6%) |
| 8:30 AM to 8:59 AM | 0 (0.0%) | 115 (4.5%) |
| 9:00 AM to 9:59 AM | 41 (1.6%) | 45 (1.8%) |
| 10:00 AM to 10:59 AM | 18 (0.7%) | 130 (5.1%) |
| 11:00 AM to 11:59 AM | 26 (1.0%) | 1 (0.0%) |
| 12:00 PM to 3:59 PM | 238 (9.2%) | 164 (6.4%) |
| 4:00 PM to 11:59 PM | 228 (8.8%) | 194 (7.6%) |
| Total | 2,577 (100.0%) | 2,566 (100.0%) |
Housing Occupancy in Howard County
Occupancy by Ownership in Howard County
Of the total 5,224 dwellings in Howard County, owner-occupied units account for 3,792 (72.6%), while renter-occupied units make up 1,432 (27.4%).

| Occupancy | # Housing Units | % Housing Units |
| Owner Occupied Housing Units | 3,792 | 72.6% |
| Renter-Occupied Housing Units | 1,432 | 27.4% |
| Total Occupied Housing Units | 5,224 | 100.0% |
Occupancy by Household Size in Howard County

| Household Size | # Housing Units | % Housing Units |
| 1-Person Household | 1,514 | 29.0% |
| 2-Person Household | 1,790 | 34.3% |
| 3-Person Household | 909 | 17.4% |
| 4+ Person Household | 1,011 | 19.4% |
| Total Housing Units | 5,224 | 100.0% |
Occupancy by Ownership by Household Size in Howard County

| Household Size | Owner-occupied | Renter-occupied |
| 1-Person Household | 1,055 (69.7%) | 459 (30.3%) |
| 2-Person Household | 1,395 (77.9%) | 395 (22.1%) |
| 3-Person Household | 570 (62.7%) | 339 (37.3%) |
| 4+ Person Household | 772 (76.4%) | 239 (23.6%) |
| Total Housing Units | 3,792 (72.6%) | 1,432 (27.4%) |
Occupancy by Educational Attainment in Howard County
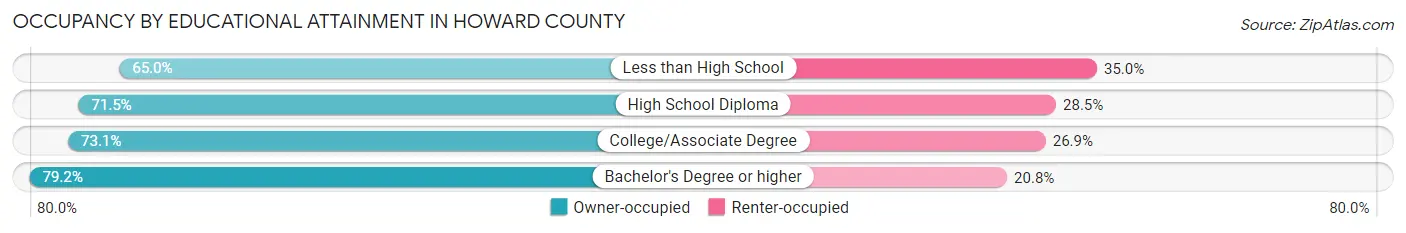
| Household Size | Owner-occupied | Renter-occupied |
| Less than High School | 358 (65.0%) | 193 (35.0%) |
| High School Diploma | 1,545 (71.5%) | 617 (28.5%) |
| College/Associate Degree | 1,195 (73.1%) | 440 (26.9%) |
| Bachelor's Degree or higher | 694 (79.2%) | 182 (20.8%) |
Occupancy by Age of Householder in Howard County

| Age Bracket | # Households | % Households |
| Under 35 Years | 604 | 11.6% |
| 35 to 44 Years | 1,272 | 24.3% |
| 45 to 54 Years | 764 | 14.6% |
| 55 to 64 Years | 971 | 18.6% |
| 65 to 74 Years | 905 | 17.3% |
| 75 to 84 Years | 546 | 10.4% |
| 85 Years and Over | 162 | 3.1% |
| Total | 5,224 | 100.0% |
Housing Finances in Howard County
Median Income by Occupancy in Howard County

| Occupancy Type | # Households | Median Income |
| Owner-Occupied | 3,792 (72.6%) | $54,688 |
| Renter-Occupied | 1,432 (27.4%) | $28,101 |
| Average | 5,224 (100.0%) | $44,824 |
Occupancy by Householder Income Bracket in Howard County
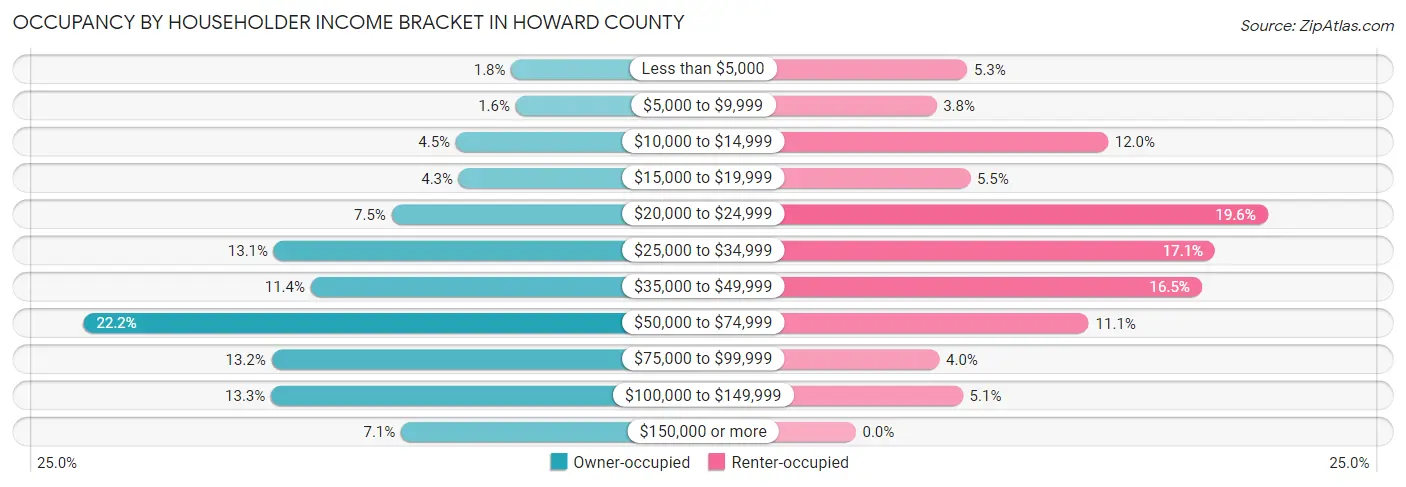
| Income Bracket | Owner-occupied | Renter-occupied |
| Less than $5,000 | 69 (1.8%) | 76 (5.3%) |
| $5,000 to $9,999 | 61 (1.6%) | 55 (3.8%) |
| $10,000 to $14,999 | 169 (4.5%) | 172 (12.0%) |
| $15,000 to $19,999 | 164 (4.3%) | 78 (5.4%) |
| $20,000 to $24,999 | 285 (7.5%) | 281 (19.6%) |
| $25,000 to $34,999 | 498 (13.1%) | 245 (17.1%) |
| $35,000 to $49,999 | 431 (11.4%) | 236 (16.5%) |
| $50,000 to $74,999 | 842 (22.2%) | 159 (11.1%) |
| $75,000 to $99,999 | 502 (13.2%) | 57 (4.0%) |
| $100,000 to $149,999 | 503 (13.3%) | 73 (5.1%) |
| $150,000 or more | 268 (7.1%) | 0 (0.0%) |
| Total | 3,792 (100.0%) | 1,432 (100.0%) |
Monthly Housing Cost Tiers in Howard County

| Monthly Cost | Owner-occupied | Renter-occupied |
| Less than $300 | 756 (19.9%) | 45 (3.1%) |
| $300 to $499 | 1,004 (26.5%) | 144 (10.1%) |
| $500 to $799 | 875 (23.1%) | 584 (40.8%) |
| $800 to $999 | 275 (7.2%) | 325 (22.7%) |
| $1,000 to $1,499 | 599 (15.8%) | 110 (7.7%) |
| $1,500 to $1,999 | 181 (4.8%) | 4 (0.3%) |
| $2,000 to $2,499 | 48 (1.3%) | 0 (0.0%) |
| $2,500 to $2,999 | 6 (0.2%) | 0 (0.0%) |
| $3,000 or more | 48 (1.3%) | 0 (0.0%) |
| Total | 3,792 (100.0%) | 1,432 (100.0%) |
Physical Housing Characteristics in Howard County
Housing Structures in Howard County

| Structure Type | # Housing Units | % Housing Units |
| Single Unit, Detached | 3,937 | 75.4% |
| Single Unit, Attached | 43 | 0.8% |
| 2 Unit Apartments | 104 | 2.0% |
| 3 or 4 Unit Apartments | 72 | 1.4% |
| 5 to 9 Unit Apartments | 63 | 1.2% |
| 10 or more Apartments | 28 | 0.5% |
| Mobile Home / Other | 977 | 18.7% |
| Total | 5,224 | 100.0% |
Housing Structures by Occupancy in Howard County

| Structure Type | Owner-occupied | Renter-occupied |
| Single Unit, Detached | 3,176 (80.7%) | 761 (19.3%) |
| Single Unit, Attached | 35 (81.4%) | 8 (18.6%) |
| 2 Unit Apartments | 0 (0.0%) | 104 (100.0%) |
| 3 or 4 Unit Apartments | 2 (2.8%) | 70 (97.2%) |
| 5 to 9 Unit Apartments | 11 (17.5%) | 52 (82.5%) |
| 10 or more Apartments | 0 (0.0%) | 28 (100.0%) |
| Mobile Home / Other | 568 (58.1%) | 409 (41.9%) |
| Total | 3,792 (72.6%) | 1,432 (27.4%) |
Housing Structures by Number of Rooms in Howard County

| Number of Rooms | Owner-occupied | Renter-occupied |
| 1 Room | 97 (2.6%) | 0 (0.0%) |
| 2 or 3 Rooms | 99 (2.6%) | 184 (12.9%) |
| 4 or 5 Rooms | 1,288 (34.0%) | 827 (57.8%) |
| 6 or 7 Rooms | 1,283 (33.8%) | 388 (27.1%) |
| 8 or more Rooms | 1,025 (27.0%) | 33 (2.3%) |
| Total | 3,792 (100.0%) | 1,432 (100.0%) |
Housing Structure by Heating Type in Howard County

| Heating Type | Owner-occupied | Renter-occupied |
| Utility Gas | 1,152 (30.4%) | 430 (30.0%) |
| Bottled, Tank, or LP Gas | 129 (3.4%) | 49 (3.4%) |
| Electricity | 2,277 (60.1%) | 856 (59.8%) |
| Fuel Oil or Kerosene | 0 (0.0%) | 0 (0.0%) |
| Coal or Coke | 0 (0.0%) | 0 (0.0%) |
| All other Fuels | 213 (5.6%) | 89 (6.2%) |
| No Fuel Used | 21 (0.5%) | 8 (0.6%) |
| Total | 3,792 (100.0%) | 1,432 (100.0%) |
Household Vehicle Usage in Howard County

| Vehicles per Household | Owner-occupied | Renter-occupied |
| No Vehicle | 112 (2.9%) | 119 (8.3%) |
| 1 Vehicle | 809 (21.3%) | 800 (55.9%) |
| 2 Vehicles | 1,481 (39.1%) | 336 (23.5%) |
| 3 or more Vehicles | 1,390 (36.7%) | 177 (12.4%) |
| Total | 3,792 (100.0%) | 1,432 (100.0%) |
Real Estate & Mortgages in Howard County
Real Estate and Mortgage Overview in Howard County
| Characteristic | Without Mortgage | With Mortgage |
| Housing Units | 2,344 | 1,448 |
| Median Property Value | $109,200 | $141,000 |
| Median Household Income | $48,017 | $129 |
| Monthly Housing Costs | $379 | $48 |
| Real Estate Taxes | $567 | $86 |
Property Value by Mortgage Status in Howard County
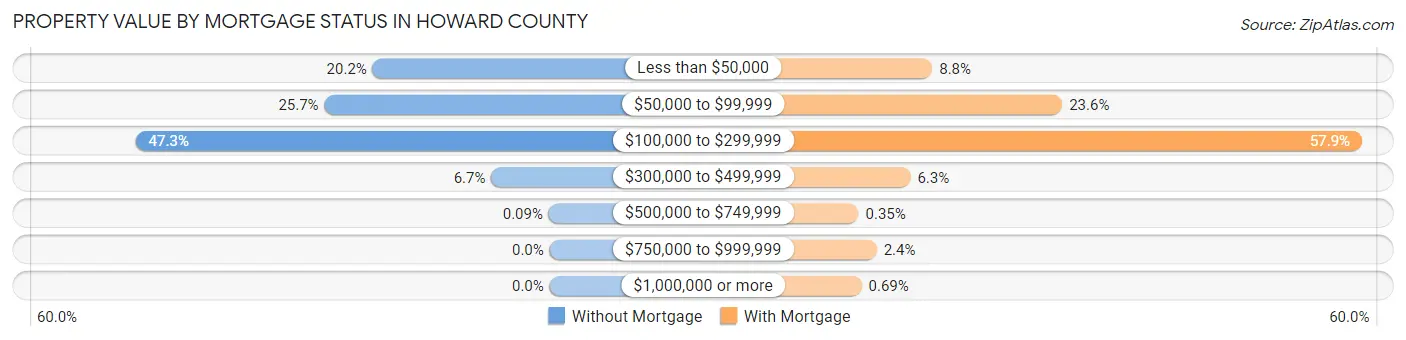
| Property Value | Without Mortgage | With Mortgage |
| Less than $50,000 | 474 (20.2%) | 127 (8.8%) |
| $50,000 to $99,999 | 603 (25.7%) | 342 (23.6%) |
| $100,000 to $299,999 | 1,109 (47.3%) | 838 (57.9%) |
| $300,000 to $499,999 | 156 (6.7%) | 91 (6.3%) |
| $500,000 to $749,999 | 2 (0.1%) | 5 (0.4%) |
| $750,000 to $999,999 | 0 (0.0%) | 35 (2.4%) |
| $1,000,000 or more | 0 (0.0%) | 10 (0.7%) |
| Total | 2,344 (100.0%) | 1,448 (100.0%) |
Household Income by Mortgage Status in Howard County

| Household Income | Without Mortgage | With Mortgage |
| Less than $10,000 | 76 (3.2%) | 0 (0.0%) |
| $10,000 to $24,999 | 430 (18.3%) | 54 (3.7%) |
| $25,000 to $34,999 | 368 (15.7%) | 188 (13.0%) |
| $35,000 to $49,999 | 321 (13.7%) | 130 (9.0%) |
| $50,000 to $74,999 | 583 (24.9%) | 110 (7.6%) |
| $75,000 to $99,999 | 259 (11.1%) | 259 (17.9%) |
| $100,000 to $149,999 | 168 (7.2%) | 243 (16.8%) |
| $150,000 or more | 139 (5.9%) | 335 (23.1%) |
| Total | 2,344 (100.0%) | 1,448 (100.0%) |
Property Value to Household Income Ratio in Howard County
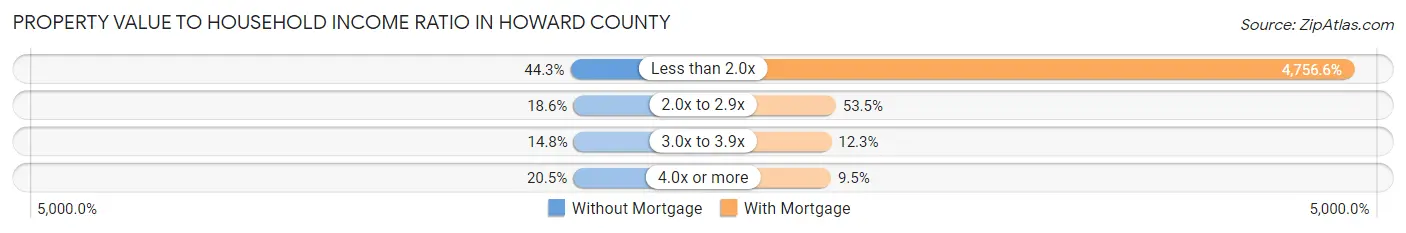
| Value-to-Income Ratio | Without Mortgage | With Mortgage |
| Less than 2.0x | 1,038 (44.3%) | 68,875 (4,756.6%) |
| 2.0x to 2.9x | 435 (18.6%) | 774 (53.4%) |
| 3.0x to 3.9x | 347 (14.8%) | 178 (12.3%) |
| 4.0x or more | 481 (20.5%) | 137 (9.5%) |
| Total | 2,344 (100.0%) | 1,448 (100.0%) |
Real Estate Taxes by Mortgage Status in Howard County

| Property Taxes | Without Mortgage | With Mortgage |
| Less than $800 | 1,071 (45.7%) | 8 (0.5%) |
| $800 to $1,499 | 422 (18.0%) | 725 (50.1%) |
| $800 to $1,499 | 229 (9.8%) | 395 (27.3%) |
| Total | 2,344 (100.0%) | 1,448 (100.0%) |
Health & Disability in Howard County
Health Insurance Coverage by Age in Howard County

| Age Bracket | With Coverage | Without Coverage |
| Under 6 Years | 897 (91.4%) | 84 (8.6%) |
| 6 to 18 Years | 2,139 (84.5%) | 394 (15.5%) |
| 19 to 25 Years | 642 (81.8%) | 143 (18.2%) |
| 26 to 34 Years | 968 (82.8%) | 201 (17.2%) |
| 35 to 44 Years | 1,439 (69.6%) | 629 (30.4%) |
| 45 to 54 Years | 1,232 (98.5%) | 19 (1.5%) |
| 55 to 64 Years | 1,541 (94.1%) | 97 (5.9%) |
| 65 to 74 Years | 1,260 (100.0%) | 0 (0.0%) |
| 75 Years and older | 916 (100.0%) | 0 (0.0%) |
| Total | 11,034 (87.6%) | 1,567 (12.4%) |
Health Insurance Coverage by Citizenship Status in Howard County

| Citizenship Status | With Coverage | Without Coverage |
| Native Born | 897 (91.4%) | 84 (8.6%) |
| Foreign Born, Citizen | 2,139 (84.5%) | 394 (15.5%) |
| Foreign Born, not a Citizen | 642 (81.8%) | 143 (18.2%) |
Health Insurance Coverage by Household Income in Howard County

| Household Income | With Coverage | Without Coverage |
| Under $25,000 | 2,258 (86.9%) | 340 (13.1%) |
| $25,000 to $49,999 | 2,521 (86.5%) | 394 (13.5%) |
| $50,000 to $74,999 | 2,195 (82.8%) | 455 (17.2%) |
| $75,000 to $99,999 | 1,479 (98.1%) | 28 (1.9%) |
| $100,000 and over | 2,571 (88.0%) | 350 (12.0%) |
Public vs Private Health Insurance Coverage by Age in Howard County

| Age Bracket | Public Insurance | Private Insurance |
| Under 6 | 587 (59.8%) | 357 (36.4%) |
| 6 to 18 Years | 1,460 (57.6%) | 737 (29.1%) |
| 19 to 25 Years | 338 (43.1%) | 315 (40.1%) |
| 25 to 34 Years | 187 (16.0%) | 830 (71.0%) |
| 35 to 44 Years | 485 (23.4%) | 1,018 (49.2%) |
| 45 to 54 Years | 327 (26.1%) | 982 (78.5%) |
| 55 to 64 Years | 597 (36.4%) | 1,060 (64.7%) |
| 65 to 74 Years | 1,169 (92.8%) | 737 (58.5%) |
| 75 Years and over | 916 (100.0%) | 667 (72.8%) |
| Total | 6,066 (48.1%) | 6,703 (53.2%) |
Disability Status by Sex by Age in Howard County

| Age Bracket | Male | Female |
| Under 5 Years | 0 (0.0%) | 0 (0.0%) |
| 5 to 17 Years | 83 (6.8%) | 172 (14.1%) |
| 18 to 34 Years | 171 (15.4%) | 66 (6.3%) |
| 35 to 64 Years | 304 (13.3%) | 416 (15.6%) |
| 65 to 74 Years | 329 (54.8%) | 263 (39.9%) |
| 75 Years and over | 285 (70.2%) | 229 (44.9%) |
Disability Class by Sex by Age in Howard County
Disability Class: Hearing Difficulty

| Age Bracket | Male | Female |
| Under 5 Years | 0 (0.0%) | 0 (0.0%) |
| 5 to 17 Years | 12 (1.0%) | 0 (0.0%) |
| 18 to 34 Years | 90 (8.1%) | 11 (1.1%) |
| 35 to 64 Years | 93 (4.1%) | 16 (0.6%) |
| 65 to 74 Years | 229 (38.2%) | 16 (2.4%) |
| 75 Years and over | 230 (56.7%) | 60 (11.8%) |
Disability Class: Vision Difficulty

| Age Bracket | Male | Female |
| Under 5 Years | 0 (0.0%) | 0 (0.0%) |
| 5 to 17 Years | 0 (0.0%) | 62 (5.1%) |
| 18 to 34 Years | 6 (0.5%) | 14 (1.3%) |
| 35 to 64 Years | 36 (1.6%) | 96 (3.6%) |
| 65 to 74 Years | 2 (0.3%) | 60 (9.1%) |
| 75 Years and over | 144 (35.5%) | 31 (6.1%) |
Disability Class: Cognitive Difficulty

| Age Bracket | Male | Female |
| 5 to 17 Years | 71 (5.8%) | 111 (9.1%) |
| 18 to 34 Years | 75 (6.8%) | 38 (3.6%) |
| 35 to 64 Years | 127 (5.6%) | 157 (5.9%) |
| 65 to 74 Years | 120 (20.0%) | 42 (6.4%) |
| 75 Years and over | 0 (0.0%) | 33 (6.5%) |
Disability Class: Ambulatory Difficulty

| Age Bracket | Male | Female |
| 5 to 17 Years | 0 (0.0%) | 0 (0.0%) |
| 18 to 34 Years | 0 (0.0%) | 12 (1.1%) |
| 35 to 64 Years | 143 (6.3%) | 247 (9.2%) |
| 65 to 74 Years | 182 (30.3%) | 166 (25.2%) |
| 75 Years and over | 149 (36.7%) | 195 (38.2%) |
Disability Class: Self-Care Difficulty
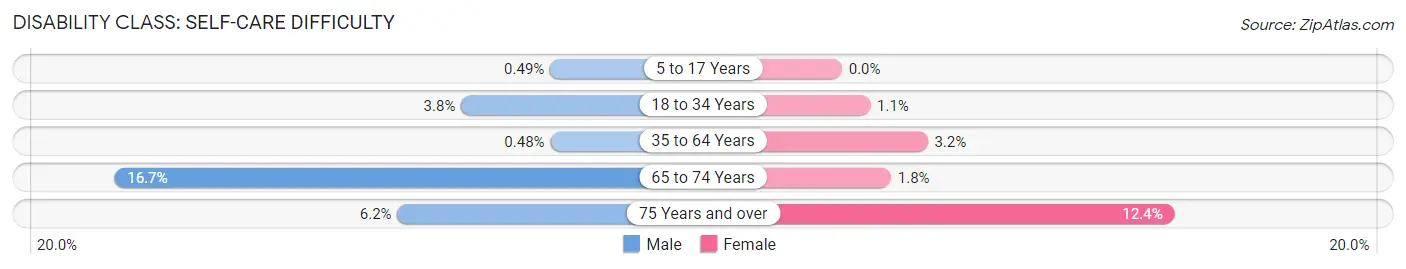
| Age Bracket | Male | Female |
| 5 to 17 Years | 6 (0.5%) | 0 (0.0%) |
| 18 to 34 Years | 42 (3.8%) | 11 (1.1%) |
| 35 to 64 Years | 11 (0.5%) | 85 (3.2%) |
| 65 to 74 Years | 100 (16.7%) | 12 (1.8%) |
| 75 Years and over | 25 (6.2%) | 63 (12.3%) |
Technology Access in Howard County
Computing Device Access in Howard County

| Device Type | # Households | % Households |
| Desktop or Laptop | 3,004 | 57.5% |
| Smartphone | 4,249 | 81.3% |
| Tablet | 2,498 | 47.8% |
| No Computing Device | 578 | 11.1% |
| Total | 5,224 | 100.0% |
Internet Access in Howard County
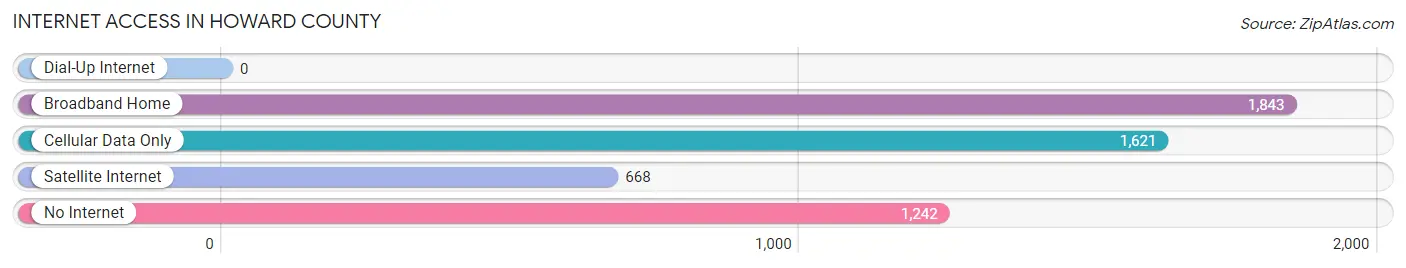
| Internet Type | # Households | % Households |
| Dial-Up Internet | 0 | 0.0% |
| Broadband Home | 1,843 | 35.3% |
| Cellular Data Only | 1,621 | 31.0% |
| Satellite Internet | 668 | 12.8% |
| No Internet | 1,242 | 23.8% |
| Total | 5,224 | 100.0% |
Howard County Summary
Howard County is located in the southwestern corner of Arkansas, and is bordered by Miller, Hempstead, Little River, Sevier, and Pike counties. The county seat is Nashville, and the county has a total area of 602 square miles. According to the 2010 census, the population of Howard County was 13,789, with a population density of 23 people per square mile.
History
Howard County was established in 1873, and was named after James Howard, a Confederate general who was killed in the Battle of Jenkins Ferry. The county was originally part of Sevier County, and was created from parts of Hempstead, Little River, and Sevier counties.
The first settlers in the area were Native Americans, who were later displaced by European settlers. The first European settlers in the area were mostly farmers, who were attracted to the area by the fertile soil and abundant natural resources.
The county was largely agricultural until the early 20th century, when the timber industry began to take off. The timber industry was a major source of employment for the county, and it helped to spur economic growth in the area.
Geography
Howard County is located in the southwestern corner of Arkansas, and is bordered by Miller, Hempstead, Little River, Sevier, and Pike counties. The county has a total area of 602 square miles, and is mostly rural. The terrain is mostly flat, with some rolling hills in the northern part of the county. The county is drained by the Little Missouri River, which flows through the county from north to south.
The climate of Howard County is humid subtropical, with hot, humid summers and mild winters. The average annual temperature is around 64 degrees Fahrenheit, and the average annual precipitation is around 48 inches.
Economy
The economy of Howard County is largely based on agriculture and timber. The county is home to several large timber companies, and the timber industry is a major source of employment for the county. The county is also home to several large poultry farms, and poultry is a major source of income for the county.
In addition to agriculture and timber, Howard County is home to several manufacturing companies, including a furniture manufacturer, a plastics manufacturer, and a paper mill. The county is also home to several retail stores, including a Walmart Supercenter.
Demographics
According to the 2010 census, the population of Howard County was 13,789, with a population density of 23 people per square mile. The racial makeup of the county was 87.3% White, 9.3% Black or African American, 0.7% Native American, 0.3% Asian, 0.1% Pacific Islander, 0.7% from other races, and 1.6% from two or more races. Hispanic or Latino of any race were 2.2% of the population.
The median income for a household in the county was $30,945, and the median income for a family was $37,945. The per capita income for the county was $16,845. About 17.2% of the population was below the poverty line.
Common Questions
What is the Total Population of Howard County?
Total Population of Howard County is 12,779.
What is the Total Male Population of Howard County?
Total Male Population of Howard County is 6,099.
What is the Total Female Population of Howard County?
Total Female Population of Howard County is 6,680.
What is the Ratio of Males per 100 Females in Howard County?
There are 91.30 Males per 100 Females in Howard County.
What is the Ratio of Females per 100 Males in Howard County?
There are 109.53 Females per 100 Males in Howard County.
What is the Median Population Age in Howard County?
Median Population Age in Howard County is 39.7 Years.
What is the Average Family Size in Howard County
Average Family Size in Howard County is 3.0 People.
What is the Average Household Size in Howard County
Average Household Size in Howard County is 2.4 People.
What is Per Capita Income in Howard County?
Per Capita income in Howard County is $25,458.
What is the Median Family Income in Howard County?
Median Family Income in Howard County is $56,071.
What is the Median Household income in Howard County?
Median Household Income in Howard County is $44,824.
What is Income or Wage Gap in Howard County?
Income or Wage Gap in Howard County is 17.7%.
Women in Howard County earn 82.3 cents for every dollar earned by a man.
What is Family Income Deficit in Howard County?
Family Income Deficit in Howard County is $10,176.
Families that are below poverty line in Howard County earn $10,176 less on average than the poverty threshold level.
What is Inequality or Gini Index in Howard County?
Inequality or Gini Index in Howard County is 0.45.
How Large is the Labor Force in Howard County?
There are 5,700 People in the Labor Forcein in Howard County.
What is the Percentage of People in the Labor Force in Howard County?
57.5% of People are in the Labor Force in Howard County.
What is the Unemployment Rate in Howard County?
Unemployment Rate in Howard County is 6.4%.