Greene County, AR
Greene County Map
Greene County Overview
45,954
TOTAL POPULATION
22,749
MALE POPULATION
23,205
FEMALE POPULATION
98.03
MALES / 100 FEMALES
102.00
FEMALES / 100 MALES
37.8
MEDIAN AGE
3.0
AVG FAMILY SIZE
2.5
AVG HOUSEHOLD SIZE
$26,941
PER CAPITA INCOME
$63,750
AVG FAMILY INCOME
$54,879
AVG HOUSEHOLD INCOME
26.9%
WAGE / INCOME GAP [ % ]
73.1¢/ $1
WAGE / INCOME GAP [ $ ]
$11,569
FAMILY INCOME DEFICIT
0.43
INEQUALITY / GINI INDEX
21,578
LABOR FORCE [ PEOPLE ]
59.4%
PERCENT IN LABOR FORCE
7.5%
UNEMPLOYMENT RATE
Greene County Area Codes
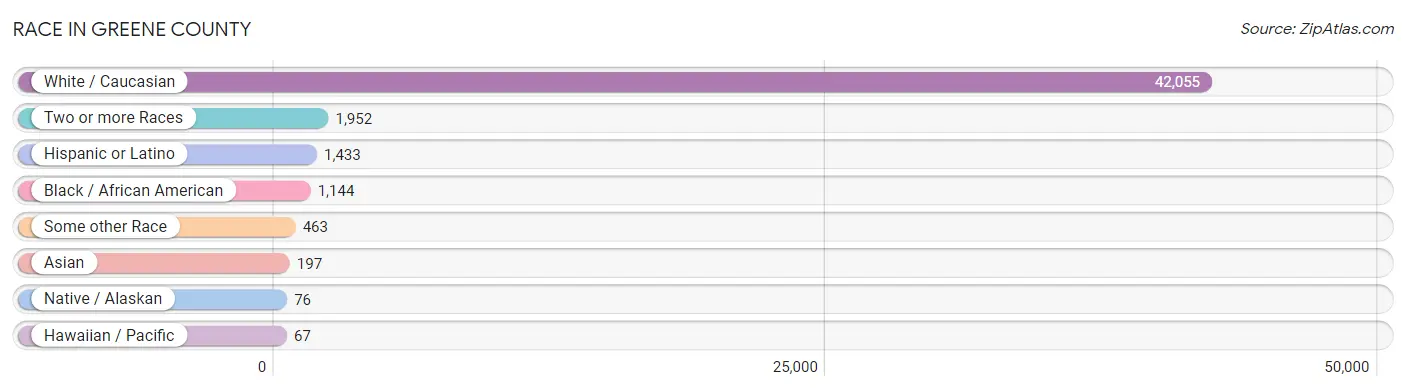
Race in Greene County
The most populous races in Greene County are White / Caucasian (42,055 | 91.5%), Two or more Races (1,952 | 4.3%), and Hispanic or Latino (1,433 | 3.1%).
| Race | # Population | % Population |
| Asian | 197 | 0.4% |
| Black / African American | 1,144 | 2.5% |
| Hawaiian / Pacific | 67 | 0.2% |
| Hispanic or Latino | 1,433 | 3.1% |
| Native / Alaskan | 76 | 0.2% |
| White / Caucasian | 42,055 | 91.5% |
| Two or more Races | 1,952 | 4.3% |
| Some other Race | 463 | 1.0% |
| Total | 45,954 | 100.0% |
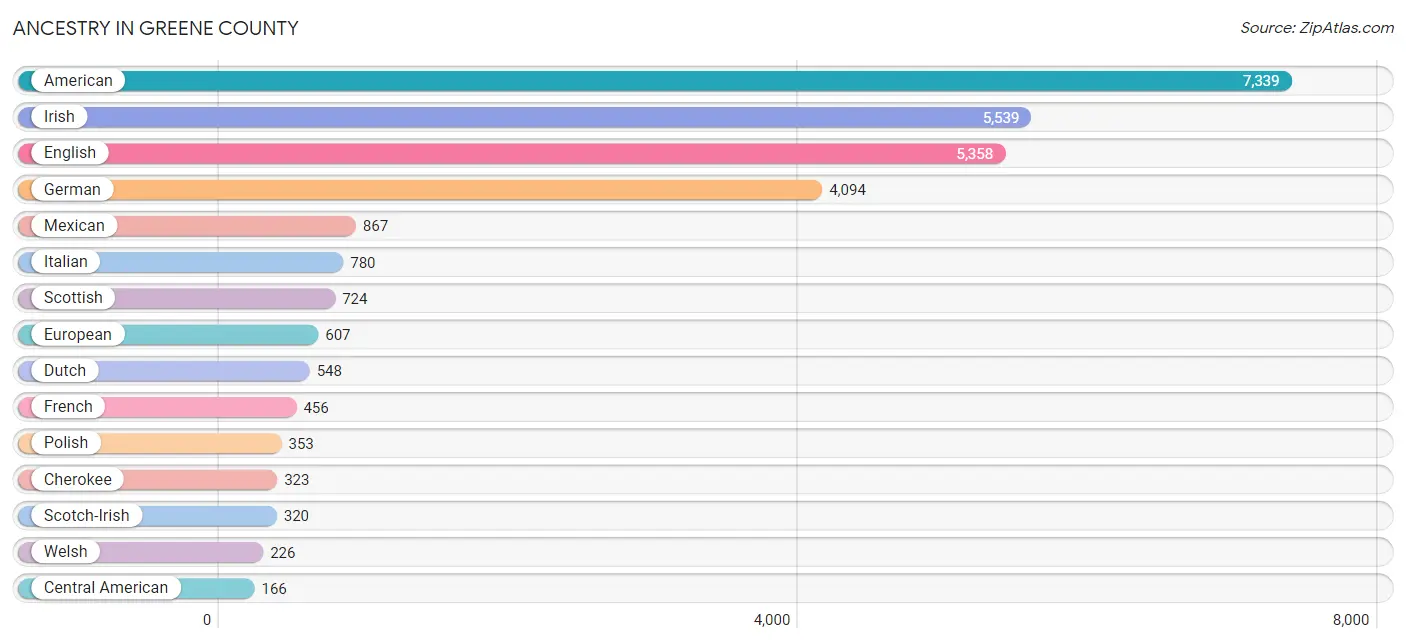
Ancestry in Greene County
The most populous ancestries reported in Greene County are American (7,339 | 16.0%), Irish (5,539 | 12.0%), English (5,358 | 11.7%), German (4,094 | 8.9%), and Mexican (867 | 1.9%), together accounting for 50.5% of all Greene County residents.
| Ancestry | # Population | % Population |
| African | 18 | 0.0% |
| Alaskan Athabascan | 3 | 0.0% |
| American | 7,339 | 16.0% |
| Apache | 16 | 0.0% |
| Arab | 38 | 0.1% |
| Australian | 26 | 0.1% |
| Bhutanese | 22 | 0.1% |
| Blackfeet | 39 | 0.1% |
| British | 62 | 0.1% |
| Canadian | 48 | 0.1% |
| Central American | 166 | 0.4% |
| Cherokee | 323 | 0.7% |
| Choctaw | 43 | 0.1% |
| Crow | 11 | 0.0% |
| Cuban | 34 | 0.1% |
| Czech | 11 | 0.0% |
| Danish | 110 | 0.2% |
| Dutch | 548 | 1.2% |
| Dutch West Indian | 59 | 0.1% |
| Eastern European | 67 | 0.2% |
| English | 5,358 | 11.7% |
| European | 607 | 1.3% |
| French | 456 | 1.0% |
| French Canadian | 87 | 0.2% |
| German | 4,094 | 8.9% |
| Greek | 43 | 0.1% |
| Guatemalan | 118 | 0.3% |
| Haitian | 11 | 0.0% |
| Hungarian | 37 | 0.1% |
| Indian (Asian) | 85 | 0.2% |
| Irish | 5,539 | 12.0% |
| Italian | 780 | 1.7% |
| Korean | 25 | 0.1% |
| Lebanese | 38 | 0.1% |
| Marshallese | 67 | 0.2% |
| Mexican | 867 | 1.9% |
| Navajo | 10 | 0.0% |
| Northern European | 46 | 0.1% |
| Norwegian | 111 | 0.2% |
| Pennsylvania German | 30 | 0.1% |
| Peruvian | 33 | 0.1% |
| Polish | 353 | 0.8% |
| Portuguese | 7 | 0.0% |
| Puerto Rican | 163 | 0.4% |
| Russian | 71 | 0.2% |
| Salvadoran | 48 | 0.1% |
| Scandinavian | 52 | 0.1% |
| Scotch-Irish | 320 | 0.7% |
| Scottish | 724 | 1.6% |
| Sioux | 5 | 0.0% |
| Slovak | 10 | 0.0% |
| South American | 33 | 0.1% |
| Spaniard | 22 | 0.1% |
| Spanish | 75 | 0.2% |
| Subsaharan African | 18 | 0.0% |
| Swedish | 81 | 0.2% |
| Swiss | 11 | 0.0% |
| Ukrainian | 42 | 0.1% |
| Welsh | 226 | 0.5% | View All 59 Rows |
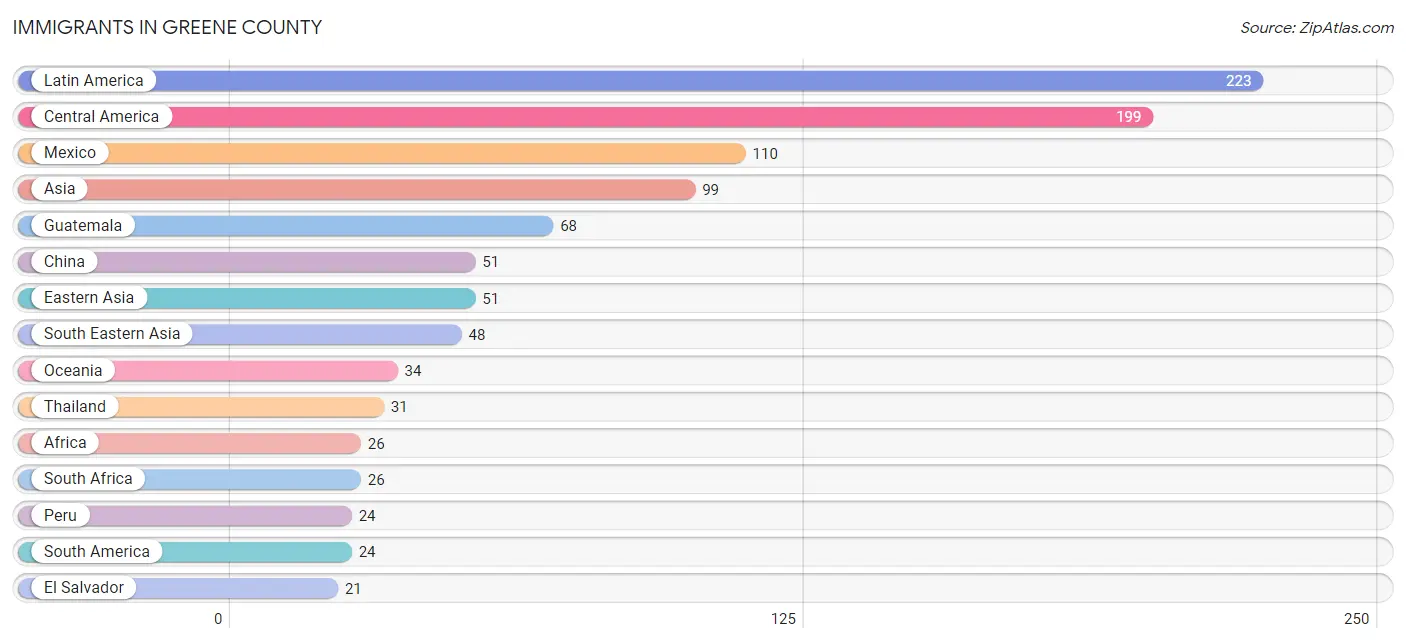
Immigrants in Greene County
The most numerous immigrant groups reported in Greene County came from Latin America (223 | 0.5%), Central America (199 | 0.4%), Mexico (110 | 0.2%), Asia (99 | 0.2%), and Guatemala (68 | 0.2%), together accounting for 1.5% of all Greene County residents.
| Immigration Origin | # Population | % Population |
| Africa | 26 | 0.1% |
| Asia | 99 | 0.2% |
| Australia | 13 | 0.0% |
| Canada | 5 | 0.0% |
| Central America | 199 | 0.4% |
| China | 51 | 0.1% |
| Eastern Asia | 51 | 0.1% |
| El Salvador | 21 | 0.1% |
| Europe | 15 | 0.0% |
| Guatemala | 68 | 0.2% |
| Latin America | 223 | 0.5% |
| Mexico | 110 | 0.2% |
| Micronesia | 21 | 0.1% |
| Northern Europe | 15 | 0.0% |
| Oceania | 34 | 0.1% |
| Peru | 24 | 0.1% |
| Philippines | 17 | 0.0% |
| South Africa | 26 | 0.1% |
| South America | 24 | 0.1% |
| South Eastern Asia | 48 | 0.1% |
| Thailand | 31 | 0.1% | View All 21 Rows |
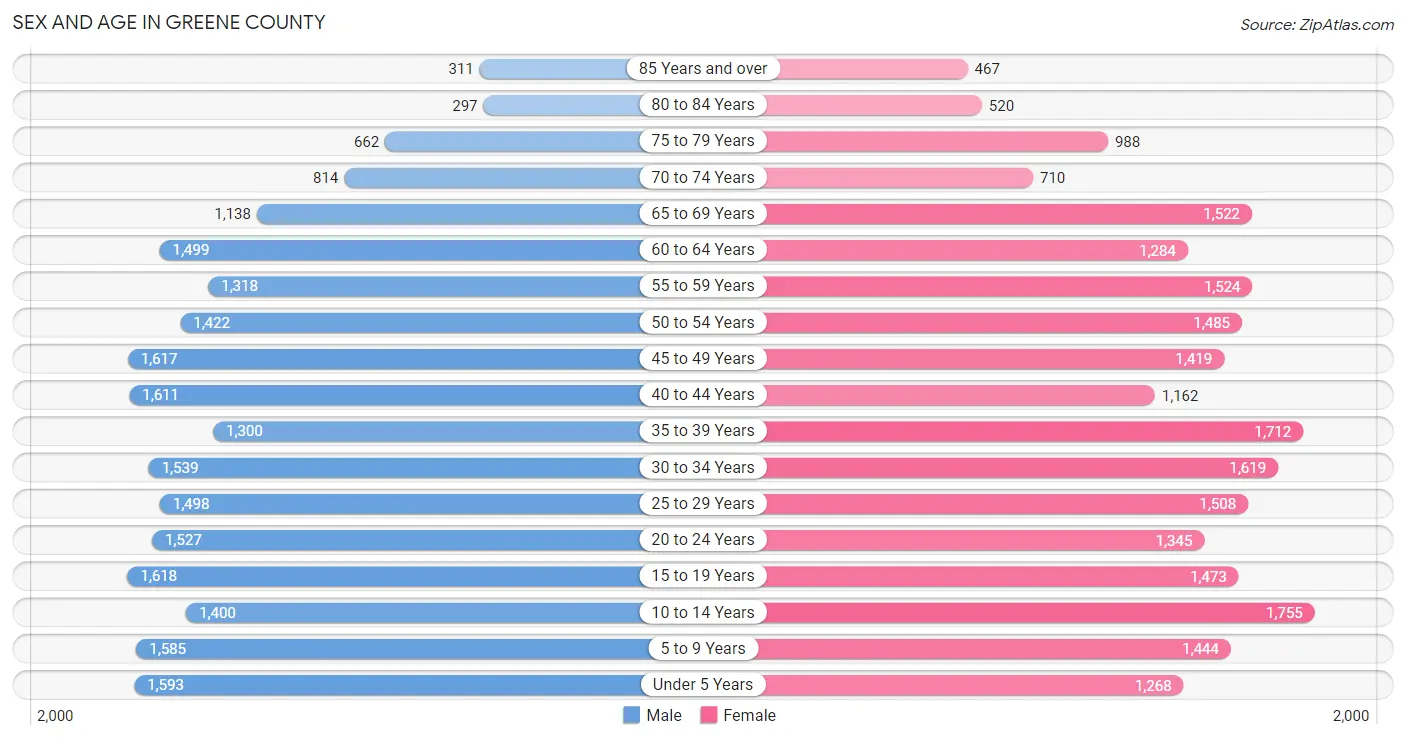
Sex and Age in Greene County
Sex and Age in Greene County
The most populous age groups in Greene County are 15 to 19 Years (1,618 | 7.1%) for men and 10 to 14 Years (1,755 | 7.6%) for women.
| Age Bracket | Male | Female |
| Under 5 Years | 1,593 (7.0%) | 1,268 (5.5%) |
| 5 to 9 Years | 1,585 (7.0%) | 1,444 (6.2%) |
| 10 to 14 Years | 1,400 (6.1%) | 1,755 (7.6%) |
| 15 to 19 Years | 1,618 (7.1%) | 1,473 (6.4%) |
| 20 to 24 Years | 1,527 (6.7%) | 1,345 (5.8%) |
| 25 to 29 Years | 1,498 (6.6%) | 1,508 (6.5%) |
| 30 to 34 Years | 1,539 (6.8%) | 1,619 (7.0%) |
| 35 to 39 Years | 1,300 (5.7%) | 1,712 (7.4%) |
| 40 to 44 Years | 1,611 (7.1%) | 1,162 (5.0%) |
| 45 to 49 Years | 1,617 (7.1%) | 1,419 (6.1%) |
| 50 to 54 Years | 1,422 (6.2%) | 1,485 (6.4%) |
| 55 to 59 Years | 1,318 (5.8%) | 1,524 (6.6%) |
| 60 to 64 Years | 1,499 (6.6%) | 1,284 (5.5%) |
| 65 to 69 Years | 1,138 (5.0%) | 1,522 (6.6%) |
| 70 to 74 Years | 814 (3.6%) | 710 (3.1%) |
| 75 to 79 Years | 662 (2.9%) | 988 (4.3%) |
| 80 to 84 Years | 297 (1.3%) | 520 (2.2%) |
| 85 Years and over | 311 (1.4%) | 467 (2.0%) |
| Total | 22,749 (100.0%) | 23,205 (100.0%) |
Families and Households in Greene County
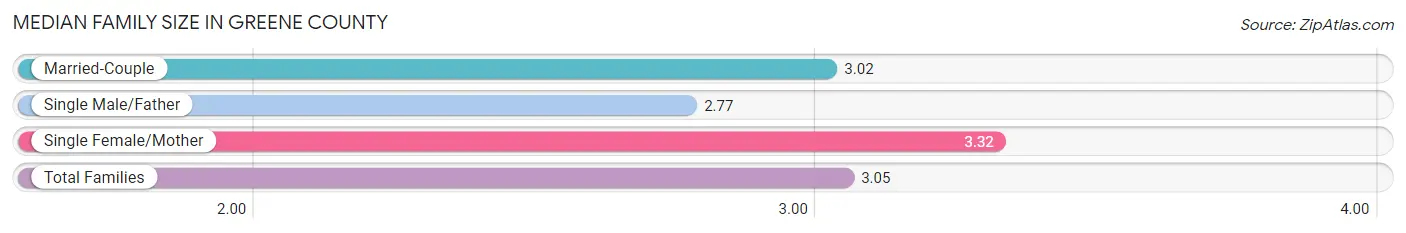
Median Family Size in Greene County
The median family size in Greene County is 3.05 persons per family, with single female/mother families (2,305 | 19.0%) accounting for the largest median family size of 3.32 persons per family. On the other hand, single male/father families (1,284 | 10.6%) represent the smallest median family size with 2.77 persons per family.
| Family Type | # Families | Family Size |
| Married-Couple | 8,546 (70.4%) | 3.02 |
| Single Male/Father | 1,284 (10.6%) | 2.77 |
| Single Female/Mother | 2,305 (19.0%) | 3.32 |
| Total Families | 12,135 (100.0%) | 3.05 |
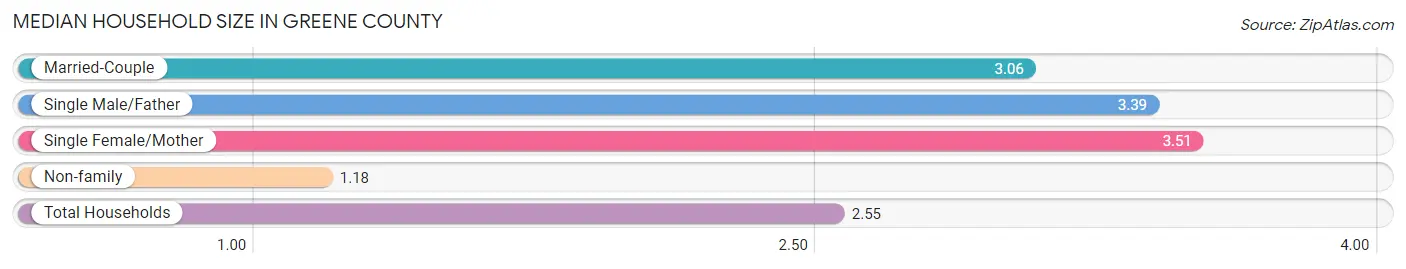
Median Household Size in Greene County
The median household size in Greene County is 2.55 persons per household, with single female/mother households (2,305 | 13.0%) accounting for the largest median household size of 3.51 persons per household. non-family households (5,606 | 31.6%) represent the smallest median household size with 1.18 persons per household.
| Household Type | # Households | Household Size |
| Married-Couple | 8,546 (48.2%) | 3.06 |
| Single Male/Father | 1,284 (7.2%) | 3.39 |
| Single Female/Mother | 2,305 (13.0%) | 3.51 |
| Non-family | 5,606 (31.6%) | 1.18 |
| Total Households | 17,741 (100.0%) | 2.55 |
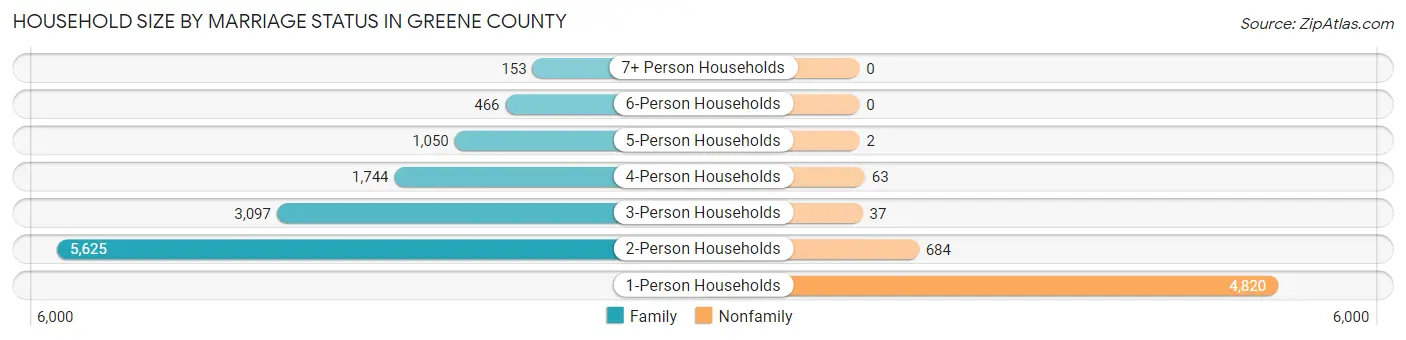
Household Size by Marriage Status in Greene County
Out of a total of 17,741 households in Greene County, 12,135 (68.4%) are family households, while 5,606 (31.6%) are nonfamily households. The most numerous type of family households are 2-person households, comprising 5,625, and the most common type of nonfamily households are 1-person households, comprising 4,820.
| Household Size | Family Households | Nonfamily Households |
| 1-Person Households | - | 4,820 (27.2%) |
| 2-Person Households | 5,625 (31.7%) | 684 (3.9%) |
| 3-Person Households | 3,097 (17.5%) | 37 (0.2%) |
| 4-Person Households | 1,744 (9.8%) | 63 (0.4%) |
| 5-Person Households | 1,050 (5.9%) | 2 (0.0%) |
| 6-Person Households | 466 (2.6%) | 0 (0.0%) |
| 7+ Person Households | 153 (0.9%) | 0 (0.0%) |
| Total | 12,135 (68.4%) | 5,606 (31.6%) |
Female Fertility in Greene County
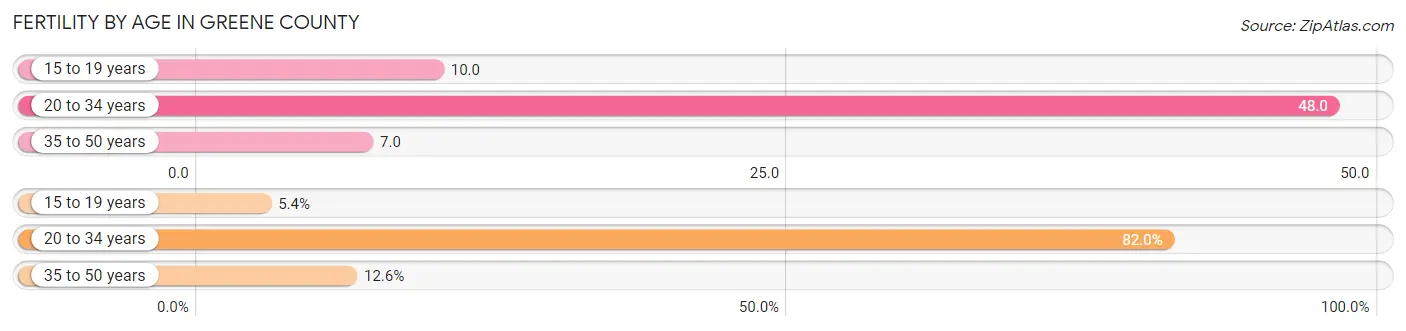
Fertility by Age in Greene County
Average fertility rate in Greene County is 25.0 births per 1,000 women. Women in the age bracket of 20 to 34 years have the highest fertility rate with 48.0 births per 1,000 women. Women in the age bracket of 20 to 34 years acount for 82.0% of all women with births.
| Age Bracket | Women with Births | Births / 1,000 Women |
| 15 to 19 years | 14 (5.4%) | 10.0 |
| 20 to 34 years | 214 (82.0%) | 48.0 |
| 35 to 50 years | 33 (12.6%) | 7.0 |
| Total | 261 (100.0%) | 25.0 |
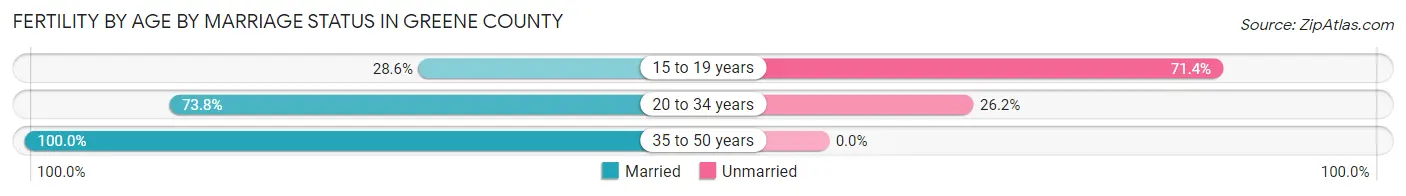
Fertility by Age by Marriage Status in Greene County
74.7% of women with births (261) in Greene County are married. The highest percentage of unmarried women with births falls into 15 to 19 years age bracket with 71.4% of them unmarried at the time of birth, while the lowest percentage of unmarried women with births belong to 35 to 50 years age bracket with 0.0% of them unmarried.
| Age Bracket | Married | Unmarried |
| 15 to 19 years | 4 (28.6%) | 10 (71.4%) |
| 20 to 34 years | 158 (73.8%) | 56 (26.2%) |
| 35 to 50 years | 33 (100.0%) | 0 (0.0%) |
| Total | 195 (74.7%) | 66 (25.3%) |
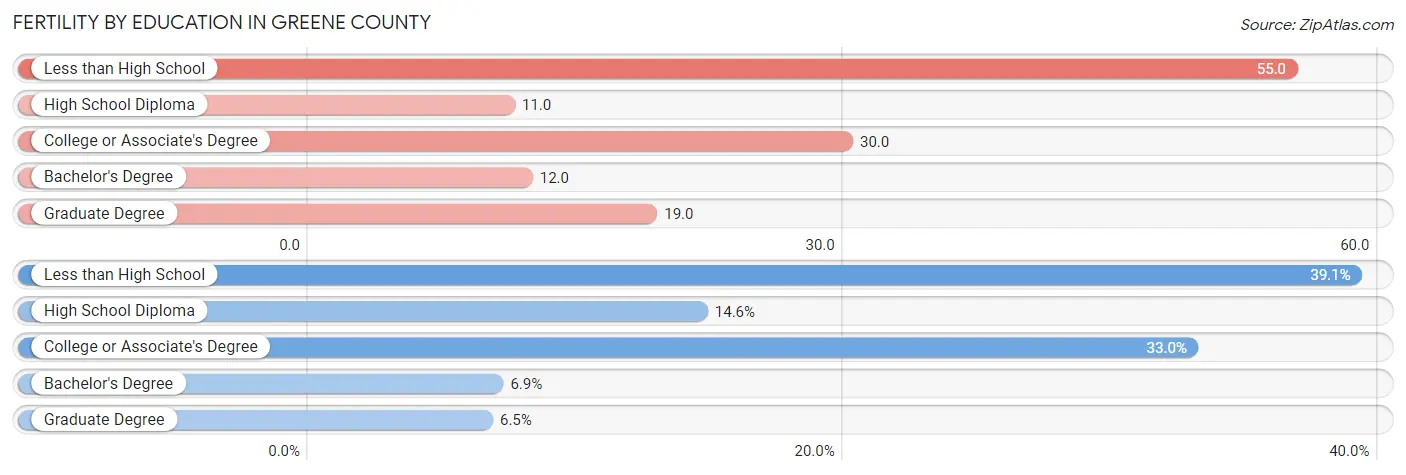
Fertility by Education in Greene County
Average fertility rate in Greene County is 25.0 births per 1,000 women. Women with the education attainment of less than high school have the highest fertility rate of 55.0 births per 1,000 women, while women with the education attainment of high school diploma have the lowest fertility at 11.0 births per 1,000 women. Women with the education attainment of less than high school represent 39.1% of all women with births.
| Educational Attainment | Women with Births | Births / 1,000 Women |
| Less than High School | 102 (39.1%) | 55.0 |
| High School Diploma | 38 (14.6%) | 11.0 |
| College or Associate's Degree | 86 (33.0%) | 30.0 |
| Bachelor's Degree | 18 (6.9%) | 12.0 |
| Graduate Degree | 17 (6.5%) | 19.0 |
| Total | 261 (100.0%) | 25.0 |
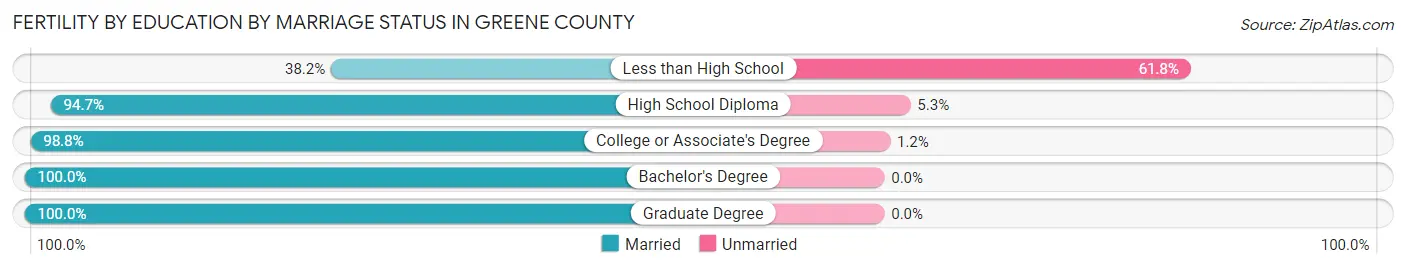
Fertility by Education by Marriage Status in Greene County
25.3% of women with births in Greene County are unmarried. Women with the educational attainment of bachelor's degree are most likely to be married with 100.0% of them married at childbirth, while women with the educational attainment of less than high school are least likely to be married with 61.8% of them unmarried at childbirth.
| Educational Attainment | Married | Unmarried |
| Less than High School | 39 (38.2%) | 63 (61.8%) |
| High School Diploma | 36 (94.7%) | 2 (5.3%) |
| College or Associate's Degree | 85 (98.8%) | 1 (1.2%) |
| Bachelor's Degree | 18 (100.0%) | 0 (0.0%) |
| Graduate Degree | 17 (100.0%) | 0 (0.0%) |
| Total | 195 (74.7%) | 66 (25.3%) |
Income in Greene County
Income Overview in Greene County
Per Capita Income in Greene County is $26,941, while median incomes of families and households are $63,750 and $54,879 respectively.
| Characteristic | Number | Measure |
| Per Capita Income | 45,954 | $26,941 |
| Median Family Income | 12,135 | $63,750 |
| Mean Family Income | 12,135 | $78,208 |
| Median Household Income | 17,741 | $54,879 |
| Mean Household Income | 17,741 | $67,548 |
| Income Deficit | 12,135 | $11,569 |
| Wage / Income Gap (%) | 45,954 | 26.90% |
| Wage / Income Gap ($) | 45,954 | 73.10¢ per $1 |
| Gini / Inequality Index | 45,954 | 0.43 |
Earnings by Sex in Greene County
Average Earnings in Greene County are $34,218, $38,839 for men and $28,391 for women, a difference of 26.9%.
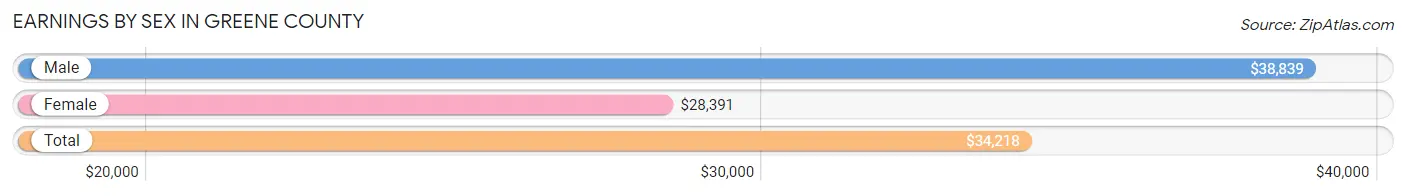
| Sex | Number | Average Earnings |
| Male | 12,090 (53.5%) | $38,839 |
| Female | 10,507 (46.5%) | $28,391 |
| Total | 22,597 (100.0%) | $34,218 |
Earnings by Sex by Income Bracket in Greene County
The most common earnings brackets in Greene County are $75,000 to $99,999 for men (1,185 | 9.8%) and $25,000 to $29,999 for women (1,049 | 10.0%).
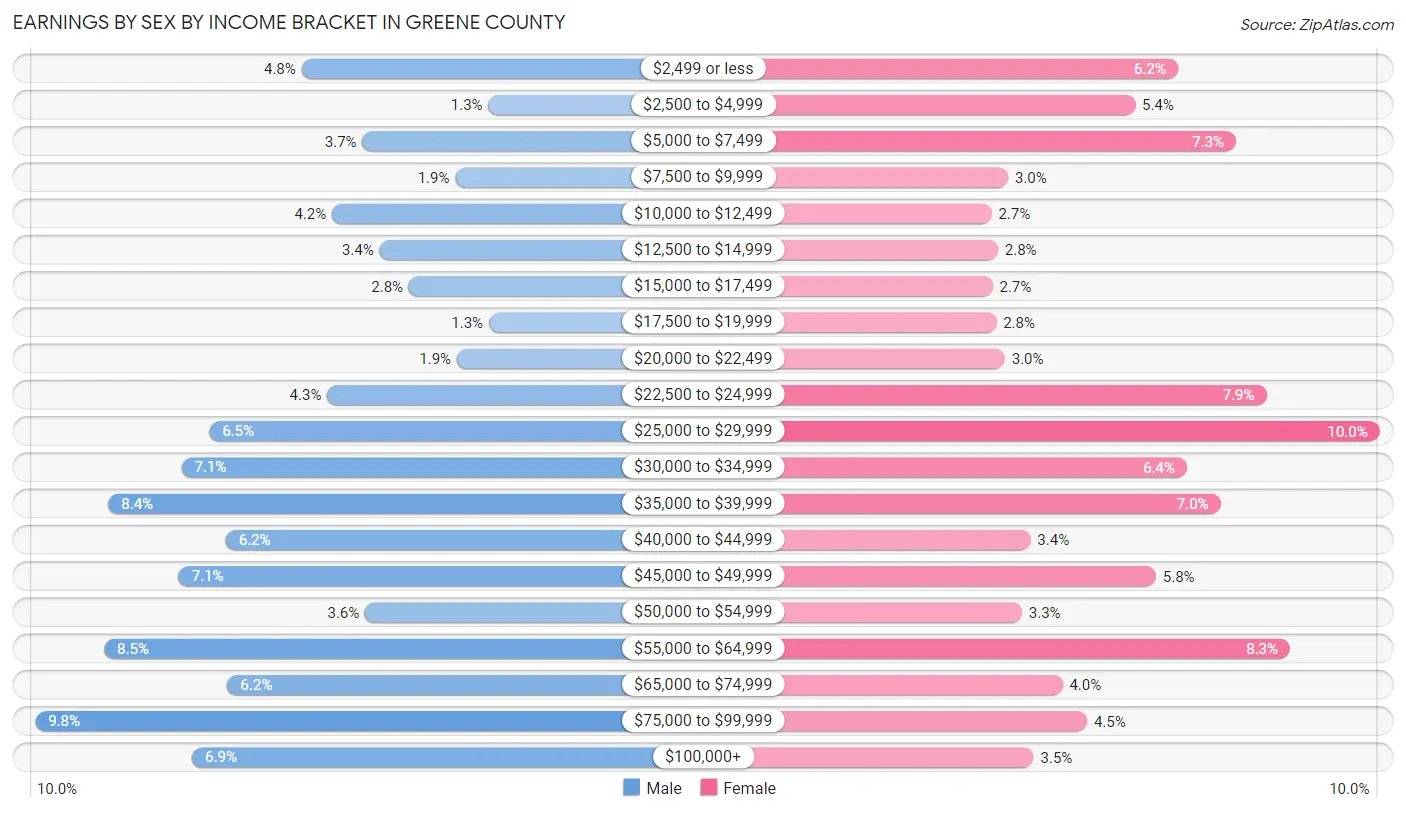
| Income | Male | Female |
| $2,499 or less | 582 (4.8%) | 651 (6.2%) |
| $2,500 to $4,999 | 158 (1.3%) | 567 (5.4%) |
| $5,000 to $7,499 | 444 (3.7%) | 766 (7.3%) |
| $7,500 to $9,999 | 233 (1.9%) | 317 (3.0%) |
| $10,000 to $12,499 | 513 (4.2%) | 285 (2.7%) |
| $12,500 to $14,999 | 405 (3.4%) | 297 (2.8%) |
| $15,000 to $17,499 | 338 (2.8%) | 287 (2.7%) |
| $17,500 to $19,999 | 157 (1.3%) | 294 (2.8%) |
| $20,000 to $22,499 | 230 (1.9%) | 311 (3.0%) |
| $22,500 to $24,999 | 523 (4.3%) | 826 (7.9%) |
| $25,000 to $29,999 | 791 (6.5%) | 1,049 (10.0%) |
| $30,000 to $34,999 | 853 (7.1%) | 669 (6.4%) |
| $35,000 to $39,999 | 1,019 (8.4%) | 736 (7.0%) |
| $40,000 to $44,999 | 753 (6.2%) | 361 (3.4%) |
| $45,000 to $49,999 | 860 (7.1%) | 608 (5.8%) |
| $50,000 to $54,999 | 438 (3.6%) | 345 (3.3%) |
| $55,000 to $64,999 | 1,029 (8.5%) | 872 (8.3%) |
| $65,000 to $74,999 | 750 (6.2%) | 425 (4.0%) |
| $75,000 to $99,999 | 1,185 (9.8%) | 473 (4.5%) |
| $100,000+ | 829 (6.9%) | 368 (3.5%) |
| Total | 12,090 (100.0%) | 10,507 (100.0%) |
Earnings by Sex by Educational Attainment in Greene County
Average earnings in Greene County are $43,861 for men and $31,227 for women, a difference of 28.8%. Men with an educational attainment of graduate degree enjoy the highest average annual earnings of $79,421, while those with less than high school education earn the least with $35,810. Women with an educational attainment of graduate degree earn the most with the average annual earnings of $63,047, while those with less than high school education have the smallest earnings of $6,750.
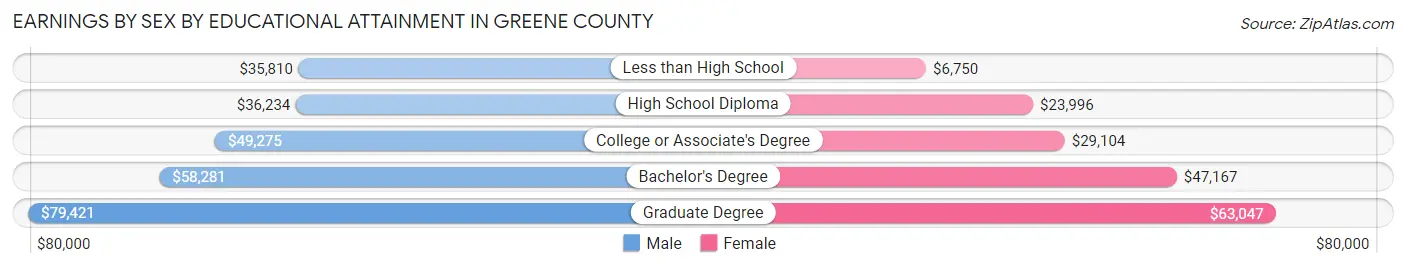
| Educational Attainment | Male Income | Female Income |
| Less than High School | $35,810 | $6,750 |
| High School Diploma | $36,234 | $23,996 |
| College or Associate's Degree | $49,275 | $29,104 |
| Bachelor's Degree | $58,281 | $47,167 |
| Graduate Degree | $79,421 | $63,047 |
| Total | $43,861 | $31,227 |
Family Income in Greene County
Family Income Brackets in Greene County
According to the Greene County family income data, there are 2,366 families falling into the $50,000 to $74,999 income range, which is the most common income bracket and makes up 19.5% of all families. Conversely, the $200,000+ income bracket is the least frequent group with only 364 families (3.0%) belonging to this category.
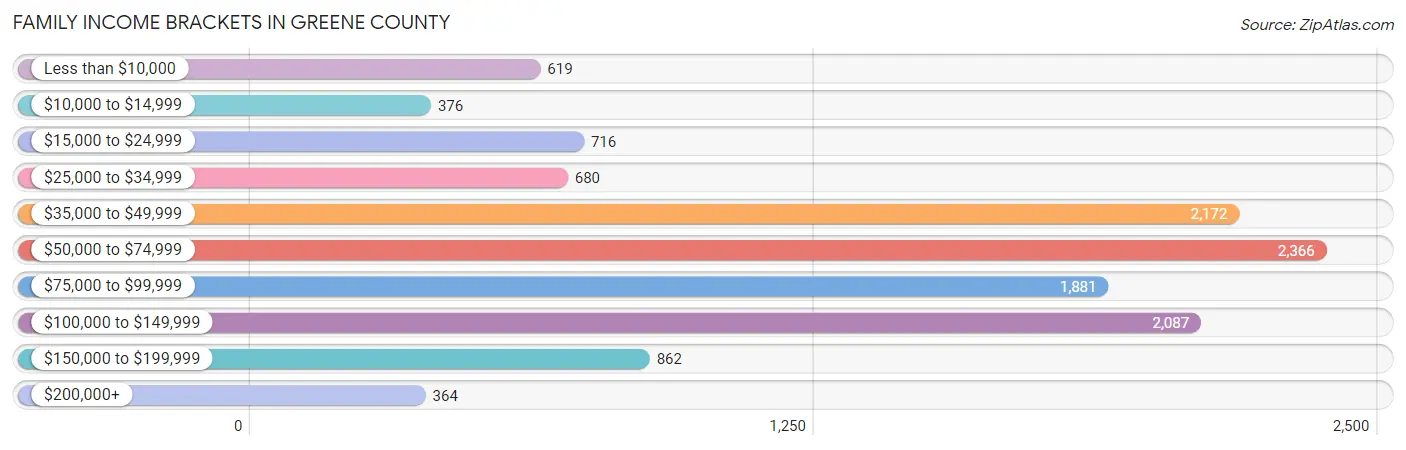
| Income Bracket | # Families | % Families |
| Less than $10,000 | 619 | 5.1% |
| $10,000 to $14,999 | 376 | 3.1% |
| $15,000 to $24,999 | 716 | 5.9% |
| $25,000 to $34,999 | 680 | 5.6% |
| $35,000 to $49,999 | 2,172 | 17.9% |
| $50,000 to $74,999 | 2,366 | 19.5% |
| $75,000 to $99,999 | 1,881 | 15.5% |
| $100,000 to $149,999 | 2,087 | 17.2% |
| $150,000 to $199,999 | 862 | 7.1% |
| $200,000+ | 364 | 3.0% |
Family Income by Famaliy Size in Greene County
7+ person families (131 | 1.1%) account for the highest median family income in Greene County with $110,272 per family, while 2-person families (6,163 | 50.8%) have the highest median income of $29,276 per family member.
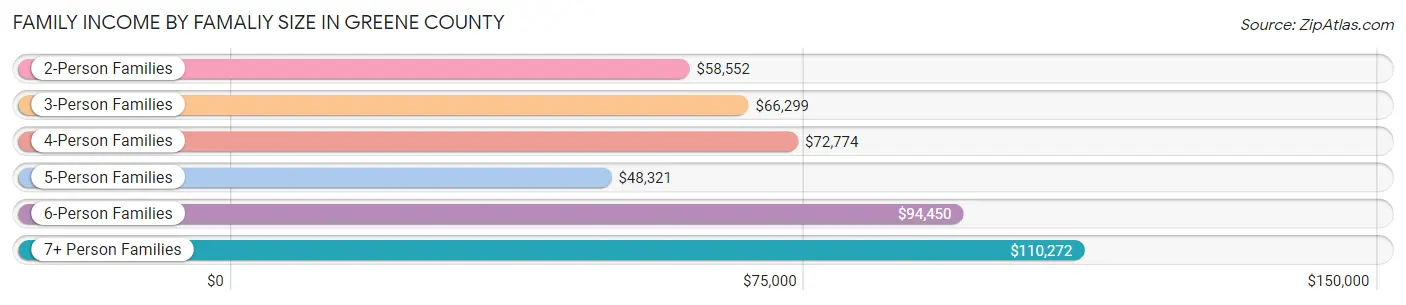
| Income Bracket | # Families | Median Income |
| 2-Person Families | 6,163 (50.8%) | $58,552 |
| 3-Person Families | 2,721 (22.4%) | $66,299 |
| 4-Person Families | 1,958 (16.1%) | $72,774 |
| 5-Person Families | 811 (6.7%) | $48,321 |
| 6-Person Families | 351 (2.9%) | $94,450 |
| 7+ Person Families | 131 (1.1%) | $110,272 |
| Total | 12,135 (100.0%) | $63,750 |
Family Income by Number of Earners in Greene County
The median family income in Greene County is $63,750, with families comprising 3+ earners (977) having the highest median family income of $127,981, while families with no earners (2,011) have the lowest median family income of $35,481, accounting for 8.1% and 16.6% of families, respectively.
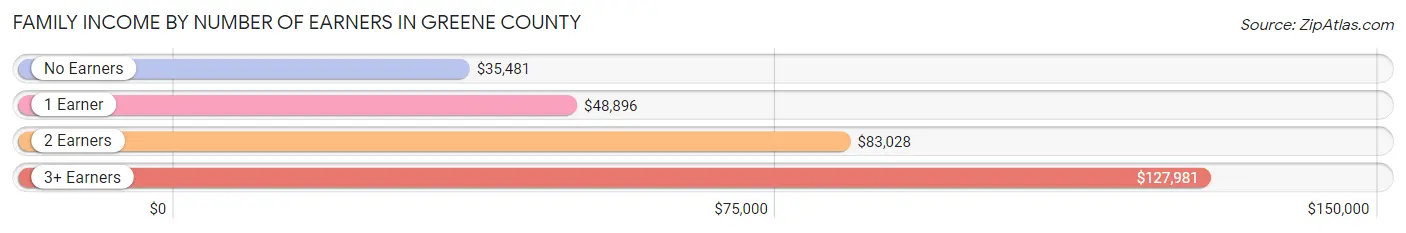
| Number of Earners | # Families | Median Income |
| No Earners | 2,011 (16.6%) | $35,481 |
| 1 Earner | 4,136 (34.1%) | $48,896 |
| 2 Earners | 5,011 (41.3%) | $83,028 |
| 3+ Earners | 977 (8.1%) | $127,981 |
| Total | 12,135 (100.0%) | $63,750 |
Household Income in Greene County
Household Income Brackets in Greene County
With 3,797 households falling in the category, the $50,000 to $74,999 income range is the most frequent in Greene County, accounting for 21.4% of all households. In contrast, only 408 households (2.3%) fall into the $200,000+ income bracket, making it the least populous group.
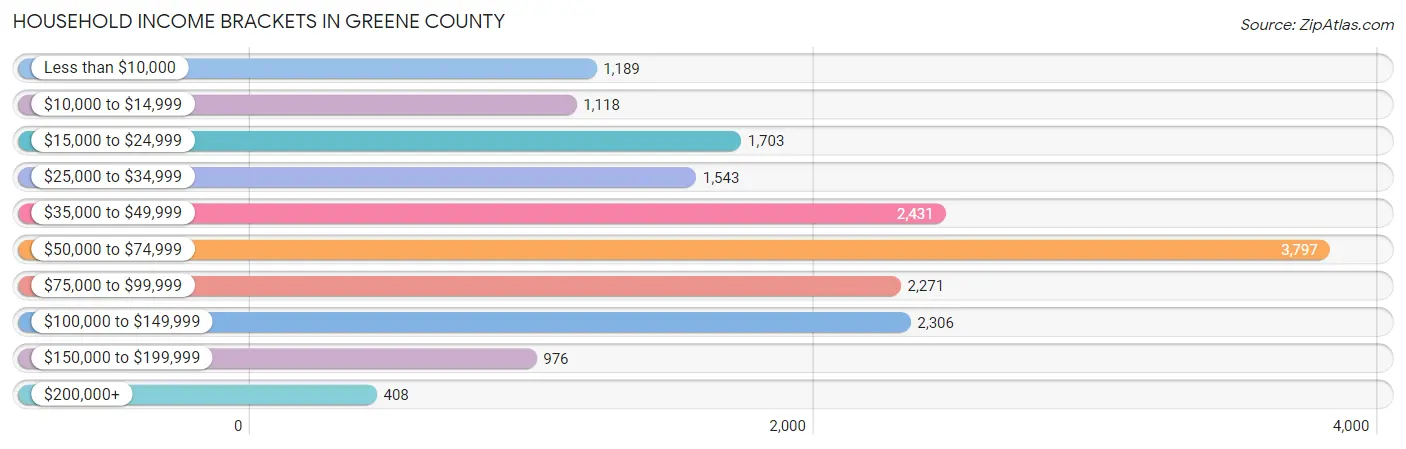
| Income Bracket | # Households | % Households |
| Less than $10,000 | 1,189 | 6.7% |
| $10,000 to $14,999 | 1,118 | 6.3% |
| $15,000 to $24,999 | 1,703 | 9.6% |
| $25,000 to $34,999 | 1,543 | 8.7% |
| $35,000 to $49,999 | 2,431 | 13.7% |
| $50,000 to $74,999 | 3,797 | 21.4% |
| $75,000 to $99,999 | 2,271 | 12.8% |
| $100,000 to $149,999 | 2,306 | 13.0% |
| $150,000 to $199,999 | 976 | 5.5% |
| $200,000+ | 408 | 2.3% |
Household Income by Householder Age in Greene County
The median household income in Greene County is $54,879, with the highest median household income of $64,692 found in the 45 to 64 years age bracket for the primary householder. A total of 6,565 households (37.0%) fall into this category. Meanwhile, the 65+ years age bracket for the primary householder has the lowest median household income of $39,295, with 4,591 households (25.9%) in this group.
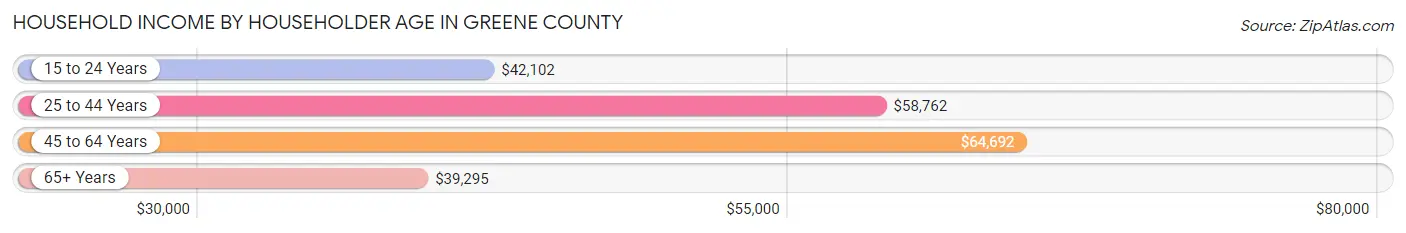
| Income Bracket | # Households | Median Income |
| 15 to 24 Years | 898 (5.1%) | $42,102 |
| 25 to 44 Years | 5,687 (32.1%) | $58,762 |
| 45 to 64 Years | 6,565 (37.0%) | $64,692 |
| 65+ Years | 4,591 (25.9%) | $39,295 |
| Total | 17,741 (100.0%) | $54,879 |
Poverty in Greene County
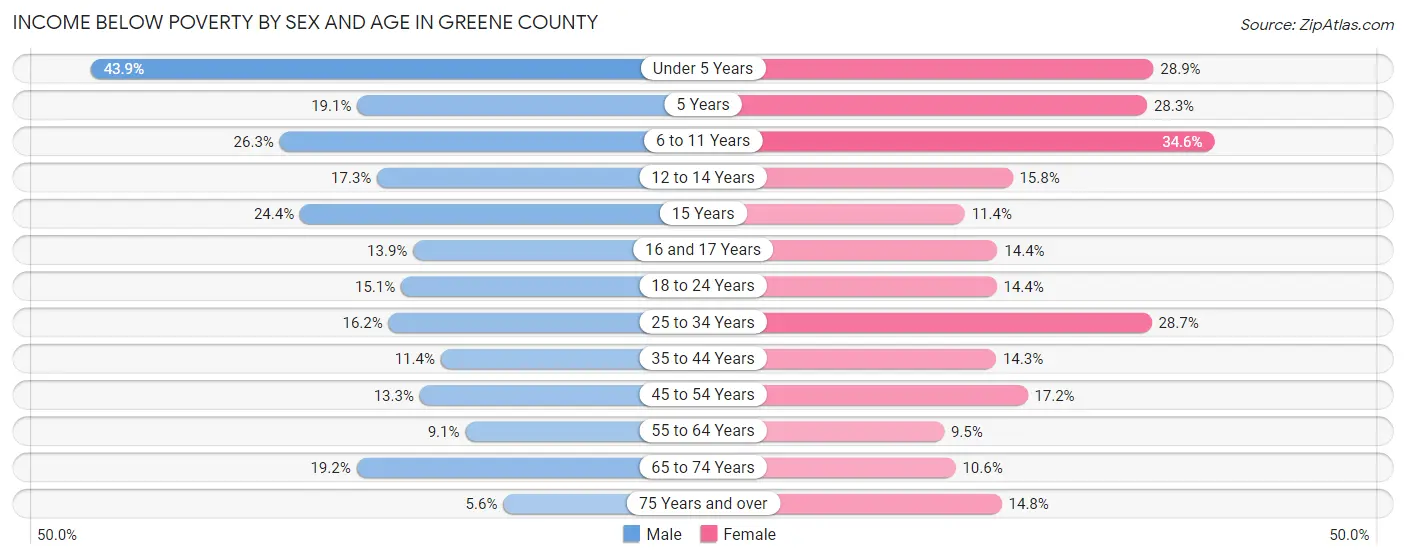
Income Below Poverty by Sex and Age in Greene County
With 16.6% poverty level for males and 18.5% for females among the residents of Greene County, under 5 year old males and 6 to 11 year old females are the most vulnerable to poverty, with 697 males (43.9%) and 691 females (34.6%) in their respective age groups living below the poverty level.
| Age Bracket | Male | Female |
| Under 5 Years | 697 (43.9%) | 354 (28.9%) |
| 5 Years | 119 (19.1%) | 64 (28.3%) |
| 6 to 11 Years | 351 (26.3%) | 691 (34.6%) |
| 12 to 14 Years | 159 (17.3%) | 121 (15.8%) |
| 15 Years | 77 (24.4%) | 30 (11.4%) |
| 16 and 17 Years | 98 (13.9%) | 105 (14.4%) |
| 18 to 24 Years | 304 (15.1%) | 254 (14.4%) |
| 25 to 34 Years | 483 (16.2%) | 894 (28.7%) |
| 35 to 44 Years | 322 (11.4%) | 409 (14.3%) |
| 45 to 54 Years | 403 (13.3%) | 498 (17.2%) |
| 55 to 64 Years | 256 (9.1%) | 265 (9.5%) |
| 65 to 74 Years | 369 (19.2%) | 234 (10.5%) |
| 75 Years and over | 69 (5.6%) | 266 (14.8%) |
| Total | 3,707 (16.6%) | 4,185 (18.5%) |
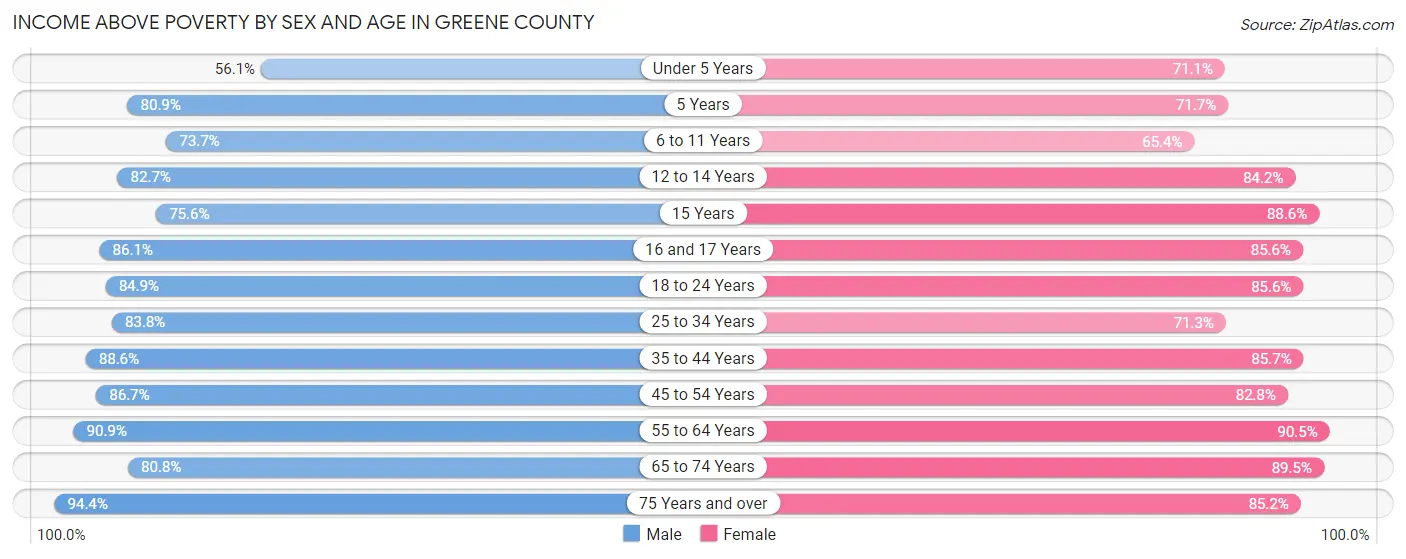
Income Above Poverty by Sex and Age in Greene County
According to the poverty statistics in Greene County, males aged 75 years and over and females aged 55 to 64 years are the age groups that are most secure financially, with 94.4% of males and 90.5% of females in these age groups living above the poverty line.
| Age Bracket | Male | Female |
| Under 5 Years | 892 (56.1%) | 870 (71.1%) |
| 5 Years | 503 (80.9%) | 162 (71.7%) |
| 6 to 11 Years | 982 (73.7%) | 1,308 (65.4%) |
| 12 to 14 Years | 761 (82.7%) | 643 (84.2%) |
| 15 Years | 238 (75.6%) | 233 (88.6%) |
| 16 and 17 Years | 605 (86.1%) | 622 (85.6%) |
| 18 to 24 Years | 1,714 (84.9%) | 1,515 (85.6%) |
| 25 to 34 Years | 2,495 (83.8%) | 2,217 (71.3%) |
| 35 to 44 Years | 2,508 (88.6%) | 2,450 (85.7%) |
| 45 to 54 Years | 2,620 (86.7%) | 2,392 (82.8%) |
| 55 to 64 Years | 2,557 (90.9%) | 2,531 (90.5%) |
| 65 to 74 Years | 1,553 (80.8%) | 1,983 (89.4%) |
| 75 Years and over | 1,168 (94.4%) | 1,528 (85.2%) |
| Total | 18,596 (83.4%) | 18,454 (81.5%) |
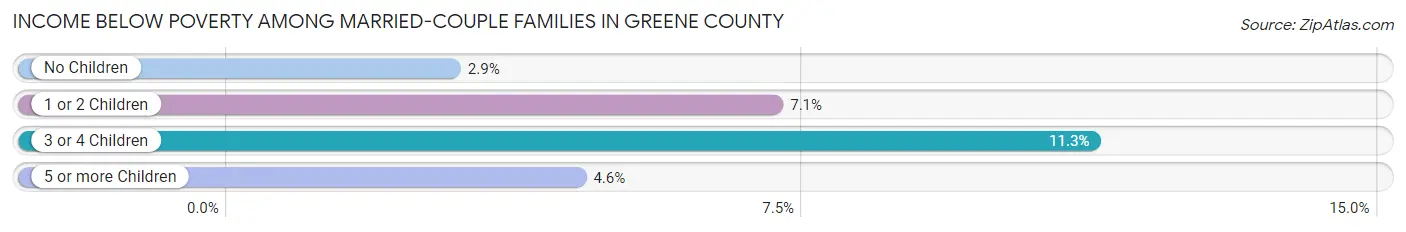
Income Below Poverty Among Married-Couple Families in Greene County
The poverty statistics for married-couple families in Greene County show that 4.8% or 414 of the total 8,546 families live below the poverty line. Families with 3 or 4 children have the highest poverty rate of 11.3%, comprising of 55 families. On the other hand, families with no children have the lowest poverty rate of 2.9%, which includes 147 families.
| Children | Above Poverty | Below Poverty |
| No Children | 4,910 (97.1%) | 147 (2.9%) |
| 1 or 2 Children | 2,726 (92.9%) | 209 (7.1%) |
| 3 or 4 Children | 433 (88.7%) | 55 (11.3%) |
| 5 or more Children | 63 (95.5%) | 3 (4.5%) |
| Total | 8,132 (95.2%) | 414 (4.8%) |
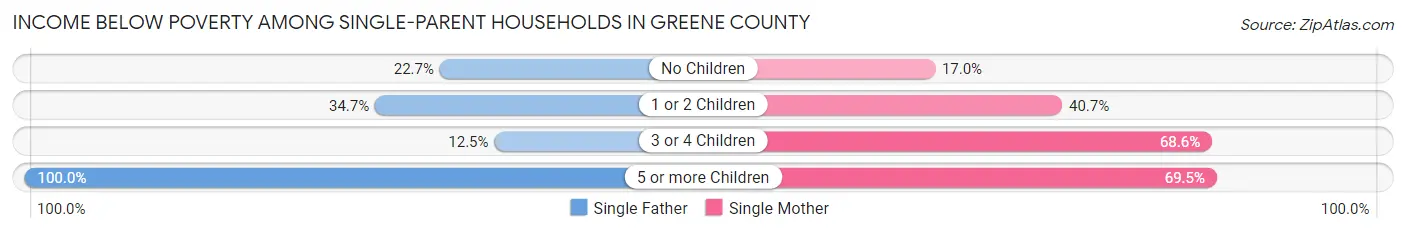
Income Below Poverty Among Single-Parent Households in Greene County
According to the poverty data in Greene County, 30.4% or 390 single-father households and 35.7% or 823 single-mother households are living below the poverty line. Among single-father households, those with 5 or more children have the highest poverty rate, with 11 households (100.0%) experiencing poverty. Likewise, among single-mother households, those with 5 or more children have the highest poverty rate, with 41 households (69.5%) falling below the poverty line.
| Children | Single Father | Single Mother |
| No Children | 112 (22.7%) | 136 (17.0%) |
| 1 or 2 Children | 265 (34.7%) | 504 (40.7%) |
| 3 or 4 Children | 2 (12.5%) | 142 (68.6%) |
| 5 or more Children | 11 (100.0%) | 41 (69.5%) |
| Total | 390 (30.4%) | 823 (35.7%) |
Income Below Poverty Among Married-Couple vs Single-Parent Households in Greene County
The poverty data for Greene County shows that 414 of the married-couple family households (4.8%) and 1,213 of the single-parent households (33.8%) are living below the poverty level. Within the married-couple family households, those with 3 or 4 children have the highest poverty rate, with 55 households (11.3%) falling below the poverty line. Among the single-parent households, those with 5 or more children have the highest poverty rate, with 52 household (74.3%) living below poverty.
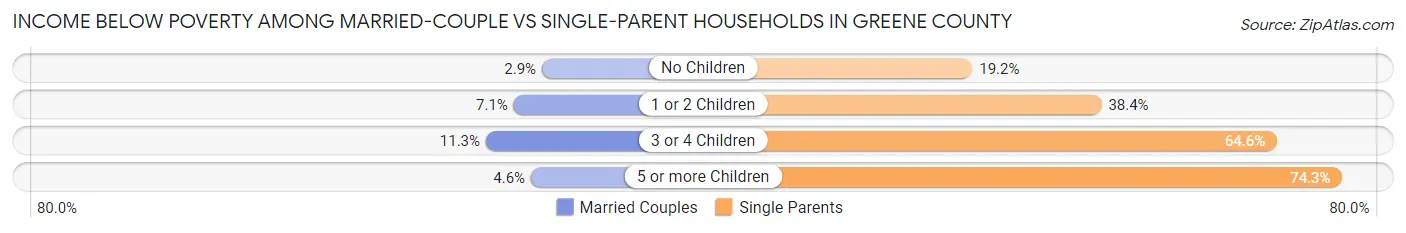
| Children | Married-Couple Families | Single-Parent Households |
| No Children | 147 (2.9%) | 248 (19.2%) |
| 1 or 2 Children | 209 (7.1%) | 769 (38.4%) |
| 3 or 4 Children | 55 (11.3%) | 144 (64.6%) |
| 5 or more Children | 3 (4.5%) | 52 (74.3%) |
| Total | 414 (4.8%) | 1,213 (33.8%) |
Employment Characteristics in Greene County
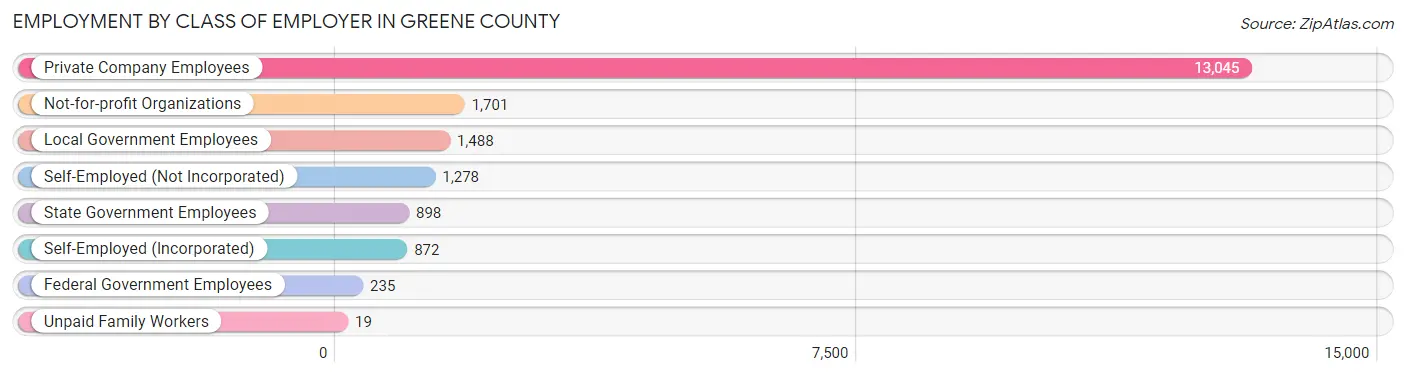
Employment by Class of Employer in Greene County
Among the 19,536 employed individuals in Greene County, private company employees (13,045 | 66.8%), not-for-profit organizations (1,701 | 8.7%), and local government employees (1,488 | 7.6%) make up the most common classes of employment.
| Employer Class | # Employees | % Employees |
| Private Company Employees | 13,045 | 66.8% |
| Self-Employed (Incorporated) | 872 | 4.5% |
| Self-Employed (Not Incorporated) | 1,278 | 6.5% |
| Not-for-profit Organizations | 1,701 | 8.7% |
| Local Government Employees | 1,488 | 7.6% |
| State Government Employees | 898 | 4.6% |
| Federal Government Employees | 235 | 1.2% |
| Unpaid Family Workers | 19 | 0.1% |
| Total | 19,536 | 100.0% |
Employment Status by Age in Greene County
According to the labor force statistics for Greene County, out of the total population over 16 years of age (36,327), 59.4% or 21,578 individuals are in the labor force, with 7.5% or 1,618 of them unemployed. The age group with the highest labor force participation rate is 25 to 29 years, with 78.0% or 2,345 individuals in the labor force. Within the labor force, the 16 to 19 years age range has the highest percentage of unemployed individuals, with 28.3% or 326 of them being unemployed.
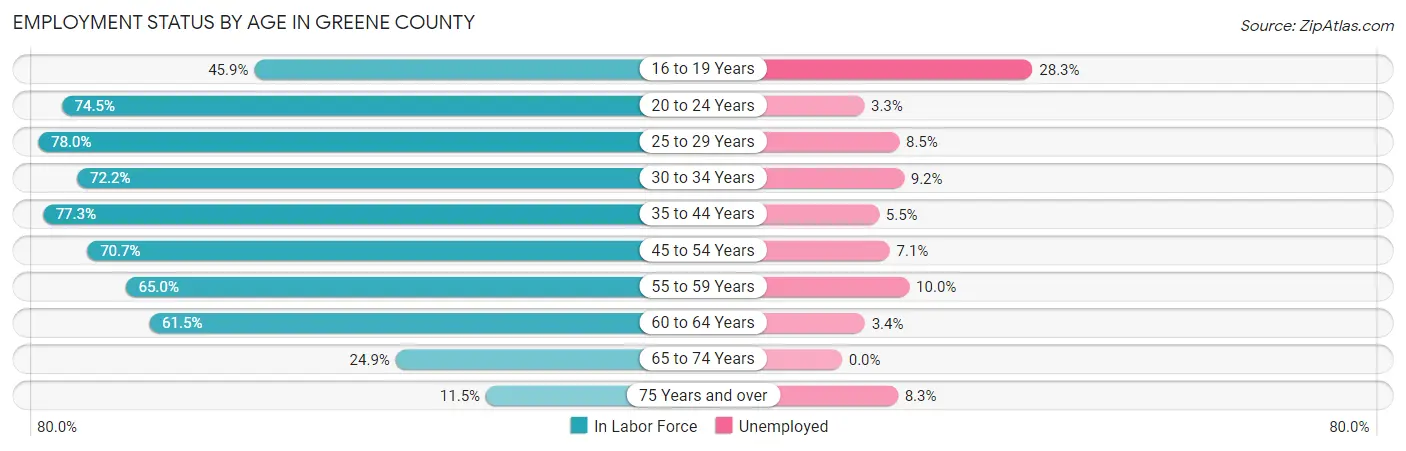
| Age Bracket | In Labor Force | Unemployed |
| 16 to 19 Years | 1,152 (45.9%) | 326 (28.3%) |
| 20 to 24 Years | 2,140 (74.5%) | 71 (3.3%) |
| 25 to 29 Years | 2,345 (78.0%) | 199 (8.5%) |
| 30 to 34 Years | 2,280 (72.2%) | 210 (9.2%) |
| 35 to 44 Years | 4,472 (77.3%) | 246 (5.5%) |
| 45 to 54 Years | 4,202 (70.7%) | 298 (7.1%) |
| 55 to 59 Years | 1,847 (65.0%) | 185 (10.0%) |
| 60 to 64 Years | 1,712 (61.5%) | 58 (3.4%) |
| 65 to 74 Years | 1,042 (24.9%) | 0 (0.0%) |
| 75 Years and over | 373 (11.5%) | 31 (8.3%) |
| Total | 21,578 (59.4%) | 1,618 (7.5%) |
Employment Status by Educational Attainment in Greene County
According to labor force statistics for Greene County, 71.7% of individuals (16,862) out of the total population between 25 and 64 years of age (23,517) are in the labor force, with 7.1% or 1,197 of them being unemployed. The group with the highest labor force participation rate are those with the educational attainment of bachelor's degree or higher, with 90.0% or 3,828 individuals in the labor force. Within the labor force, individuals with less than high school education have the highest percentage of unemployment, with 18.1% or 180 of them being unemployed.
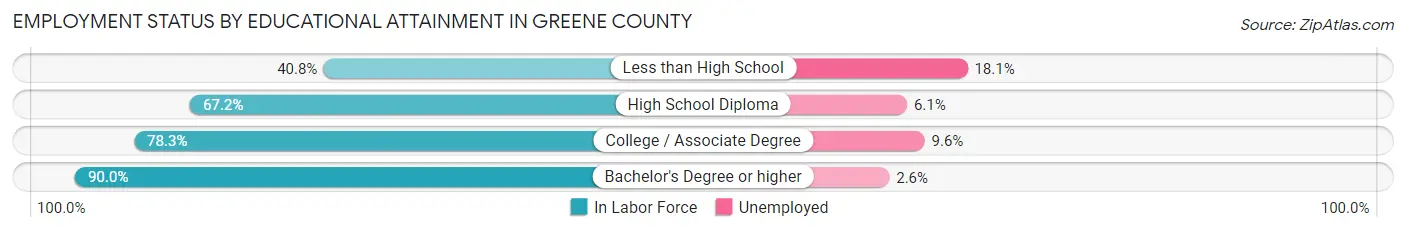
| Educational Attainment | In Labor Force | Unemployed |
| Less than High School | 992 (40.8%) | 440 (18.1%) |
| High School Diploma | 6,952 (67.2%) | 631 (6.1%) |
| College / Associate Degree | 5,080 (78.3%) | 623 (9.6%) |
| Bachelor's Degree or higher | 3,828 (90.0%) | 111 (2.6%) |
| Total | 16,862 (71.7%) | 1,670 (7.1%) |
Employment Occupations by Sex in Greene County
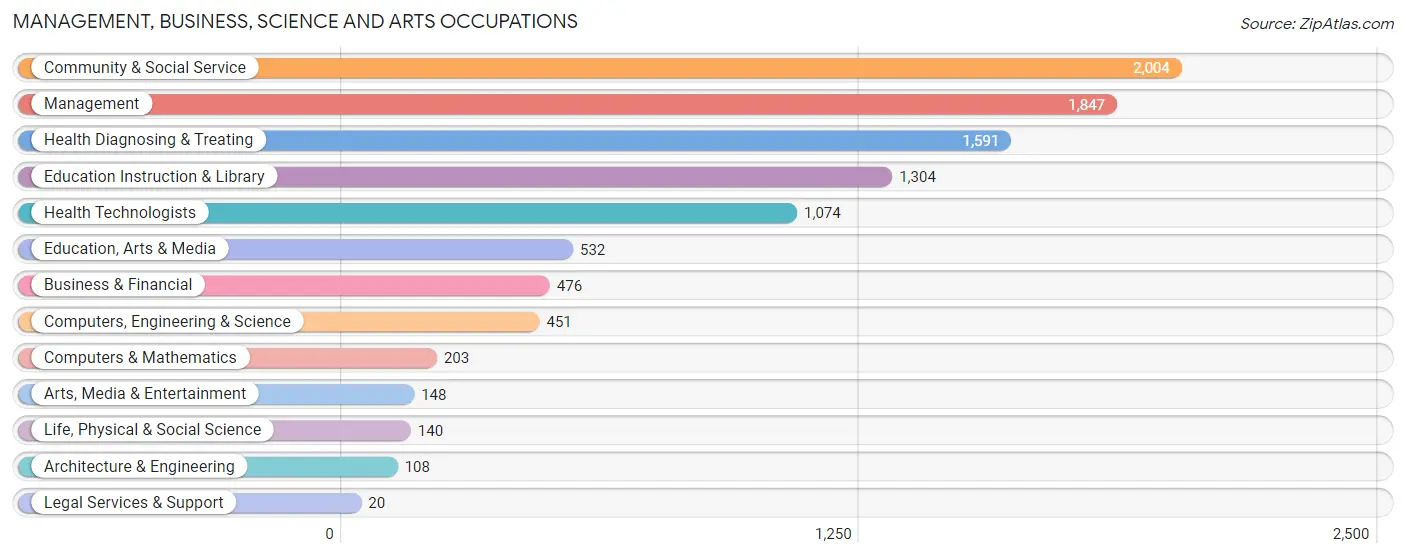
Management, Business, Science and Arts Occupations
The most common Management, Business, Science and Arts occupations in Greene County are Community & Social Service (2,004 | 10.1%), Management (1,847 | 9.3%), Health Diagnosing & Treating (1,591 | 8.0%), Education Instruction & Library (1,304 | 6.5%), and Health Technologists (1,074 | 5.4%).
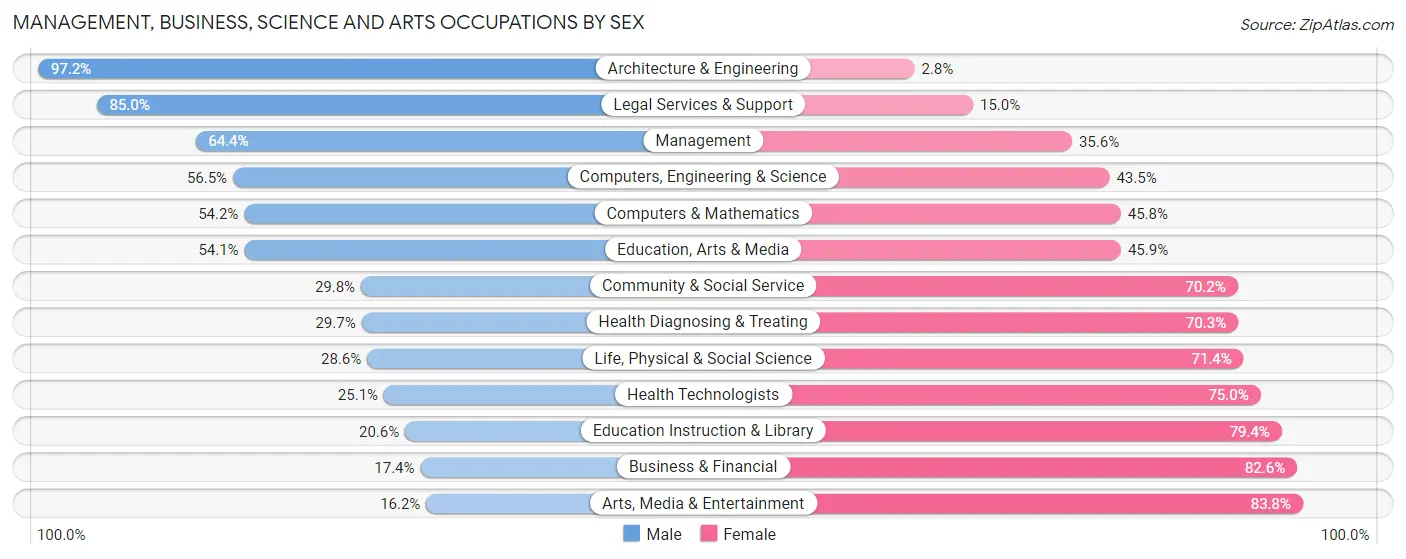
Management, Business, Science and Arts Occupations by Sex
Within the Management, Business, Science and Arts occupations in Greene County, the most male-oriented occupations are Architecture & Engineering (97.2%), Legal Services & Support (85.0%), and Management (64.4%), while the most female-oriented occupations are Arts, Media & Entertainment (83.8%), Business & Financial (82.6%), and Education Instruction & Library (79.4%).
| Occupation | Male | Female |
| Management | 1,189 (64.4%) | 658 (35.6%) |
| Business & Financial | 83 (17.4%) | 393 (82.6%) |
| Computers, Engineering & Science | 255 (56.5%) | 196 (43.5%) |
| Computers & Mathematics | 110 (54.2%) | 93 (45.8%) |
| Architecture & Engineering | 105 (97.2%) | 3 (2.8%) |
| Life, Physical & Social Science | 40 (28.6%) | 100 (71.4%) |
| Community & Social Service | 598 (29.8%) | 1,406 (70.2%) |
| Education, Arts & Media | 288 (54.1%) | 244 (45.9%) |
| Legal Services & Support | 17 (85.0%) | 3 (15.0%) |
| Education Instruction & Library | 269 (20.6%) | 1,035 (79.4%) |
| Arts, Media & Entertainment | 24 (16.2%) | 124 (83.8%) |
| Health Diagnosing & Treating | 473 (29.7%) | 1,118 (70.3%) |
| Health Technologists | 269 (25.1%) | 805 (75.0%) |
| Total (Category) | 2,598 (40.8%) | 3,771 (59.2%) |
| Total (Overall) | 10,893 (54.6%) | 9,047 (45.4%) |
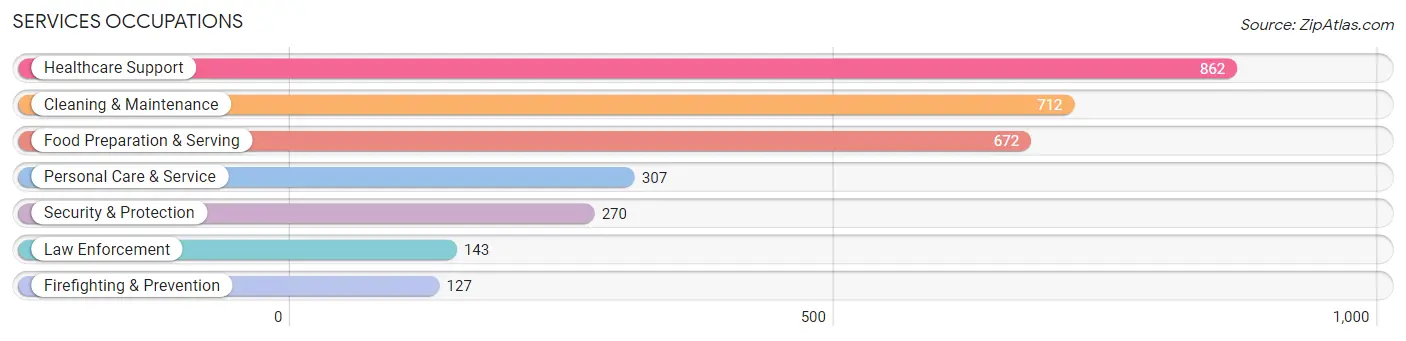
Services Occupations
The most common Services occupations in Greene County are Healthcare Support (862 | 4.3%), Cleaning & Maintenance (712 | 3.6%), Food Preparation & Serving (672 | 3.4%), Personal Care & Service (307 | 1.5%), and Security & Protection (270 | 1.3%).
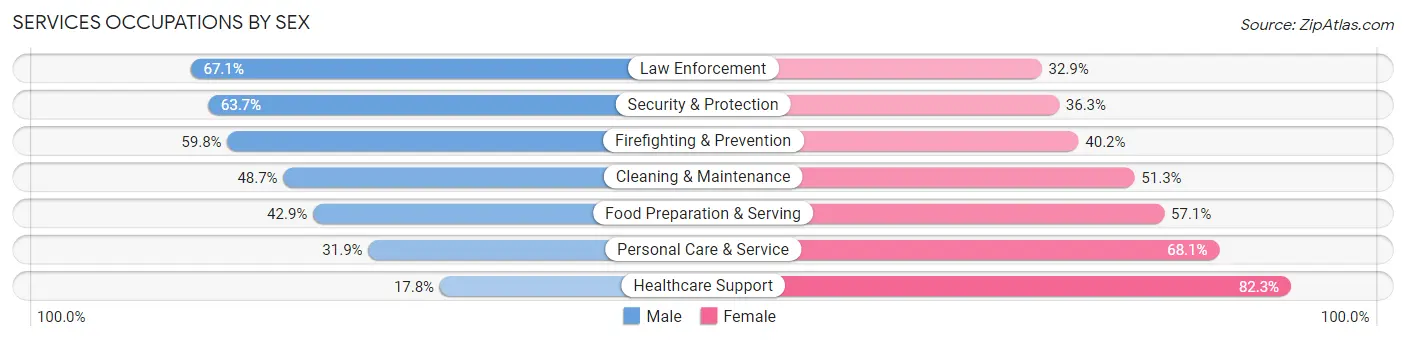
Services Occupations by Sex
Within the Services occupations in Greene County, the most male-oriented occupations are Law Enforcement (67.1%), Security & Protection (63.7%), and Firefighting & Prevention (59.8%), while the most female-oriented occupations are Healthcare Support (82.3%), Personal Care & Service (68.1%), and Food Preparation & Serving (57.1%).
| Occupation | Male | Female |
| Healthcare Support | 153 (17.7%) | 709 (82.3%) |
| Security & Protection | 172 (63.7%) | 98 (36.3%) |
| Firefighting & Prevention | 76 (59.8%) | 51 (40.2%) |
| Law Enforcement | 96 (67.1%) | 47 (32.9%) |
| Food Preparation & Serving | 288 (42.9%) | 384 (57.1%) |
| Cleaning & Maintenance | 347 (48.7%) | 365 (51.3%) |
| Personal Care & Service | 98 (31.9%) | 209 (68.1%) |
| Total (Category) | 1,058 (37.5%) | 1,765 (62.5%) |
| Total (Overall) | 10,893 (54.6%) | 9,047 (45.4%) |
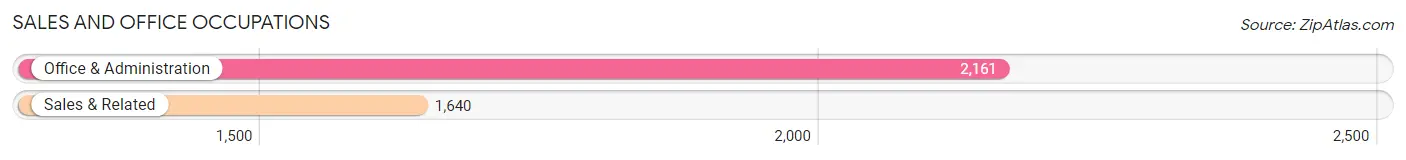
Sales and Office Occupations
The most common Sales and Office occupations in Greene County are Office & Administration (2,161 | 10.8%), and Sales & Related (1,640 | 8.2%).
Sales and Office Occupations by Sex
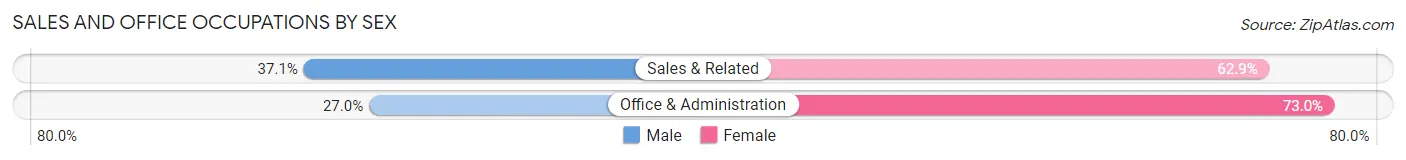
| Occupation | Male | Female |
| Sales & Related | 608 (37.1%) | 1,032 (62.9%) |
| Office & Administration | 584 (27.0%) | 1,577 (73.0%) |
| Total (Category) | 1,192 (31.4%) | 2,609 (68.6%) |
| Total (Overall) | 10,893 (54.6%) | 9,047 (45.4%) |
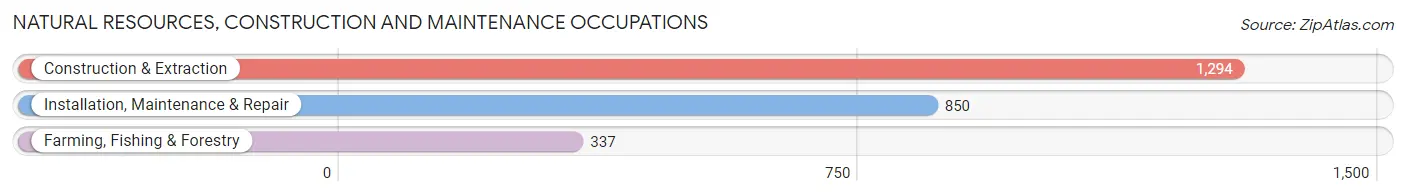
Natural Resources, Construction and Maintenance Occupations
The most common Natural Resources, Construction and Maintenance occupations in Greene County are Construction & Extraction (1,294 | 6.5%), Installation, Maintenance & Repair (850 | 4.3%), and Farming, Fishing & Forestry (337 | 1.7%).
Natural Resources, Construction and Maintenance Occupations by Sex
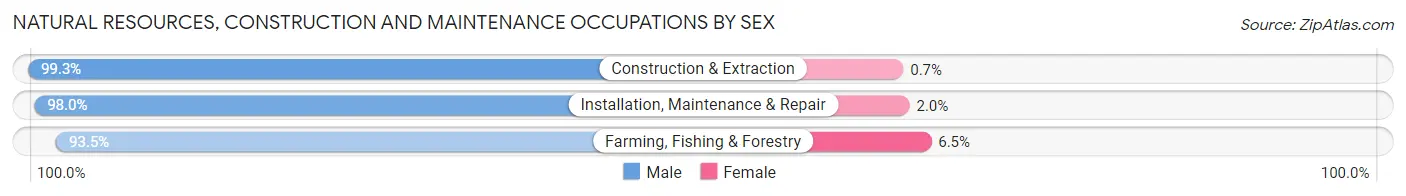
| Occupation | Male | Female |
| Farming, Fishing & Forestry | 315 (93.5%) | 22 (6.5%) |
| Construction & Extraction | 1,285 (99.3%) | 9 (0.7%) |
| Installation, Maintenance & Repair | 833 (98.0%) | 17 (2.0%) |
| Total (Category) | 2,433 (98.1%) | 48 (1.9%) |
| Total (Overall) | 10,893 (54.6%) | 9,047 (45.4%) |
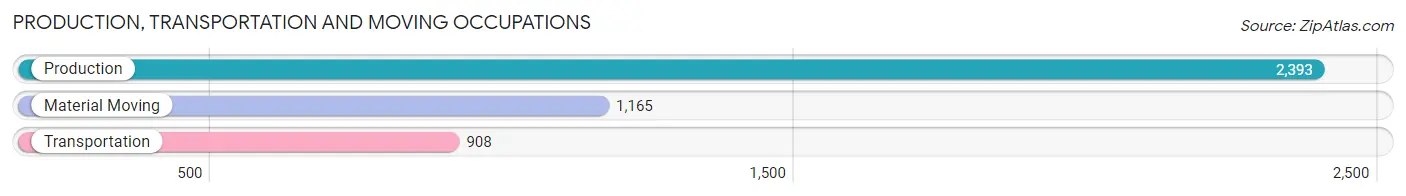
Production, Transportation and Moving Occupations
The most common Production, Transportation and Moving occupations in Greene County are Production (2,393 | 12.0%), Material Moving (1,165 | 5.8%), and Transportation (908 | 4.5%).
Production, Transportation and Moving Occupations by Sex
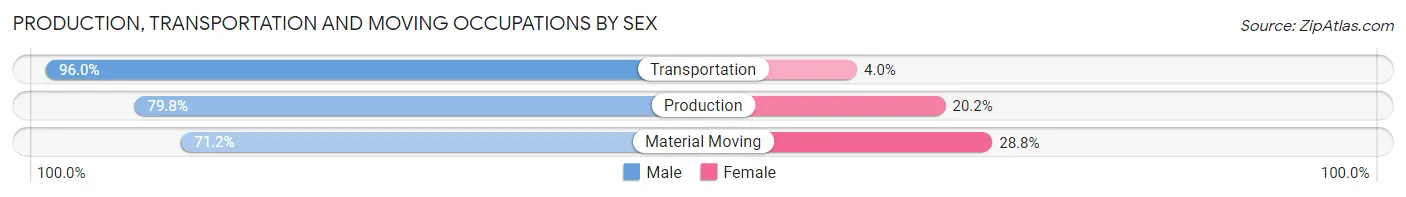
| Occupation | Male | Female |
| Production | 1,910 (79.8%) | 483 (20.2%) |
| Transportation | 872 (96.0%) | 36 (4.0%) |
| Material Moving | 830 (71.2%) | 335 (28.8%) |
| Total (Category) | 3,612 (80.9%) | 854 (19.1%) |
| Total (Overall) | 10,893 (54.6%) | 9,047 (45.4%) |
Employment Industries by Sex in Greene County
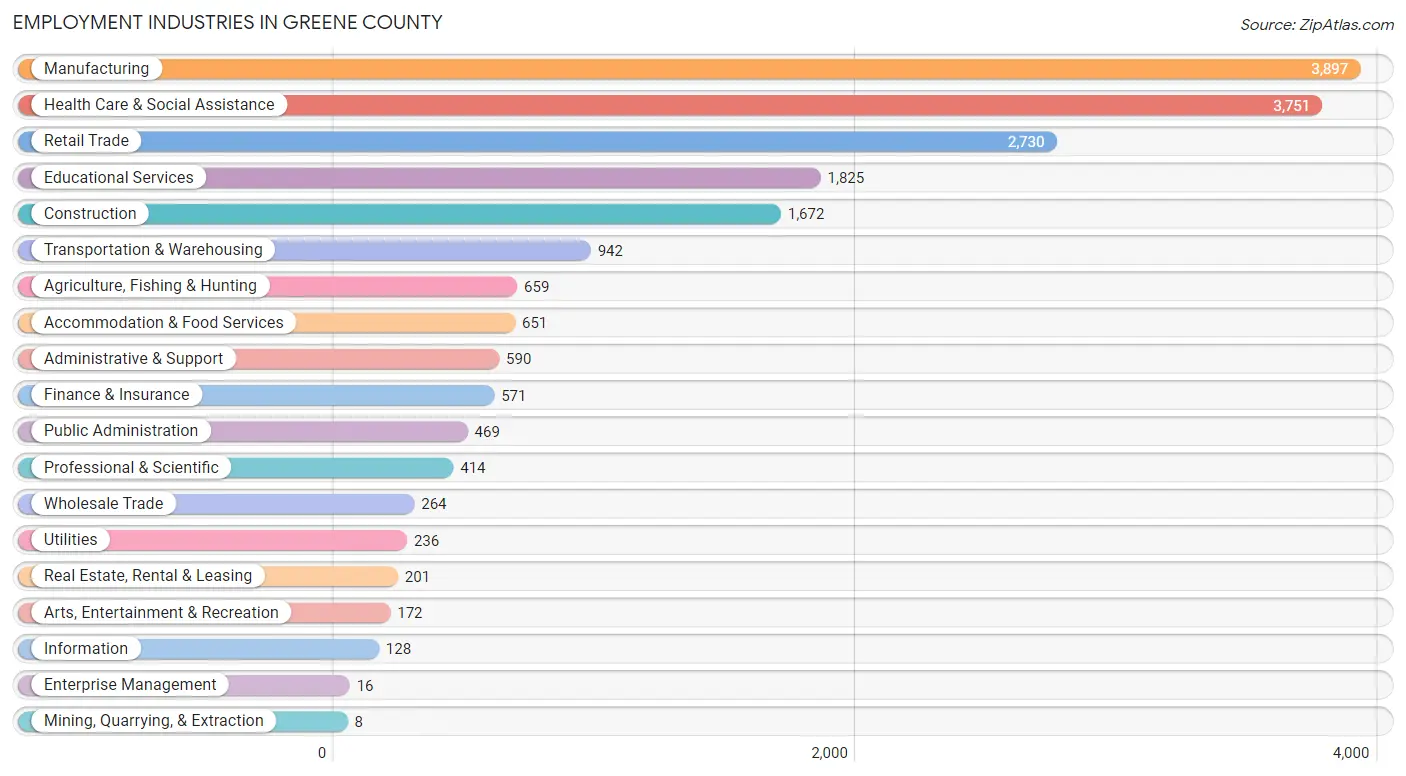
Employment Industries in Greene County
The major employment industries in Greene County include Manufacturing (3,897 | 19.5%), Health Care & Social Assistance (3,751 | 18.8%), Retail Trade (2,730 | 13.7%), Educational Services (1,825 | 9.1%), and Construction (1,672 | 8.4%).
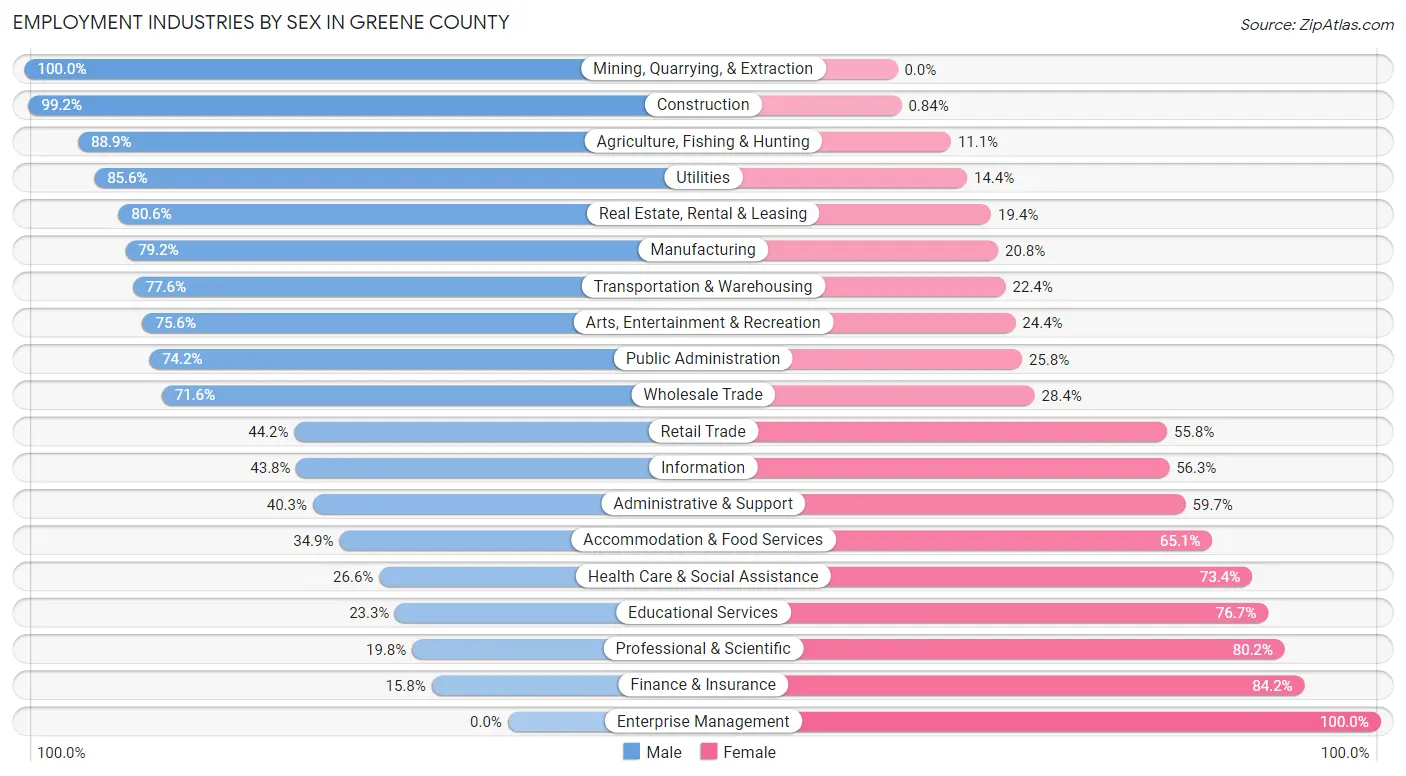
Employment Industries by Sex in Greene County
The Greene County industries that see more men than women are Mining, Quarrying, & Extraction (100.0%), Construction (99.2%), and Agriculture, Fishing & Hunting (88.9%), whereas the industries that tend to have a higher number of women are Enterprise Management (100.0%), Finance & Insurance (84.2%), and Professional & Scientific (80.2%).
| Industry | Male | Female |
| Agriculture, Fishing & Hunting | 586 (88.9%) | 73 (11.1%) |
| Mining, Quarrying, & Extraction | 8 (100.0%) | 0 (0.0%) |
| Construction | 1,658 (99.2%) | 14 (0.8%) |
| Manufacturing | 3,085 (79.2%) | 812 (20.8%) |
| Wholesale Trade | 189 (71.6%) | 75 (28.4%) |
| Retail Trade | 1,206 (44.2%) | 1,524 (55.8%) |
| Transportation & Warehousing | 731 (77.6%) | 211 (22.4%) |
| Utilities | 202 (85.6%) | 34 (14.4%) |
| Information | 56 (43.8%) | 72 (56.2%) |
| Finance & Insurance | 90 (15.8%) | 481 (84.2%) |
| Real Estate, Rental & Leasing | 162 (80.6%) | 39 (19.4%) |
| Professional & Scientific | 82 (19.8%) | 332 (80.2%) |
| Enterprise Management | 0 (0.0%) | 16 (100.0%) |
| Administrative & Support | 238 (40.3%) | 352 (59.7%) |
| Educational Services | 425 (23.3%) | 1,400 (76.7%) |
| Health Care & Social Assistance | 998 (26.6%) | 2,753 (73.4%) |
| Arts, Entertainment & Recreation | 130 (75.6%) | 42 (24.4%) |
| Accommodation & Food Services | 227 (34.9%) | 424 (65.1%) |
| Public Administration | 348 (74.2%) | 121 (25.8%) |
| Total | 10,893 (54.6%) | 9,047 (45.4%) |
Education in Greene County
School Enrollment in Greene County
The most common levels of schooling among the 10,420 students in Greene County are middle school (2,545 | 24.4%), high school (2,418 | 23.2%), and elementary school (2,238 | 21.5%).
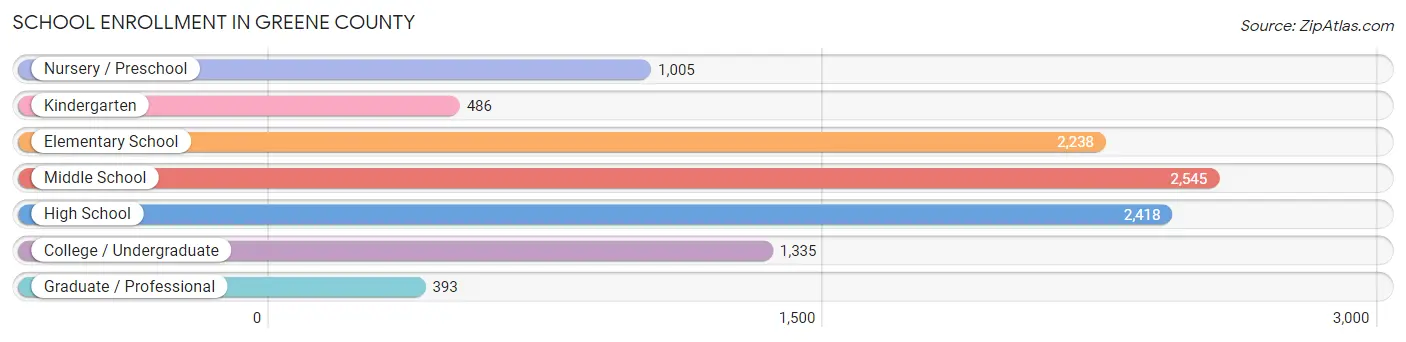
| School Level | # Students | % Students |
| Nursery / Preschool | 1,005 | 9.6% |
| Kindergarten | 486 | 4.7% |
| Elementary School | 2,238 | 21.5% |
| Middle School | 2,545 | 24.4% |
| High School | 2,418 | 23.2% |
| College / Undergraduate | 1,335 | 12.8% |
| Graduate / Professional | 393 | 3.8% |
| Total | 10,420 | 100.0% |
School Enrollment by Age by Funding Source in Greene County
Out of a total of 10,420 students who are enrolled in schools in Greene County, 782 (7.5%) attend a private institution, while the remaining 9,638 (92.5%) are enrolled in public schools. The age group of 35 years and over has the highest likelihood of being enrolled in private schools, with 112 (28.9% in the age bracket) enrolled. Conversely, the age group of 25 to 34 year olds has the lowest likelihood of being enrolled in a private school, with 551 (99.6% in the age bracket) attending a public institution.
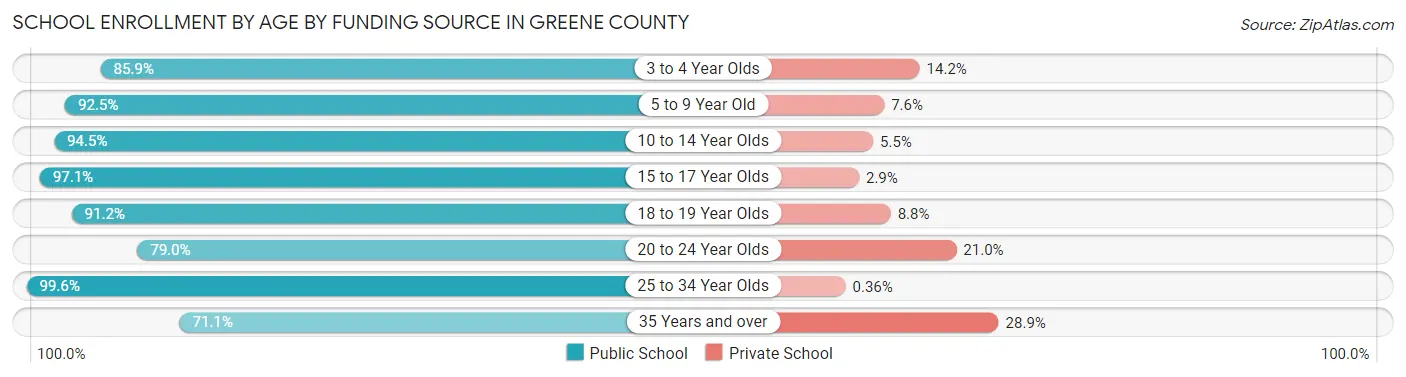
| Age Bracket | Public School | Private School |
| 3 to 4 Year Olds | 467 (85.9%) | 77 (14.1%) |
| 5 to 9 Year Old | 2,484 (92.4%) | 203 (7.5%) |
| 10 to 14 Year Olds | 2,933 (94.5%) | 170 (5.5%) |
| 15 to 17 Year Olds | 1,905 (97.1%) | 56 (2.9%) |
| 18 to 19 Year Olds | 624 (91.2%) | 60 (8.8%) |
| 20 to 24 Year Olds | 395 (79.0%) | 105 (21.0%) |
| 25 to 34 Year Olds | 551 (99.6%) | 2 (0.4%) |
| 35 Years and over | 276 (71.1%) | 112 (28.9%) |
| Total | 9,638 (92.5%) | 782 (7.5%) |
Educational Attainment by Field of Study in Greene County
Education (1,156 | 20.9%), science & technology (1,123 | 20.3%), business (853 | 15.4%), bio, nature & agricultural (528 | 9.6%), and arts & humanities (363 | 6.6%) are the most common fields of study among 5,523 individuals in Greene County who have obtained a bachelor's degree or higher.
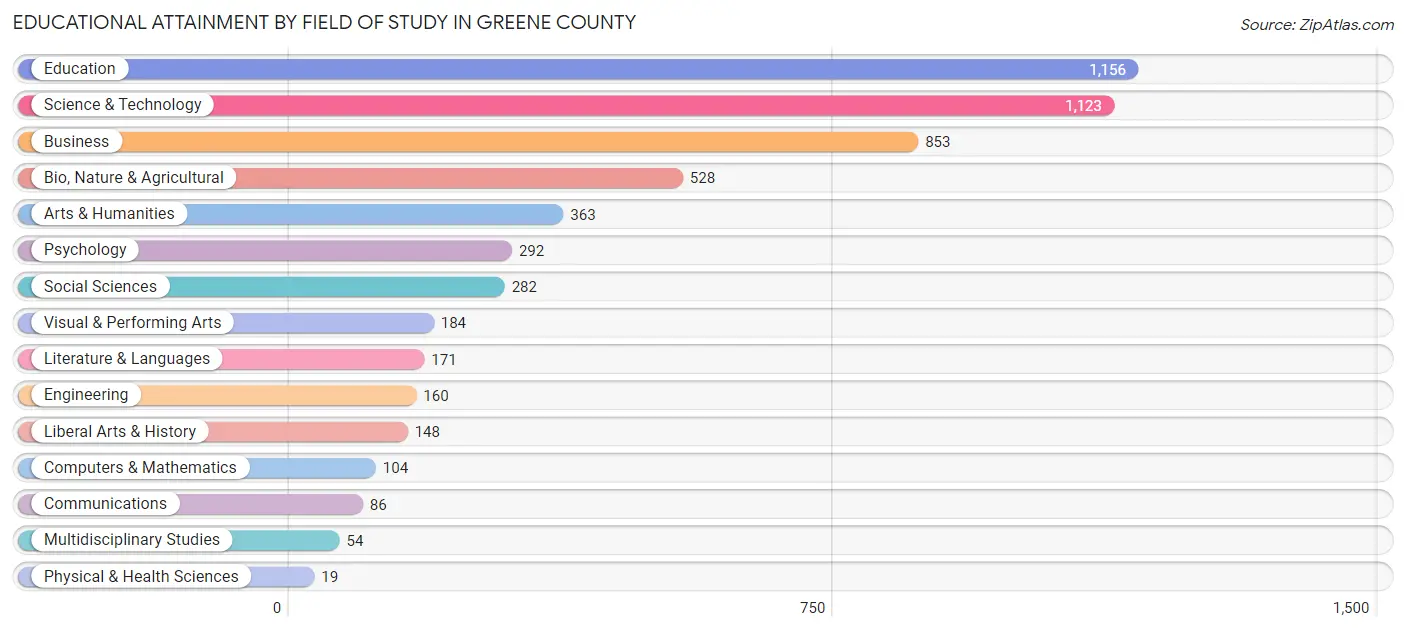
| Field of Study | # Graduates | % Graduates |
| Computers & Mathematics | 104 | 1.9% |
| Bio, Nature & Agricultural | 528 | 9.6% |
| Physical & Health Sciences | 19 | 0.3% |
| Psychology | 292 | 5.3% |
| Social Sciences | 282 | 5.1% |
| Engineering | 160 | 2.9% |
| Multidisciplinary Studies | 54 | 1.0% |
| Science & Technology | 1,123 | 20.3% |
| Business | 853 | 15.4% |
| Education | 1,156 | 20.9% |
| Literature & Languages | 171 | 3.1% |
| Liberal Arts & History | 148 | 2.7% |
| Visual & Performing Arts | 184 | 3.3% |
| Communications | 86 | 1.6% |
| Arts & Humanities | 363 | 6.6% |
| Total | 5,523 | 100.0% |
Transportation & Commute in Greene County
Vehicle Availability by Sex in Greene County
The most prevalent vehicle ownership categories in Greene County are males with 2 vehicles (4,700, accounting for 44.6%) and females with 2 vehicles (3,669, making up 52.8%).
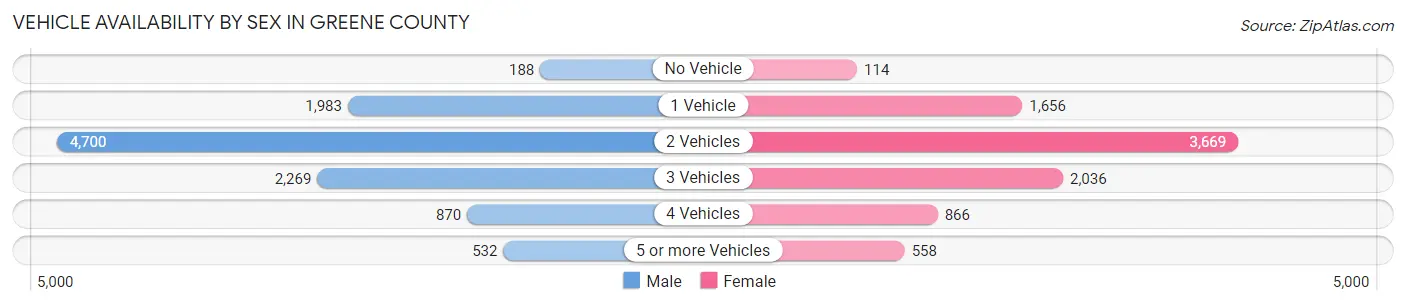
| Vehicles Available | Male | Female |
| No Vehicle | 188 (1.8%) | 114 (1.3%) |
| 1 Vehicle | 1,983 (18.8%) | 1,656 (18.6%) |
| 2 Vehicles | 4,700 (44.6%) | 3,669 (41.2%) |
| 3 Vehicles | 2,269 (21.5%) | 2,036 (22.9%) |
| 4 Vehicles | 870 (8.3%) | 866 (9.7%) |
| 5 or more Vehicles | 532 (5.1%) | 558 (6.3%) |
| Total | 10,542 (100.0%) | 8,899 (100.0%) |
Commute Time in Greene County
The most frequently occuring commute durations in Greene County are 10 to 14 minutes (3,737 commuters, 19.7%), 5 to 9 minutes (2,901 commuters, 15.3%), and 15 to 19 minutes (2,516 commuters, 13.3%).
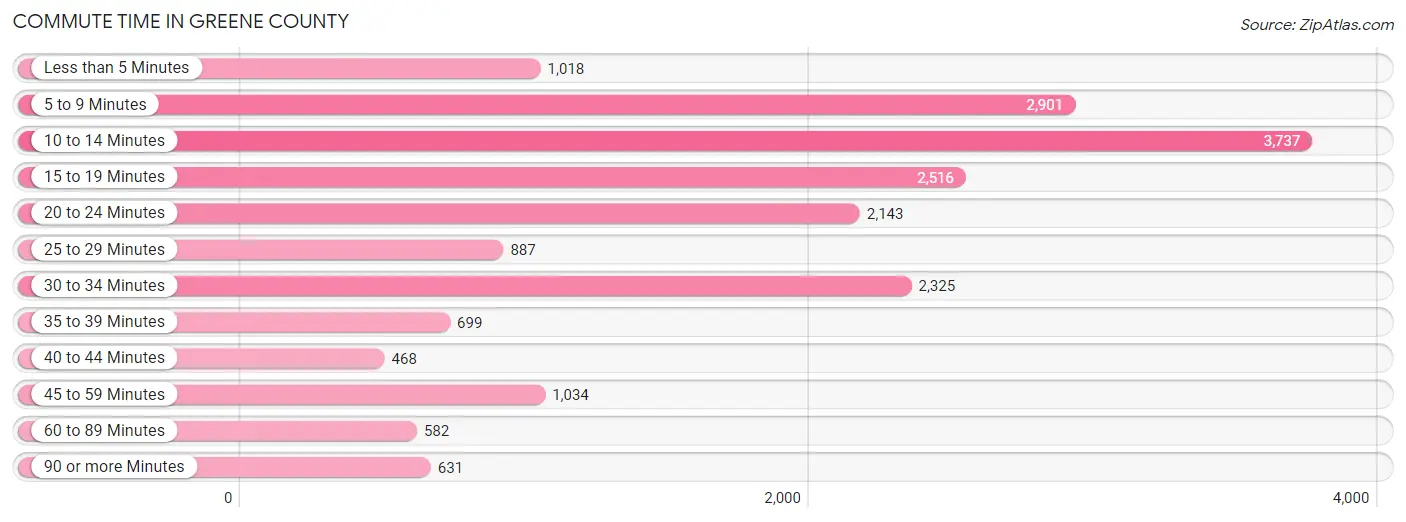
| Commute Time | # Commuters | % Commuters |
| Less than 5 Minutes | 1,018 | 5.4% |
| 5 to 9 Minutes | 2,901 | 15.3% |
| 10 to 14 Minutes | 3,737 | 19.7% |
| 15 to 19 Minutes | 2,516 | 13.3% |
| 20 to 24 Minutes | 2,143 | 11.3% |
| 25 to 29 Minutes | 887 | 4.7% |
| 30 to 34 Minutes | 2,325 | 12.3% |
| 35 to 39 Minutes | 699 | 3.7% |
| 40 to 44 Minutes | 468 | 2.5% |
| 45 to 59 Minutes | 1,034 | 5.5% |
| 60 to 89 Minutes | 582 | 3.1% |
| 90 or more Minutes | 631 | 3.3% |
Commute Time by Sex in Greene County
The most common commute times in Greene County are 10 to 14 minutes (1,918 commuters, 18.5%) for males and 10 to 14 minutes (1,819 commuters, 21.2%) for females.
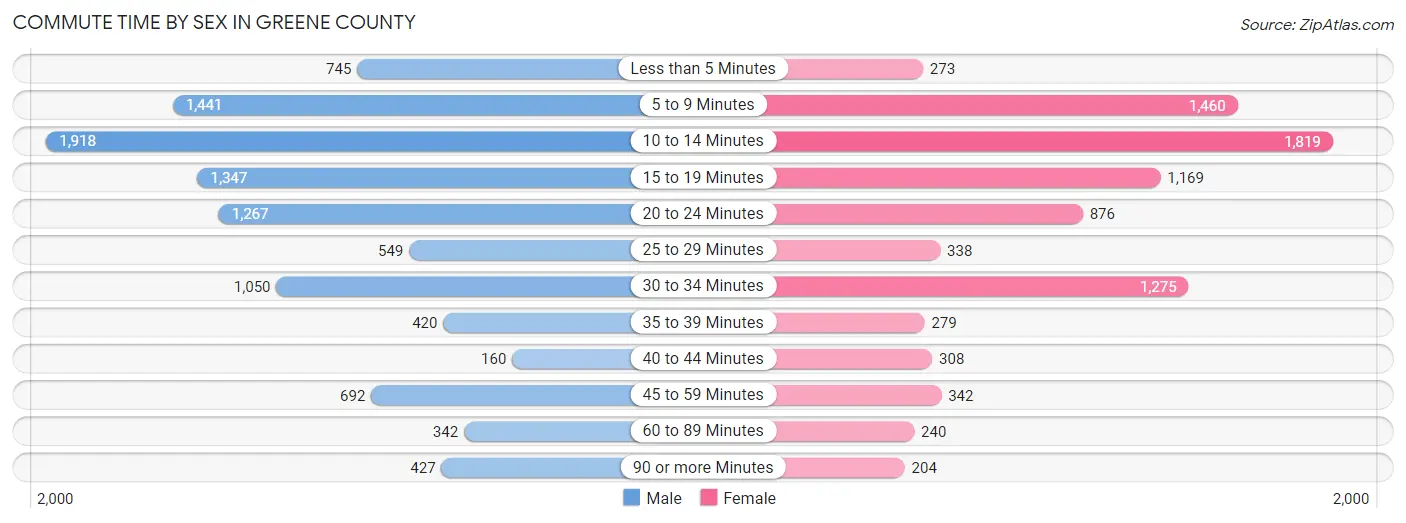
| Commute Time | Male | Female |
| Less than 5 Minutes | 745 (7.2%) | 273 (3.2%) |
| 5 to 9 Minutes | 1,441 (13.9%) | 1,460 (17.0%) |
| 10 to 14 Minutes | 1,918 (18.5%) | 1,819 (21.2%) |
| 15 to 19 Minutes | 1,347 (13.0%) | 1,169 (13.6%) |
| 20 to 24 Minutes | 1,267 (12.2%) | 876 (10.2%) |
| 25 to 29 Minutes | 549 (5.3%) | 338 (3.9%) |
| 30 to 34 Minutes | 1,050 (10.1%) | 1,275 (14.8%) |
| 35 to 39 Minutes | 420 (4.1%) | 279 (3.3%) |
| 40 to 44 Minutes | 160 (1.5%) | 308 (3.6%) |
| 45 to 59 Minutes | 692 (6.7%) | 342 (4.0%) |
| 60 to 89 Minutes | 342 (3.3%) | 240 (2.8%) |
| 90 or more Minutes | 427 (4.1%) | 204 (2.4%) |
Time of Departure to Work by Sex in Greene County
The most frequent times of departure to work in Greene County are 6:30 AM to 6:59 AM (1,601, 15.5%) for males and 7:00 AM to 7:29 AM (1,828, 21.3%) for females.
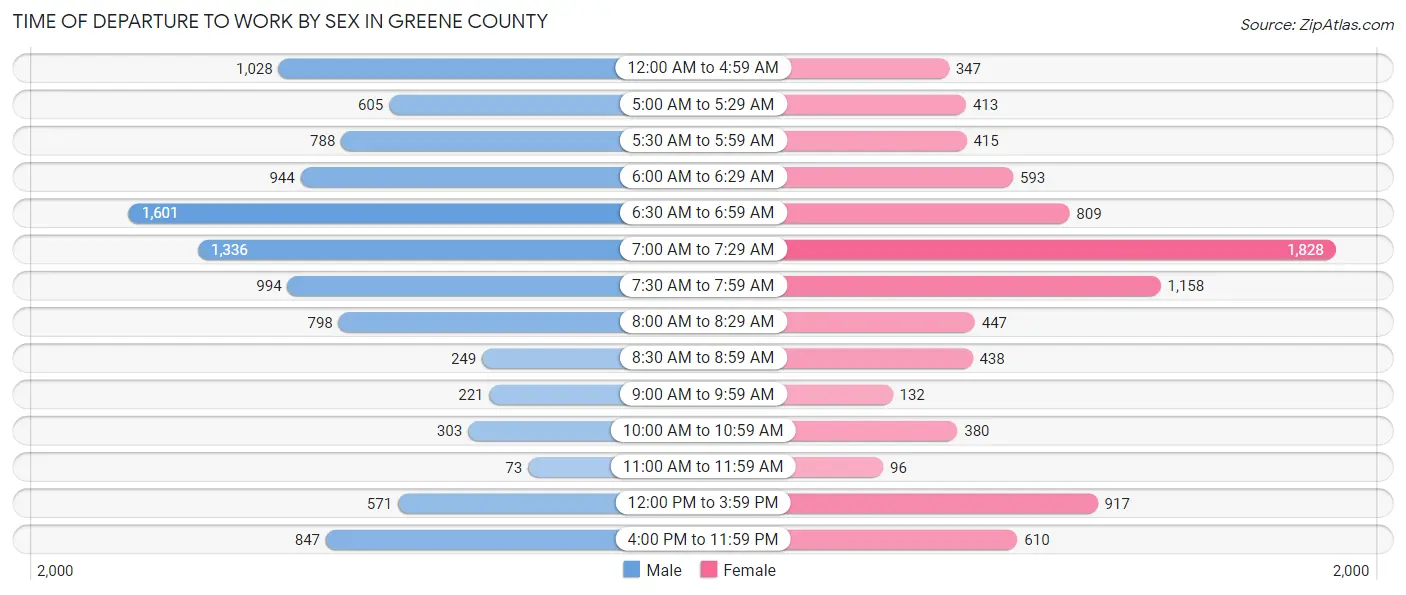
| Time of Departure | Male | Female |
| 12:00 AM to 4:59 AM | 1,028 (9.9%) | 347 (4.0%) |
| 5:00 AM to 5:29 AM | 605 (5.8%) | 413 (4.8%) |
| 5:30 AM to 5:59 AM | 788 (7.6%) | 415 (4.8%) |
| 6:00 AM to 6:29 AM | 944 (9.1%) | 593 (6.9%) |
| 6:30 AM to 6:59 AM | 1,601 (15.5%) | 809 (9.4%) |
| 7:00 AM to 7:29 AM | 1,336 (12.9%) | 1,828 (21.3%) |
| 7:30 AM to 7:59 AM | 994 (9.6%) | 1,158 (13.5%) |
| 8:00 AM to 8:29 AM | 798 (7.7%) | 447 (5.2%) |
| 8:30 AM to 8:59 AM | 249 (2.4%) | 438 (5.1%) |
| 9:00 AM to 9:59 AM | 221 (2.1%) | 132 (1.5%) |
| 10:00 AM to 10:59 AM | 303 (2.9%) | 380 (4.4%) |
| 11:00 AM to 11:59 AM | 73 (0.7%) | 96 (1.1%) |
| 12:00 PM to 3:59 PM | 571 (5.5%) | 917 (10.7%) |
| 4:00 PM to 11:59 PM | 847 (8.2%) | 610 (7.1%) |
| Total | 10,358 (100.0%) | 8,583 (100.0%) |
Housing Occupancy in Greene County
Occupancy by Ownership in Greene County
Of the total 17,741 dwellings in Greene County, owner-occupied units account for 11,421 (64.4%), while renter-occupied units make up 6,320 (35.6%).
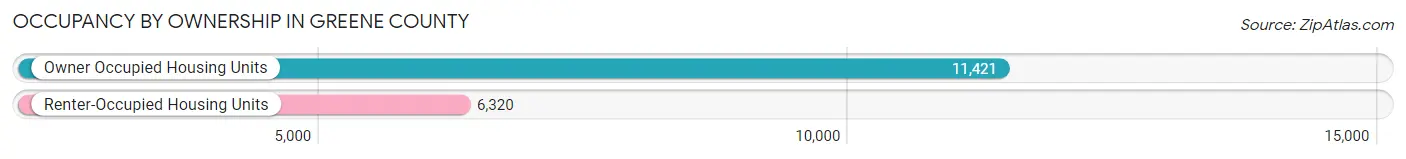
| Occupancy | # Housing Units | % Housing Units |
| Owner Occupied Housing Units | 11,421 | 64.4% |
| Renter-Occupied Housing Units | 6,320 | 35.6% |
| Total Occupied Housing Units | 17,741 | 100.0% |
Occupancy by Household Size in Greene County
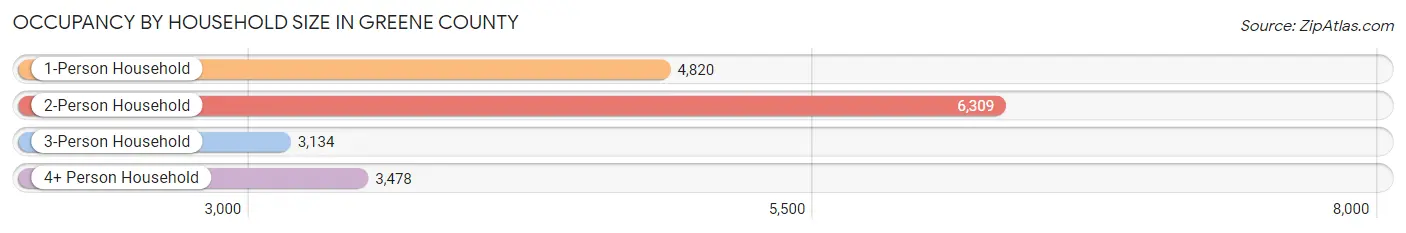
| Household Size | # Housing Units | % Housing Units |
| 1-Person Household | 4,820 | 27.2% |
| 2-Person Household | 6,309 | 35.6% |
| 3-Person Household | 3,134 | 17.7% |
| 4+ Person Household | 3,478 | 19.6% |
| Total Housing Units | 17,741 | 100.0% |
Occupancy by Ownership by Household Size in Greene County
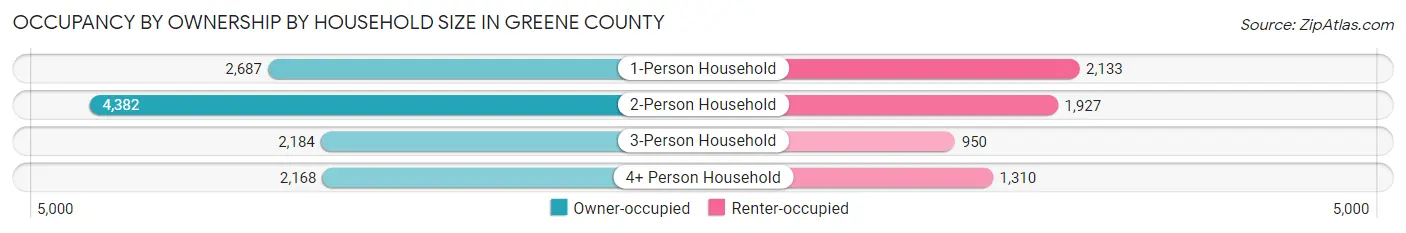
| Household Size | Owner-occupied | Renter-occupied |
| 1-Person Household | 2,687 (55.7%) | 2,133 (44.3%) |
| 2-Person Household | 4,382 (69.5%) | 1,927 (30.5%) |
| 3-Person Household | 2,184 (69.7%) | 950 (30.3%) |
| 4+ Person Household | 2,168 (62.3%) | 1,310 (37.7%) |
| Total Housing Units | 11,421 (64.4%) | 6,320 (35.6%) |
Occupancy by Educational Attainment in Greene County
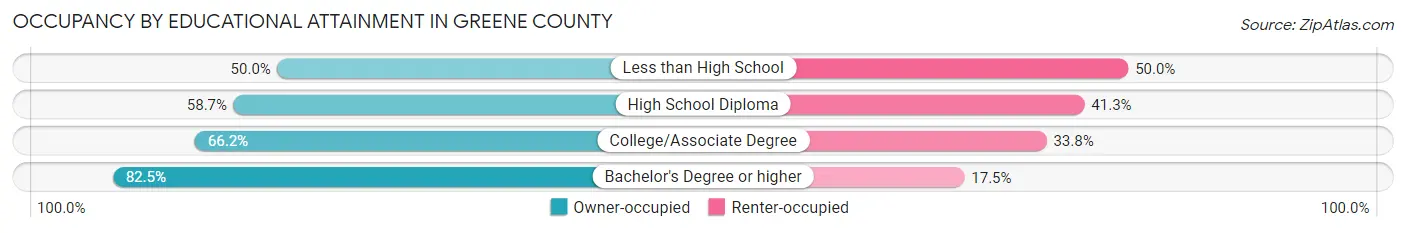
| Household Size | Owner-occupied | Renter-occupied |
| Less than High School | 965 (50.0%) | 964 (50.0%) |
| High School Diploma | 4,373 (58.7%) | 3,075 (41.3%) |
| College/Associate Degree | 3,330 (66.2%) | 1,698 (33.8%) |
| Bachelor's Degree or higher | 2,753 (82.5%) | 583 (17.5%) |
Occupancy by Age of Householder in Greene County
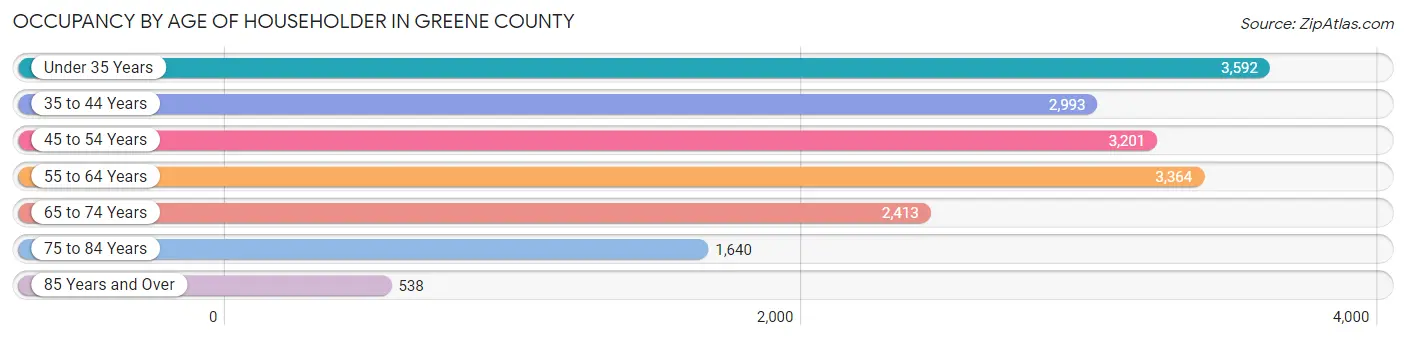
| Age Bracket | # Households | % Households |
| Under 35 Years | 3,592 | 20.3% |
| 35 to 44 Years | 2,993 | 16.9% |
| 45 to 54 Years | 3,201 | 18.0% |
| 55 to 64 Years | 3,364 | 19.0% |
| 65 to 74 Years | 2,413 | 13.6% |
| 75 to 84 Years | 1,640 | 9.2% |
| 85 Years and Over | 538 | 3.0% |
| Total | 17,741 | 100.0% |
Housing Finances in Greene County
Median Income by Occupancy in Greene County
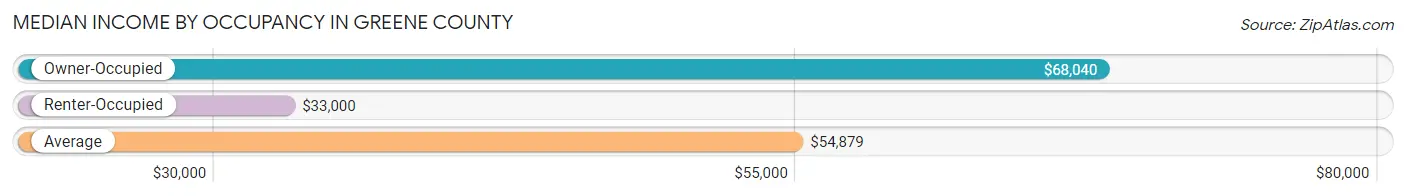
| Occupancy Type | # Households | Median Income |
| Owner-Occupied | 11,421 (64.4%) | $68,040 |
| Renter-Occupied | 6,320 (35.6%) | $33,000 |
| Average | 17,741 (100.0%) | $54,879 |
Occupancy by Householder Income Bracket in Greene County
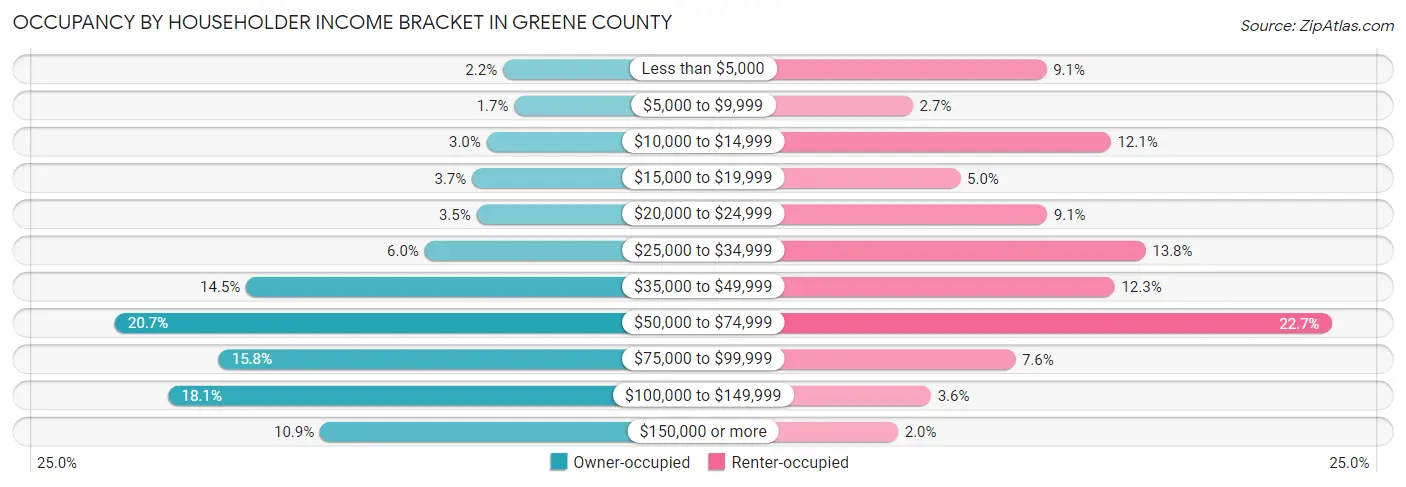
| Income Bracket | Owner-occupied | Renter-occupied |
| Less than $5,000 | 254 (2.2%) | 574 (9.1%) |
| $5,000 to $9,999 | 192 (1.7%) | 172 (2.7%) |
| $10,000 to $14,999 | 343 (3.0%) | 767 (12.1%) |
| $15,000 to $19,999 | 422 (3.7%) | 315 (5.0%) |
| $20,000 to $24,999 | 398 (3.5%) | 576 (9.1%) |
| $25,000 to $34,999 | 679 (5.9%) | 872 (13.8%) |
| $35,000 to $49,999 | 1,650 (14.4%) | 779 (12.3%) |
| $50,000 to $74,999 | 2,364 (20.7%) | 1,432 (22.7%) |
| $75,000 to $99,999 | 1,799 (15.8%) | 480 (7.6%) |
| $100,000 to $149,999 | 2,072 (18.1%) | 226 (3.6%) |
| $150,000 or more | 1,248 (10.9%) | 127 (2.0%) |
| Total | 11,421 (100.0%) | 6,320 (100.0%) |
Monthly Housing Cost Tiers in Greene County
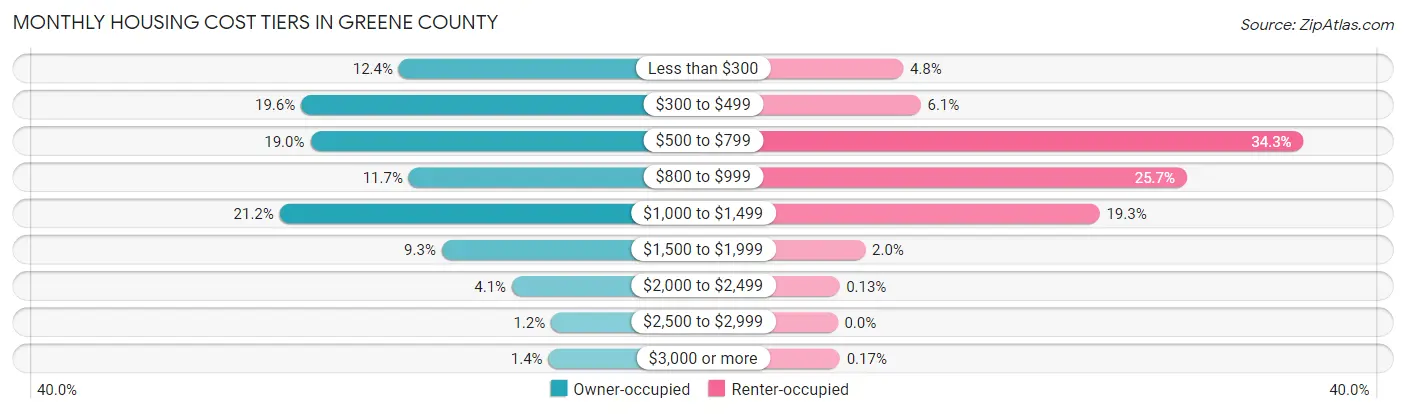
| Monthly Cost | Owner-occupied | Renter-occupied |
| Less than $300 | 1,421 (12.4%) | 305 (4.8%) |
| $300 to $499 | 2,243 (19.6%) | 387 (6.1%) |
| $500 to $799 | 2,165 (19.0%) | 2,169 (34.3%) |
| $800 to $999 | 1,337 (11.7%) | 1,626 (25.7%) |
| $1,000 to $1,499 | 2,424 (21.2%) | 1,220 (19.3%) |
| $1,500 to $1,999 | 1,060 (9.3%) | 129 (2.0%) |
| $2,000 to $2,499 | 469 (4.1%) | 8 (0.1%) |
| $2,500 to $2,999 | 140 (1.2%) | 0 (0.0%) |
| $3,000 or more | 162 (1.4%) | 11 (0.2%) |
| Total | 11,421 (100.0%) | 6,320 (100.0%) |
Physical Housing Characteristics in Greene County
Housing Structures in Greene County
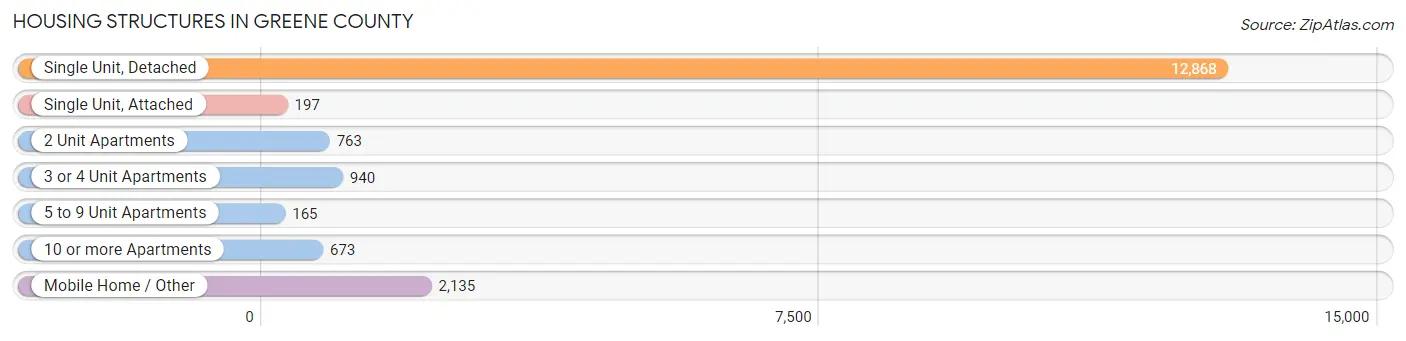
| Structure Type | # Housing Units | % Housing Units |
| Single Unit, Detached | 12,868 | 72.5% |
| Single Unit, Attached | 197 | 1.1% |
| 2 Unit Apartments | 763 | 4.3% |
| 3 or 4 Unit Apartments | 940 | 5.3% |
| 5 to 9 Unit Apartments | 165 | 0.9% |
| 10 or more Apartments | 673 | 3.8% |
| Mobile Home / Other | 2,135 | 12.0% |
| Total | 17,741 | 100.0% |
Housing Structures by Occupancy in Greene County
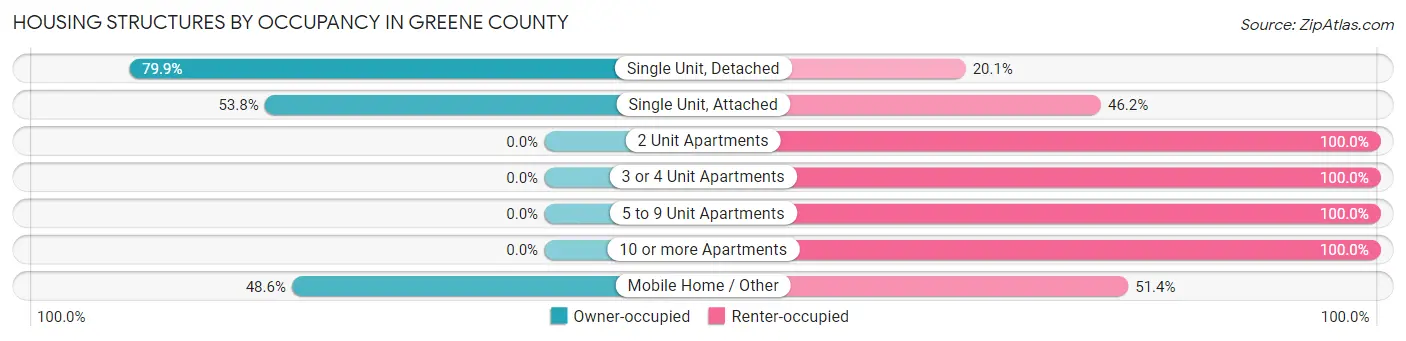
| Structure Type | Owner-occupied | Renter-occupied |
| Single Unit, Detached | 10,278 (79.9%) | 2,590 (20.1%) |
| Single Unit, Attached | 106 (53.8%) | 91 (46.2%) |
| 2 Unit Apartments | 0 (0.0%) | 763 (100.0%) |
| 3 or 4 Unit Apartments | 0 (0.0%) | 940 (100.0%) |
| 5 to 9 Unit Apartments | 0 (0.0%) | 165 (100.0%) |
| 10 or more Apartments | 0 (0.0%) | 673 (100.0%) |
| Mobile Home / Other | 1,037 (48.6%) | 1,098 (51.4%) |
| Total | 11,421 (64.4%) | 6,320 (35.6%) |
Housing Structures by Number of Rooms in Greene County
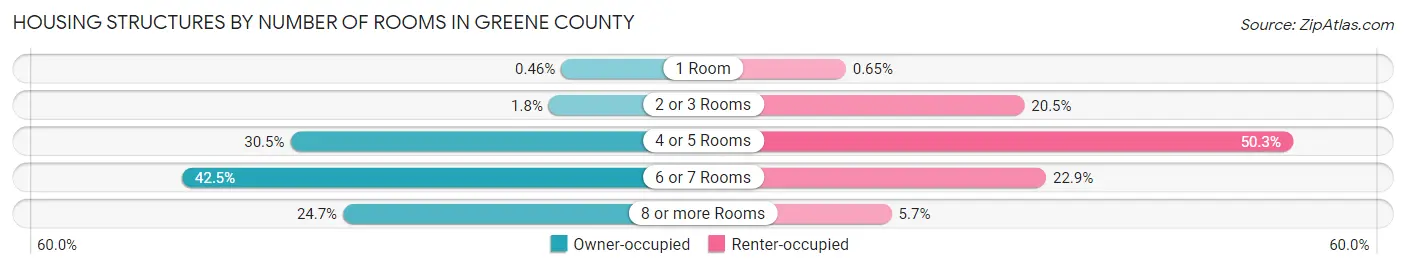
| Number of Rooms | Owner-occupied | Renter-occupied |
| 1 Room | 52 (0.5%) | 41 (0.6%) |
| 2 or 3 Rooms | 209 (1.8%) | 1,294 (20.5%) |
| 4 or 5 Rooms | 3,484 (30.5%) | 3,176 (50.2%) |
| 6 or 7 Rooms | 4,859 (42.5%) | 1,446 (22.9%) |
| 8 or more Rooms | 2,817 (24.7%) | 363 (5.7%) |
| Total | 11,421 (100.0%) | 6,320 (100.0%) |
Housing Structure by Heating Type in Greene County
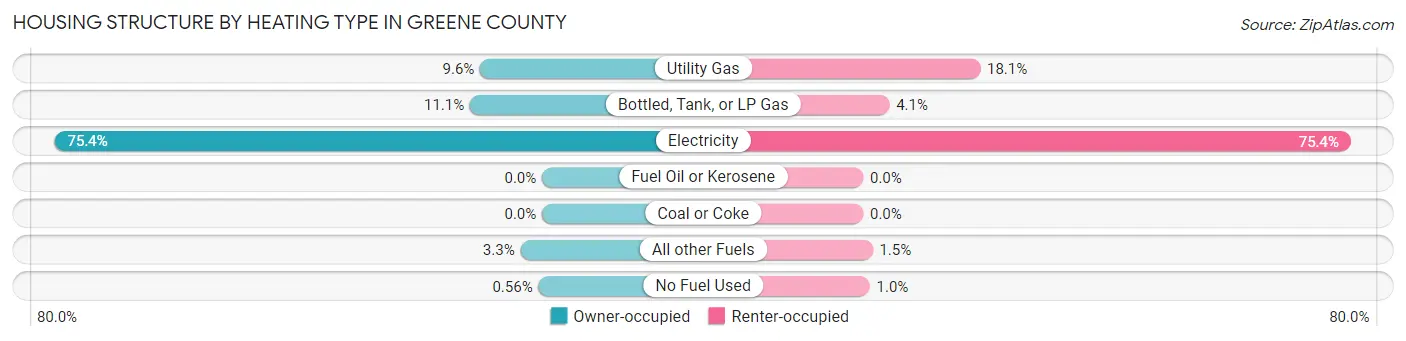
| Heating Type | Owner-occupied | Renter-occupied |
| Utility Gas | 1,093 (9.6%) | 1,143 (18.1%) |
| Bottled, Tank, or LP Gas | 1,272 (11.1%) | 256 (4.1%) |
| Electricity | 8,610 (75.4%) | 4,765 (75.4%) |
| Fuel Oil or Kerosene | 0 (0.0%) | 0 (0.0%) |
| Coal or Coke | 0 (0.0%) | 0 (0.0%) |
| All other Fuels | 382 (3.3%) | 92 (1.5%) |
| No Fuel Used | 64 (0.6%) | 64 (1.0%) |
| Total | 11,421 (100.0%) | 6,320 (100.0%) |
Household Vehicle Usage in Greene County
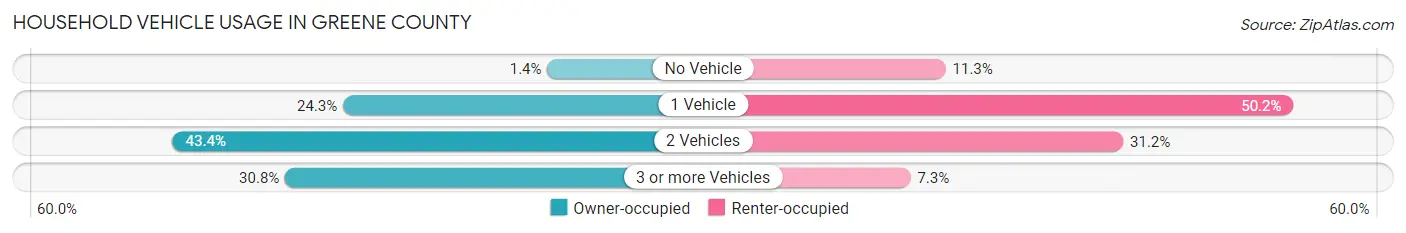
| Vehicles per Household | Owner-occupied | Renter-occupied |
| No Vehicle | 165 (1.4%) | 713 (11.3%) |
| 1 Vehicle | 2,779 (24.3%) | 3,174 (50.2%) |
| 2 Vehicles | 4,958 (43.4%) | 1,969 (31.2%) |
| 3 or more Vehicles | 3,519 (30.8%) | 464 (7.3%) |
| Total | 11,421 (100.0%) | 6,320 (100.0%) |
Real Estate & Mortgages in Greene County
Real Estate and Mortgage Overview in Greene County
| Characteristic | Without Mortgage | With Mortgage |
| Housing Units | 4,922 | 6,499 |
| Median Property Value | $116,700 | $171,500 |
| Median Household Income | $47,279 | $960 |
| Monthly Housing Costs | $378 | $151 |
| Real Estate Taxes | $556 | $399 |
Property Value by Mortgage Status in Greene County
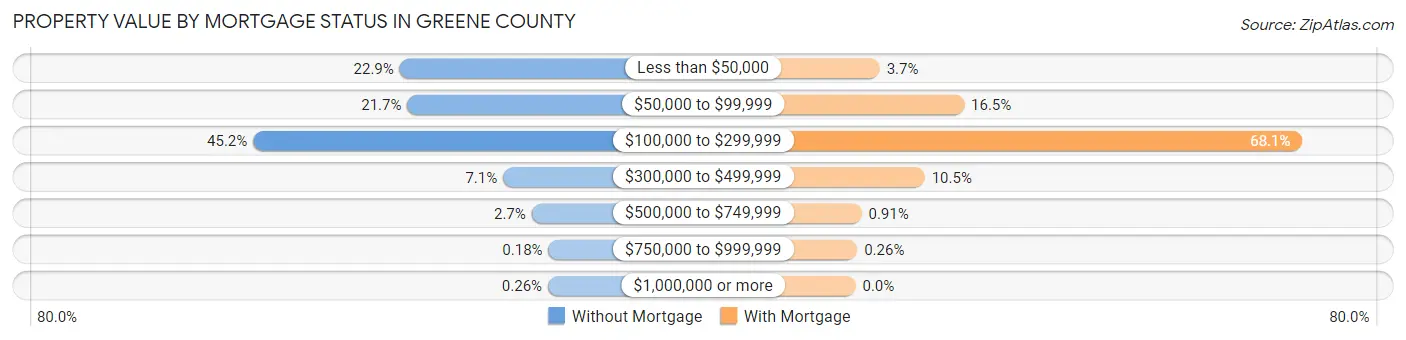
| Property Value | Without Mortgage | With Mortgage |
| Less than $50,000 | 1,125 (22.9%) | 239 (3.7%) |
| $50,000 to $99,999 | 1,067 (21.7%) | 1,075 (16.5%) |
| $100,000 to $299,999 | 2,224 (45.2%) | 4,424 (68.1%) |
| $300,000 to $499,999 | 349 (7.1%) | 685 (10.5%) |
| $500,000 to $749,999 | 135 (2.7%) | 59 (0.9%) |
| $750,000 to $999,999 | 9 (0.2%) | 17 (0.3%) |
| $1,000,000 or more | 13 (0.3%) | 0 (0.0%) |
| Total | 4,922 (100.0%) | 6,499 (100.0%) |
Household Income by Mortgage Status in Greene County
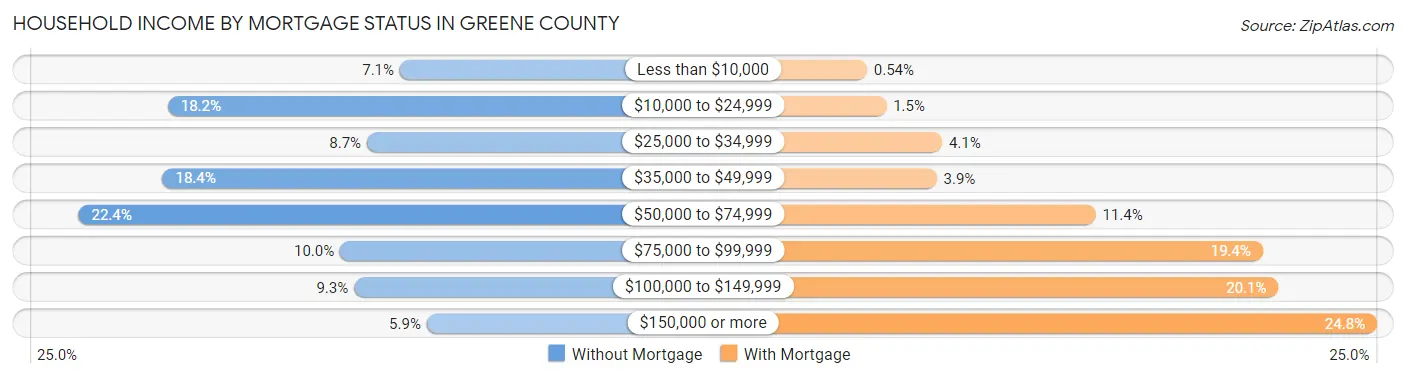
| Household Income | Without Mortgage | With Mortgage |
| Less than $10,000 | 351 (7.1%) | 35 (0.5%) |
| $10,000 to $24,999 | 895 (18.2%) | 95 (1.5%) |
| $25,000 to $34,999 | 428 (8.7%) | 268 (4.1%) |
| $35,000 to $49,999 | 907 (18.4%) | 251 (3.9%) |
| $50,000 to $74,999 | 1,104 (22.4%) | 743 (11.4%) |
| $75,000 to $99,999 | 491 (10.0%) | 1,260 (19.4%) |
| $100,000 to $149,999 | 458 (9.3%) | 1,308 (20.1%) |
| $150,000 or more | 288 (5.9%) | 1,614 (24.8%) |
| Total | 4,922 (100.0%) | 6,499 (100.0%) |
Property Value to Household Income Ratio in Greene County
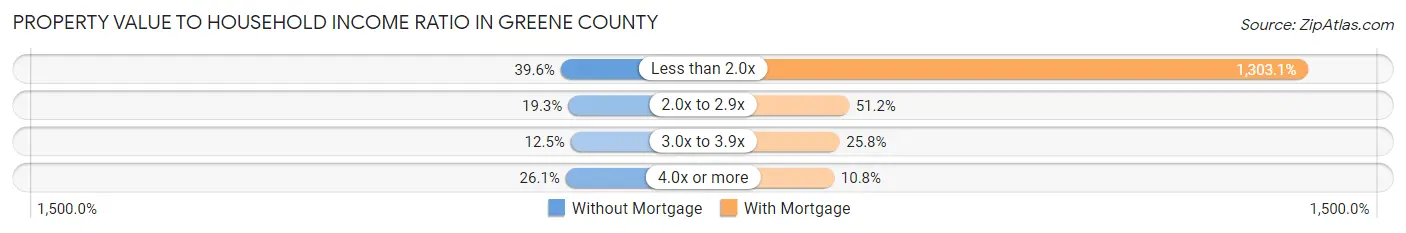
| Value-to-Income Ratio | Without Mortgage | With Mortgage |
| Less than 2.0x | 1,951 (39.6%) | 84,691 (1,303.1%) |
| 2.0x to 2.9x | 951 (19.3%) | 3,326 (51.2%) |
| 3.0x to 3.9x | 615 (12.5%) | 1,675 (25.8%) |
| 4.0x or more | 1,285 (26.1%) | 699 (10.8%) |
| Total | 4,922 (100.0%) | 6,499 (100.0%) |
Real Estate Taxes by Mortgage Status in Greene County
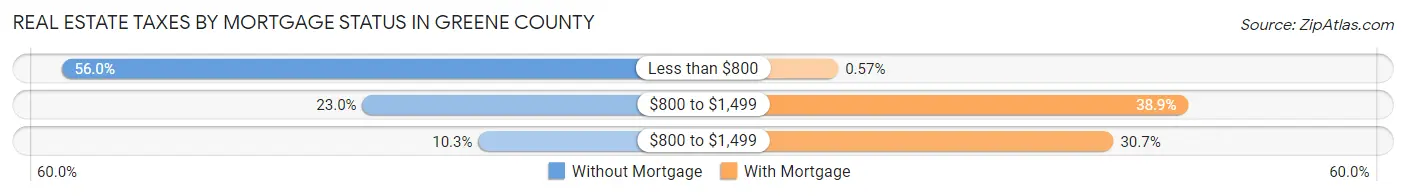
| Property Taxes | Without Mortgage | With Mortgage |
| Less than $800 | 2,754 (55.9%) | 37 (0.6%) |
| $800 to $1,499 | 1,131 (23.0%) | 2,530 (38.9%) |
| $800 to $1,499 | 506 (10.3%) | 1,997 (30.7%) |
| Total | 4,922 (100.0%) | 6,499 (100.0%) |
Health & Disability in Greene County
Health Insurance Coverage by Age in Greene County
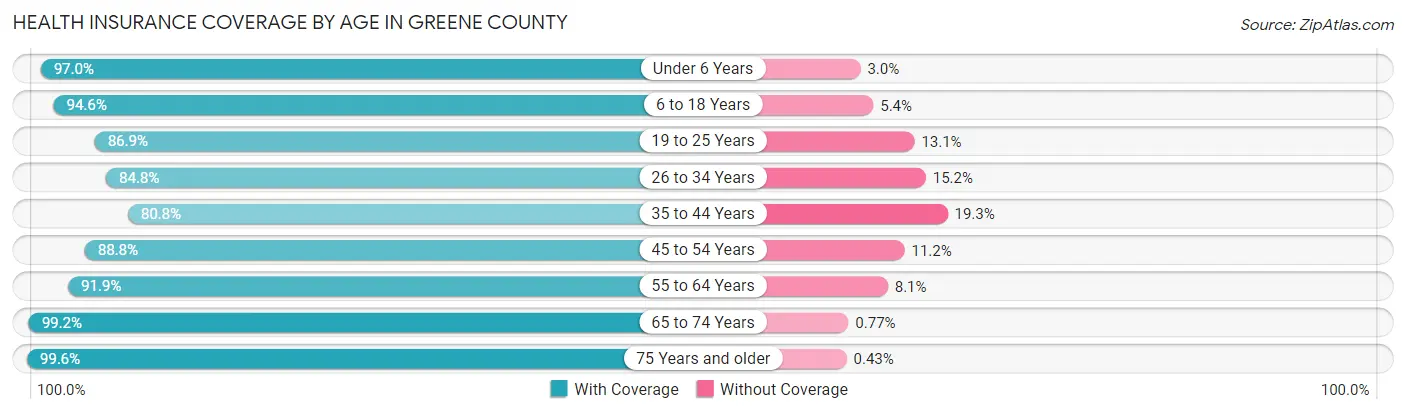
| Age Bracket | With Coverage | Without Coverage |
| Under 6 Years | 3,609 (97.0%) | 112 (3.0%) |
| 6 to 18 Years | 7,413 (94.6%) | 424 (5.4%) |
| 19 to 25 Years | 3,775 (86.9%) | 568 (13.1%) |
| 26 to 34 Years | 4,369 (84.8%) | 783 (15.2%) |
| 35 to 44 Years | 4,594 (80.7%) | 1,095 (19.3%) |
| 45 to 54 Years | 5,249 (88.8%) | 664 (11.2%) |
| 55 to 64 Years | 5,154 (91.9%) | 455 (8.1%) |
| 65 to 74 Years | 4,107 (99.2%) | 32 (0.8%) |
| 75 Years and older | 3,018 (99.6%) | 13 (0.4%) |
| Total | 41,288 (90.9%) | 4,146 (9.1%) |
Health Insurance Coverage by Citizenship Status in Greene County
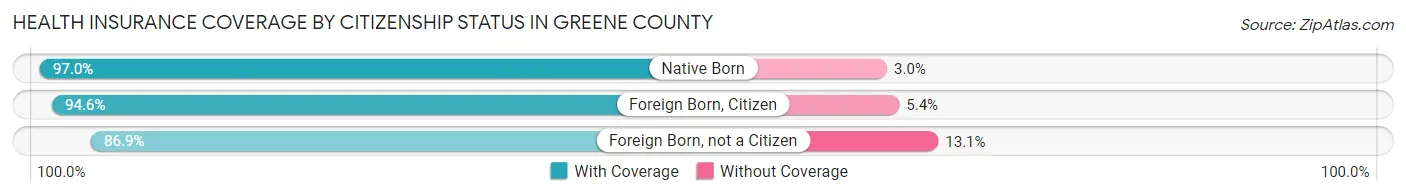
| Citizenship Status | With Coverage | Without Coverage |
| Native Born | 3,609 (97.0%) | 112 (3.0%) |
| Foreign Born, Citizen | 7,413 (94.6%) | 424 (5.4%) |
| Foreign Born, not a Citizen | 3,775 (86.9%) | 568 (13.1%) |
Health Insurance Coverage by Household Income in Greene County
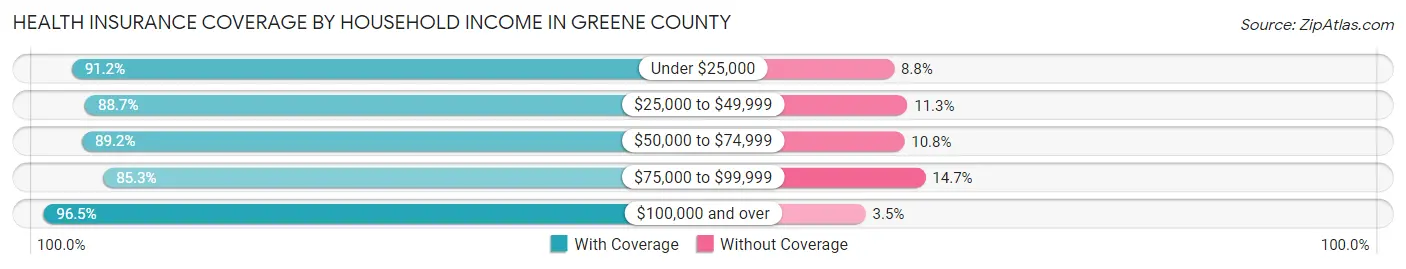
| Household Income | With Coverage | Without Coverage |
| Under $25,000 | 6,838 (91.2%) | 663 (8.8%) |
| $25,000 to $49,999 | 8,392 (88.7%) | 1,073 (11.3%) |
| $50,000 to $74,999 | 8,661 (89.2%) | 1,046 (10.8%) |
| $75,000 to $99,999 | 5,284 (85.3%) | 913 (14.7%) |
| $100,000 and over | 11,909 (96.5%) | 434 (3.5%) |
Public vs Private Health Insurance Coverage by Age in Greene County
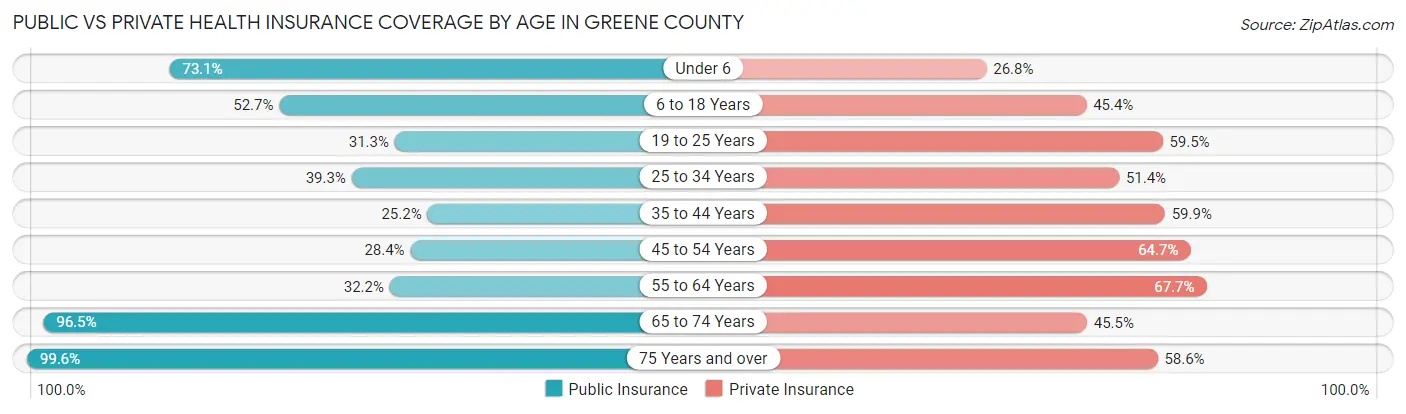
| Age Bracket | Public Insurance | Private Insurance |
| Under 6 | 2,721 (73.1%) | 998 (26.8%) |
| 6 to 18 Years | 4,132 (52.7%) | 3,555 (45.4%) |
| 19 to 25 Years | 1,359 (31.3%) | 2,585 (59.5%) |
| 25 to 34 Years | 2,024 (39.3%) | 2,650 (51.4%) |
| 35 to 44 Years | 1,435 (25.2%) | 3,410 (59.9%) |
| 45 to 54 Years | 1,678 (28.4%) | 3,824 (64.7%) |
| 55 to 64 Years | 1,807 (32.2%) | 3,795 (67.7%) |
| 65 to 74 Years | 3,995 (96.5%) | 1,882 (45.5%) |
| 75 Years and over | 3,018 (99.6%) | 1,776 (58.6%) |
| Total | 22,169 (48.8%) | 24,475 (53.9%) |
Disability Status by Sex by Age in Greene County
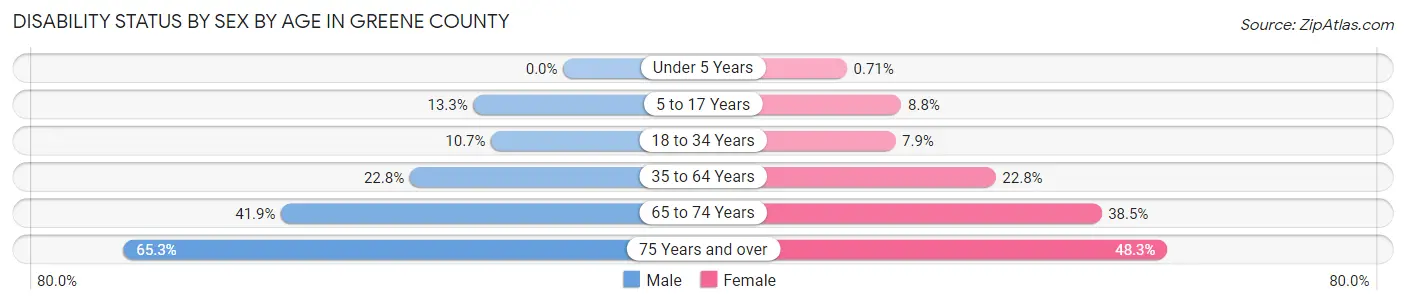
| Age Bracket | Male | Female |
| Under 5 Years | 0 (0.0%) | 9 (0.7%) |
| 5 to 17 Years | 533 (13.3%) | 368 (8.8%) |
| 18 to 34 Years | 544 (10.7%) | 389 (7.9%) |
| 35 to 64 Years | 1,973 (22.8%) | 1,949 (22.8%) |
| 65 to 74 Years | 805 (41.9%) | 854 (38.5%) |
| 75 Years and over | 808 (65.3%) | 867 (48.3%) |
Disability Class by Sex by Age in Greene County
Disability Class: Hearing Difficulty
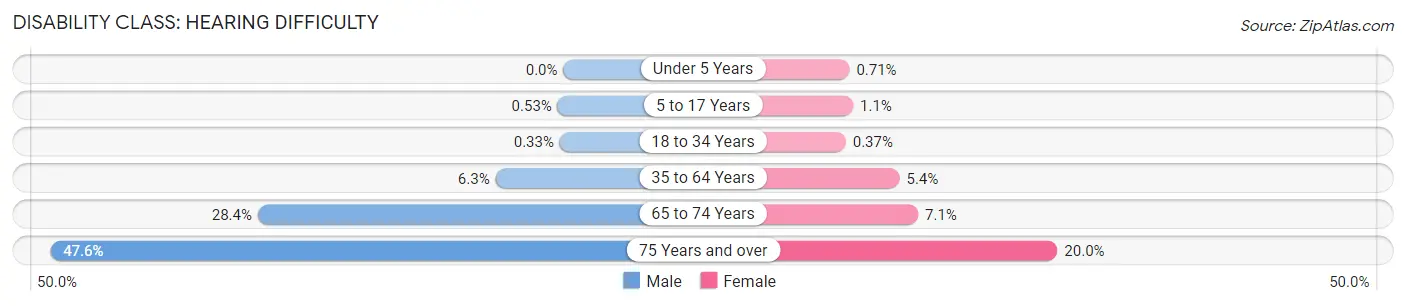
| Age Bracket | Male | Female |
| Under 5 Years | 0 (0.0%) | 9 (0.7%) |
| 5 to 17 Years | 21 (0.5%) | 44 (1.1%) |
| 18 to 34 Years | 17 (0.3%) | 18 (0.4%) |
| 35 to 64 Years | 546 (6.3%) | 458 (5.4%) |
| 65 to 74 Years | 545 (28.4%) | 157 (7.1%) |
| 75 Years and over | 589 (47.6%) | 359 (20.0%) |
Disability Class: Vision Difficulty
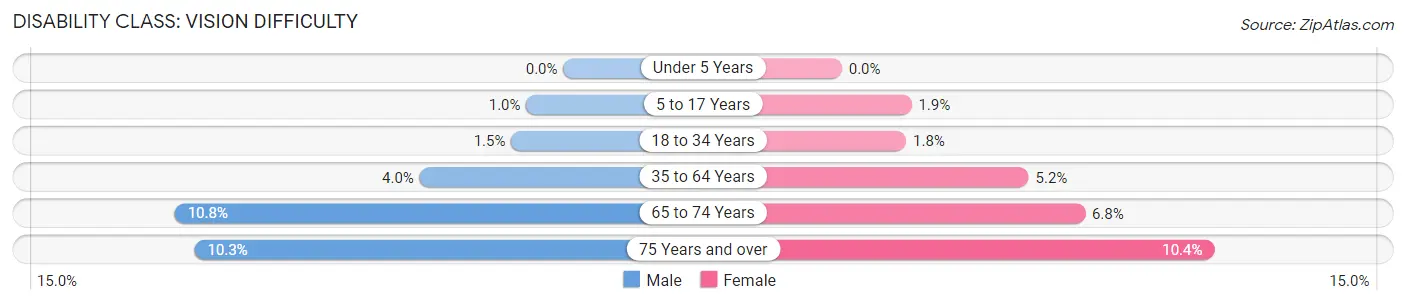
| Age Bracket | Male | Female |
| Under 5 Years | 0 (0.0%) | 0 (0.0%) |
| 5 to 17 Years | 41 (1.0%) | 81 (1.9%) |
| 18 to 34 Years | 74 (1.5%) | 88 (1.8%) |
| 35 to 64 Years | 347 (4.0%) | 444 (5.2%) |
| 65 to 74 Years | 208 (10.8%) | 150 (6.8%) |
| 75 Years and over | 127 (10.3%) | 186 (10.4%) |
Disability Class: Cognitive Difficulty
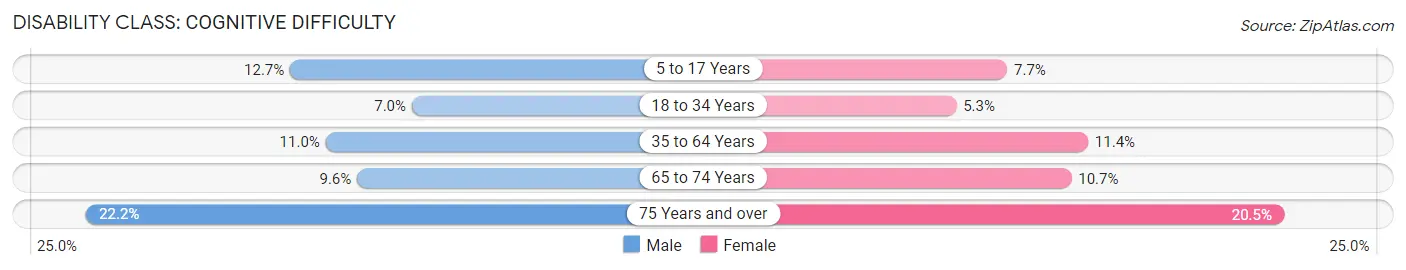
| Age Bracket | Male | Female |
| 5 to 17 Years | 507 (12.7%) | 321 (7.7%) |
| 18 to 34 Years | 358 (7.0%) | 261 (5.3%) |
| 35 to 64 Years | 956 (11.0%) | 976 (11.4%) |
| 65 to 74 Years | 184 (9.6%) | 236 (10.6%) |
| 75 Years and over | 274 (22.2%) | 368 (20.5%) |
Disability Class: Ambulatory Difficulty
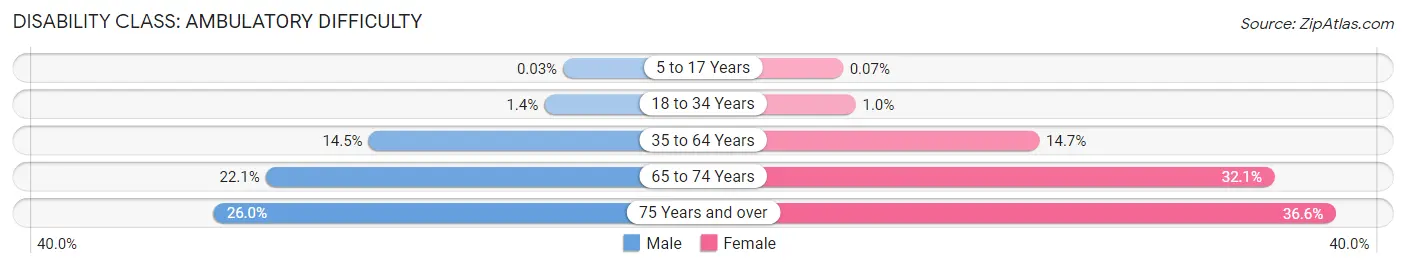
| Age Bracket | Male | Female |
| 5 to 17 Years | 1 (0.0%) | 3 (0.1%) |
| 18 to 34 Years | 73 (1.4%) | 50 (1.0%) |
| 35 to 64 Years | 1,254 (14.5%) | 1,252 (14.6%) |
| 65 to 74 Years | 425 (22.1%) | 711 (32.1%) |
| 75 Years and over | 321 (26.0%) | 657 (36.6%) |
Disability Class: Self-Care Difficulty
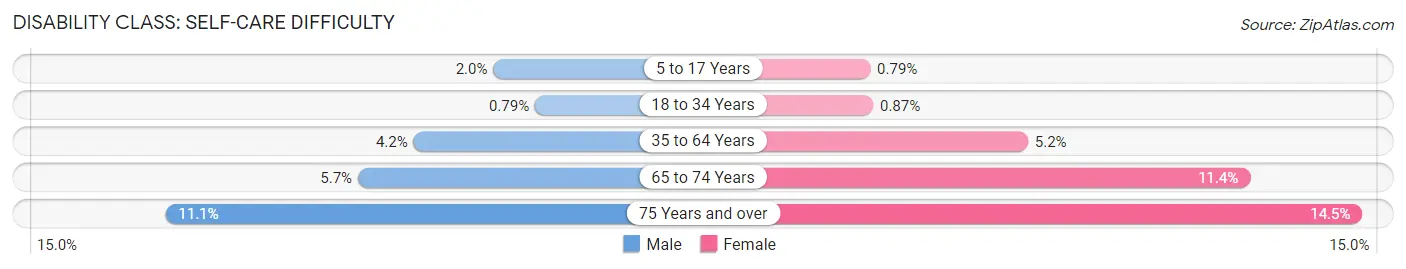
| Age Bracket | Male | Female |
| 5 to 17 Years | 78 (1.9%) | 33 (0.8%) |
| 18 to 34 Years | 40 (0.8%) | 43 (0.9%) |
| 35 to 64 Years | 361 (4.2%) | 443 (5.2%) |
| 65 to 74 Years | 110 (5.7%) | 252 (11.4%) |
| 75 Years and over | 137 (11.1%) | 260 (14.5%) |
Technology Access in Greene County
Computing Device Access in Greene County
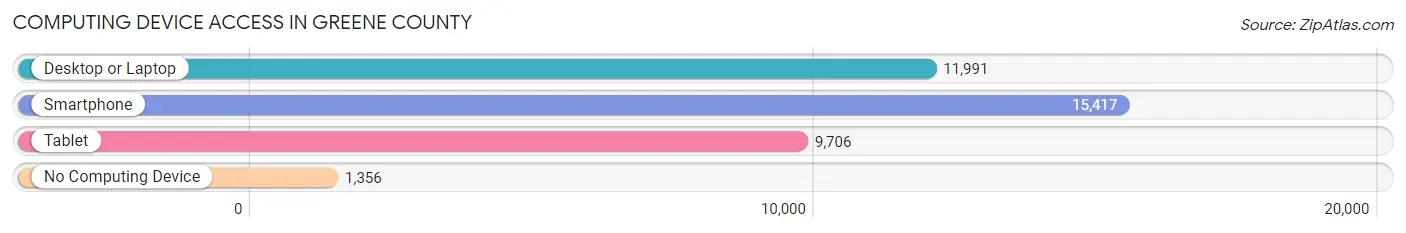
| Device Type | # Households | % Households |
| Desktop or Laptop | 11,991 | 67.6% |
| Smartphone | 15,417 | 86.9% |
| Tablet | 9,706 | 54.7% |
| No Computing Device | 1,356 | 7.6% |
| Total | 17,741 | 100.0% |
Internet Access in Greene County
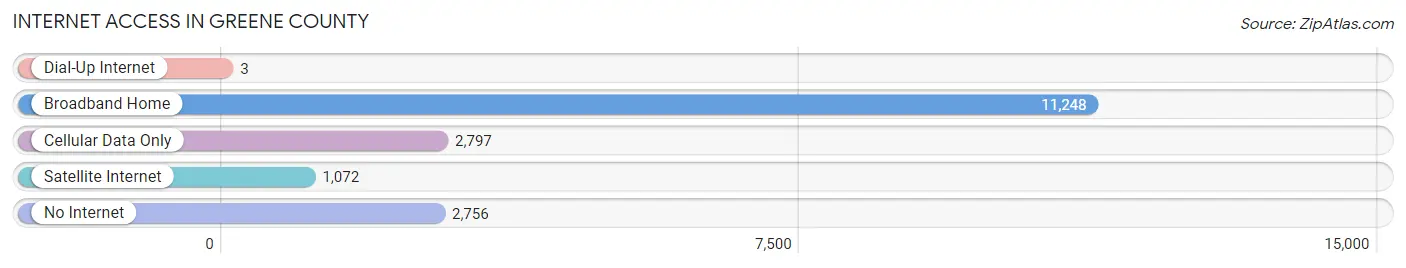
| Internet Type | # Households | % Households |
| Dial-Up Internet | 3 | 0.0% |
| Broadband Home | 11,248 | 63.4% |
| Cellular Data Only | 2,797 | 15.8% |
| Satellite Internet | 1,072 | 6.0% |
| No Internet | 2,756 | 15.5% |
| Total | 17,741 | 100.0% |
Greene County Summary
Greene County is located in the northeastern corner of Arkansas, and is bordered by Clay, Craighead, Lawrence, Mississippi, and Randolph counties. The county seat is Paragould, and the county was formed in 1833 from parts of Lawrence and Randolph counties. The county was named after Revolutionary War hero Nathanael Greene.
Geography
Greene County is located in the Arkansas Delta region, and is mostly flat with some rolling hills. The county is drained by the St. Francis River, which forms the county's eastern border. The county is also home to Crowley's Ridge, a narrow band of hills that runs through the county from the northwest to the southeast. The highest point in the county is located in Crowley's Ridge, at an elevation of 545 feet. The county has a total area of 602 square miles, of which 599 square miles is land and 3 square miles is water.
Economy
Agriculture is the main economic activity in Greene County. The county is home to a variety of crops, including cotton, soybeans, corn, and wheat. Livestock production is also important, with cattle, hogs, and poultry being the main animals raised. Manufacturing is also an important part of the economy, with companies such as Procter & Gamble, Tyson Foods, and Wal-Mart having operations in the county.
Demographics
As of the 2010 census, Greene County had a population of 42,090. The racial makeup of the county was 87.3% White, 9.2% Black or African American, 0.5% Native American, 0.4% Asian, 0.1% Pacific Islander, 1.2% from other races, and 1.3% from two or more races. Hispanic or Latino of any race were 2.7% of the population.
The median income for a household in the county was $35,945, and the median income for a family was $43,945. The per capita income for the county was $18,845. About 15.2% of families and 19.2% of the population were below the poverty line, including 25.2% of those under age 18 and 14.2% of those age 65 or over.
Education
Greene County is served by the Greene County Tech School District, which operates seven elementary schools, two middle schools, and two high schools. The county is also home to Arkansas State University-Paragould, a two-year college.
Conclusion
Greene County is a rural county located in the northeastern corner of Arkansas. The county is home to a variety of agricultural activities, as well as some manufacturing operations. The county has a population of 42,090, and is served by the Greene County Tech School District. Arkansas State University-Paragould is also located in the county.
Common Questions
What is the Total Population of Greene County?
Total Population of Greene County is 45,954.
What is the Total Male Population of Greene County?
Total Male Population of Greene County is 22,749.
What is the Total Female Population of Greene County?
Total Female Population of Greene County is 23,205.
What is the Ratio of Males per 100 Females in Greene County?
There are 98.03 Males per 100 Females in Greene County.
What is the Ratio of Females per 100 Males in Greene County?
There are 102.00 Females per 100 Males in Greene County.
What is the Median Population Age in Greene County?
Median Population Age in Greene County is 37.8 Years.
What is the Average Family Size in Greene County
Average Family Size in Greene County is 3.0 People.
What is the Average Household Size in Greene County
Average Household Size in Greene County is 2.5 People.
What is Per Capita Income in Greene County?
Per Capita income in Greene County is $26,941.
What is the Median Family Income in Greene County?
Median Family Income in Greene County is $63,750.
What is the Median Household income in Greene County?
Median Household Income in Greene County is $54,879.
What is Income or Wage Gap in Greene County?
Income or Wage Gap in Greene County is 26.9%.
Women in Greene County earn 73.1 cents for every dollar earned by a man.
What is Family Income Deficit in Greene County?
Family Income Deficit in Greene County is $11,569.
Families that are below poverty line in Greene County earn $11,569 less on average than the poverty threshold level.
What is Inequality or Gini Index in Greene County?
Inequality or Gini Index in Greene County is 0.43.
How Large is the Labor Force in Greene County?
There are 21,578 People in the Labor Forcein in Greene County.
What is the Percentage of People in the Labor Force in Greene County?
59.4% of People are in the Labor Force in Greene County.
What is the Unemployment Rate in Greene County?
Unemployment Rate in Greene County is 7.5%.