Grant County, AR
Grant County Map

Grant County Overview
18,022
TOTAL POPULATION
9,080
MALE POPULATION
8,942
FEMALE POPULATION
101.54
MALES / 100 FEMALES
98.48
FEMALES / 100 MALES
40.2
MEDIAN AGE
3.1
AVG FAMILY SIZE
2.6
AVG HOUSEHOLD SIZE
$35,170
PER CAPITA INCOME
$85,655
AVG FAMILY INCOME
$68,598
AVG HOUSEHOLD INCOME
33.1%
WAGE / INCOME GAP [ % ]
66.9¢/ $1
WAGE / INCOME GAP [ $ ]
$8,851
FAMILY INCOME DEFICIT
0.46
INEQUALITY / GINI INDEX
8,081
LABOR FORCE [ PEOPLE ]
55.6%
PERCENT IN LABOR FORCE
3.3%
UNEMPLOYMENT RATE
Grant County Area Codes
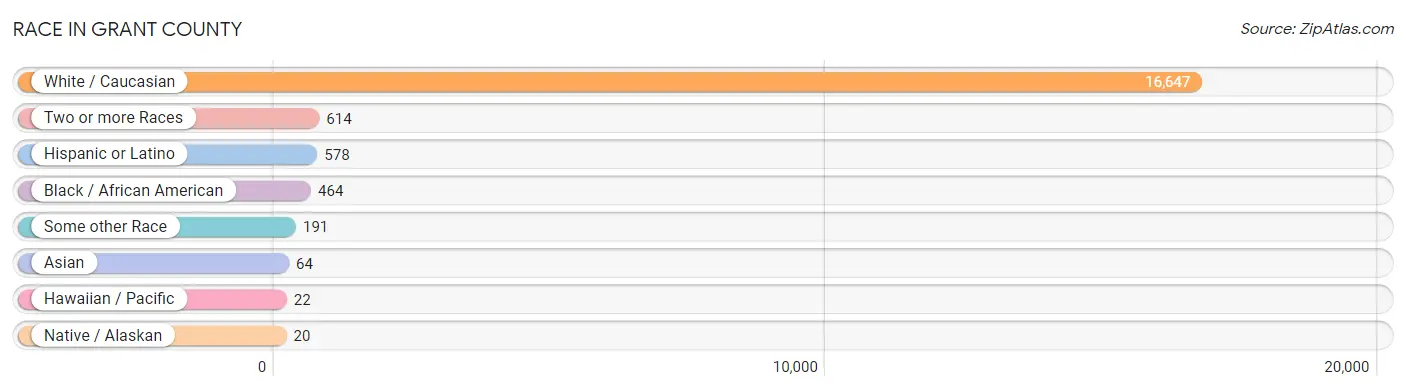
Race in Grant County
The most populous races in Grant County are White / Caucasian (16,647 | 92.4%), Two or more Races (614 | 3.4%), and Hispanic or Latino (578 | 3.2%).
| Race | # Population | % Population |
| Asian | 64 | 0.4% |
| Black / African American | 464 | 2.6% |
| Hawaiian / Pacific | 22 | 0.1% |
| Hispanic or Latino | 578 | 3.2% |
| Native / Alaskan | 20 | 0.1% |
| White / Caucasian | 16,647 | 92.4% |
| Two or more Races | 614 | 3.4% |
| Some other Race | 191 | 1.1% |
| Total | 18,022 | 100.0% |
Ancestry in Grant County
The most populous ancestries reported in Grant County are English (4,669 | 25.9%), American (2,682 | 14.9%), Irish (1,686 | 9.4%), German (1,292 | 7.2%), and Mexican (418 | 2.3%), together accounting for 59.6% of all Grant County residents.

| Ancestry | # Population | % Population |
| African | 114 | 0.6% |
| American | 2,682 | 14.9% |
| Apache | 13 | 0.1% |
| British | 39 | 0.2% |
| Central American | 36 | 0.2% |
| Cherokee | 25 | 0.1% |
| Choctaw | 15 | 0.1% |
| Colombian | 8 | 0.0% |
| Creek | 5 | 0.0% |
| Czech | 11 | 0.1% |
| Danish | 8 | 0.0% |
| Dutch | 143 | 0.8% |
| Eastern European | 25 | 0.1% |
| English | 4,669 | 25.9% |
| European | 152 | 0.8% |
| Filipino | 52 | 0.3% |
| French | 278 | 1.5% |
| French American Indian | 2 | 0.0% |
| French Canadian | 94 | 0.5% |
| German | 1,292 | 7.2% |
| Guatemalan | 18 | 0.1% |
| Irish | 1,686 | 9.4% |
| Italian | 131 | 0.7% |
| Korean | 23 | 0.1% |
| Laotian | 1 | 0.0% |
| Malaysian | 20 | 0.1% |
| Mexican | 418 | 2.3% |
| Native Hawaiian | 59 | 0.3% |
| Northern European | 6 | 0.0% |
| Norwegian | 17 | 0.1% |
| Osage | 2 | 0.0% |
| Polish | 90 | 0.5% |
| Portuguese | 85 | 0.5% |
| Puerto Rican | 112 | 0.6% |
| Salvadoran | 18 | 0.1% |
| Scandinavian | 26 | 0.1% |
| Scotch-Irish | 123 | 0.7% |
| Scottish | 157 | 0.9% |
| Slovak | 1 | 0.0% |
| South American | 8 | 0.0% |
| Sri Lankan | 20 | 0.1% |
| Subsaharan African | 115 | 0.6% |
| Swedish | 4 | 0.0% |
| Swiss | 28 | 0.2% |
| Welsh | 68 | 0.4% | View All 45 Rows |
Immigrants in Grant County
The most numerous immigrant groups reported in Grant County came from Latin America (130 | 0.7%), Central America (122 | 0.7%), Mexico (122 | 0.7%), Europe (80 | 0.4%), and Asia (73 | 0.4%), together accounting for 2.9% of all Grant County residents.

| Immigration Origin | # Population | % Population |
| Africa | 19 | 0.1% |
| Asia | 73 | 0.4% |
| Cameroon | 1 | 0.0% |
| Central America | 122 | 0.7% |
| China | 54 | 0.3% |
| Colombia | 8 | 0.0% |
| Denmark | 16 | 0.1% |
| Eastern Asia | 62 | 0.3% |
| England | 2 | 0.0% |
| Europe | 80 | 0.4% |
| France | 13 | 0.1% |
| Germany | 15 | 0.1% |
| Ireland | 33 | 0.2% |
| Japan | 8 | 0.0% |
| Latin America | 130 | 0.7% |
| Mexico | 122 | 0.7% |
| Middle Africa | 1 | 0.0% |
| Northern Europe | 52 | 0.3% |
| Philippines | 11 | 0.1% |
| South Africa | 18 | 0.1% |
| South America | 8 | 0.0% |
| South Eastern Asia | 11 | 0.1% |
| Taiwan | 54 | 0.3% |
| Western Europe | 28 | 0.2% | View All 24 Rows |
Sex and Age in Grant County
Sex and Age in Grant County
The most populous age groups in Grant County are 10 to 14 Years (682 | 7.5%) for men and 55 to 59 Years (705 | 7.9%) for women.

| Age Bracket | Male | Female |
| Under 5 Years | 501 (5.5%) | 431 (4.8%) |
| 5 to 9 Years | 491 (5.4%) | 465 (5.2%) |
| 10 to 14 Years | 682 (7.5%) | 623 (7.0%) |
| 15 to 19 Years | 680 (7.5%) | 514 (5.8%) |
| 20 to 24 Years | 563 (6.2%) | 463 (5.2%) |
| 25 to 29 Years | 568 (6.3%) | 520 (5.8%) |
| 30 to 34 Years | 584 (6.4%) | 559 (6.2%) |
| 35 to 39 Years | 666 (7.3%) | 662 (7.4%) |
| 40 to 44 Years | 444 (4.9%) | 418 (4.7%) |
| 45 to 49 Years | 560 (6.2%) | 572 (6.4%) |
| 50 to 54 Years | 584 (6.4%) | 678 (7.6%) |
| 55 to 59 Years | 621 (6.8%) | 705 (7.9%) |
| 60 to 64 Years | 620 (6.8%) | 575 (6.4%) |
| 65 to 69 Years | 483 (5.3%) | 495 (5.5%) |
| 70 to 74 Years | 442 (4.9%) | 466 (5.2%) |
| 75 to 79 Years | 417 (4.6%) | 286 (3.2%) |
| 80 to 84 Years | 118 (1.3%) | 304 (3.4%) |
| 85 Years and over | 56 (0.6%) | 206 (2.3%) |
| Total | 9,080 (100.0%) | 8,942 (100.0%) |
Families and Households in Grant County
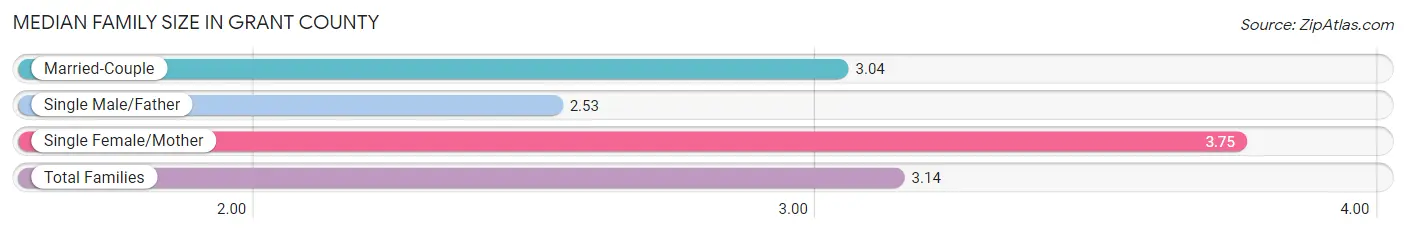
Median Family Size in Grant County
The median family size in Grant County is 3.14 persons per family, with single female/mother families (893 | 18.4%) accounting for the largest median family size of 3.75 persons per family. On the other hand, single male/father families (306 | 6.3%) represent the smallest median family size with 2.53 persons per family.
| Family Type | # Families | Family Size |
| Married-Couple | 3,655 (75.3%) | 3.04 |
| Single Male/Father | 306 (6.3%) | 2.53 |
| Single Female/Mother | 893 (18.4%) | 3.75 |
| Total Families | 4,854 (100.0%) | 3.14 |
Median Household Size in Grant County
The median household size in Grant County is 2.60 persons per household, with single female/mother households (893 | 13.0%) accounting for the largest median household size of 3.97 persons per household. non-family households (2,002 | 29.2%) represent the smallest median household size with 1.09 persons per household.

| Household Type | # Households | Household Size |
| Married-Couple | 3,655 (53.3%) | 3.08 |
| Single Male/Father | 306 (4.5%) | 2.87 |
| Single Female/Mother | 893 (13.0%) | 3.97 |
| Non-family | 2,002 (29.2%) | 1.09 |
| Total Households | 6,856 (100.0%) | 2.60 |
Household Size by Marriage Status in Grant County
Out of a total of 6,856 households in Grant County, 4,854 (70.8%) are family households, while 2,002 (29.2%) are nonfamily households. The most numerous type of family households are 2-person households, comprising 2,206, and the most common type of nonfamily households are 1-person households, comprising 1,845.

| Household Size | Family Households | Nonfamily Households |
| 1-Person Households | - | 1,845 (26.9%) |
| 2-Person Households | 2,206 (32.2%) | 138 (2.0%) |
| 3-Person Households | 1,321 (19.3%) | 19 (0.3%) |
| 4-Person Households | 906 (13.2%) | 0 (0.0%) |
| 5-Person Households | 241 (3.5%) | 0 (0.0%) |
| 6-Person Households | 161 (2.4%) | 0 (0.0%) |
| 7+ Person Households | 19 (0.3%) | 0 (0.0%) |
| Total | 4,854 (70.8%) | 2,002 (29.2%) |
Female Fertility in Grant County
Fertility by Age in Grant County
Average fertility rate in Grant County is 41.0 births per 1,000 women. Women in the age bracket of 20 to 34 years have the highest fertility rate with 82.0 births per 1,000 women. Women in the age bracket of 20 to 34 years acount for 82.4% of all women with births.

| Age Bracket | Women with Births | Births / 1,000 Women |
| 15 to 19 years | 26 (17.0%) | 51.0 |
| 20 to 34 years | 126 (82.4%) | 82.0 |
| 35 to 50 years | 1 (0.6%) | 1.0 |
| Total | 153 (100.0%) | 41.0 |
Fertility by Age by Marriage Status in Grant County
52.3% of women with births (153) in Grant County are married. The highest percentage of unmarried women with births falls into 15 to 19 years age bracket with 100.0% of them unmarried at the time of birth, while the lowest percentage of unmarried women with births belong to 35 to 50 years age bracket with 0.0% of them unmarried.

| Age Bracket | Married | Unmarried |
| 15 to 19 years | 0 (0.0%) | 26 (100.0%) |
| 20 to 34 years | 79 (62.7%) | 47 (37.3%) |
| 35 to 50 years | 1 (100.0%) | 0 (0.0%) |
| Total | 80 (52.3%) | 73 (47.7%) |
Fertility by Education in Grant County

| Educational Attainment | Women with Births | Births / 1,000 Women |
| Less than High School | 45 (29.4%) | 84.0 |
| High School Diploma | 62 (40.5%) | 49.0 |
| College or Associate's Degree | 32 (20.9%) | 26.0 |
| Bachelor's Degree | 14 (9.1%) | 30.0 |
| Graduate Degree | 0 (0.0%) | 0.0 |
| Total | 153 (100.0%) | 41.0 |
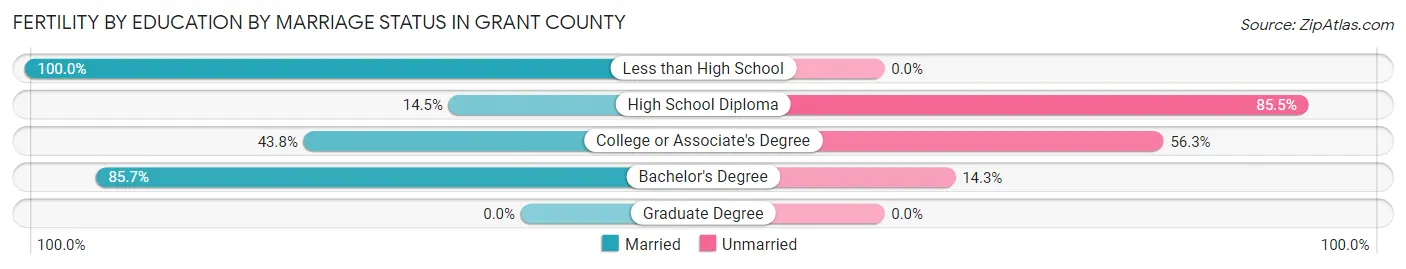
Fertility by Education by Marriage Status in Grant County
47.7% of women with births in Grant County are unmarried. Women with the educational attainment of less than high school are most likely to be married with 100.0% of them married at childbirth, while women with the educational attainment of high school diploma are least likely to be married with 85.5% of them unmarried at childbirth.
| Educational Attainment | Married | Unmarried |
| Less than High School | 45 (100.0%) | 0 (0.0%) |
| High School Diploma | 9 (14.5%) | 53 (85.5%) |
| College or Associate's Degree | 14 (43.8%) | 18 (56.2%) |
| Bachelor's Degree | 12 (85.7%) | 2 (14.3%) |
| Graduate Degree | 0 (0.0%) | 0 (0.0%) |
| Total | 80 (52.3%) | 73 (47.7%) |
Income in Grant County
Income Overview in Grant County
Per Capita Income in Grant County is $35,170, while median incomes of families and households are $85,655 and $68,598 respectively.
| Characteristic | Number | Measure |
| Per Capita Income | 18,022 | $35,170 |
| Median Family Income | 4,854 | $85,655 |
| Mean Family Income | 4,854 | $106,029 |
| Median Household Income | 6,856 | $68,598 |
| Mean Household Income | 6,856 | $88,493 |
| Income Deficit | 4,854 | $8,851 |
| Wage / Income Gap (%) | 18,022 | 33.05% |
| Wage / Income Gap ($) | 18,022 | 66.95¢ per $1 |
| Gini / Inequality Index | 18,022 | 0.46 |
Earnings by Sex in Grant County
Average Earnings in Grant County are $41,966, $49,795 for men and $33,336 for women, a difference of 33.1%.

| Sex | Number | Average Earnings |
| Male | 4,539 (53.6%) | $49,795 |
| Female | 3,927 (46.4%) | $33,336 |
| Total | 8,466 (100.0%) | $41,966 |
Earnings by Sex by Income Bracket in Grant County
The most common earnings brackets in Grant County are $100,000+ for men (692 | 15.2%) and $30,000 to $34,999 for women (366 | 9.3%).

| Income | Male | Female |
| $2,499 or less | 260 (5.7%) | 182 (4.6%) |
| $2,500 to $4,999 | 151 (3.3%) | 160 (4.1%) |
| $5,000 to $7,499 | 102 (2.2%) | 65 (1.7%) |
| $7,500 to $9,999 | 94 (2.1%) | 62 (1.6%) |
| $10,000 to $12,499 | 224 (4.9%) | 50 (1.3%) |
| $12,500 to $14,999 | 112 (2.5%) | 100 (2.5%) |
| $15,000 to $17,499 | 46 (1.0%) | 272 (6.9%) |
| $17,500 to $19,999 | 52 (1.1%) | 138 (3.5%) |
| $20,000 to $22,499 | 37 (0.8%) | 238 (6.1%) |
| $22,500 to $24,999 | 62 (1.4%) | 198 (5.0%) |
| $25,000 to $29,999 | 123 (2.7%) | 257 (6.5%) |
| $30,000 to $34,999 | 210 (4.6%) | 366 (9.3%) |
| $35,000 to $39,999 | 132 (2.9%) | 238 (6.1%) |
| $40,000 to $44,999 | 353 (7.8%) | 273 (7.0%) |
| $45,000 to $49,999 | 323 (7.1%) | 243 (6.2%) |
| $50,000 to $54,999 | 177 (3.9%) | 148 (3.8%) |
| $55,000 to $64,999 | 445 (9.8%) | 238 (6.1%) |
| $65,000 to $74,999 | 330 (7.3%) | 160 (4.1%) |
| $75,000 to $99,999 | 614 (13.5%) | 322 (8.2%) |
| $100,000+ | 692 (15.2%) | 217 (5.5%) |
| Total | 4,539 (100.0%) | 3,927 (100.0%) |
Earnings by Sex by Educational Attainment in Grant County
Average earnings in Grant County are $57,977 for men and $38,069 for women, a difference of 34.3%. Men with an educational attainment of bachelor's degree enjoy the highest average annual earnings of $88,542, while those with college or associate's degree education earn the least with $45,863. Women with an educational attainment of graduate degree earn the most with the average annual earnings of $85,114, while those with less than high school education have the smallest earnings of $21,000.

| Educational Attainment | Male Income | Female Income |
| Less than High School | $48,357 | $21,000 |
| High School Diploma | $54,408 | $23,542 |
| College or Associate's Degree | $45,863 | $38,583 |
| Bachelor's Degree | $88,542 | $51,618 |
| Graduate Degree | $83,594 | $85,114 |
| Total | $57,977 | $38,069 |
Family Income in Grant County
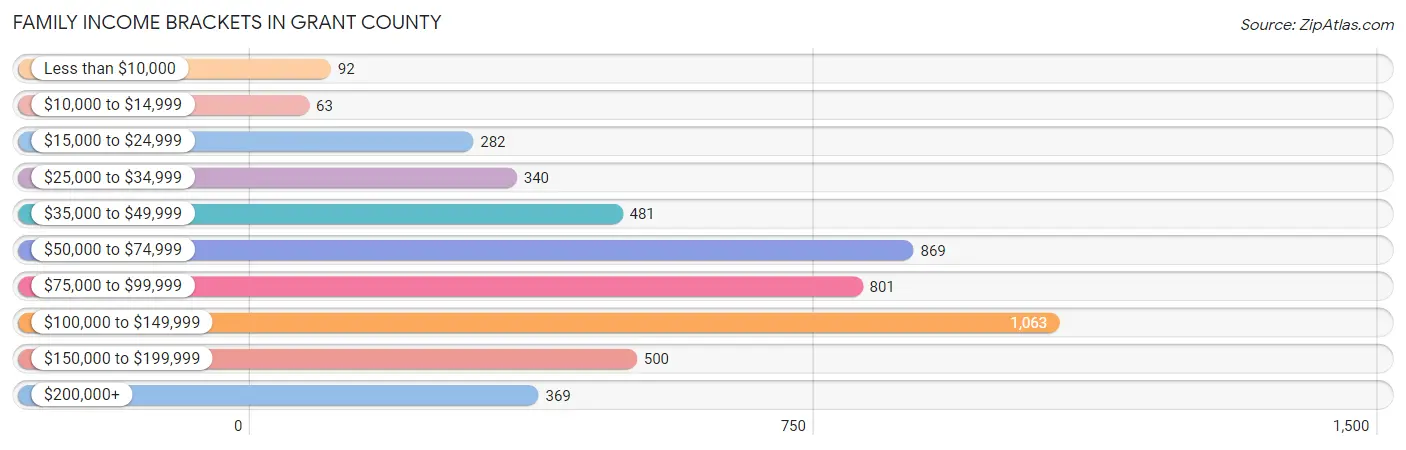
Family Income Brackets in Grant County
According to the Grant County family income data, there are 1,063 families falling into the $100,000 to $149,999 income range, which is the most common income bracket and makes up 21.9% of all families. Conversely, the $10,000 to $14,999 income bracket is the least frequent group with only 63 families (1.3%) belonging to this category.
| Income Bracket | # Families | % Families |
| Less than $10,000 | 92 | 1.9% |
| $10,000 to $14,999 | 63 | 1.3% |
| $15,000 to $24,999 | 282 | 5.8% |
| $25,000 to $34,999 | 340 | 7.0% |
| $35,000 to $49,999 | 481 | 9.9% |
| $50,000 to $74,999 | 869 | 17.9% |
| $75,000 to $99,999 | 801 | 16.5% |
| $100,000 to $149,999 | 1,063 | 21.9% |
| $150,000 to $199,999 | 500 | 10.3% |
| $200,000+ | 369 | 7.6% |
Family Income by Famaliy Size in Grant County
6-person families (122 | 2.5%) account for the highest median family income in Grant County with $101,875 per family, while 2-person families (2,321 | 47.8%) have the highest median income of $38,446 per family member.

| Income Bracket | # Families | Median Income |
| 2-Person Families | 2,321 (47.8%) | $76,893 |
| 3-Person Families | 1,257 (25.9%) | $96,402 |
| 4-Person Families | 971 (20.0%) | $79,488 |
| 5-Person Families | 169 (3.5%) | $76,979 |
| 6-Person Families | 122 (2.5%) | $101,875 |
| 7+ Person Families | 14 (0.3%) | $0 |
| Total | 4,854 (100.0%) | $85,655 |
Family Income by Number of Earners in Grant County
The median family income in Grant County is $85,655, with families comprising 3+ earners (404) having the highest median family income of $138,947, while families with no earners (995) have the lowest median family income of $45,337, accounting for 8.3% and 20.5% of families, respectively.
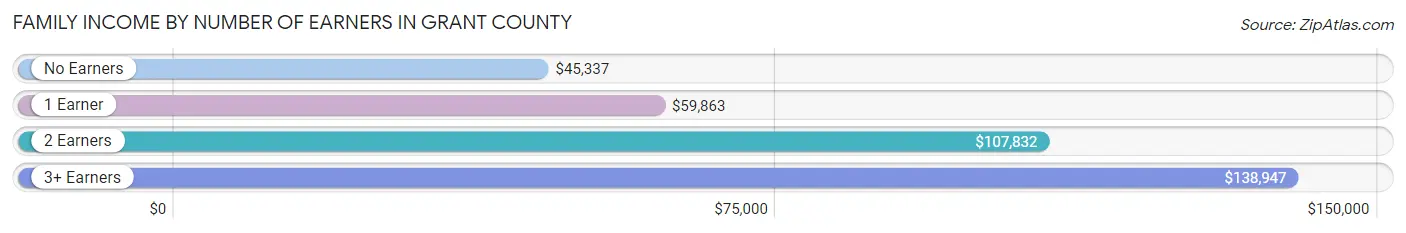
| Number of Earners | # Families | Median Income |
| No Earners | 995 (20.5%) | $45,337 |
| 1 Earner | 1,532 (31.6%) | $59,863 |
| 2 Earners | 1,923 (39.6%) | $107,832 |
| 3+ Earners | 404 (8.3%) | $138,947 |
| Total | 4,854 (100.0%) | $85,655 |
Household Income in Grant County
Household Income Brackets in Grant County
With 1,186 households falling in the category, the $100,000 to $149,999 income range is the most frequent in Grant County, accounting for 17.3% of all households. In contrast, only 261 households (3.8%) fall into the less than $10,000 income bracket, making it the least populous group.

| Income Bracket | # Households | % Households |
| Less than $10,000 | 261 | 3.8% |
| $10,000 to $14,999 | 261 | 3.8% |
| $15,000 to $24,999 | 679 | 9.9% |
| $25,000 to $34,999 | 576 | 8.4% |
| $35,000 to $49,999 | 802 | 11.7% |
| $50,000 to $74,999 | 1,138 | 16.6% |
| $75,000 to $99,999 | 1,070 | 15.6% |
| $100,000 to $149,999 | 1,186 | 17.3% |
| $150,000 to $199,999 | 500 | 7.3% |
| $200,000+ | 370 | 5.4% |
Household Income by Householder Age in Grant County
The median household income in Grant County is $68,598, with the highest median household income of $79,313 found in the 25 to 44 years age bracket for the primary householder. A total of 1,890 households (27.6%) fall into this category. Meanwhile, the 65+ years age bracket for the primary householder has the lowest median household income of $49,821, with 2,114 households (30.8%) in this group.

| Income Bracket | # Households | Median Income |
| 15 to 24 Years | 118 (1.7%) | $50,500 |
| 25 to 44 Years | 1,890 (27.6%) | $79,313 |
| 45 to 64 Years | 2,734 (39.9%) | $72,061 |
| 65+ Years | 2,114 (30.8%) | $49,821 |
| Total | 6,856 (100.0%) | $68,598 |
Poverty in Grant County
Income Below Poverty by Sex and Age in Grant County
With 14.2% poverty level for males and 12.9% for females among the residents of Grant County, 6 to 11 year old males and 5 year old females are the most vulnerable to poverty, with 267 males (39.3%) and 51 females (38.1%) in their respective age groups living below the poverty level.

| Age Bracket | Male | Female |
| Under 5 Years | 78 (16.9%) | 49 (11.4%) |
| 5 Years | 1 (1.1%) | 51 (38.1%) |
| 6 to 11 Years | 267 (39.3%) | 168 (26.8%) |
| 12 to 14 Years | 22 (5.5%) | 35 (10.8%) |
| 15 Years | 5 (4.8%) | 25 (13.2%) |
| 16 and 17 Years | 26 (9.4%) | 15 (10.6%) |
| 18 to 24 Years | 209 (24.3%) | 103 (16.0%) |
| 25 to 34 Years | 97 (8.6%) | 205 (19.1%) |
| 35 to 44 Years | 141 (13.0%) | 63 (5.9%) |
| 45 to 54 Years | 180 (15.8%) | 110 (8.8%) |
| 55 to 64 Years | 167 (13.5%) | 203 (16.0%) |
| 65 to 74 Years | 49 (5.4%) | 37 (3.8%) |
| 75 Years and over | 29 (5.0%) | 78 (10.7%) |
| Total | 1,271 (14.2%) | 1,142 (12.9%) |
Income Above Poverty by Sex and Age in Grant County
According to the poverty statistics in Grant County, males aged 5 years and females aged 65 to 74 years are the age groups that are most secure financially, with 98.9% of males and 96.2% of females in these age groups living above the poverty line.

| Age Bracket | Male | Female |
| Under 5 Years | 384 (83.1%) | 380 (88.6%) |
| 5 Years | 92 (98.9%) | 83 (61.9%) |
| 6 to 11 Years | 413 (60.7%) | 458 (73.2%) |
| 12 to 14 Years | 378 (94.5%) | 288 (89.2%) |
| 15 Years | 100 (95.2%) | 165 (86.8%) |
| 16 and 17 Years | 251 (90.6%) | 126 (89.4%) |
| 18 to 24 Years | 650 (75.7%) | 541 (84.0%) |
| 25 to 34 Years | 1,035 (91.4%) | 870 (80.9%) |
| 35 to 44 Years | 944 (87.0%) | 1,011 (94.1%) |
| 45 to 54 Years | 958 (84.2%) | 1,139 (91.2%) |
| 55 to 64 Years | 1,072 (86.5%) | 1,068 (84.0%) |
| 65 to 74 Years | 862 (94.6%) | 924 (96.2%) |
| 75 Years and over | 555 (95.0%) | 651 (89.3%) |
| Total | 7,694 (85.8%) | 7,704 (87.1%) |
Income Below Poverty Among Married-Couple Families in Grant County
The poverty statistics for married-couple families in Grant County show that 4.9% or 180 of the total 3,655 families live below the poverty line. Families with 3 or 4 children have the highest poverty rate of 25.0%, comprising of 42 families. On the other hand, families with 5 or more children have the lowest poverty rate of 0.0%, which includes 0 families.

| Children | Above Poverty | Below Poverty |
| No Children | 2,285 (97.7%) | 54 (2.3%) |
| 1 or 2 Children | 1,063 (92.7%) | 84 (7.3%) |
| 3 or 4 Children | 126 (75.0%) | 42 (25.0%) |
| 5 or more Children | 1 (100.0%) | 0 (0.0%) |
| Total | 3,475 (95.1%) | 180 (4.9%) |
Income Below Poverty Among Single-Parent Households in Grant County
According to the poverty data in Grant County, 22.9% or 70 single-father households and 25.3% or 226 single-mother households are living below the poverty line. Among single-father households, those with 3 or 4 children have the highest poverty rate, with 12 households (100.0%) experiencing poverty. Likewise, among single-mother households, those with 3 or 4 children have the highest poverty rate, with 74 households (61.2%) falling below the poverty line.

| Children | Single Father | Single Mother |
| No Children | 43 (30.5%) | 62 (15.8%) |
| 1 or 2 Children | 15 (9.8%) | 90 (23.7%) |
| 3 or 4 Children | 12 (100.0%) | 74 (61.2%) |
| 5 or more Children | 0 (0.0%) | 0 (0.0%) |
| Total | 70 (22.9%) | 226 (25.3%) |
Income Below Poverty Among Married-Couple vs Single-Parent Households in Grant County
The poverty data for Grant County shows that 180 of the married-couple family households (4.9%) and 296 of the single-parent households (24.7%) are living below the poverty level. Within the married-couple family households, those with 3 or 4 children have the highest poverty rate, with 42 households (25.0%) falling below the poverty line. Among the single-parent households, those with 3 or 4 children have the highest poverty rate, with 86 household (64.7%) living below poverty.

| Children | Married-Couple Families | Single-Parent Households |
| No Children | 54 (2.3%) | 105 (19.7%) |
| 1 or 2 Children | 84 (7.3%) | 105 (19.7%) |
| 3 or 4 Children | 42 (25.0%) | 86 (64.7%) |
| 5 or more Children | 0 (0.0%) | 0 (0.0%) |
| Total | 180 (4.9%) | 296 (24.7%) |
Employment Characteristics in Grant County
Employment by Class of Employer in Grant County
Among the 7,695 employed individuals in Grant County, private company employees (4,892 | 63.6%), state government employees (974 | 12.7%), and local government employees (542 | 7.0%) make up the most common classes of employment.
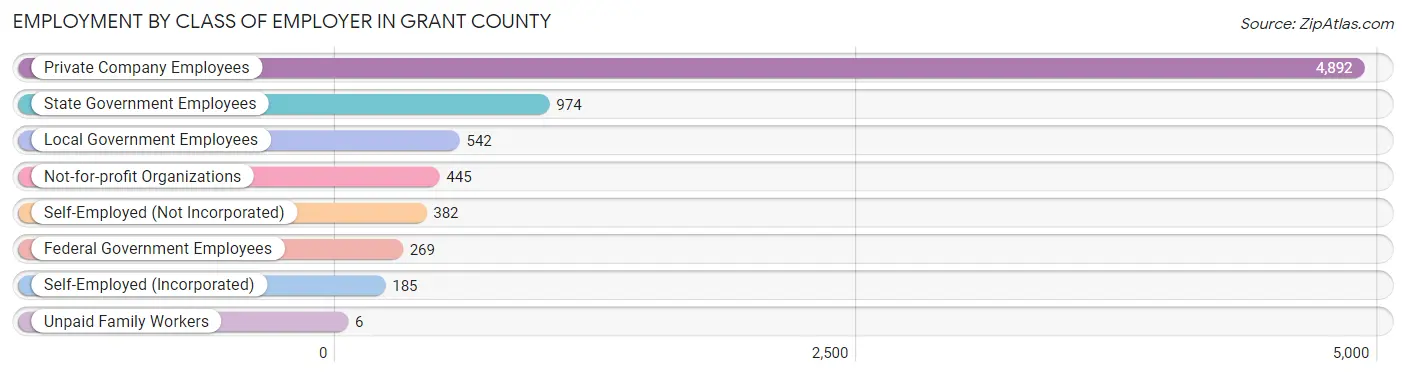
| Employer Class | # Employees | % Employees |
| Private Company Employees | 4,892 | 63.6% |
| Self-Employed (Incorporated) | 185 | 2.4% |
| Self-Employed (Not Incorporated) | 382 | 5.0% |
| Not-for-profit Organizations | 445 | 5.8% |
| Local Government Employees | 542 | 7.0% |
| State Government Employees | 974 | 12.7% |
| Federal Government Employees | 269 | 3.5% |
| Unpaid Family Workers | 6 | 0.1% |
| Total | 7,695 | 100.0% |
Employment Status by Age in Grant County
According to the labor force statistics for Grant County, out of the total population over 16 years of age (14,534), 55.6% or 8,081 individuals are in the labor force, with 3.3% or 267 of them unemployed. The age group with the highest labor force participation rate is 25 to 29 years, with 90.2% or 981 individuals in the labor force. Within the labor force, the 20 to 24 years age range has the highest percentage of unemployed individuals, with 15.0% or 109 of them being unemployed.

| Age Bracket | In Labor Force | Unemployed |
| 16 to 19 Years | 346 (38.5%) | 42 (12.1%) |
| 20 to 24 Years | 729 (71.1%) | 109 (15.0%) |
| 25 to 29 Years | 981 (90.2%) | 49 (5.0%) |
| 30 to 34 Years | 884 (77.3%) | 7 (0.8%) |
| 35 to 44 Years | 1,640 (74.9%) | 33 (2.0%) |
| 45 to 54 Years | 1,647 (68.8%) | 21 (1.3%) |
| 55 to 59 Years | 861 (64.9%) | 0 (0.0%) |
| 60 to 64 Years | 589 (49.3%) | 0 (0.0%) |
| 65 to 74 Years | 321 (17.0%) | 1 (0.3%) |
| 75 Years and over | 89 (6.4%) | 10 (11.2%) |
| Total | 8,081 (55.6%) | 267 (3.3%) |
Employment Status by Educational Attainment in Grant County
According to labor force statistics for Grant County, 70.7% of individuals (6,601) out of the total population between 25 and 64 years of age (9,336) are in the labor force, with 1.7% or 112 of them being unemployed. The group with the highest labor force participation rate are those with the educational attainment of bachelor's degree or higher, with 93.0% or 1,655 individuals in the labor force. Within the labor force, individuals with less than high school education have the highest percentage of unemployment, with 14.5% or 43 of them being unemployed.
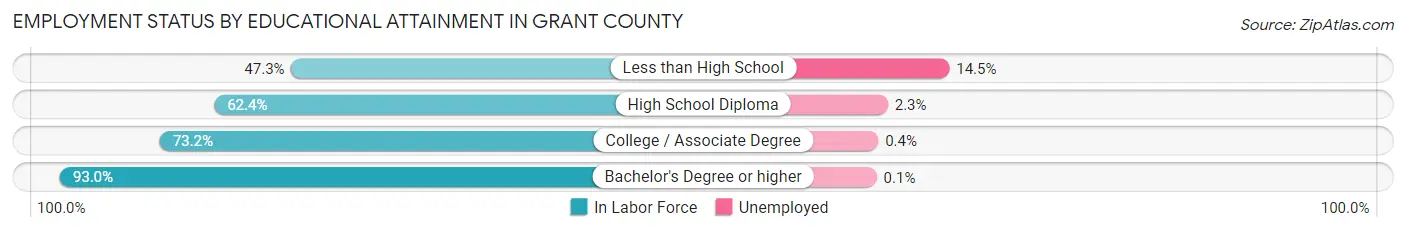
| Educational Attainment | In Labor Force | Unemployed |
| Less than High School | 296 (47.3%) | 91 (14.5%) |
| High School Diploma | 2,460 (62.4%) | 91 (2.3%) |
| College / Associate Degree | 2,187 (73.2%) | 12 (0.4%) |
| Bachelor's Degree or higher | 1,655 (93.0%) | 2 (0.1%) |
| Total | 6,601 (70.7%) | 159 (1.7%) |
Employment Occupations by Sex in Grant County
Management, Business, Science and Arts Occupations
The most common Management, Business, Science and Arts occupations in Grant County are Community & Social Service (840 | 10.8%), Management (728 | 9.3%), Health Diagnosing & Treating (530 | 6.8%), Education Instruction & Library (512 | 6.6%), and Business & Financial (433 | 5.6%).

Management, Business, Science and Arts Occupations by Sex
Within the Management, Business, Science and Arts occupations in Grant County, the most male-oriented occupations are Life, Physical & Social Science (100.0%), Architecture & Engineering (86.7%), and Computers, Engineering & Science (84.9%), while the most female-oriented occupations are Education Instruction & Library (94.5%), Health Technologists (94.5%), and Arts, Media & Entertainment (92.6%).

| Occupation | Male | Female |
| Management | 436 (59.9%) | 292 (40.1%) |
| Business & Financial | 137 (31.6%) | 296 (68.4%) |
| Computers, Engineering & Science | 236 (84.9%) | 42 (15.1%) |
| Computers & Mathematics | 62 (77.5%) | 18 (22.5%) |
| Architecture & Engineering | 156 (86.7%) | 24 (13.3%) |
| Life, Physical & Social Science | 18 (100.0%) | 0 (0.0%) |
| Community & Social Service | 161 (19.2%) | 679 (80.8%) |
| Education, Arts & Media | 100 (42.9%) | 133 (57.1%) |
| Legal Services & Support | 31 (45.6%) | 37 (54.4%) |
| Education Instruction & Library | 28 (5.5%) | 484 (94.5%) |
| Arts, Media & Entertainment | 2 (7.4%) | 25 (92.6%) |
| Health Diagnosing & Treating | 73 (13.8%) | 457 (86.2%) |
| Health Technologists | 10 (5.5%) | 171 (94.5%) |
| Total (Category) | 1,043 (37.1%) | 1,766 (62.9%) |
| Total (Overall) | 4,190 (53.8%) | 3,592 (46.2%) |
Services Occupations
The most common Services occupations in Grant County are Security & Protection (336 | 4.3%), Food Preparation & Serving (312 | 4.0%), Law Enforcement (286 | 3.7%), Personal Care & Service (245 | 3.2%), and Cleaning & Maintenance (152 | 1.9%).

Services Occupations by Sex
Within the Services occupations in Grant County, the most male-oriented occupations are Firefighting & Prevention (90.0%), Security & Protection (76.8%), and Law Enforcement (74.5%), while the most female-oriented occupations are Healthcare Support (100.0%), Personal Care & Service (85.3%), and Food Preparation & Serving (64.1%).

| Occupation | Male | Female |
| Healthcare Support | 0 (0.0%) | 114 (100.0%) |
| Security & Protection | 258 (76.8%) | 78 (23.2%) |
| Firefighting & Prevention | 45 (90.0%) | 5 (10.0%) |
| Law Enforcement | 213 (74.5%) | 73 (25.5%) |
| Food Preparation & Serving | 112 (35.9%) | 200 (64.1%) |
| Cleaning & Maintenance | 110 (72.4%) | 42 (27.6%) |
| Personal Care & Service | 36 (14.7%) | 209 (85.3%) |
| Total (Category) | 516 (44.5%) | 643 (55.5%) |
| Total (Overall) | 4,190 (53.8%) | 3,592 (46.2%) |
Sales and Office Occupations
The most common Sales and Office occupations in Grant County are Office & Administration (850 | 10.9%), and Sales & Related (654 | 8.4%).

Sales and Office Occupations by Sex

| Occupation | Male | Female |
| Sales & Related | 404 (61.8%) | 250 (38.2%) |
| Office & Administration | 143 (16.8%) | 707 (83.2%) |
| Total (Category) | 547 (36.4%) | 957 (63.6%) |
| Total (Overall) | 4,190 (53.8%) | 3,592 (46.2%) |
Natural Resources, Construction and Maintenance Occupations
The most common Natural Resources, Construction and Maintenance occupations in Grant County are Installation, Maintenance & Repair (482 | 6.2%), Construction & Extraction (423 | 5.4%), and Farming, Fishing & Forestry (50 | 0.6%).

Natural Resources, Construction and Maintenance Occupations by Sex

| Occupation | Male | Female |
| Farming, Fishing & Forestry | 50 (100.0%) | 0 (0.0%) |
| Construction & Extraction | 423 (100.0%) | 0 (0.0%) |
| Installation, Maintenance & Repair | 466 (96.7%) | 16 (3.3%) |
| Total (Category) | 939 (98.3%) | 16 (1.7%) |
| Total (Overall) | 4,190 (53.8%) | 3,592 (46.2%) |
Production, Transportation and Moving Occupations
The most common Production, Transportation and Moving occupations in Grant County are Production (644 | 8.3%), Material Moving (389 | 5.0%), and Transportation (322 | 4.1%).
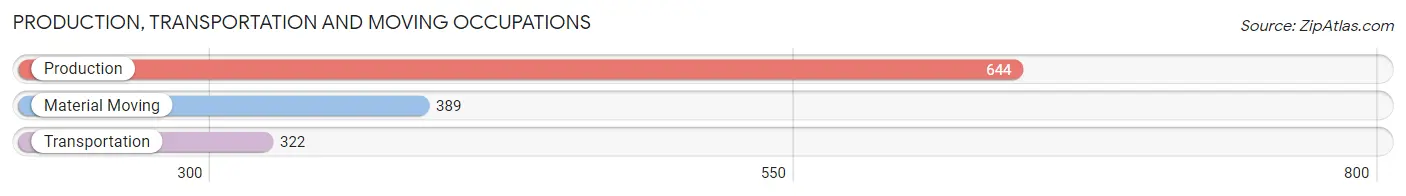
Production, Transportation and Moving Occupations by Sex

| Occupation | Male | Female |
| Production | 533 (82.8%) | 111 (17.2%) |
| Transportation | 321 (99.7%) | 1 (0.3%) |
| Material Moving | 291 (74.8%) | 98 (25.2%) |
| Total (Category) | 1,145 (84.5%) | 210 (15.5%) |
| Total (Overall) | 4,190 (53.8%) | 3,592 (46.2%) |
Employment Industries by Sex in Grant County
Employment Industries in Grant County
The major employment industries in Grant County include Manufacturing (1,240 | 15.9%), Health Care & Social Assistance (1,163 | 14.9%), Retail Trade (741 | 9.5%), Educational Services (700 | 9.0%), and Construction (655 | 8.4%).

Employment Industries by Sex in Grant County
The Grant County industries that see more men than women are Real Estate, Rental & Leasing (100.0%), Construction (98.6%), and Transportation & Warehousing (94.0%), whereas the industries that tend to have a higher number of women are Educational Services (89.9%), Health Care & Social Assistance (89.5%), and Administrative & Support (77.4%).

| Industry | Male | Female |
| Agriculture, Fishing & Hunting | 210 (72.4%) | 80 (27.6%) |
| Mining, Quarrying, & Extraction | 5 (29.4%) | 12 (70.6%) |
| Construction | 646 (98.6%) | 9 (1.4%) |
| Manufacturing | 945 (76.2%) | 295 (23.8%) |
| Wholesale Trade | 70 (54.3%) | 59 (45.7%) |
| Retail Trade | 402 (54.2%) | 339 (45.8%) |
| Transportation & Warehousing | 342 (94.0%) | 22 (6.0%) |
| Utilities | 176 (88.0%) | 24 (12.0%) |
| Information | 28 (63.6%) | 16 (36.4%) |
| Finance & Insurance | 84 (27.5%) | 221 (72.5%) |
| Real Estate, Rental & Leasing | 6 (100.0%) | 0 (0.0%) |
| Professional & Scientific | 266 (51.1%) | 255 (48.9%) |
| Enterprise Management | 0 (0.0%) | 0 (0.0%) |
| Administrative & Support | 24 (22.6%) | 82 (77.4%) |
| Educational Services | 71 (10.1%) | 629 (89.9%) |
| Health Care & Social Assistance | 122 (10.5%) | 1,041 (89.5%) |
| Arts, Entertainment & Recreation | 5 (38.5%) | 8 (61.5%) |
| Accommodation & Food Services | 70 (22.9%) | 236 (77.1%) |
| Public Administration | 378 (67.3%) | 184 (32.7%) |
| Total | 4,190 (53.8%) | 3,592 (46.2%) |
Education in Grant County
School Enrollment in Grant County
The most common levels of schooling among the 3,663 students in Grant County are middle school (1,002 | 27.4%), high school (853 | 23.3%), and elementary school (819 | 22.4%).

| School Level | # Students | % Students |
| Nursery / Preschool | 104 | 2.8% |
| Kindergarten | 241 | 6.6% |
| Elementary School | 819 | 22.4% |
| Middle School | 1,002 | 27.4% |
| High School | 853 | 23.3% |
| College / Undergraduate | 506 | 13.8% |
| Graduate / Professional | 138 | 3.8% |
| Total | 3,663 | 100.0% |
School Enrollment by Age by Funding Source in Grant County
Out of a total of 3,663 students who are enrolled in schools in Grant County, 363 (9.9%) attend a private institution, while the remaining 3,300 (90.1%) are enrolled in public schools. The age group of 25 to 34 year olds has the highest likelihood of being enrolled in private schools, with 24 (25.5% in the age bracket) enrolled. Conversely, the age group of 3 to 4 year olds has the lowest likelihood of being enrolled in a private school, with 91 (100.0% in the age bracket) attending a public institution.

| Age Bracket | Public School | Private School |
| 3 to 4 Year Olds | 91 (100.0%) | 0 (0.0%) |
| 5 to 9 Year Old | 842 (93.1%) | 62 (6.9%) |
| 10 to 14 Year Olds | 1,176 (91.4%) | 110 (8.6%) |
| 15 to 17 Year Olds | 599 (91.0%) | 59 (9.0%) |
| 18 to 19 Year Olds | 182 (82.0%) | 40 (18.0%) |
| 20 to 24 Year Olds | 183 (80.6%) | 44 (19.4%) |
| 25 to 34 Year Olds | 70 (74.5%) | 24 (25.5%) |
| 35 Years and over | 157 (86.7%) | 24 (13.3%) |
| Total | 3,300 (90.1%) | 363 (9.9%) |
Educational Attainment by Field of Study in Grant County
Business (470 | 18.6%), education (459 | 18.2%), science & technology (421 | 16.7%), arts & humanities (233 | 9.2%), and bio, nature & agricultural (180 | 7.1%) are the most common fields of study among 2,522 individuals in Grant County who have obtained a bachelor's degree or higher.

| Field of Study | # Graduates | % Graduates |
| Computers & Mathematics | 97 | 3.8% |
| Bio, Nature & Agricultural | 180 | 7.1% |
| Physical & Health Sciences | 78 | 3.1% |
| Psychology | 177 | 7.0% |
| Social Sciences | 31 | 1.2% |
| Engineering | 133 | 5.3% |
| Multidisciplinary Studies | 0 | 0.0% |
| Science & Technology | 421 | 16.7% |
| Business | 470 | 18.6% |
| Education | 459 | 18.2% |
| Literature & Languages | 93 | 3.7% |
| Liberal Arts & History | 87 | 3.5% |
| Visual & Performing Arts | 29 | 1.1% |
| Communications | 34 | 1.3% |
| Arts & Humanities | 233 | 9.2% |
| Total | 2,522 | 100.0% |
Transportation & Commute in Grant County
Vehicle Availability by Sex in Grant County
The most prevalent vehicle ownership categories in Grant County are males with 2 vehicles (1,578, accounting for 38.1%) and females with 2 vehicles (1,444, making up 44.4%).
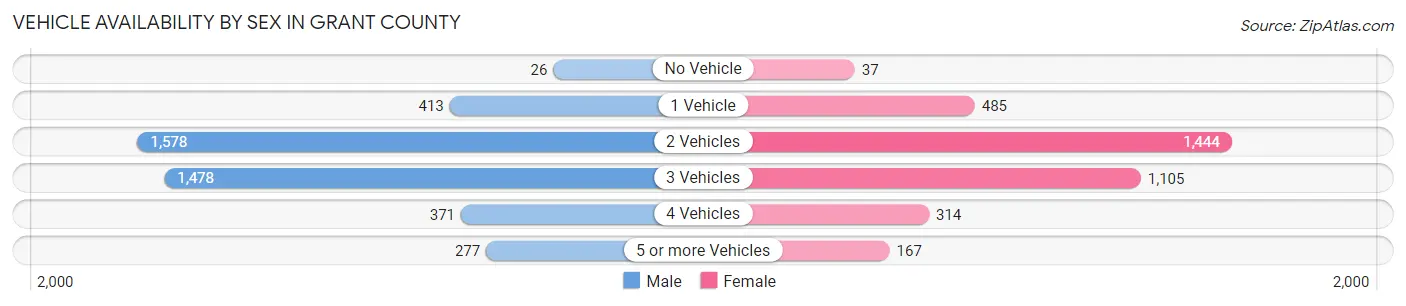
| Vehicles Available | Male | Female |
| No Vehicle | 26 (0.6%) | 37 (1.0%) |
| 1 Vehicle | 413 (10.0%) | 485 (13.7%) |
| 2 Vehicles | 1,578 (38.1%) | 1,444 (40.6%) |
| 3 Vehicles | 1,478 (35.7%) | 1,105 (31.1%) |
| 4 Vehicles | 371 (8.9%) | 314 (8.8%) |
| 5 or more Vehicles | 277 (6.7%) | 167 (4.7%) |
| Total | 4,143 (100.0%) | 3,552 (100.0%) |
Commute Time in Grant County
The most frequently occuring commute durations in Grant County are 5 to 9 minutes (1,077 commuters, 15.5%), 45 to 59 minutes (965 commuters, 13.9%), and 30 to 34 minutes (733 commuters, 10.5%).

| Commute Time | # Commuters | % Commuters |
| Less than 5 Minutes | 251 | 3.6% |
| 5 to 9 Minutes | 1,077 | 15.5% |
| 10 to 14 Minutes | 645 | 9.3% |
| 15 to 19 Minutes | 634 | 9.1% |
| 20 to 24 Minutes | 731 | 10.5% |
| 25 to 29 Minutes | 229 | 3.3% |
| 30 to 34 Minutes | 733 | 10.5% |
| 35 to 39 Minutes | 296 | 4.3% |
| 40 to 44 Minutes | 605 | 8.7% |
| 45 to 59 Minutes | 965 | 13.9% |
| 60 to 89 Minutes | 587 | 8.4% |
| 90 or more Minutes | 214 | 3.1% |
Commute Time by Sex in Grant County
The most common commute times in Grant County are 45 to 59 minutes (511 commuters, 13.9%) for males and 5 to 9 minutes (569 commuters, 17.3%) for females.
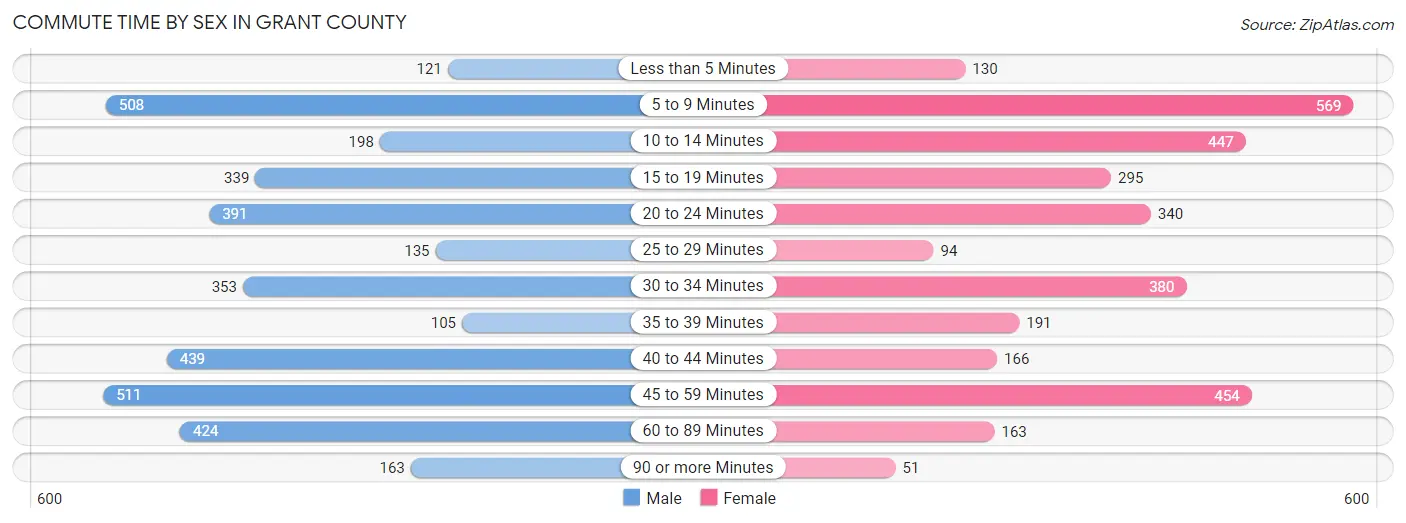
| Commute Time | Male | Female |
| Less than 5 Minutes | 121 (3.3%) | 130 (4.0%) |
| 5 to 9 Minutes | 508 (13.8%) | 569 (17.3%) |
| 10 to 14 Minutes | 198 (5.4%) | 447 (13.6%) |
| 15 to 19 Minutes | 339 (9.2%) | 295 (9.0%) |
| 20 to 24 Minutes | 391 (10.6%) | 340 (10.4%) |
| 25 to 29 Minutes | 135 (3.7%) | 94 (2.9%) |
| 30 to 34 Minutes | 353 (9.6%) | 380 (11.6%) |
| 35 to 39 Minutes | 105 (2.9%) | 191 (5.8%) |
| 40 to 44 Minutes | 439 (11.9%) | 166 (5.1%) |
| 45 to 59 Minutes | 511 (13.9%) | 454 (13.8%) |
| 60 to 89 Minutes | 424 (11.5%) | 163 (5.0%) |
| 90 or more Minutes | 163 (4.4%) | 51 (1.5%) |
Time of Departure to Work by Sex in Grant County
The most frequent times of departure to work in Grant County are 5:30 AM to 5:59 AM (579, 15.7%) for males and 7:00 AM to 7:29 AM (557, 17.0%) for females.
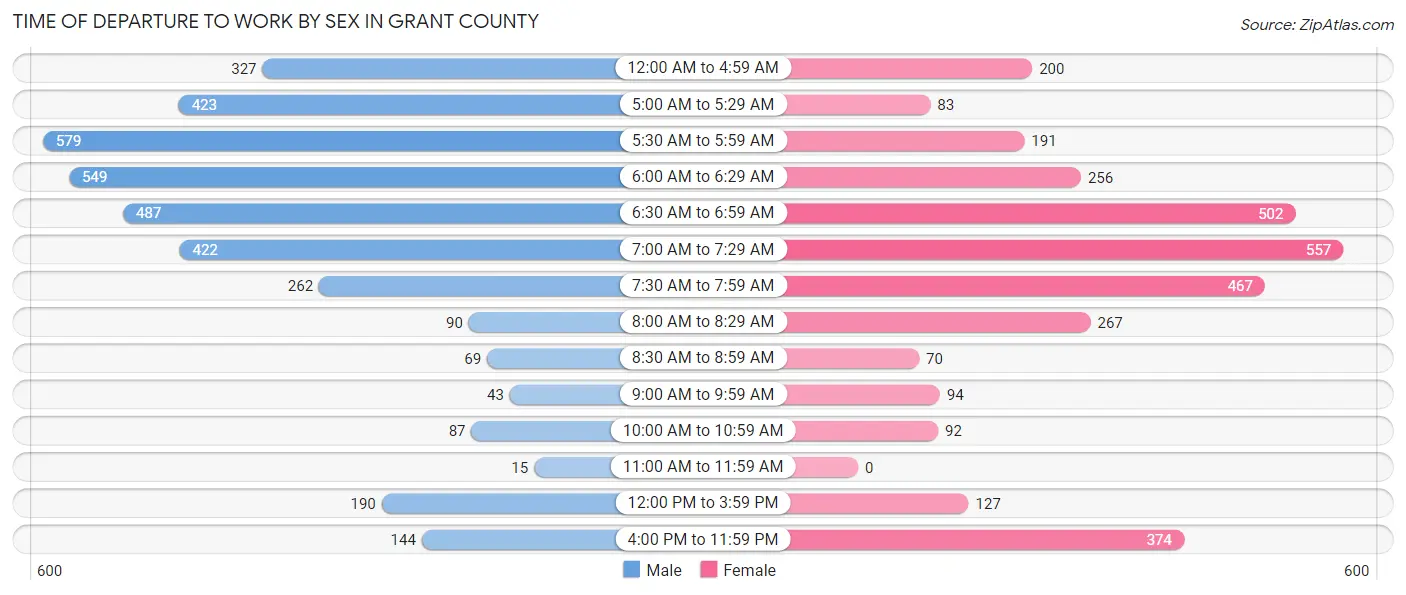
| Time of Departure | Male | Female |
| 12:00 AM to 4:59 AM | 327 (8.9%) | 200 (6.1%) |
| 5:00 AM to 5:29 AM | 423 (11.5%) | 83 (2.5%) |
| 5:30 AM to 5:59 AM | 579 (15.7%) | 191 (5.8%) |
| 6:00 AM to 6:29 AM | 549 (14.9%) | 256 (7.8%) |
| 6:30 AM to 6:59 AM | 487 (13.2%) | 502 (15.3%) |
| 7:00 AM to 7:29 AM | 422 (11.5%) | 557 (17.0%) |
| 7:30 AM to 7:59 AM | 262 (7.1%) | 467 (14.2%) |
| 8:00 AM to 8:29 AM | 90 (2.4%) | 267 (8.1%) |
| 8:30 AM to 8:59 AM | 69 (1.9%) | 70 (2.1%) |
| 9:00 AM to 9:59 AM | 43 (1.2%) | 94 (2.9%) |
| 10:00 AM to 10:59 AM | 87 (2.4%) | 92 (2.8%) |
| 11:00 AM to 11:59 AM | 15 (0.4%) | 0 (0.0%) |
| 12:00 PM to 3:59 PM | 190 (5.1%) | 127 (3.9%) |
| 4:00 PM to 11:59 PM | 144 (3.9%) | 374 (11.4%) |
| Total | 3,687 (100.0%) | 3,280 (100.0%) |
Housing Occupancy in Grant County
Occupancy by Ownership in Grant County
Of the total 6,856 dwellings in Grant County, owner-occupied units account for 5,506 (80.3%), while renter-occupied units make up 1,350 (19.7%).

| Occupancy | # Housing Units | % Housing Units |
| Owner Occupied Housing Units | 5,506 | 80.3% |
| Renter-Occupied Housing Units | 1,350 | 19.7% |
| Total Occupied Housing Units | 6,856 | 100.0% |
Occupancy by Household Size in Grant County

| Household Size | # Housing Units | % Housing Units |
| 1-Person Household | 1,845 | 26.9% |
| 2-Person Household | 2,344 | 34.2% |
| 3-Person Household | 1,340 | 19.5% |
| 4+ Person Household | 1,327 | 19.4% |
| Total Housing Units | 6,856 | 100.0% |
Occupancy by Ownership by Household Size in Grant County

| Household Size | Owner-occupied | Renter-occupied |
| 1-Person Household | 1,300 (70.5%) | 545 (29.5%) |
| 2-Person Household | 2,059 (87.8%) | 285 (12.2%) |
| 3-Person Household | 1,031 (76.9%) | 309 (23.1%) |
| 4+ Person Household | 1,116 (84.1%) | 211 (15.9%) |
| Total Housing Units | 5,506 (80.3%) | 1,350 (19.7%) |
Occupancy by Educational Attainment in Grant County

| Household Size | Owner-occupied | Renter-occupied |
| Less than High School | 364 (86.9%) | 55 (13.1%) |
| High School Diploma | 2,123 (80.1%) | 527 (19.9%) |
| College/Associate Degree | 1,589 (72.1%) | 614 (27.9%) |
| Bachelor's Degree or higher | 1,430 (90.3%) | 154 (9.7%) |
Occupancy by Age of Householder in Grant County

| Age Bracket | # Households | % Households |
| Under 35 Years | 1,023 | 14.9% |
| 35 to 44 Years | 985 | 14.4% |
| 45 to 54 Years | 1,287 | 18.8% |
| 55 to 64 Years | 1,447 | 21.1% |
| 65 to 74 Years | 1,184 | 17.3% |
| 75 to 84 Years | 856 | 12.5% |
| 85 Years and Over | 74 | 1.1% |
| Total | 6,856 | 100.0% |
Housing Finances in Grant County
Median Income by Occupancy in Grant County

| Occupancy Type | # Households | Median Income |
| Owner-Occupied | 5,506 (80.3%) | $77,946 |
| Renter-Occupied | 1,350 (19.7%) | $28,810 |
| Average | 6,856 (100.0%) | $68,598 |
Occupancy by Householder Income Bracket in Grant County

| Income Bracket | Owner-occupied | Renter-occupied |
| Less than $5,000 | 65 (1.2%) | 77 (5.7%) |
| $5,000 to $9,999 | 67 (1.2%) | 52 (3.8%) |
| $10,000 to $14,999 | 138 (2.5%) | 125 (9.3%) |
| $15,000 to $19,999 | 252 (4.6%) | 130 (9.6%) |
| $20,000 to $24,999 | 127 (2.3%) | 172 (12.7%) |
| $25,000 to $34,999 | 308 (5.6%) | 266 (19.7%) |
| $35,000 to $49,999 | 704 (12.8%) | 100 (7.4%) |
| $50,000 to $74,999 | 905 (16.4%) | 236 (17.5%) |
| $75,000 to $99,999 | 984 (17.9%) | 87 (6.4%) |
| $100,000 to $149,999 | 1,084 (19.7%) | 105 (7.8%) |
| $150,000 or more | 872 (15.8%) | 0 (0.0%) |
| Total | 5,506 (100.0%) | 1,350 (100.0%) |
Monthly Housing Cost Tiers in Grant County
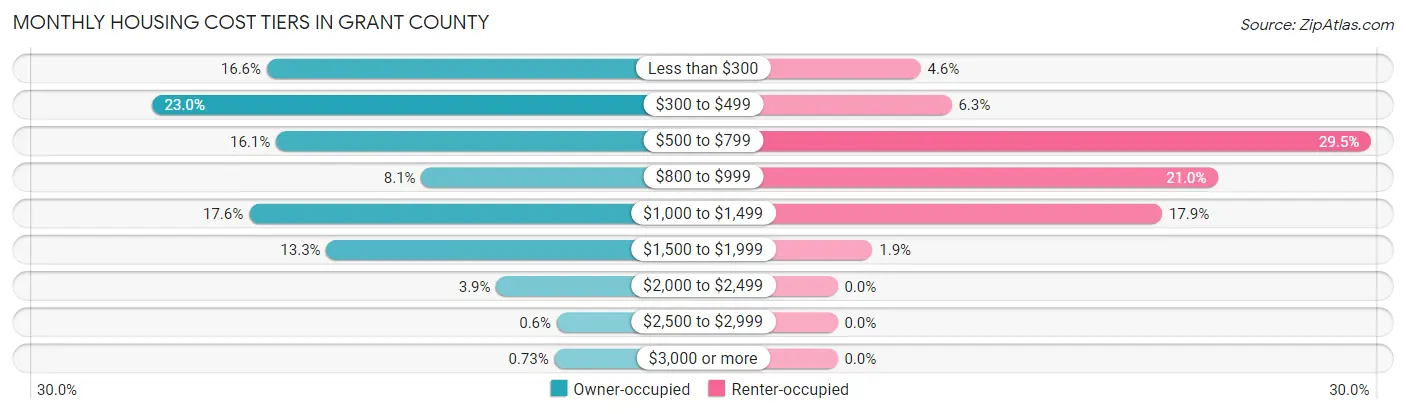
| Monthly Cost | Owner-occupied | Renter-occupied |
| Less than $300 | 915 (16.6%) | 62 (4.6%) |
| $300 to $499 | 1,266 (23.0%) | 85 (6.3%) |
| $500 to $799 | 887 (16.1%) | 398 (29.5%) |
| $800 to $999 | 445 (8.1%) | 284 (21.0%) |
| $1,000 to $1,499 | 969 (17.6%) | 242 (17.9%) |
| $1,500 to $1,999 | 734 (13.3%) | 26 (1.9%) |
| $2,000 to $2,499 | 217 (3.9%) | 0 (0.0%) |
| $2,500 to $2,999 | 33 (0.6%) | 0 (0.0%) |
| $3,000 or more | 40 (0.7%) | 0 (0.0%) |
| Total | 5,506 (100.0%) | 1,350 (100.0%) |
Physical Housing Characteristics in Grant County
Housing Structures in Grant County
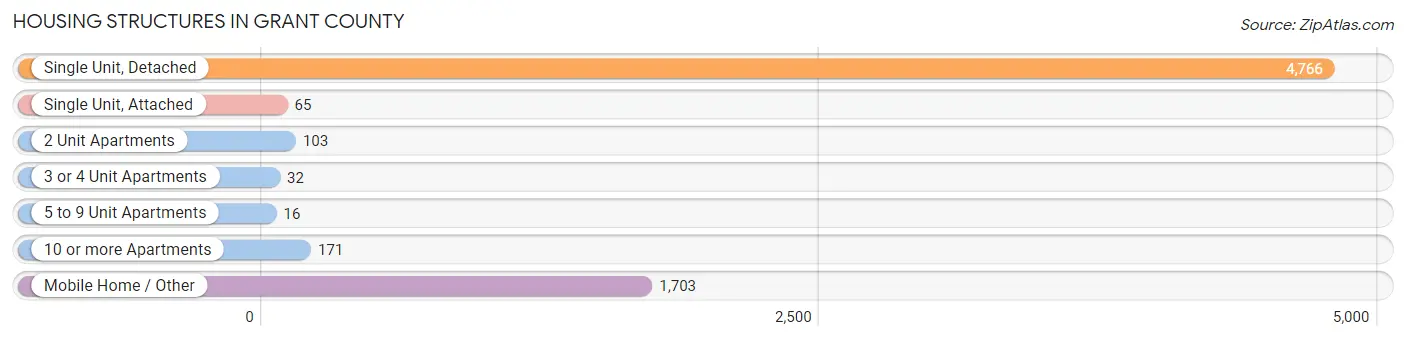
| Structure Type | # Housing Units | % Housing Units |
| Single Unit, Detached | 4,766 | 69.5% |
| Single Unit, Attached | 65 | 0.9% |
| 2 Unit Apartments | 103 | 1.5% |
| 3 or 4 Unit Apartments | 32 | 0.5% |
| 5 to 9 Unit Apartments | 16 | 0.2% |
| 10 or more Apartments | 171 | 2.5% |
| Mobile Home / Other | 1,703 | 24.8% |
| Total | 6,856 | 100.0% |
Housing Structures by Occupancy in Grant County

| Structure Type | Owner-occupied | Renter-occupied |
| Single Unit, Detached | 4,067 (85.3%) | 699 (14.7%) |
| Single Unit, Attached | 36 (55.4%) | 29 (44.6%) |
| 2 Unit Apartments | 0 (0.0%) | 103 (100.0%) |
| 3 or 4 Unit Apartments | 0 (0.0%) | 32 (100.0%) |
| 5 to 9 Unit Apartments | 0 (0.0%) | 16 (100.0%) |
| 10 or more Apartments | 0 (0.0%) | 171 (100.0%) |
| Mobile Home / Other | 1,403 (82.4%) | 300 (17.6%) |
| Total | 5,506 (80.3%) | 1,350 (19.7%) |
Housing Structures by Number of Rooms in Grant County

| Number of Rooms | Owner-occupied | Renter-occupied |
| 1 Room | 18 (0.3%) | 21 (1.6%) |
| 2 or 3 Rooms | 214 (3.9%) | 136 (10.1%) |
| 4 or 5 Rooms | 1,790 (32.5%) | 863 (63.9%) |
| 6 or 7 Rooms | 2,337 (42.4%) | 287 (21.3%) |
| 8 or more Rooms | 1,147 (20.8%) | 43 (3.2%) |
| Total | 5,506 (100.0%) | 1,350 (100.0%) |
Housing Structure by Heating Type in Grant County

| Heating Type | Owner-occupied | Renter-occupied |
| Utility Gas | 1,984 (36.0%) | 607 (45.0%) |
| Bottled, Tank, or LP Gas | 453 (8.2%) | 9 (0.7%) |
| Electricity | 2,854 (51.8%) | 693 (51.3%) |
| Fuel Oil or Kerosene | 0 (0.0%) | 0 (0.0%) |
| Coal or Coke | 0 (0.0%) | 0 (0.0%) |
| All other Fuels | 210 (3.8%) | 8 (0.6%) |
| No Fuel Used | 5 (0.1%) | 33 (2.4%) |
| Total | 5,506 (100.0%) | 1,350 (100.0%) |
Household Vehicle Usage in Grant County

| Vehicles per Household | Owner-occupied | Renter-occupied |
| No Vehicle | 80 (1.5%) | 85 (6.3%) |
| 1 Vehicle | 1,203 (21.8%) | 734 (54.4%) |
| 2 Vehicles | 2,417 (43.9%) | 369 (27.3%) |
| 3 or more Vehicles | 1,806 (32.8%) | 162 (12.0%) |
| Total | 5,506 (100.0%) | 1,350 (100.0%) |
Real Estate & Mortgages in Grant County
Real Estate and Mortgage Overview in Grant County
| Characteristic | Without Mortgage | With Mortgage |
| Housing Units | 2,799 | 2,707 |
| Median Property Value | $92,400 | $174,100 |
| Median Household Income | $62,601 | $555 |
| Monthly Housing Costs | $381 | $40 |
| Real Estate Taxes | $539 | $154 |
Property Value by Mortgage Status in Grant County

| Property Value | Without Mortgage | With Mortgage |
| Less than $50,000 | 584 (20.9%) | 139 (5.1%) |
| $50,000 to $99,999 | 963 (34.4%) | 340 (12.6%) |
| $100,000 to $299,999 | 1,005 (35.9%) | 1,781 (65.8%) |
| $300,000 to $499,999 | 183 (6.5%) | 436 (16.1%) |
| $500,000 to $749,999 | 64 (2.3%) | 11 (0.4%) |
| $750,000 to $999,999 | 0 (0.0%) | 0 (0.0%) |
| $1,000,000 or more | 0 (0.0%) | 0 (0.0%) |
| Total | 2,799 (100.0%) | 2,707 (100.0%) |
Household Income by Mortgage Status in Grant County

| Household Income | Without Mortgage | With Mortgage |
| Less than $10,000 | 117 (4.2%) | 24 (0.9%) |
| $10,000 to $24,999 | 323 (11.5%) | 15 (0.5%) |
| $25,000 to $34,999 | 204 (7.3%) | 194 (7.2%) |
| $35,000 to $49,999 | 475 (17.0%) | 104 (3.8%) |
| $50,000 to $74,999 | 515 (18.4%) | 229 (8.5%) |
| $75,000 to $99,999 | 481 (17.2%) | 390 (14.4%) |
| $100,000 to $149,999 | 367 (13.1%) | 503 (18.6%) |
| $150,000 or more | 317 (11.3%) | 717 (26.5%) |
| Total | 2,799 (100.0%) | 2,707 (100.0%) |
Property Value to Household Income Ratio in Grant County

| Value-to-Income Ratio | Without Mortgage | With Mortgage |
| Less than 2.0x | 1,571 (56.1%) | 95,708 (3,535.6%) |
| 2.0x to 2.9x | 372 (13.3%) | 1,331 (49.2%) |
| 3.0x to 3.9x | 205 (7.3%) | 719 (26.6%) |
| 4.0x or more | 631 (22.5%) | 251 (9.3%) |
| Total | 2,799 (100.0%) | 2,707 (100.0%) |
Real Estate Taxes by Mortgage Status in Grant County

| Property Taxes | Without Mortgage | With Mortgage |
| Less than $800 | 1,465 (52.3%) | 0 (0.0%) |
| $800 to $1,499 | 581 (20.8%) | 972 (35.9%) |
| $800 to $1,499 | 300 (10.7%) | 1,089 (40.2%) |
| Total | 2,799 (100.0%) | 2,707 (100.0%) |
Health & Disability in Grant County
Health Insurance Coverage by Age in Grant County
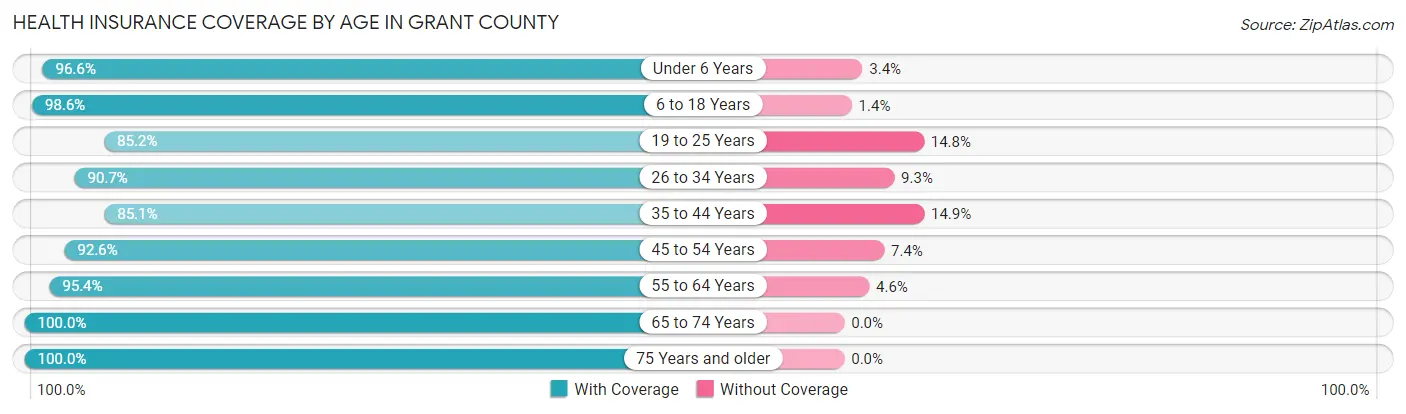
| Age Bracket | With Coverage | Without Coverage |
| Under 6 Years | 1,120 (96.6%) | 39 (3.4%) |
| 6 to 18 Years | 3,026 (98.6%) | 42 (1.4%) |
| 19 to 25 Years | 1,126 (85.2%) | 196 (14.8%) |
| 26 to 34 Years | 1,843 (90.7%) | 189 (9.3%) |
| 35 to 44 Years | 1,837 (85.1%) | 321 (14.9%) |
| 45 to 54 Years | 2,210 (92.6%) | 177 (7.4%) |
| 55 to 64 Years | 2,394 (95.4%) | 116 (4.6%) |
| 65 to 74 Years | 1,872 (100.0%) | 0 (0.0%) |
| 75 Years and older | 1,313 (100.0%) | 0 (0.0%) |
| Total | 16,741 (93.9%) | 1,080 (6.1%) |
Health Insurance Coverage by Citizenship Status in Grant County

| Citizenship Status | With Coverage | Without Coverage |
| Native Born | 1,120 (96.6%) | 39 (3.4%) |
| Foreign Born, Citizen | 3,026 (98.6%) | 42 (1.4%) |
| Foreign Born, not a Citizen | 1,126 (85.2%) | 196 (14.8%) |
Health Insurance Coverage by Household Income in Grant County

| Household Income | With Coverage | Without Coverage |
| Under $25,000 | 2,086 (95.7%) | 94 (4.3%) |
| $25,000 to $49,999 | 2,787 (93.8%) | 184 (6.2%) |
| $50,000 to $74,999 | 2,953 (92.9%) | 225 (7.1%) |
| $75,000 to $99,999 | 2,702 (98.9%) | 31 (1.1%) |
| $100,000 and over | 6,213 (91.9%) | 546 (8.1%) |
Public vs Private Health Insurance Coverage by Age in Grant County
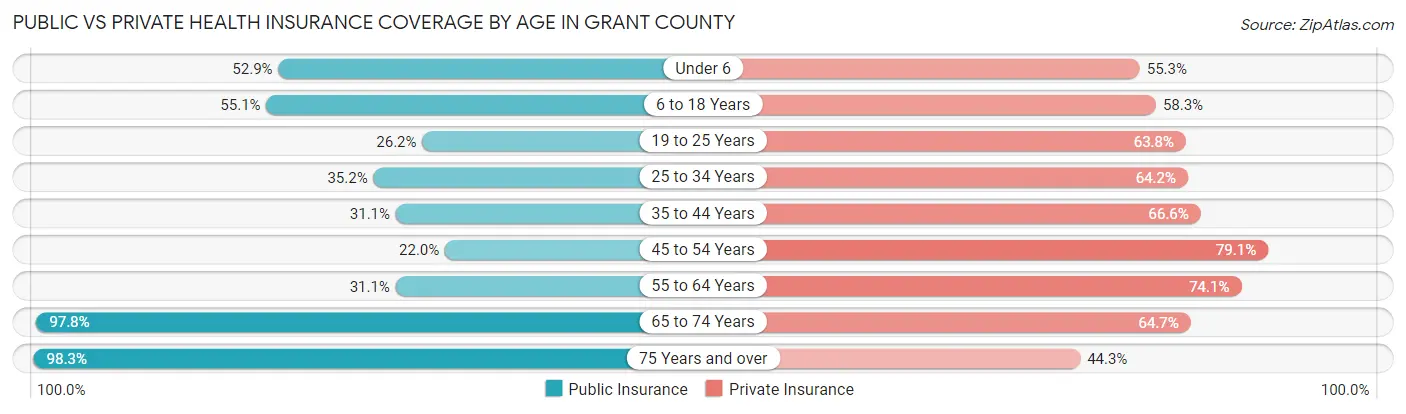
| Age Bracket | Public Insurance | Private Insurance |
| Under 6 | 613 (52.9%) | 641 (55.3%) |
| 6 to 18 Years | 1,691 (55.1%) | 1,789 (58.3%) |
| 19 to 25 Years | 346 (26.2%) | 844 (63.8%) |
| 25 to 34 Years | 716 (35.2%) | 1,305 (64.2%) |
| 35 to 44 Years | 671 (31.1%) | 1,437 (66.6%) |
| 45 to 54 Years | 524 (22.0%) | 1,888 (79.1%) |
| 55 to 64 Years | 781 (31.1%) | 1,861 (74.1%) |
| 65 to 74 Years | 1,831 (97.8%) | 1,212 (64.7%) |
| 75 Years and over | 1,291 (98.3%) | 581 (44.3%) |
| Total | 8,464 (47.5%) | 11,558 (64.9%) |
Disability Status by Sex by Age in Grant County

| Age Bracket | Male | Female |
| Under 5 Years | 0 (0.0%) | 0 (0.0%) |
| 5 to 17 Years | 63 (4.1%) | 52 (3.7%) |
| 18 to 34 Years | 229 (11.7%) | 82 (4.8%) |
| 35 to 64 Years | 984 (28.4%) | 712 (19.8%) |
| 65 to 74 Years | 218 (23.9%) | 368 (38.3%) |
| 75 Years and over | 364 (62.3%) | 419 (57.5%) |
Disability Class by Sex by Age in Grant County
Disability Class: Hearing Difficulty

| Age Bracket | Male | Female |
| Under 5 Years | 0 (0.0%) | 0 (0.0%) |
| 5 to 17 Years | 2 (0.1%) | 4 (0.3%) |
| 18 to 34 Years | 37 (1.9%) | 9 (0.5%) |
| 35 to 64 Years | 403 (11.6%) | 143 (4.0%) |
| 65 to 74 Years | 125 (13.7%) | 102 (10.6%) |
| 75 Years and over | 292 (50.0%) | 230 (31.6%) |
Disability Class: Vision Difficulty

| Age Bracket | Male | Female |
| Under 5 Years | 0 (0.0%) | 0 (0.0%) |
| 5 to 17 Years | 10 (0.6%) | 2 (0.1%) |
| 18 to 34 Years | 6 (0.3%) | 22 (1.3%) |
| 35 to 64 Years | 241 (7.0%) | 90 (2.5%) |
| 65 to 74 Years | 30 (3.3%) | 38 (4.0%) |
| 75 Years and over | 67 (11.5%) | 110 (15.1%) |
Disability Class: Cognitive Difficulty

| Age Bracket | Male | Female |
| 5 to 17 Years | 59 (3.8%) | 44 (3.1%) |
| 18 to 34 Years | 165 (8.4%) | 50 (2.9%) |
| 35 to 64 Years | 328 (9.5%) | 254 (7.1%) |
| 65 to 74 Years | 20 (2.2%) | 73 (7.6%) |
| 75 Years and over | 27 (4.6%) | 86 (11.8%) |
Disability Class: Ambulatory Difficulty

| Age Bracket | Male | Female |
| 5 to 17 Years | 0 (0.0%) | 13 (0.9%) |
| 18 to 34 Years | 62 (3.2%) | 20 (1.2%) |
| 35 to 64 Years | 568 (16.4%) | 484 (13.5%) |
| 65 to 74 Years | 132 (14.5%) | 234 (24.3%) |
| 75 Years and over | 97 (16.6%) | 284 (39.0%) |
Disability Class: Self-Care Difficulty

| Age Bracket | Male | Female |
| 5 to 17 Years | 1 (0.1%) | 17 (1.2%) |
| 18 to 34 Years | 49 (2.5%) | 20 (1.2%) |
| 35 to 64 Years | 52 (1.5%) | 183 (5.1%) |
| 65 to 74 Years | 26 (2.9%) | 147 (15.3%) |
| 75 Years and over | 21 (3.6%) | 139 (19.1%) |
Technology Access in Grant County
Computing Device Access in Grant County

| Device Type | # Households | % Households |
| Desktop or Laptop | 4,843 | 70.6% |
| Smartphone | 5,827 | 85.0% |
| Tablet | 3,923 | 57.2% |
| No Computing Device | 681 | 9.9% |
| Total | 6,856 | 100.0% |
Internet Access in Grant County
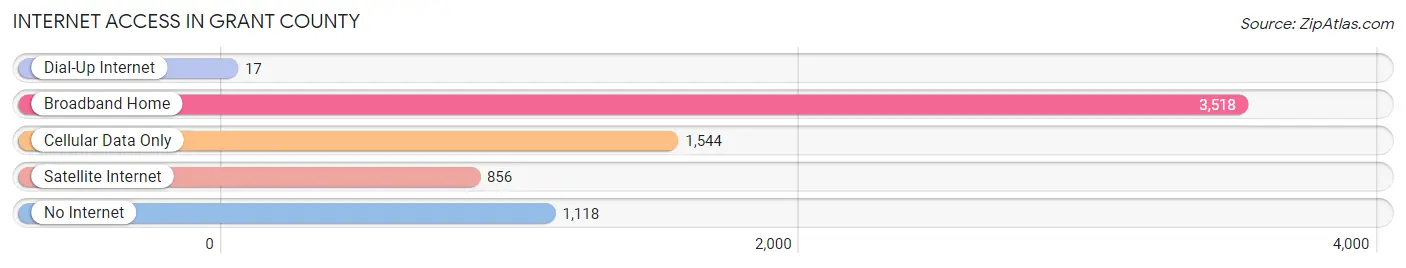
| Internet Type | # Households | % Households |
| Dial-Up Internet | 17 | 0.3% |
| Broadband Home | 3,518 | 51.3% |
| Cellular Data Only | 1,544 | 22.5% |
| Satellite Internet | 856 | 12.5% |
| No Internet | 1,118 | 16.3% |
| Total | 6,856 | 100.0% |
Grant County Summary
County History
Grant County, Arkansas is located in the southwestern corner of the state and is bordered by the states of Oklahoma and Texas. The county was created in 1869 and named after Ulysses S. Grant, the 18th President of the United States. The county seat is Sheridan, Arkansas.
The first settlers in Grant County were Native Americans, including the Quapaw, Osage, and Caddo tribes. The first white settlers arrived in the area in the early 1800s. The county was officially organized in 1869 and the first county seat was located in Prattsville. In 1872, the county seat was moved to Sheridan.
The economy of Grant County was largely based on agriculture in the early years. Cotton was the main crop, but other crops such as corn, wheat, and oats were also grown. The county also had a thriving timber industry.
In the late 1800s, the St. Louis, Iron Mountain and Southern Railway built a line through the county, connecting it to the rest of the state. This allowed for the development of new towns and industries, such as the Arkansas and Louisiana Railway, which was built in 1891.
The county also experienced a population boom in the early 1900s, as many African Americans moved to the area to work in the timber and railroad industries. The population of Grant County peaked in 1930, with a total of 24,845 people.
Geography
Grant County is located in the southwestern corner of Arkansas and is bordered by the states of Oklahoma and Texas. The county covers an area of 845 square miles and is divided into two distinct regions: the Ouachita Mountains in the north and the Arkansas River Valley in the south.
The Ouachita Mountains are part of the Ozark Plateau and are characterized by steep hills and ridges. The highest point in the county is Mount Magazine, which has an elevation of 2,753 feet. The Arkansas River Valley is a flat, fertile plain that is home to many farms and ranches.
The county is home to several rivers, including the Ouachita, Saline, and Little Missouri. The county also has several lakes, including Lake Greeson, Lake Ouachita, and Lake Hamilton.
Economy
The economy of Grant County is largely based on agriculture and manufacturing. The county is home to several large farms and ranches, which produce a variety of crops, including cotton, corn, soybeans, and wheat. The county also has a thriving timber industry, with several sawmills and wood-processing plants.
The county is also home to several manufacturing companies, including a paper mill, a furniture factory, and a plastics plant. The county also has a growing tourism industry, with several state parks and recreational areas.
Demographics
As of the 2010 census, the population of Grant County was 17,817. The population is spread out with a median age of 39.7 years. The racial makeup of the county is 87.3% White, 8.7% Black or African American, 0.5% Native American, 0.3% Asian, 0.1% Pacific Islander, and 2.1% from two or more races.
The largest ancestry groups in the county are English (25.2%), Irish (17.2%), German (14.2%), and American (10.2%). The median household income in the county is $37,845 and the median family income is $45,945. The per capita income in the county is $19,845.
Conclusion
Grant County, Arkansas is a rural county located in the southwestern corner of the state. The county has a long history, dating back to the early 1800s, and has a thriving economy based on agriculture and manufacturing. The population of the county is diverse, with a median age of 39.7 years and a variety of racial and ethnic backgrounds. The county is home to several state parks and recreational areas, making it a popular destination for tourists.
Common Questions
What is the Total Population of Grant County?
Total Population of Grant County is 18,022.
What is the Total Male Population of Grant County?
Total Male Population of Grant County is 9,080.
What is the Total Female Population of Grant County?
Total Female Population of Grant County is 8,942.
What is the Ratio of Males per 100 Females in Grant County?
There are 101.54 Males per 100 Females in Grant County.
What is the Ratio of Females per 100 Males in Grant County?
There are 98.48 Females per 100 Males in Grant County.
What is the Median Population Age in Grant County?
Median Population Age in Grant County is 40.2 Years.
What is the Average Family Size in Grant County
Average Family Size in Grant County is 3.1 People.
What is the Average Household Size in Grant County
Average Household Size in Grant County is 2.6 People.
What is Per Capita Income in Grant County?
Per Capita income in Grant County is $35,170.
What is the Median Family Income in Grant County?
Median Family Income in Grant County is $85,655.
What is the Median Household income in Grant County?
Median Household Income in Grant County is $68,598.
What is Income or Wage Gap in Grant County?
Income or Wage Gap in Grant County is 33.1%.
Women in Grant County earn 66.9 cents for every dollar earned by a man.
What is Family Income Deficit in Grant County?
Family Income Deficit in Grant County is $8,851.
Families that are below poverty line in Grant County earn $8,851 less on average than the poverty threshold level.
What is Inequality or Gini Index in Grant County?
Inequality or Gini Index in Grant County is 0.46.
How Large is the Labor Force in Grant County?
There are 8,081 People in the Labor Forcein in Grant County.
What is the Percentage of People in the Labor Force in Grant County?
55.6% of People are in the Labor Force in Grant County.
What is the Unemployment Rate in Grant County?
Unemployment Rate in Grant County is 3.3%.