Fulton County, AR
Fulton County Map
Fulton County Overview
12,183
TOTAL POPULATION
6,091
MALE POPULATION
6,092
FEMALE POPULATION
99.98
MALES / 100 FEMALES
100.02
FEMALES / 100 MALES
47.4
MEDIAN AGE
3.3
AVG FAMILY SIZE
2.5
AVG HOUSEHOLD SIZE
$22,895
PER CAPITA INCOME
$50,833
AVG FAMILY INCOME
$38,917
AVG HOUSEHOLD INCOME
29.8%
WAGE / INCOME GAP [ % ]
70.2¢/ $1
WAGE / INCOME GAP [ $ ]
$7,633
FAMILY INCOME DEFICIT
0.42
INEQUALITY / GINI INDEX
4,334
LABOR FORCE [ PEOPLE ]
43.4%
PERCENT IN LABOR FORCE
1.7%
UNEMPLOYMENT RATE
Fulton County Area Codes
Race in Fulton County
The most populous races in Fulton County are White / Caucasian (11,334 | 93.0%), Two or more Races (773 | 6.3%), and Hispanic or Latino (70 | 0.6%).

| Race | # Population | % Population |
| Asian | 4 | 0.0% |
| Black / African American | 23 | 0.2% |
| Hawaiian / Pacific | 0 | 0.0% |
| Hispanic or Latino | 70 | 0.6% |
| Native / Alaskan | 44 | 0.4% |
| White / Caucasian | 11,334 | 93.0% |
| Two or more Races | 773 | 6.3% |
| Some other Race | 5 | 0.0% |
| Total | 12,183 | 100.0% |
Ancestry in Fulton County
The most populous ancestries reported in Fulton County are German (2,389 | 19.6%), Irish (1,839 | 15.1%), English (1,333 | 10.9%), American (1,188 | 9.8%), and Cherokee (487 | 4.0%), together accounting for 59.4% of all Fulton County residents.

| Ancestry | # Population | % Population |
| African | 18 | 0.2% |
| American | 1,188 | 9.8% |
| Apache | 5 | 0.0% |
| Austrian | 12 | 0.1% |
| Bhutanese | 2 | 0.0% |
| Blackfeet | 1 | 0.0% |
| British | 48 | 0.4% |
| Bulgarian | 9 | 0.1% |
| Cherokee | 487 | 4.0% |
| Chippewa | 10 | 0.1% |
| Cree | 4 | 0.0% |
| Czech | 10 | 0.1% |
| Danish | 31 | 0.3% |
| Dutch | 102 | 0.8% |
| Dutch West Indian | 2 | 0.0% |
| English | 1,333 | 10.9% |
| European | 77 | 0.6% |
| French | 297 | 2.4% |
| French Canadian | 40 | 0.3% |
| German | 2,389 | 19.6% |
| Greek | 4 | 0.0% |
| Hungarian | 6 | 0.1% |
| Irish | 1,839 | 15.1% |
| Iroquois | 187 | 1.5% |
| Italian | 163 | 1.3% |
| Korean | 4 | 0.0% |
| Mexican | 26 | 0.2% |
| Mexican American Indian | 4 | 0.0% |
| Northern European | 14 | 0.1% |
| Norwegian | 99 | 0.8% |
| Pakistani | 17 | 0.1% |
| Pennsylvania German | 13 | 0.1% |
| Polish | 178 | 1.5% |
| Portuguese | 5 | 0.0% |
| Scotch-Irish | 61 | 0.5% |
| Scottish | 292 | 2.4% |
| Subsaharan African | 18 | 0.2% |
| Swedish | 113 | 0.9% |
| Swiss | 1 | 0.0% |
| Welsh | 18 | 0.2% | View All 40 Rows |
Immigrants in Fulton County
The most numerous immigrant groups reported in Fulton County came from Europe (36 | 0.3%), Asia (25 | 0.2%), South Eastern Asia (25 | 0.2%), Eastern Europe (24 | 0.2%), and Poland (24 | 0.2%), together accounting for 1.1% of all Fulton County residents.

| Immigration Origin | # Population | % Population |
| Asia | 25 | 0.2% |
| Central America | 17 | 0.1% |
| Eastern Europe | 24 | 0.2% |
| El Salvador | 9 | 0.1% |
| Europe | 36 | 0.3% |
| Germany | 12 | 0.1% |
| Latin America | 17 | 0.1% |
| Mexico | 8 | 0.1% |
| Philippines | 4 | 0.0% |
| Poland | 24 | 0.2% |
| South Eastern Asia | 25 | 0.2% |
| Vietnam | 21 | 0.2% |
| Western Europe | 12 | 0.1% | View All 13 Rows |
Sex and Age in Fulton County
Sex and Age in Fulton County
The most populous age groups in Fulton County are 70 to 74 Years (539 | 8.8%) for men and 60 to 64 Years (583 | 9.6%) for women.

| Age Bracket | Male | Female |
| Under 5 Years | 338 (5.6%) | 284 (4.7%) |
| 5 to 9 Years | 321 (5.3%) | 371 (6.1%) |
| 10 to 14 Years | 409 (6.7%) | 355 (5.8%) |
| 15 to 19 Years | 343 (5.6%) | 440 (7.2%) |
| 20 to 24 Years | 454 (7.4%) | 160 (2.6%) |
| 25 to 29 Years | 292 (4.8%) | 274 (4.5%) |
| 30 to 34 Years | 256 (4.2%) | 265 (4.3%) |
| 35 to 39 Years | 292 (4.8%) | 332 (5.4%) |
| 40 to 44 Years | 287 (4.7%) | 260 (4.3%) |
| 45 to 49 Years | 319 (5.2%) | 324 (5.3%) |
| 50 to 54 Years | 398 (6.5%) | 401 (6.6%) |
| 55 to 59 Years | 408 (6.7%) | 391 (6.4%) |
| 60 to 64 Years | 516 (8.5%) | 583 (9.6%) |
| 65 to 69 Years | 284 (4.7%) | 353 (5.8%) |
| 70 to 74 Years | 539 (8.8%) | 516 (8.5%) |
| 75 to 79 Years | 221 (3.6%) | 279 (4.6%) |
| 80 to 84 Years | 312 (5.1%) | 300 (4.9%) |
| 85 Years and over | 102 (1.7%) | 204 (3.4%) |
| Total | 6,091 (100.0%) | 6,092 (100.0%) |
Families and Households in Fulton County
Median Family Size in Fulton County
The median family size in Fulton County is 3.33 persons per family, with single male/father families (202 | 7.0%) accounting for the largest median family size of 4.12 persons per family. On the other hand, single female/mother families (372 | 12.9%) represent the smallest median family size with 2.76 persons per family.

| Family Type | # Families | Family Size |
| Married-Couple | 2,306 (80.1%) | 3.35 |
| Single Male/Father | 202 (7.0%) | 4.12 |
| Single Female/Mother | 372 (12.9%) | 2.76 |
| Total Families | 2,880 (100.0%) | 3.33 |
Median Household Size in Fulton County
The median household size in Fulton County is 2.51 persons per household, with single male/father households (202 | 4.2%) accounting for the largest median household size of 4.43 persons per household. non-family households (1,900 | 39.8%) represent the smallest median household size with 1.18 persons per household.

| Household Type | # Households | Household Size |
| Married-Couple | 2,306 (48.2%) | 3.37 |
| Single Male/Father | 202 (4.2%) | 4.43 |
| Single Female/Mother | 372 (7.8%) | 2.91 |
| Non-family | 1,900 (39.8%) | 1.18 |
| Total Households | 4,780 (100.0%) | 2.51 |
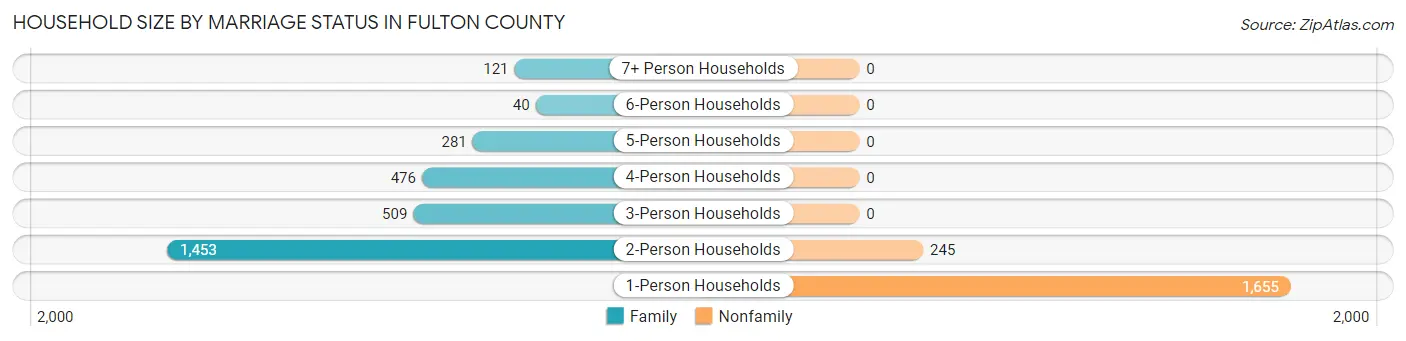
Household Size by Marriage Status in Fulton County
Out of a total of 4,780 households in Fulton County, 2,880 (60.3%) are family households, while 1,900 (39.8%) are nonfamily households. The most numerous type of family households are 2-person households, comprising 1,453, and the most common type of nonfamily households are 1-person households, comprising 1,655.
| Household Size | Family Households | Nonfamily Households |
| 1-Person Households | - | 1,655 (34.6%) |
| 2-Person Households | 1,453 (30.4%) | 245 (5.1%) |
| 3-Person Households | 509 (10.6%) | 0 (0.0%) |
| 4-Person Households | 476 (10.0%) | 0 (0.0%) |
| 5-Person Households | 281 (5.9%) | 0 (0.0%) |
| 6-Person Households | 40 (0.8%) | 0 (0.0%) |
| 7+ Person Households | 121 (2.5%) | 0 (0.0%) |
| Total | 2,880 (60.3%) | 1,900 (39.8%) |
Female Fertility in Fulton County
Fertility by Age in Fulton County
Average fertility rate in Fulton County is 96.0 births per 1,000 women. Women in the age bracket of 20 to 34 years have the highest fertility rate with 133.0 births per 1,000 women. Women in the age bracket of 35 to 50 years acount for 54.0% of all women with births.

| Age Bracket | Women with Births | Births / 1,000 Women |
| 15 to 19 years | 0 (0.0%) | 0.0 |
| 20 to 34 years | 93 (46.0%) | 133.0 |
| 35 to 50 years | 109 (54.0%) | 112.0 |
| Total | 202 (100.0%) | 96.0 |
Fertility by Age by Marriage Status in Fulton County

| Age Bracket | Married | Unmarried |
| 15 to 19 years | 0 (0.0%) | 0 (0.0%) |
| 20 to 34 years | 93 (100.0%) | 0 (0.0%) |
| 35 to 50 years | 109 (100.0%) | 0 (0.0%) |
| Total | 202 (100.0%) | 0 (0.0%) |
Fertility by Education in Fulton County

| Educational Attainment | Women with Births | Births / 1,000 Women |
| Less than High School | 37 (18.3%) | 94.0 |
| High School Diploma | 57 (28.2%) | 89.0 |
| College or Associate's Degree | 108 (53.5%) | 129.0 |
| Bachelor's Degree | 0 (0.0%) | 0.0 |
| Graduate Degree | 0 (0.0%) | 0.0 |
| Total | 202 (100.0%) | 96.0 |
Fertility by Education by Marriage Status in Fulton County
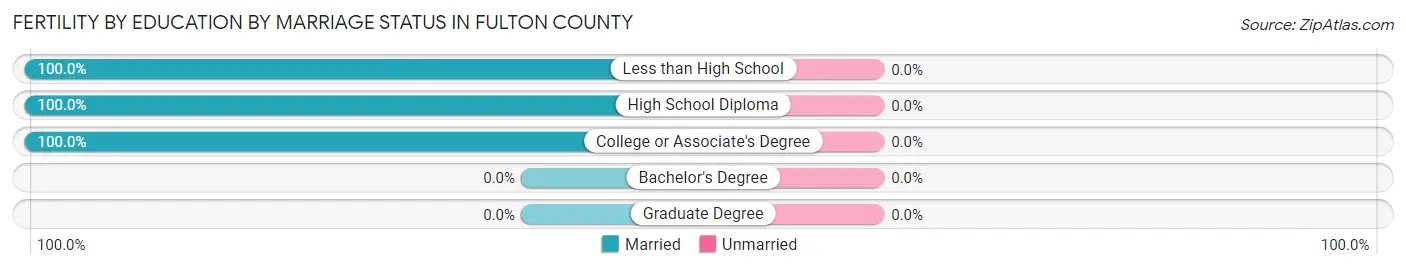
| Educational Attainment | Married | Unmarried |
| Less than High School | 37 (100.0%) | 0 (0.0%) |
| High School Diploma | 57 (100.0%) | 0 (0.0%) |
| College or Associate's Degree | 108 (100.0%) | 0 (0.0%) |
| Bachelor's Degree | 0 (0.0%) | 0 (0.0%) |
| Graduate Degree | 0 (0.0%) | 0 (0.0%) |
| Total | 202 (100.0%) | 0 (0.0%) |
Income in Fulton County
Income Overview in Fulton County
Per Capita Income in Fulton County is $22,895, while median incomes of families and households are $50,833 and $38,917 respectively.
| Characteristic | Number | Measure |
| Per Capita Income | 12,183 | $22,895 |
| Median Family Income | 2,880 | $50,833 |
| Mean Family Income | 2,880 | $65,374 |
| Median Household Income | 4,780 | $38,917 |
| Mean Household Income | 4,780 | $53,748 |
| Income Deficit | 2,880 | $7,633 |
| Wage / Income Gap (%) | 12,183 | 29.83% |
| Wage / Income Gap ($) | 12,183 | 70.17¢ per $1 |
| Gini / Inequality Index | 12,183 | 0.42 |
Earnings by Sex in Fulton County
Average Earnings in Fulton County are $29,697, $34,243 for men and $24,028 for women, a difference of 29.8%.

| Sex | Number | Average Earnings |
| Male | 2,578 (53.7%) | $34,243 |
| Female | 2,226 (46.3%) | $24,028 |
| Total | 4,804 (100.0%) | $29,697 |
Earnings by Sex by Income Bracket in Fulton County
The most common earnings brackets in Fulton County are $25,000 to $29,999 for men (270 | 10.5%) and $2,499 or less for women (248 | 11.1%).

| Income | Male | Female |
| $2,499 or less | 10 (0.4%) | 248 (11.1%) |
| $2,500 to $4,999 | 212 (8.2%) | 85 (3.8%) |
| $5,000 to $7,499 | 76 (2.9%) | 82 (3.7%) |
| $7,500 to $9,999 | 125 (4.9%) | 22 (1.0%) |
| $10,000 to $12,499 | 62 (2.4%) | 161 (7.2%) |
| $12,500 to $14,999 | 99 (3.8%) | 104 (4.7%) |
| $15,000 to $17,499 | 17 (0.7%) | 90 (4.0%) |
| $17,500 to $19,999 | 88 (3.4%) | 144 (6.5%) |
| $20,000 to $22,499 | 39 (1.5%) | 56 (2.5%) |
| $22,500 to $24,999 | 103 (4.0%) | 198 (8.9%) |
| $25,000 to $29,999 | 270 (10.5%) | 140 (6.3%) |
| $30,000 to $34,999 | 231 (9.0%) | 127 (5.7%) |
| $35,000 to $39,999 | 127 (4.9%) | 163 (7.3%) |
| $40,000 to $44,999 | 110 (4.3%) | 128 (5.8%) |
| $45,000 to $49,999 | 269 (10.4%) | 147 (6.6%) |
| $50,000 to $54,999 | 129 (5.0%) | 69 (3.1%) |
| $55,000 to $64,999 | 65 (2.5%) | 23 (1.0%) |
| $65,000 to $74,999 | 213 (8.3%) | 139 (6.2%) |
| $75,000 to $99,999 | 155 (6.0%) | 54 (2.4%) |
| $100,000+ | 178 (6.9%) | 46 (2.1%) |
| Total | 2,578 (100.0%) | 2,226 (100.0%) |
Earnings by Sex by Educational Attainment in Fulton County
Average earnings in Fulton County are $45,083 for men and $27,238 for women, a difference of 39.6%. Men with an educational attainment of graduate degree enjoy the highest average annual earnings of $85,461, while those with high school diploma education earn the least with $31,123. Women with an educational attainment of graduate degree earn the most with the average annual earnings of $51,987, while those with high school diploma education have the smallest earnings of $22,578.

| Educational Attainment | Male Income | Female Income |
| Less than High School | $50,975 | $0 |
| High School Diploma | $31,123 | $22,578 |
| College or Associate's Degree | $47,254 | $28,415 |
| Bachelor's Degree | $47,634 | $46,570 |
| Graduate Degree | $85,461 | $51,987 |
| Total | $45,083 | $27,238 |
Family Income in Fulton County
Family Income Brackets in Fulton County
According to the Fulton County family income data, there are 562 families falling into the $35,000 to $49,999 income range, which is the most common income bracket and makes up 19.5% of all families. Conversely, the $200,000+ income bracket is the least frequent group with only 14 families (0.5%) belonging to this category.

| Income Bracket | # Families | % Families |
| Less than $10,000 | 86 | 3.0% |
| $10,000 to $14,999 | 104 | 3.6% |
| $15,000 to $24,999 | 317 | 11.0% |
| $25,000 to $34,999 | 346 | 12.0% |
| $35,000 to $49,999 | 562 | 19.5% |
| $50,000 to $74,999 | 559 | 19.4% |
| $75,000 to $99,999 | 225 | 7.8% |
| $100,000 to $149,999 | 481 | 16.7% |
| $150,000 to $199,999 | 187 | 6.5% |
| $200,000+ | 14 | 0.5% |
Family Income by Famaliy Size in Fulton County
6-person families (39 | 1.3%) account for the highest median family income in Fulton County with $106,750 per family, while 3-person families (473 | 16.4%) have the highest median income of $23,507 per family member.

| Income Bracket | # Families | Median Income |
| 2-Person Families | 1,516 (52.6%) | $39,833 |
| 3-Person Families | 473 (16.4%) | $70,521 |
| 4-Person Families | 459 (15.9%) | $65,515 |
| 5-Person Families | 272 (9.4%) | $106,607 |
| 6-Person Families | 39 (1.3%) | $106,750 |
| 7+ Person Families | 121 (4.2%) | $70,485 |
| Total | 2,880 (100.0%) | $50,833 |
Family Income by Number of Earners in Fulton County
The median family income in Fulton County is $50,833, with families comprising 3+ earners (246) having the highest median family income of $106,964, while families with no earners (877) have the lowest median family income of $35,625, accounting for 8.5% and 30.4% of families, respectively.

| Number of Earners | # Families | Median Income |
| No Earners | 877 (30.4%) | $35,625 |
| 1 Earner | 810 (28.1%) | $50,395 |
| 2 Earners | 947 (32.9%) | $87,125 |
| 3+ Earners | 246 (8.5%) | $106,964 |
| Total | 2,880 (100.0%) | $50,833 |
Household Income in Fulton County
Household Income Brackets in Fulton County
With 894 households falling in the category, the $35,000 to $49,999 income range is the most frequent in Fulton County, accounting for 18.7% of all households. In contrast, only 24 households (0.5%) fall into the $200,000+ income bracket, making it the least populous group.

| Income Bracket | # Households | % Households |
| Less than $10,000 | 225 | 4.7% |
| $10,000 to $14,999 | 397 | 8.3% |
| $15,000 to $24,999 | 727 | 15.2% |
| $25,000 to $34,999 | 669 | 14.0% |
| $35,000 to $49,999 | 894 | 18.7% |
| $50,000 to $74,999 | 841 | 17.6% |
| $75,000 to $99,999 | 301 | 6.3% |
| $100,000 to $149,999 | 497 | 10.4% |
| $150,000 to $199,999 | 196 | 4.1% |
| $200,000+ | 24 | 0.5% |
Household Income by Householder Age in Fulton County
The median household income in Fulton County is $38,917, with the highest median household income of $51,504 found in the 25 to 44 years age bracket for the primary householder. A total of 915 households (19.1%) fall into this category. Meanwhile, the 15 to 24 years age bracket for the primary householder has the lowest median household income of $23,047, with 67 households (1.4%) in this group.

| Income Bracket | # Households | Median Income |
| 15 to 24 Years | 67 (1.4%) | $23,047 |
| 25 to 44 Years | 915 (19.1%) | $51,504 |
| 45 to 64 Years | 2,001 (41.9%) | $50,947 |
| 65+ Years | 1,797 (37.6%) | $34,382 |
| Total | 4,780 (100.0%) | $38,917 |
Poverty in Fulton County
Income Below Poverty by Sex and Age in Fulton County
With 11.6% poverty level for males and 19.2% for females among the residents of Fulton County, 15 year old males and 18 to 24 year old females are the most vulnerable to poverty, with 20 males (23.0%) and 119 females (34.2%) in their respective age groups living below the poverty level.

| Age Bracket | Male | Female |
| Under 5 Years | 26 (7.7%) | 91 (32.0%) |
| 5 Years | 3 (5.1%) | 5 (6.9%) |
| 6 to 11 Years | 88 (22.7%) | 97 (20.0%) |
| 12 to 14 Years | 17 (6.0%) | 28 (16.6%) |
| 15 Years | 20 (23.0%) | 8 (25.8%) |
| 16 and 17 Years | 20 (13.1%) | 37 (16.7%) |
| 18 to 24 Years | 9 (1.6%) | 119 (34.2%) |
| 25 to 34 Years | 64 (11.8%) | 77 (14.3%) |
| 35 to 44 Years | 55 (9.6%) | 140 (23.6%) |
| 45 to 54 Years | 123 (17.2%) | 113 (15.7%) |
| 55 to 64 Years | 190 (20.6%) | 150 (15.4%) |
| 65 to 74 Years | 56 (6.8%) | 159 (18.6%) |
| 75 Years and over | 28 (4.6%) | 118 (17.6%) |
| Total | 699 (11.6%) | 1,142 (19.2%) |
Income Above Poverty by Sex and Age in Fulton County
According to the poverty statistics in Fulton County, males aged 18 to 24 years and females aged 5 years are the age groups that are most secure financially, with 98.4% of males and 93.1% of females in these age groups living above the poverty line.

| Age Bracket | Male | Female |
| Under 5 Years | 312 (92.3%) | 193 (68.0%) |
| 5 Years | 56 (94.9%) | 68 (93.1%) |
| 6 to 11 Years | 300 (77.3%) | 387 (80.0%) |
| 12 to 14 Years | 266 (94.0%) | 141 (83.4%) |
| 15 Years | 67 (77.0%) | 23 (74.2%) |
| 16 and 17 Years | 133 (86.9%) | 184 (83.3%) |
| 18 to 24 Years | 548 (98.4%) | 229 (65.8%) |
| 25 to 34 Years | 477 (88.2%) | 462 (85.7%) |
| 35 to 44 Years | 516 (90.4%) | 452 (76.3%) |
| 45 to 54 Years | 594 (82.9%) | 607 (84.3%) |
| 55 to 64 Years | 731 (79.4%) | 824 (84.6%) |
| 65 to 74 Years | 766 (93.2%) | 697 (81.4%) |
| 75 Years and over | 584 (95.4%) | 552 (82.4%) |
| Total | 5,350 (88.4%) | 4,819 (80.8%) |
Income Below Poverty Among Married-Couple Families in Fulton County
The poverty statistics for married-couple families in Fulton County show that 8.2% or 190 of the total 2,306 families live below the poverty line. Families with 3 or 4 children have the highest poverty rate of 8.6%, comprising of 22 families. On the other hand, families with 1 or 2 children have the lowest poverty rate of 8.0%, which includes 43 families.

| Children | Above Poverty | Below Poverty |
| No Children | 1,287 (91.7%) | 116 (8.3%) |
| 1 or 2 Children | 492 (92.0%) | 43 (8.0%) |
| 3 or 4 Children | 235 (91.4%) | 22 (8.6%) |
| 5 or more Children | 102 (91.9%) | 9 (8.1%) |
| Total | 2,116 (91.8%) | 190 (8.2%) |
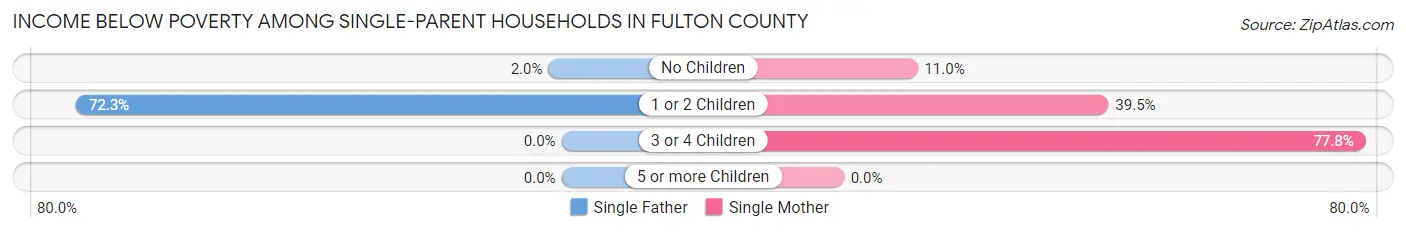
Income Below Poverty Among Single-Parent Households in Fulton County
According to the poverty data in Fulton County, 34.6% or 70 single-father households and 37.4% or 139 single-mother households are living below the poverty line. Among single-father households, those with 1 or 2 children have the highest poverty rate, with 68 households (72.3%) experiencing poverty. Likewise, among single-mother households, those with 3 or 4 children have the highest poverty rate, with 42 households (77.8%) falling below the poverty line.
| Children | Single Father | Single Mother |
| No Children | 2 (2.0%) | 11 (11.0%) |
| 1 or 2 Children | 68 (72.3%) | 86 (39.5%) |
| 3 or 4 Children | 0 (0.0%) | 42 (77.8%) |
| 5 or more Children | 0 (0.0%) | 0 (0.0%) |
| Total | 70 (34.6%) | 139 (37.4%) |
Income Below Poverty Among Married-Couple vs Single-Parent Households in Fulton County
The poverty data for Fulton County shows that 190 of the married-couple family households (8.2%) and 209 of the single-parent households (36.4%) are living below the poverty level. Within the married-couple family households, those with 3 or 4 children have the highest poverty rate, with 22 households (8.6%) falling below the poverty line. Among the single-parent households, those with 3 or 4 children have the highest poverty rate, with 42 household (70.0%) living below poverty.

| Children | Married-Couple Families | Single-Parent Households |
| No Children | 116 (8.3%) | 13 (6.4%) |
| 1 or 2 Children | 43 (8.0%) | 154 (49.4%) |
| 3 or 4 Children | 22 (8.6%) | 42 (70.0%) |
| 5 or more Children | 9 (8.1%) | 0 (0.0%) |
| Total | 190 (8.2%) | 209 (36.4%) |
Employment Characteristics in Fulton County
Employment by Class of Employer in Fulton County
Among the 4,212 employed individuals in Fulton County, private company employees (2,823 | 67.0%), state government employees (401 | 9.5%), and self-employed (not incorporated) (386 | 9.2%) make up the most common classes of employment.

| Employer Class | # Employees | % Employees |
| Private Company Employees | 2,823 | 67.0% |
| Self-Employed (Incorporated) | 66 | 1.6% |
| Self-Employed (Not Incorporated) | 386 | 9.2% |
| Not-for-profit Organizations | 207 | 4.9% |
| Local Government Employees | 233 | 5.5% |
| State Government Employees | 401 | 9.5% |
| Federal Government Employees | 96 | 2.3% |
| Unpaid Family Workers | 0 | 0.0% |
| Total | 4,212 | 100.0% |
Employment Status by Age in Fulton County
According to the labor force statistics for Fulton County, out of the total population over 16 years of age (9,987), 43.4% or 4,334 individuals are in the labor force, with 1.7% or 74 of them unemployed. The age group with the highest labor force participation rate is 20 to 24 years, with 89.6% or 550 individuals in the labor force. Within the labor force, the 20 to 24 years age range has the highest percentage of unemployed individuals, with 3.5% or 19 of them being unemployed.

| Age Bracket | In Labor Force | Unemployed |
| 16 to 19 Years | 273 (41.1%) | 0 (0.0%) |
| 20 to 24 Years | 550 (89.6%) | 19 (3.5%) |
| 25 to 29 Years | 385 (68.0%) | 0 (0.0%) |
| 30 to 34 Years | 349 (67.0%) | 10 (2.9%) |
| 35 to 44 Years | 837 (71.5%) | 8 (1.0%) |
| 45 to 54 Years | 982 (68.1%) | 31 (3.2%) |
| 55 to 59 Years | 515 (64.5%) | 5 (1.0%) |
| 60 to 64 Years | 278 (25.3%) | 0 (0.0%) |
| 65 to 74 Years | 135 (8.0%) | 0 (0.0%) |
| 75 Years and over | 27 (1.9%) | 0 (0.0%) |
| Total | 4,334 (43.4%) | 74 (1.7%) |
Employment Status by Educational Attainment in Fulton County
According to labor force statistics for Fulton County, 59.8% of individuals (3,348) out of the total population between 25 and 64 years of age (5,598) are in the labor force, with 1.6% or 54 of them being unemployed. The group with the highest labor force participation rate are those with the educational attainment of bachelor's degree or higher, with 70.2% or 652 individuals in the labor force. Within the labor force, individuals with high school diploma education have the highest percentage of unemployment, with 3.8% or 43 of them being unemployed.

| Educational Attainment | In Labor Force | Unemployed |
| Less than High School | 179 (32.0%) | 0 (0.0%) |
| High School Diploma | 1,136 (59.3%) | 73 (3.8%) |
| College / Associate Degree | 1,380 (62.9%) | 18 (0.8%) |
| Bachelor's Degree or higher | 652 (70.2%) | 0 (0.0%) |
| Total | 3,348 (59.8%) | 90 (1.6%) |
Employment Occupations by Sex in Fulton County
Management, Business, Science and Arts Occupations
The most common Management, Business, Science and Arts occupations in Fulton County are Management (465 | 10.9%), Health Diagnosing & Treating (324 | 7.6%), Community & Social Service (319 | 7.5%), Health Technologists (205 | 4.8%), and Education Instruction & Library (204 | 4.8%).

Management, Business, Science and Arts Occupations by Sex
Within the Management, Business, Science and Arts occupations in Fulton County, the most male-oriented occupations are Computers & Mathematics (100.0%), Architecture & Engineering (100.0%), and Computers, Engineering & Science (96.2%), while the most female-oriented occupations are Legal Services & Support (100.0%), Health Technologists (98.5%), and Health Diagnosing & Treating (88.9%).

| Occupation | Male | Female |
| Management | 240 (51.6%) | 225 (48.4%) |
| Business & Financial | 73 (86.9%) | 11 (13.1%) |
| Computers, Engineering & Science | 101 (96.2%) | 4 (3.8%) |
| Computers & Mathematics | 45 (100.0%) | 0 (0.0%) |
| Architecture & Engineering | 50 (100.0%) | 0 (0.0%) |
| Life, Physical & Social Science | 6 (60.0%) | 4 (40.0%) |
| Community & Social Service | 134 (42.0%) | 185 (58.0%) |
| Education, Arts & Media | 36 (43.4%) | 47 (56.6%) |
| Legal Services & Support | 0 (0.0%) | 11 (100.0%) |
| Education Instruction & Library | 83 (40.7%) | 121 (59.3%) |
| Arts, Media & Entertainment | 15 (71.4%) | 6 (28.6%) |
| Health Diagnosing & Treating | 36 (11.1%) | 288 (88.9%) |
| Health Technologists | 3 (1.5%) | 202 (98.5%) |
| Total (Category) | 584 (45.0%) | 713 (55.0%) |
| Total (Overall) | 2,206 (51.9%) | 2,043 (48.1%) |
Services Occupations
The most common Services occupations in Fulton County are Healthcare Support (337 | 7.9%), Food Preparation & Serving (297 | 7.0%), Cleaning & Maintenance (221 | 5.2%), Security & Protection (101 | 2.4%), and Law Enforcement (101 | 2.4%).

Services Occupations by Sex
Within the Services occupations in Fulton County, the most male-oriented occupations are Security & Protection (98.0%), Law Enforcement (98.0%), and Cleaning & Maintenance (91.9%), while the most female-oriented occupations are Healthcare Support (88.4%), Personal Care & Service (75.3%), and Food Preparation & Serving (53.5%).

| Occupation | Male | Female |
| Healthcare Support | 39 (11.6%) | 298 (88.4%) |
| Security & Protection | 99 (98.0%) | 2 (2.0%) |
| Firefighting & Prevention | 0 (0.0%) | 0 (0.0%) |
| Law Enforcement | 99 (98.0%) | 2 (2.0%) |
| Food Preparation & Serving | 138 (46.5%) | 159 (53.5%) |
| Cleaning & Maintenance | 203 (91.9%) | 18 (8.1%) |
| Personal Care & Service | 19 (24.7%) | 58 (75.3%) |
| Total (Category) | 498 (48.2%) | 535 (51.8%) |
| Total (Overall) | 2,206 (51.9%) | 2,043 (48.1%) |
Sales and Office Occupations
The most common Sales and Office occupations in Fulton County are Sales & Related (466 | 11.0%), and Office & Administration (374 | 8.8%).

Sales and Office Occupations by Sex

| Occupation | Male | Female |
| Sales & Related | 133 (28.5%) | 333 (71.5%) |
| Office & Administration | 26 (7.0%) | 348 (93.0%) |
| Total (Category) | 159 (18.9%) | 681 (81.1%) |
| Total (Overall) | 2,206 (51.9%) | 2,043 (48.1%) |
Natural Resources, Construction and Maintenance Occupations
The most common Natural Resources, Construction and Maintenance occupations in Fulton County are Construction & Extraction (168 | 4.0%), Installation, Maintenance & Repair (164 | 3.9%), and Farming, Fishing & Forestry (13 | 0.3%).

Natural Resources, Construction and Maintenance Occupations by Sex
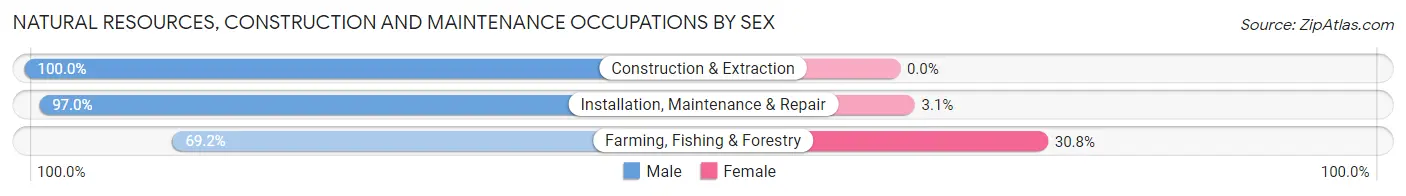
| Occupation | Male | Female |
| Farming, Fishing & Forestry | 9 (69.2%) | 4 (30.8%) |
| Construction & Extraction | 168 (100.0%) | 0 (0.0%) |
| Installation, Maintenance & Repair | 159 (97.0%) | 5 (3.0%) |
| Total (Category) | 336 (97.4%) | 9 (2.6%) |
| Total (Overall) | 2,206 (51.9%) | 2,043 (48.1%) |
Production, Transportation and Moving Occupations
The most common Production, Transportation and Moving occupations in Fulton County are Transportation (334 | 7.9%), Production (300 | 7.1%), and Material Moving (100 | 2.4%).

Production, Transportation and Moving Occupations by Sex
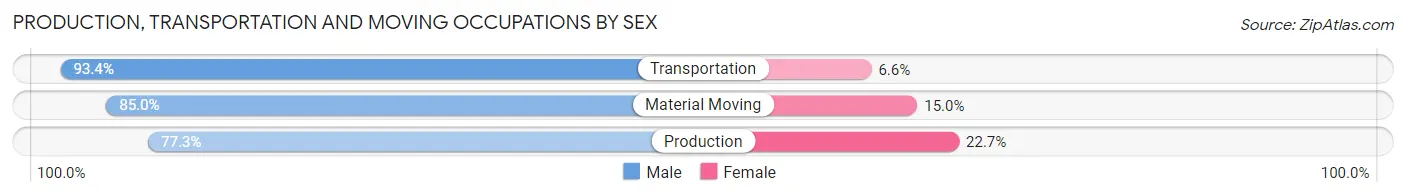
| Occupation | Male | Female |
| Production | 232 (77.3%) | 68 (22.7%) |
| Transportation | 312 (93.4%) | 22 (6.6%) |
| Material Moving | 85 (85.0%) | 15 (15.0%) |
| Total (Category) | 629 (85.7%) | 105 (14.3%) |
| Total (Overall) | 2,206 (51.9%) | 2,043 (48.1%) |
Employment Industries by Sex in Fulton County
Employment Industries in Fulton County
The major employment industries in Fulton County include Health Care & Social Assistance (912 | 21.5%), Retail Trade (608 | 14.3%), Educational Services (463 | 10.9%), Manufacturing (398 | 9.4%), and Transportation & Warehousing (347 | 8.2%).

Employment Industries by Sex in Fulton County
The Fulton County industries that see more men than women are Construction (100.0%), Transportation & Warehousing (86.7%), and Information (86.7%), whereas the industries that tend to have a higher number of women are Utilities (76.5%), Real Estate, Rental & Leasing (75.0%), and Health Care & Social Assistance (72.8%).

| Industry | Male | Female |
| Agriculture, Fishing & Hunting | 110 (71.0%) | 45 (29.0%) |
| Mining, Quarrying, & Extraction | 0 (0.0%) | 0 (0.0%) |
| Construction | 231 (100.0%) | 0 (0.0%) |
| Manufacturing | 322 (80.9%) | 76 (19.1%) |
| Wholesale Trade | 84 (59.6%) | 57 (40.4%) |
| Retail Trade | 246 (40.5%) | 362 (59.5%) |
| Transportation & Warehousing | 301 (86.7%) | 46 (13.3%) |
| Utilities | 16 (23.5%) | 52 (76.5%) |
| Information | 13 (86.7%) | 2 (13.3%) |
| Finance & Insurance | 64 (52.0%) | 59 (48.0%) |
| Real Estate, Rental & Leasing | 2 (25.0%) | 6 (75.0%) |
| Professional & Scientific | 34 (42.0%) | 47 (58.0%) |
| Enterprise Management | 0 (0.0%) | 0 (0.0%) |
| Administrative & Support | 27 (37.5%) | 45 (62.5%) |
| Educational Services | 161 (34.8%) | 302 (65.2%) |
| Health Care & Social Assistance | 248 (27.2%) | 664 (72.8%) |
| Arts, Entertainment & Recreation | 3 (50.0%) | 3 (50.0%) |
| Accommodation & Food Services | 157 (58.4%) | 112 (41.6%) |
| Public Administration | 140 (63.3%) | 81 (36.6%) |
| Total | 2,206 (51.9%) | 2,043 (48.1%) |
Education in Fulton County
School Enrollment in Fulton County
The most common levels of schooling among the 2,137 students in Fulton County are elementary school (552 | 25.8%), high school (540 | 25.3%), and middle school (533 | 24.9%).

| School Level | # Students | % Students |
| Nursery / Preschool | 62 | 2.9% |
| Kindergarten | 199 | 9.3% |
| Elementary School | 552 | 25.8% |
| Middle School | 533 | 24.9% |
| High School | 540 | 25.3% |
| College / Undergraduate | 199 | 9.3% |
| Graduate / Professional | 52 | 2.4% |
| Total | 2,137 | 100.0% |
School Enrollment by Age by Funding Source in Fulton County
Out of a total of 2,137 students who are enrolled in schools in Fulton County, 297 (13.9%) attend a private institution, while the remaining 1,840 (86.1%) are enrolled in public schools. The age group of 25 to 34 year olds has the highest likelihood of being enrolled in private schools, with 8 (23.5% in the age bracket) enrolled. Conversely, the age group of 18 to 19 year olds has the lowest likelihood of being enrolled in a private school, with 154 (100.0% in the age bracket) attending a public institution.
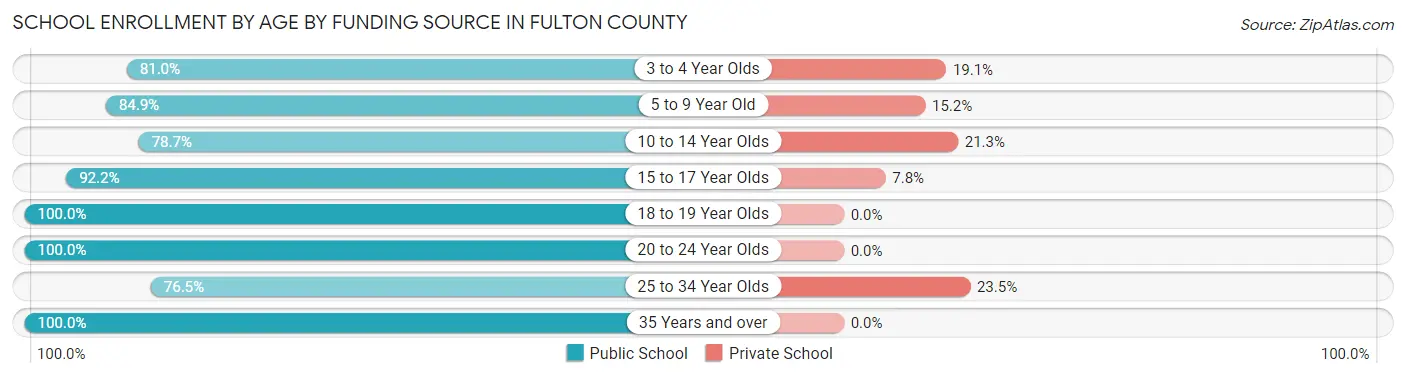
| Age Bracket | Public School | Private School |
| 3 to 4 Year Olds | 34 (80.9%) | 8 (19.1%) |
| 5 to 9 Year Old | 549 (84.9%) | 98 (15.1%) |
| 10 to 14 Year Olds | 552 (78.7%) | 149 (21.3%) |
| 15 to 17 Year Olds | 392 (92.2%) | 33 (7.8%) |
| 18 to 19 Year Olds | 154 (100.0%) | 0 (0.0%) |
| 20 to 24 Year Olds | 64 (100.0%) | 0 (0.0%) |
| 25 to 34 Year Olds | 26 (76.5%) | 8 (23.5%) |
| 35 Years and over | 70 (100.0%) | 0 (0.0%) |
| Total | 1,840 (86.1%) | 297 (13.9%) |
Educational Attainment by Field of Study in Fulton County
Education (462 | 35.8%), science & technology (203 | 15.8%), business (121 | 9.4%), visual & performing arts (99 | 7.7%), and bio, nature & agricultural (74 | 5.7%) are the most common fields of study among 1,289 individuals in Fulton County who have obtained a bachelor's degree or higher.

| Field of Study | # Graduates | % Graduates |
| Computers & Mathematics | 26 | 2.0% |
| Bio, Nature & Agricultural | 74 | 5.7% |
| Physical & Health Sciences | 17 | 1.3% |
| Psychology | 31 | 2.4% |
| Social Sciences | 61 | 4.7% |
| Engineering | 44 | 3.4% |
| Multidisciplinary Studies | 0 | 0.0% |
| Science & Technology | 203 | 15.8% |
| Business | 121 | 9.4% |
| Education | 462 | 35.8% |
| Literature & Languages | 44 | 3.4% |
| Liberal Arts & History | 63 | 4.9% |
| Visual & Performing Arts | 99 | 7.7% |
| Communications | 0 | 0.0% |
| Arts & Humanities | 44 | 3.4% |
| Total | 1,289 | 100.0% |
Transportation & Commute in Fulton County
Vehicle Availability by Sex in Fulton County
The most prevalent vehicle ownership categories in Fulton County are males with 2 vehicles (910, accounting for 41.7%) and females with 2 vehicles (708, making up 44.9%).
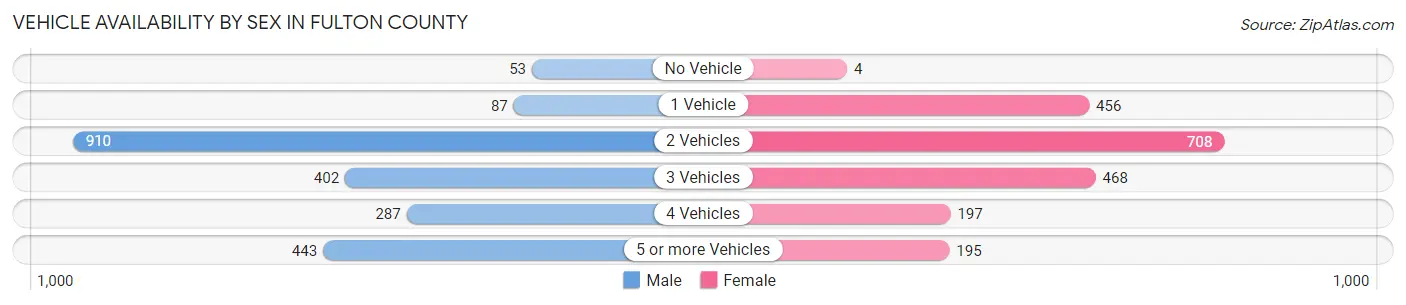
| Vehicles Available | Male | Female |
| No Vehicle | 53 (2.4%) | 4 (0.2%) |
| 1 Vehicle | 87 (4.0%) | 456 (22.5%) |
| 2 Vehicles | 910 (41.7%) | 708 (34.9%) |
| 3 Vehicles | 402 (18.4%) | 468 (23.1%) |
| 4 Vehicles | 287 (13.2%) | 197 (9.7%) |
| 5 or more Vehicles | 443 (20.3%) | 195 (9.6%) |
| Total | 2,182 (100.0%) | 2,028 (100.0%) |
Commute Time in Fulton County
The most frequently occuring commute durations in Fulton County are 30 to 34 minutes (565 commuters, 14.6%), 10 to 14 minutes (506 commuters, 13.1%), and 5 to 9 minutes (485 commuters, 12.6%).
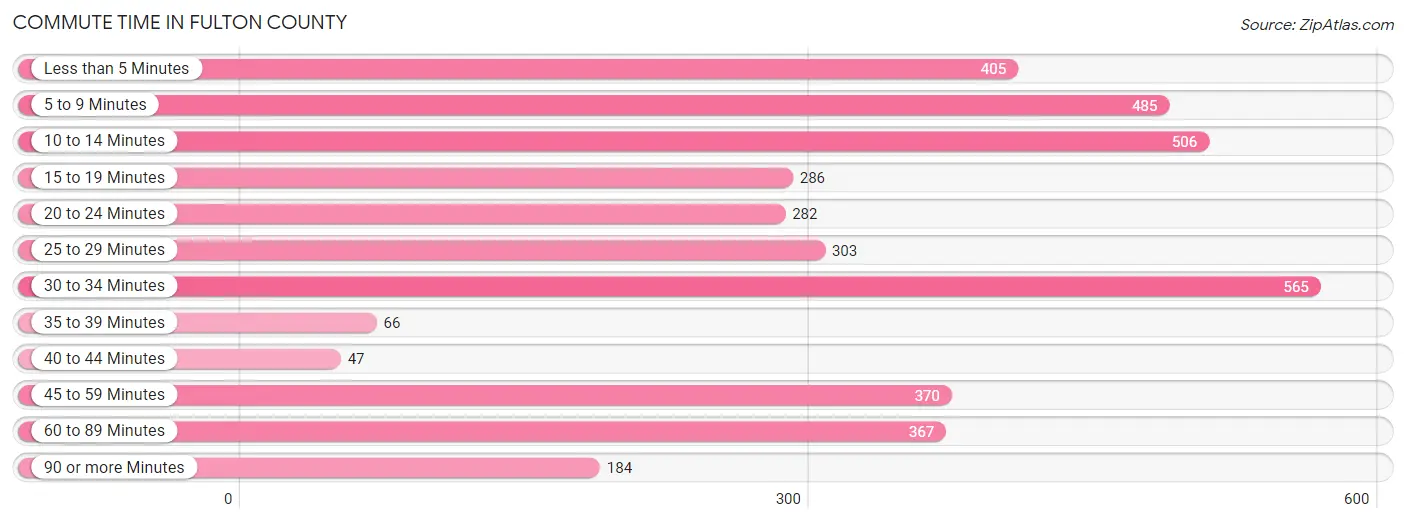
| Commute Time | # Commuters | % Commuters |
| Less than 5 Minutes | 405 | 10.5% |
| 5 to 9 Minutes | 485 | 12.6% |
| 10 to 14 Minutes | 506 | 13.1% |
| 15 to 19 Minutes | 286 | 7.4% |
| 20 to 24 Minutes | 282 | 7.3% |
| 25 to 29 Minutes | 303 | 7.8% |
| 30 to 34 Minutes | 565 | 14.6% |
| 35 to 39 Minutes | 66 | 1.7% |
| 40 to 44 Minutes | 47 | 1.2% |
| 45 to 59 Minutes | 370 | 9.6% |
| 60 to 89 Minutes | 367 | 9.5% |
| 90 or more Minutes | 184 | 4.8% |
Commute Time by Sex in Fulton County
The most common commute times in Fulton County are 10 to 14 minutes (352 commuters, 18.2%) for males and 30 to 34 minutes (377 commuters, 19.5%) for females.

| Commute Time | Male | Female |
| Less than 5 Minutes | 189 (9.8%) | 216 (11.2%) |
| 5 to 9 Minutes | 197 (10.2%) | 288 (14.9%) |
| 10 to 14 Minutes | 352 (18.2%) | 154 (8.0%) |
| 15 to 19 Minutes | 91 (4.7%) | 195 (10.1%) |
| 20 to 24 Minutes | 107 (5.5%) | 175 (9.1%) |
| 25 to 29 Minutes | 129 (6.7%) | 174 (9.0%) |
| 30 to 34 Minutes | 188 (9.7%) | 377 (19.5%) |
| 35 to 39 Minutes | 28 (1.5%) | 38 (2.0%) |
| 40 to 44 Minutes | 22 (1.1%) | 25 (1.3%) |
| 45 to 59 Minutes | 187 (9.7%) | 183 (9.5%) |
| 60 to 89 Minutes | 275 (14.2%) | 92 (4.8%) |
| 90 or more Minutes | 169 (8.7%) | 15 (0.8%) |
Time of Departure to Work by Sex in Fulton County
The most frequent times of departure to work in Fulton County are 12:00 AM to 4:59 AM (353, 18.2%) for males and 7:00 AM to 7:29 AM (403, 20.9%) for females.

| Time of Departure | Male | Female |
| 12:00 AM to 4:59 AM | 353 (18.2%) | 4 (0.2%) |
| 5:00 AM to 5:29 AM | 25 (1.3%) | 93 (4.8%) |
| 5:30 AM to 5:59 AM | 55 (2.8%) | 271 (14.0%) |
| 6:00 AM to 6:29 AM | 241 (12.5%) | 87 (4.5%) |
| 6:30 AM to 6:59 AM | 179 (9.3%) | 258 (13.4%) |
| 7:00 AM to 7:29 AM | 218 (11.3%) | 403 (20.9%) |
| 7:30 AM to 7:59 AM | 263 (13.6%) | 230 (11.9%) |
| 8:00 AM to 8:29 AM | 268 (13.9%) | 89 (4.6%) |
| 8:30 AM to 8:59 AM | 26 (1.3%) | 26 (1.3%) |
| 9:00 AM to 9:59 AM | 94 (4.9%) | 10 (0.5%) |
| 10:00 AM to 10:59 AM | 6 (0.3%) | 28 (1.5%) |
| 11:00 AM to 11:59 AM | 5 (0.3%) | 105 (5.4%) |
| 12:00 PM to 3:59 PM | 14 (0.7%) | 233 (12.1%) |
| 4:00 PM to 11:59 PM | 187 (9.7%) | 95 (4.9%) |
| Total | 1,934 (100.0%) | 1,932 (100.0%) |
Housing Occupancy in Fulton County
Occupancy by Ownership in Fulton County
Of the total 4,780 dwellings in Fulton County, owner-occupied units account for 4,040 (84.5%), while renter-occupied units make up 740 (15.5%).

| Occupancy | # Housing Units | % Housing Units |
| Owner Occupied Housing Units | 4,040 | 84.5% |
| Renter-Occupied Housing Units | 740 | 15.5% |
| Total Occupied Housing Units | 4,780 | 100.0% |
Occupancy by Household Size in Fulton County

| Household Size | # Housing Units | % Housing Units |
| 1-Person Household | 1,655 | 34.6% |
| 2-Person Household | 1,698 | 35.5% |
| 3-Person Household | 509 | 10.6% |
| 4+ Person Household | 918 | 19.2% |
| Total Housing Units | 4,780 | 100.0% |
Occupancy by Ownership by Household Size in Fulton County

| Household Size | Owner-occupied | Renter-occupied |
| 1-Person Household | 1,312 (79.3%) | 343 (20.7%) |
| 2-Person Household | 1,524 (89.7%) | 174 (10.2%) |
| 3-Person Household | 463 (91.0%) | 46 (9.0%) |
| 4+ Person Household | 741 (80.7%) | 177 (19.3%) |
| Total Housing Units | 4,040 (84.5%) | 740 (15.5%) |
Occupancy by Educational Attainment in Fulton County

| Household Size | Owner-occupied | Renter-occupied |
| Less than High School | 516 (90.8%) | 52 (9.1%) |
| High School Diploma | 1,389 (83.0%) | 285 (17.0%) |
| College/Associate Degree | 1,456 (80.6%) | 350 (19.4%) |
| Bachelor's Degree or higher | 679 (92.8%) | 53 (7.2%) |
Occupancy by Age of Householder in Fulton County

| Age Bracket | # Households | % Households |
| Under 35 Years | 514 | 10.7% |
| 35 to 44 Years | 468 | 9.8% |
| 45 to 54 Years | 777 | 16.3% |
| 55 to 64 Years | 1,224 | 25.6% |
| 65 to 74 Years | 1,114 | 23.3% |
| 75 to 84 Years | 522 | 10.9% |
| 85 Years and Over | 161 | 3.4% |
| Total | 4,780 | 100.0% |
Housing Finances in Fulton County
Median Income by Occupancy in Fulton County
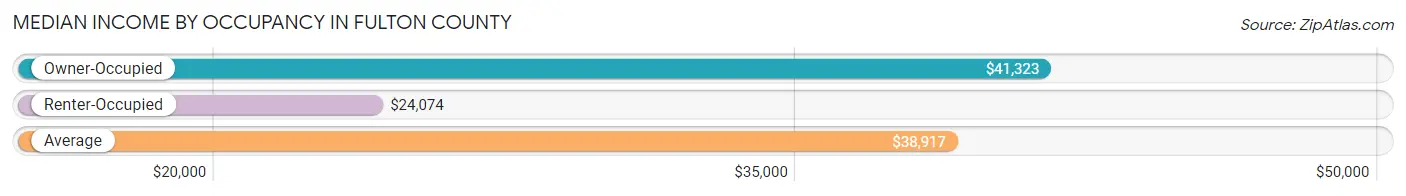
| Occupancy Type | # Households | Median Income |
| Owner-Occupied | 4,040 (84.5%) | $41,323 |
| Renter-Occupied | 740 (15.5%) | $24,074 |
| Average | 4,780 (100.0%) | $38,917 |
Occupancy by Householder Income Bracket in Fulton County

| Income Bracket | Owner-occupied | Renter-occupied |
| Less than $5,000 | 56 (1.4%) | 14 (1.9%) |
| $5,000 to $9,999 | 110 (2.7%) | 46 (6.2%) |
| $10,000 to $14,999 | 186 (4.6%) | 213 (28.8%) |
| $15,000 to $19,999 | 300 (7.4%) | 57 (7.7%) |
| $20,000 to $24,999 | 309 (7.6%) | 60 (8.1%) |
| $25,000 to $34,999 | 592 (14.6%) | 77 (10.4%) |
| $35,000 to $49,999 | 785 (19.4%) | 111 (15.0%) |
| $50,000 to $74,999 | 737 (18.2%) | 104 (14.1%) |
| $75,000 to $99,999 | 293 (7.2%) | 9 (1.2%) |
| $100,000 to $149,999 | 450 (11.1%) | 48 (6.5%) |
| $150,000 or more | 222 (5.5%) | 1 (0.1%) |
| Total | 4,040 (100.0%) | 740 (100.0%) |
Monthly Housing Cost Tiers in Fulton County

| Monthly Cost | Owner-occupied | Renter-occupied |
| Less than $300 | 989 (24.5%) | 71 (9.6%) |
| $300 to $499 | 1,009 (25.0%) | 63 (8.5%) |
| $500 to $799 | 918 (22.7%) | 315 (42.6%) |
| $800 to $999 | 241 (6.0%) | 68 (9.2%) |
| $1,000 to $1,499 | 522 (12.9%) | 61 (8.2%) |
| $1,500 to $1,999 | 118 (2.9%) | 7 (0.9%) |
| $2,000 to $2,499 | 168 (4.2%) | 0 (0.0%) |
| $2,500 to $2,999 | 43 (1.1%) | 0 (0.0%) |
| $3,000 or more | 32 (0.8%) | 0 (0.0%) |
| Total | 4,040 (100.0%) | 740 (100.0%) |
Physical Housing Characteristics in Fulton County
Housing Structures in Fulton County

| Structure Type | # Housing Units | % Housing Units |
| Single Unit, Detached | 3,442 | 72.0% |
| Single Unit, Attached | 47 | 1.0% |
| 2 Unit Apartments | 73 | 1.5% |
| 3 or 4 Unit Apartments | 31 | 0.6% |
| 5 to 9 Unit Apartments | 10 | 0.2% |
| 10 or more Apartments | 33 | 0.7% |
| Mobile Home / Other | 1,144 | 23.9% |
| Total | 4,780 | 100.0% |
Housing Structures by Occupancy in Fulton County

| Structure Type | Owner-occupied | Renter-occupied |
| Single Unit, Detached | 3,006 (87.3%) | 436 (12.7%) |
| Single Unit, Attached | 17 (36.2%) | 30 (63.8%) |
| 2 Unit Apartments | 0 (0.0%) | 73 (100.0%) |
| 3 or 4 Unit Apartments | 0 (0.0%) | 31 (100.0%) |
| 5 to 9 Unit Apartments | 0 (0.0%) | 10 (100.0%) |
| 10 or more Apartments | 0 (0.0%) | 33 (100.0%) |
| Mobile Home / Other | 1,017 (88.9%) | 127 (11.1%) |
| Total | 4,040 (84.5%) | 740 (15.5%) |
Housing Structures by Number of Rooms in Fulton County

| Number of Rooms | Owner-occupied | Renter-occupied |
| 1 Room | 114 (2.8%) | 17 (2.3%) |
| 2 or 3 Rooms | 148 (3.7%) | 127 (17.2%) |
| 4 or 5 Rooms | 1,639 (40.6%) | 310 (41.9%) |
| 6 or 7 Rooms | 1,513 (37.4%) | 186 (25.1%) |
| 8 or more Rooms | 626 (15.5%) | 100 (13.5%) |
| Total | 4,040 (100.0%) | 740 (100.0%) |
Housing Structure by Heating Type in Fulton County

| Heating Type | Owner-occupied | Renter-occupied |
| Utility Gas | 81 (2.0%) | 29 (3.9%) |
| Bottled, Tank, or LP Gas | 1,113 (27.6%) | 209 (28.2%) |
| Electricity | 2,271 (56.2%) | 472 (63.8%) |
| Fuel Oil or Kerosene | 2 (0.1%) | 0 (0.0%) |
| Coal or Coke | 0 (0.0%) | 0 (0.0%) |
| All other Fuels | 573 (14.2%) | 26 (3.5%) |
| No Fuel Used | 0 (0.0%) | 4 (0.5%) |
| Total | 4,040 (100.0%) | 740 (100.0%) |
Household Vehicle Usage in Fulton County
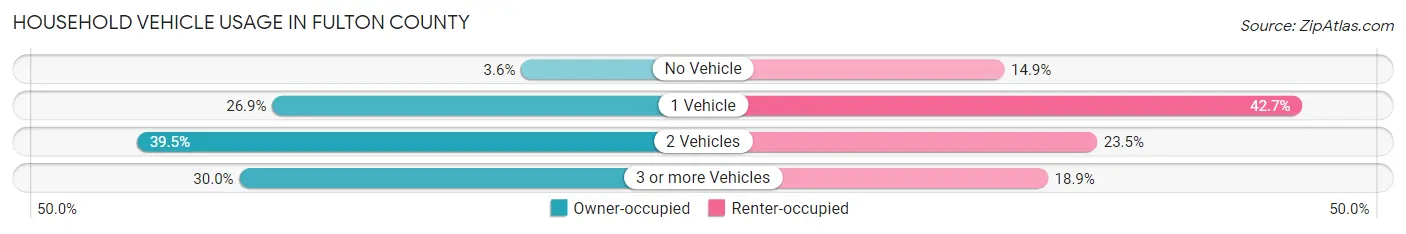
| Vehicles per Household | Owner-occupied | Renter-occupied |
| No Vehicle | 147 (3.6%) | 110 (14.9%) |
| 1 Vehicle | 1,086 (26.9%) | 316 (42.7%) |
| 2 Vehicles | 1,597 (39.5%) | 174 (23.5%) |
| 3 or more Vehicles | 1,210 (29.9%) | 140 (18.9%) |
| Total | 4,040 (100.0%) | 740 (100.0%) |
Real Estate & Mortgages in Fulton County
Real Estate and Mortgage Overview in Fulton County
| Characteristic | Without Mortgage | With Mortgage |
| Housing Units | 2,357 | 1,683 |
| Median Property Value | $89,800 | $117,100 |
| Median Household Income | $37,694 | $118 |
| Monthly Housing Costs | $342 | $21 |
| Real Estate Taxes | $440 | $137 |
Property Value by Mortgage Status in Fulton County
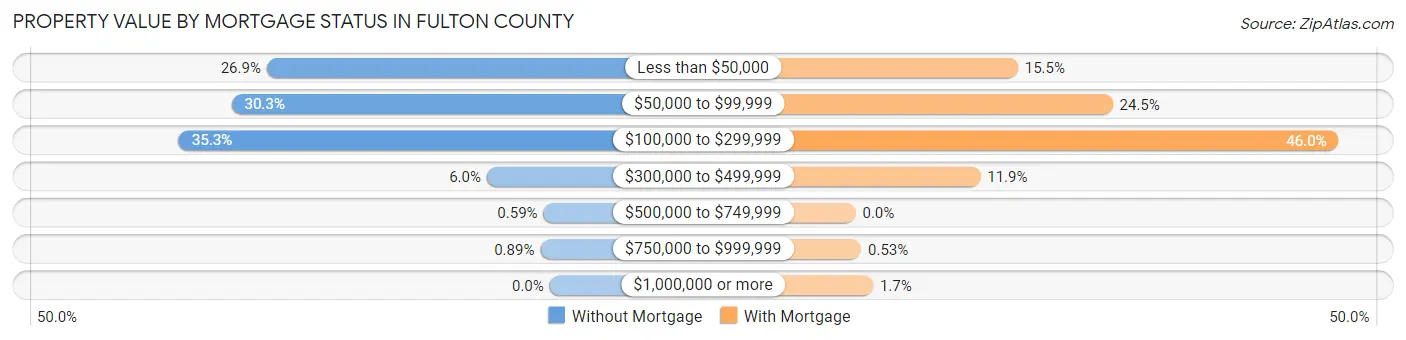
| Property Value | Without Mortgage | With Mortgage |
| Less than $50,000 | 635 (26.9%) | 260 (15.4%) |
| $50,000 to $99,999 | 714 (30.3%) | 412 (24.5%) |
| $100,000 to $299,999 | 832 (35.3%) | 774 (46.0%) |
| $300,000 to $499,999 | 141 (6.0%) | 200 (11.9%) |
| $500,000 to $749,999 | 14 (0.6%) | 0 (0.0%) |
| $750,000 to $999,999 | 21 (0.9%) | 9 (0.5%) |
| $1,000,000 or more | 0 (0.0%) | 28 (1.7%) |
| Total | 2,357 (100.0%) | 1,683 (100.0%) |
Household Income by Mortgage Status in Fulton County

| Household Income | Without Mortgage | With Mortgage |
| Less than $10,000 | 106 (4.5%) | 8 (0.5%) |
| $10,000 to $24,999 | 607 (25.8%) | 60 (3.6%) |
| $25,000 to $34,999 | 358 (15.2%) | 188 (11.2%) |
| $35,000 to $49,999 | 516 (21.9%) | 234 (13.9%) |
| $50,000 to $74,999 | 335 (14.2%) | 269 (16.0%) |
| $75,000 to $99,999 | 193 (8.2%) | 402 (23.9%) |
| $100,000 to $149,999 | 138 (5.9%) | 100 (5.9%) |
| $150,000 or more | 104 (4.4%) | 312 (18.5%) |
| Total | 2,357 (100.0%) | 1,683 (100.0%) |
Property Value to Household Income Ratio in Fulton County
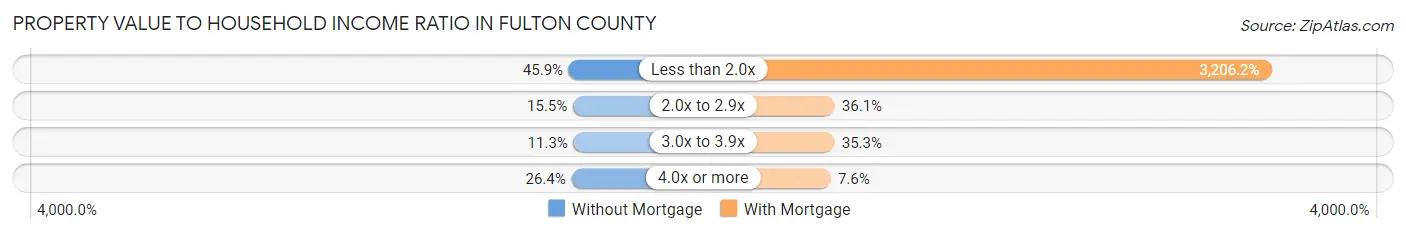
| Value-to-Income Ratio | Without Mortgage | With Mortgage |
| Less than 2.0x | 1,082 (45.9%) | 53,961 (3,206.2%) |
| 2.0x to 2.9x | 365 (15.5%) | 608 (36.1%) |
| 3.0x to 3.9x | 267 (11.3%) | 594 (35.3%) |
| 4.0x or more | 623 (26.4%) | 127 (7.5%) |
| Total | 2,357 (100.0%) | 1,683 (100.0%) |
Real Estate Taxes by Mortgage Status in Fulton County
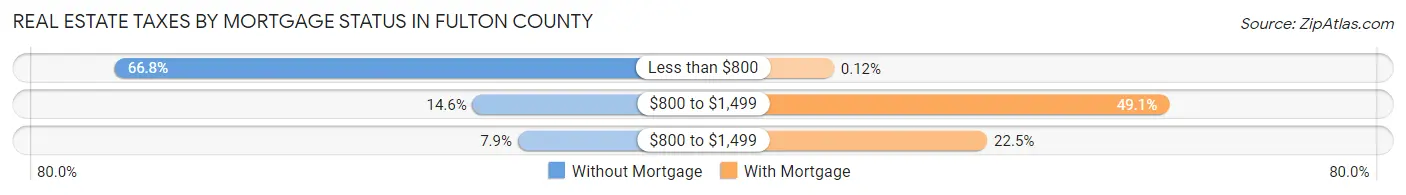
| Property Taxes | Without Mortgage | With Mortgage |
| Less than $800 | 1,575 (66.8%) | 2 (0.1%) |
| $800 to $1,499 | 343 (14.5%) | 826 (49.1%) |
| $800 to $1,499 | 187 (7.9%) | 379 (22.5%) |
| Total | 2,357 (100.0%) | 1,683 (100.0%) |
Health & Disability in Fulton County
Health Insurance Coverage by Age in Fulton County

| Age Bracket | With Coverage | Without Coverage |
| Under 6 Years | 636 (84.4%) | 118 (15.7%) |
| 6 to 18 Years | 1,659 (82.4%) | 354 (17.6%) |
| 19 to 25 Years | 736 (82.1%) | 160 (17.9%) |
| 26 to 34 Years | 626 (70.2%) | 266 (29.8%) |
| 35 to 44 Years | 980 (84.3%) | 183 (15.7%) |
| 45 to 54 Years | 1,323 (92.6%) | 105 (7.3%) |
| 55 to 64 Years | 1,820 (96.0%) | 75 (4.0%) |
| 65 to 74 Years | 1,668 (99.4%) | 10 (0.6%) |
| 75 Years and older | 1,282 (100.0%) | 0 (0.0%) |
| Total | 10,730 (89.4%) | 1,271 (10.6%) |
Health Insurance Coverage by Citizenship Status in Fulton County

| Citizenship Status | With Coverage | Without Coverage |
| Native Born | 636 (84.4%) | 118 (15.7%) |
| Foreign Born, Citizen | 1,659 (82.4%) | 354 (17.6%) |
| Foreign Born, not a Citizen | 736 (82.1%) | 160 (17.9%) |
Health Insurance Coverage by Household Income in Fulton County

| Household Income | With Coverage | Without Coverage |
| Under $25,000 | 2,252 (94.9%) | 121 (5.1%) |
| $25,000 to $49,999 | 3,343 (91.9%) | 295 (8.1%) |
| $50,000 to $74,999 | 1,959 (80.6%) | 470 (19.4%) |
| $75,000 to $99,999 | 662 (86.7%) | 102 (13.4%) |
| $100,000 and over | 2,500 (89.8%) | 283 (10.2%) |
Public vs Private Health Insurance Coverage by Age in Fulton County

| Age Bracket | Public Insurance | Private Insurance |
| Under 6 | 525 (69.6%) | 161 (21.3%) |
| 6 to 18 Years | 1,047 (52.0%) | 704 (35.0%) |
| 19 to 25 Years | 378 (42.2%) | 358 (40.0%) |
| 25 to 34 Years | 277 (31.0%) | 369 (41.4%) |
| 35 to 44 Years | 368 (31.6%) | 628 (54.0%) |
| 45 to 54 Years | 480 (33.6%) | 939 (65.8%) |
| 55 to 64 Years | 862 (45.5%) | 1,062 (56.0%) |
| 65 to 74 Years | 1,666 (99.3%) | 735 (43.8%) |
| 75 Years and over | 1,282 (100.0%) | 744 (58.0%) |
| Total | 6,885 (57.4%) | 5,700 (47.5%) |
Disability Status by Sex by Age in Fulton County

| Age Bracket | Male | Female |
| Under 5 Years | 0 (0.0%) | 0 (0.0%) |
| 5 to 17 Years | 15 (1.5%) | 37 (3.8%) |
| 18 to 34 Years | 111 (10.1%) | 58 (6.5%) |
| 35 to 64 Years | 642 (29.2%) | 521 (22.8%) |
| 65 to 74 Years | 418 (50.8%) | 237 (27.7%) |
| 75 Years and over | 379 (61.9%) | 426 (63.6%) |
Disability Class by Sex by Age in Fulton County
Disability Class: Hearing Difficulty

| Age Bracket | Male | Female |
| Under 5 Years | 0 (0.0%) | 0 (0.0%) |
| 5 to 17 Years | 7 (0.7%) | 0 (0.0%) |
| 18 to 34 Years | 19 (1.7%) | 0 (0.0%) |
| 35 to 64 Years | 173 (7.9%) | 146 (6.4%) |
| 65 to 74 Years | 290 (35.3%) | 76 (8.9%) |
| 75 Years and over | 149 (24.3%) | 267 (39.9%) |
Disability Class: Vision Difficulty

| Age Bracket | Male | Female |
| Under 5 Years | 0 (0.0%) | 0 (0.0%) |
| 5 to 17 Years | 0 (0.0%) | 34 (3.5%) |
| 18 to 34 Years | 24 (2.2%) | 5 (0.6%) |
| 35 to 64 Years | 48 (2.2%) | 112 (4.9%) |
| 65 to 74 Years | 83 (10.1%) | 7 (0.8%) |
| 75 Years and over | 119 (19.4%) | 82 (12.2%) |
Disability Class: Cognitive Difficulty

| Age Bracket | Male | Female |
| 5 to 17 Years | 15 (1.5%) | 3 (0.3%) |
| 18 to 34 Years | 9 (0.8%) | 53 (6.0%) |
| 35 to 64 Years | 52 (2.4%) | 109 (4.8%) |
| 65 to 74 Years | 70 (8.5%) | 54 (6.3%) |
| 75 Years and over | 53 (8.7%) | 207 (30.9%) |
Disability Class: Ambulatory Difficulty

| Age Bracket | Male | Female |
| 5 to 17 Years | 0 (0.0%) | 0 (0.0%) |
| 18 to 34 Years | 77 (7.0%) | 5 (0.6%) |
| 35 to 64 Years | 441 (20.1%) | 354 (15.5%) |
| 65 to 74 Years | 280 (34.1%) | 147 (17.2%) |
| 75 Years and over | 184 (30.1%) | 390 (58.2%) |
Disability Class: Self-Care Difficulty
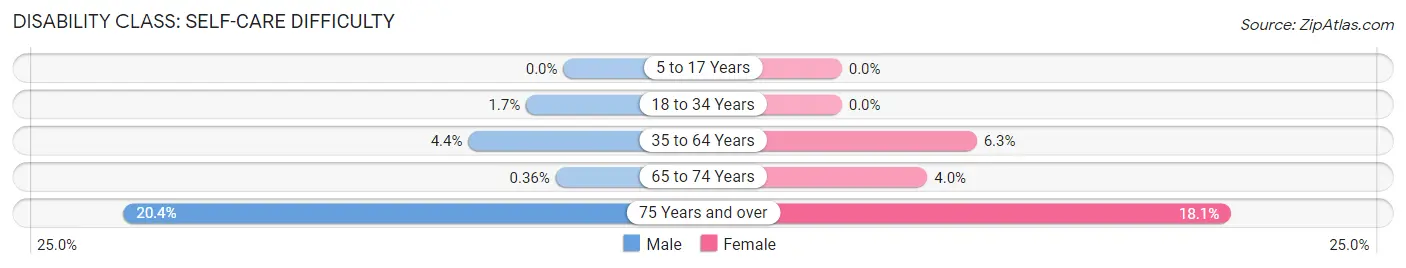
| Age Bracket | Male | Female |
| 5 to 17 Years | 0 (0.0%) | 0 (0.0%) |
| 18 to 34 Years | 19 (1.7%) | 0 (0.0%) |
| 35 to 64 Years | 97 (4.4%) | 143 (6.3%) |
| 65 to 74 Years | 3 (0.4%) | 34 (4.0%) |
| 75 Years and over | 125 (20.4%) | 121 (18.1%) |
Technology Access in Fulton County
Computing Device Access in Fulton County
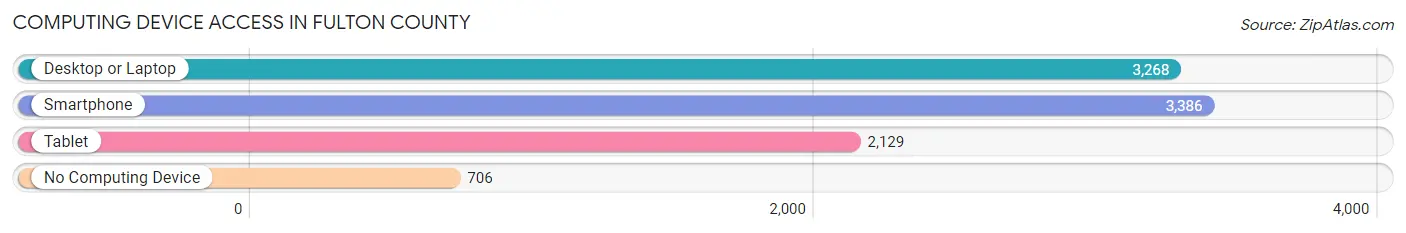
| Device Type | # Households | % Households |
| Desktop or Laptop | 3,268 | 68.4% |
| Smartphone | 3,386 | 70.8% |
| Tablet | 2,129 | 44.5% |
| No Computing Device | 706 | 14.8% |
| Total | 4,780 | 100.0% |
Internet Access in Fulton County

| Internet Type | # Households | % Households |
| Dial-Up Internet | 24 | 0.5% |
| Broadband Home | 2,243 | 46.9% |
| Cellular Data Only | 466 | 9.8% |
| Satellite Internet | 452 | 9.5% |
| No Internet | 1,820 | 38.1% |
| Total | 4,780 | 100.0% |
Fulton County Summary
Fulton County, Arkansas is located in the northeast corner of the state and is bordered by the states of Missouri and Tennessee. It is part of the Ozark Mountains region and is home to the Ozark National Forest. The county seat is Salem, and the largest city is Mammoth Spring. As of the 2010 census, the population was 12,245.
Geography
Fulton County is located in the northeast corner of Arkansas and is bordered by the states of Missouri and Tennessee. It is part of the Ozark Mountains region and is home to the Ozark National Forest. The county is mostly mountainous and is drained by the Spring River, which flows through the county from north to south. The highest point in the county is Pilot Knob, which has an elevation of 1,845 feet.
The county has a total area of 602 square miles, of which 599 square miles is land and 3 square miles is water. The county is divided into two distinct regions: the Ozark Plateau in the north and the Mississippi Alluvial Plain in the south.
Demographics
As of the 2010 census, there were 12,245 people, 4,845 households, and 3,521 families residing in the county. The population density was 20.4 people per square mile. There were 5,541 housing units at an average density of 9.2 per square mile. The racial makeup of the county was 97.2% White, 0.3% Black or African American, 0.3% Native American, 0.2% Asian, 0.1% Pacific Islander, 0.7% from other races, and 1.2% from two or more races. 1.7% of the population were Hispanic or Latino of any race.
Economy
Fulton County is a rural county with a largely agricultural economy. The county is home to several large farms, as well as several small family farms. The county is also home to several small businesses, including a few restaurants, convenience stores, and gas stations. The county is also home to several manufacturing companies, including a furniture manufacturer and a plastics manufacturer.
The county is home to several tourist attractions, including the Ozark National Forest, the Spring River, and the Mammoth Spring State Park. The county is also home to several historic sites, including the historic town of Salem and the historic courthouse in Salem.
Conclusion
Fulton County, Arkansas is a rural county located in the northeast corner of the state. It is part of the Ozark Mountains region and is home to the Ozark National Forest. As of the 2010 census, the population was 12,245. The county has a largely agricultural economy, with several large farms and small family farms. The county is also home to several small businesses, manufacturing companies, and tourist attractions.
Common Questions
What is the Total Population of Fulton County?
Total Population of Fulton County is 12,183.
What is the Total Male Population of Fulton County?
Total Male Population of Fulton County is 6,091.
What is the Total Female Population of Fulton County?
Total Female Population of Fulton County is 6,092.
What is the Ratio of Males per 100 Females in Fulton County?
There are 99.98 Males per 100 Females in Fulton County.
What is the Ratio of Females per 100 Males in Fulton County?
There are 100.02 Females per 100 Males in Fulton County.
What is the Median Population Age in Fulton County?
Median Population Age in Fulton County is 47.4 Years.
What is the Average Family Size in Fulton County
Average Family Size in Fulton County is 3.3 People.
What is the Average Household Size in Fulton County
Average Household Size in Fulton County is 2.5 People.
What is Per Capita Income in Fulton County?
Per Capita income in Fulton County is $22,895.
What is the Median Family Income in Fulton County?
Median Family Income in Fulton County is $50,833.
What is the Median Household income in Fulton County?
Median Household Income in Fulton County is $38,917.
What is Income or Wage Gap in Fulton County?
Income or Wage Gap in Fulton County is 29.8%.
Women in Fulton County earn 70.2 cents for every dollar earned by a man.
What is Family Income Deficit in Fulton County?
Family Income Deficit in Fulton County is $7,633.
Families that are below poverty line in Fulton County earn $7,633 less on average than the poverty threshold level.
What is Inequality or Gini Index in Fulton County?
Inequality or Gini Index in Fulton County is 0.42.
How Large is the Labor Force in Fulton County?
There are 4,334 People in the Labor Forcein in Fulton County.
What is the Percentage of People in the Labor Force in Fulton County?
43.4% of People are in the Labor Force in Fulton County.
What is the Unemployment Rate in Fulton County?
Unemployment Rate in Fulton County is 1.7%.