Cleveland County, AR
Cleveland County Map

Cleveland County Overview
7,548
TOTAL POPULATION
3,494
MALE POPULATION
4,054
FEMALE POPULATION
86.19
MALES / 100 FEMALES
116.03
FEMALES / 100 MALES
42.5
MEDIAN AGE
3.4
AVG FAMILY SIZE
2.7
AVG HOUSEHOLD SIZE
$26,479
PER CAPITA INCOME
$72,857
AVG FAMILY INCOME
$48,913
AVG HOUSEHOLD INCOME
35.3%
WAGE / INCOME GAP [ % ]
64.7¢/ $1
WAGE / INCOME GAP [ $ ]
0.45
INEQUALITY / GINI INDEX
2,948
LABOR FORCE [ PEOPLE ]
47.8%
PERCENT IN LABOR FORCE
0.8%
UNEMPLOYMENT RATE
Cleveland County Area Codes
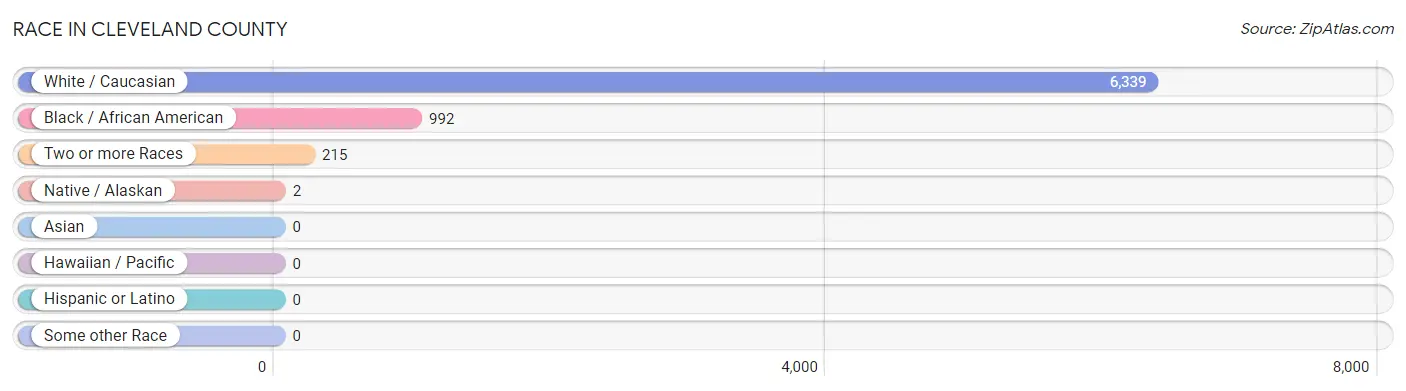
Race in Cleveland County
The most populous races in Cleveland County are White / Caucasian (6,339 | 84.0%), Black / African American (992 | 13.1%), and Two or more Races (215 | 2.9%).
| Race | # Population | % Population |
| Asian | 0 | 0.0% |
| Black / African American | 992 | 13.1% |
| Hawaiian / Pacific | 0 | 0.0% |
| Hispanic or Latino | 0 | 0.0% |
| Native / Alaskan | 2 | 0.0% |
| White / Caucasian | 6,339 | 84.0% |
| Two or more Races | 215 | 2.9% |
| Some other Race | 0 | 0.0% |
| Total | 7,548 | 100.0% |
Ancestry in Cleveland County
The most populous ancestries reported in Cleveland County are English (1,047 | 13.9%), Irish (694 | 9.2%), American (489 | 6.5%), German (446 | 5.9%), and Chickasaw (169 | 2.2%), together accounting for 37.7% of all Cleveland County residents.

| Ancestry | # Population | % Population |
| American | 489 | 6.5% |
| Cajun | 7 | 0.1% |
| Cherokee | 22 | 0.3% |
| Chickasaw | 169 | 2.2% |
| Czech | 5 | 0.1% |
| Dutch | 46 | 0.6% |
| English | 1,047 | 13.9% |
| European | 78 | 1.0% |
| French | 62 | 0.8% |
| German | 446 | 5.9% |
| Irish | 694 | 9.2% |
| Italian | 75 | 1.0% |
| Polish | 1 | 0.0% |
| Portuguese | 1 | 0.0% |
| Scandinavian | 14 | 0.2% |
| Scotch-Irish | 4 | 0.1% |
| Scottish | 36 | 0.5% |
| Sioux | 169 | 2.2% |
| Subsaharan African | 13 | 0.2% |
| Swedish | 104 | 1.4% | View All 20 Rows |
Immigrants in Cleveland County
The most numerous immigrant groups reported in Cleveland County came from Canada (14 | 0.2%), Europe (4 | 0.1%), Germany (4 | 0.1%), and Western Europe (4 | 0.1%), together accounting for 0.3% of all Cleveland County residents.

| Immigration Origin | # Population | % Population |
| Canada | 14 | 0.2% |
| Europe | 4 | 0.1% |
| Germany | 4 | 0.1% |
| Western Europe | 4 | 0.1% | View All 4 Rows |
Sex and Age in Cleveland County
Sex and Age in Cleveland County
The most populous age groups in Cleveland County are 60 to 64 Years (298 | 8.5%) for men and 35 to 39 Years (343 | 8.5%) for women.

| Age Bracket | Male | Female |
| Under 5 Years | 146 (4.2%) | 154 (3.8%) |
| 5 to 9 Years | 121 (3.5%) | 219 (5.4%) |
| 10 to 14 Years | 292 (8.4%) | 300 (7.4%) |
| 15 to 19 Years | 263 (7.5%) | 310 (7.6%) |
| 20 to 24 Years | 155 (4.4%) | 175 (4.3%) |
| 25 to 29 Years | 197 (5.6%) | 160 (4.0%) |
| 30 to 34 Years | 189 (5.4%) | 256 (6.3%) |
| 35 to 39 Years | 180 (5.1%) | 343 (8.5%) |
| 40 to 44 Years | 205 (5.9%) | 254 (6.3%) |
| 45 to 49 Years | 212 (6.1%) | 240 (5.9%) |
| 50 to 54 Years | 245 (7.0%) | 207 (5.1%) |
| 55 to 59 Years | 291 (8.3%) | 297 (7.3%) |
| 60 to 64 Years | 298 (8.5%) | 268 (6.6%) |
| 65 to 69 Years | 184 (5.3%) | 262 (6.5%) |
| 70 to 74 Years | 247 (7.1%) | 245 (6.0%) |
| 75 to 79 Years | 95 (2.7%) | 113 (2.8%) |
| 80 to 84 Years | 70 (2.0%) | 110 (2.7%) |
| 85 Years and over | 104 (3.0%) | 141 (3.5%) |
| Total | 3,494 (100.0%) | 4,054 (100.0%) |
Families and Households in Cleveland County
Median Family Size in Cleveland County
The median family size in Cleveland County is 3.38 persons per family, with single male/father families (122 | 6.4%) accounting for the largest median family size of 4.22 persons per family. On the other hand, married-couple families (1,452 | 75.9%) represent the smallest median family size with 3.13 persons per family.

| Family Type | # Families | Family Size |
| Married-Couple | 1,452 (75.9%) | 3.13 |
| Single Male/Father | 122 (6.4%) | 4.22 |
| Single Female/Mother | 340 (17.8%) | 4.12 |
| Total Families | 1,914 (100.0%) | 3.38 |
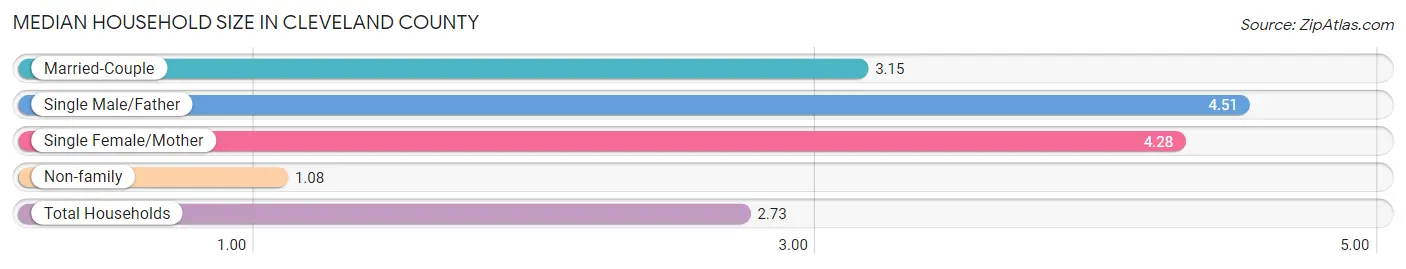
Median Household Size in Cleveland County
The median household size in Cleveland County is 2.73 persons per household, with single male/father households (122 | 4.4%) accounting for the largest median household size of 4.51 persons per household. non-family households (828 | 30.2%) represent the smallest median household size with 1.08 persons per household.
| Household Type | # Households | Household Size |
| Married-Couple | 1,452 (52.9%) | 3.15 |
| Single Male/Father | 122 (4.4%) | 4.51 |
| Single Female/Mother | 340 (12.4%) | 4.28 |
| Non-family | 828 (30.2%) | 1.08 |
| Total Households | 2,742 (100.0%) | 2.73 |
Household Size by Marriage Status in Cleveland County
Out of a total of 2,742 households in Cleveland County, 1,914 (69.8%) are family households, while 828 (30.2%) are nonfamily households. The most numerous type of family households are 2-person households, comprising 976, and the most common type of nonfamily households are 1-person households, comprising 781.

| Household Size | Family Households | Nonfamily Households |
| 1-Person Households | - | 781 (28.5%) |
| 2-Person Households | 976 (35.6%) | 47 (1.7%) |
| 3-Person Households | 471 (17.2%) | 0 (0.0%) |
| 4-Person Households | 282 (10.3%) | 0 (0.0%) |
| 5-Person Households | 145 (5.3%) | 0 (0.0%) |
| 6-Person Households | 34 (1.2%) | 0 (0.0%) |
| 7+ Person Households | 6 (0.2%) | 0 (0.0%) |
| Total | 1,914 (69.8%) | 828 (30.2%) |
Female Fertility in Cleveland County
Fertility by Age in Cleveland County
Average fertility rate in Cleveland County is 32.0 births per 1,000 women. Women in the age bracket of 20 to 34 years have the highest fertility rate with 88.0 births per 1,000 women. Women in the age bracket of 20 to 34 years acount for 89.7% of all women with births.

| Age Bracket | Women with Births | Births / 1,000 Women |
| 15 to 19 years | 5 (8.6%) | 16.0 |
| 20 to 34 years | 52 (89.7%) | 88.0 |
| 35 to 50 years | 1 (1.7%) | 1.0 |
| Total | 58 (100.0%) | 32.0 |
Fertility by Age by Marriage Status in Cleveland County
19.0% of women with births (58) in Cleveland County are married. The highest percentage of unmarried women with births falls into 15 to 19 years age bracket with 100.0% of them unmarried at the time of birth, while the lowest percentage of unmarried women with births belong to 20 to 34 years age bracket with 78.8% of them unmarried.

| Age Bracket | Married | Unmarried |
| 15 to 19 years | 0 (0.0%) | 5 (100.0%) |
| 20 to 34 years | 11 (21.1%) | 41 (78.8%) |
| 35 to 50 years | 0 (0.0%) | 1 (100.0%) |
| Total | 11 (19.0%) | 47 (81.0%) |
Fertility by Education in Cleveland County

| Educational Attainment | Women with Births | Births / 1,000 Women |
| Less than High School | 3 (5.2%) | 12.0 |
| High School Diploma | 17 (29.3%) | 38.0 |
| College or Associate's Degree | 37 (63.8%) | 49.0 |
| Bachelor's Degree | 1 (1.7%) | 7.0 |
| Graduate Degree | 0 (0.0%) | 0.0 |
| Total | 58 (100.0%) | 32.0 |
Fertility by Education by Marriage Status in Cleveland County
81.0% of women with births in Cleveland County are unmarried. Women with the educational attainment of high school diploma are most likely to be married with 52.9% of them married at childbirth, while women with the educational attainment of less than high school are least likely to be married with 100.0% of them unmarried at childbirth.

| Educational Attainment | Married | Unmarried |
| Less than High School | 0 (0.0%) | 3 (100.0%) |
| High School Diploma | 9 (52.9%) | 8 (47.1%) |
| College or Associate's Degree | 2 (5.4%) | 35 (94.6%) |
| Bachelor's Degree | 0 (0.0%) | 1 (100.0%) |
| Graduate Degree | 0 (0.0%) | 0 (0.0%) |
| Total | 11 (19.0%) | 47 (81.0%) |
Income in Cleveland County
Income Overview in Cleveland County
Per Capita Income in Cleveland County is $26,479, while median incomes of families and households are $72,857 and $48,913 respectively.
| Characteristic | Number | Measure |
| Per Capita Income | 7,548 | $26,479 |
| Median Family Income | 1,914 | $72,857 |
| Mean Family Income | 1,914 | $83,172 |
| Median Household Income | 2,742 | $48,913 |
| Mean Household Income | 2,742 | $68,293 |
| Income Deficit | 1,914 | $0 |
| Wage / Income Gap (%) | 7,548 | 35.27% |
| Wage / Income Gap ($) | 7,548 | 64.73¢ per $1 |
| Gini / Inequality Index | 7,548 | 0.45 |
Earnings by Sex in Cleveland County
Average Earnings in Cleveland County are $41,558, $47,404 for men and $30,686 for women, a difference of 35.3%.

| Sex | Number | Average Earnings |
| Male | 1,459 (47.1%) | $47,404 |
| Female | 1,639 (52.9%) | $30,686 |
| Total | 3,098 (100.0%) | $41,558 |
Earnings by Sex by Income Bracket in Cleveland County
The most common earnings brackets in Cleveland County are $100,000+ for men (213 | 14.6%) and $40,000 to $44,999 for women (186 | 11.4%).

| Income | Male | Female |
| $2,499 or less | 68 (4.7%) | 113 (6.9%) |
| $2,500 to $4,999 | 12 (0.8%) | 39 (2.4%) |
| $5,000 to $7,499 | 38 (2.6%) | 15 (0.9%) |
| $7,500 to $9,999 | 6 (0.4%) | 17 (1.0%) |
| $10,000 to $12,499 | 23 (1.6%) | 171 (10.4%) |
| $12,500 to $14,999 | 12 (0.8%) | 162 (9.9%) |
| $15,000 to $17,499 | 3 (0.2%) | 86 (5.2%) |
| $17,500 to $19,999 | 0 (0.0%) | 19 (1.2%) |
| $20,000 to $22,499 | 66 (4.5%) | 23 (1.4%) |
| $22,500 to $24,999 | 29 (2.0%) | 87 (5.3%) |
| $25,000 to $29,999 | 44 (3.0%) | 65 (4.0%) |
| $30,000 to $34,999 | 56 (3.8%) | 90 (5.5%) |
| $35,000 to $39,999 | 113 (7.7%) | 48 (2.9%) |
| $40,000 to $44,999 | 197 (13.5%) | 186 (11.4%) |
| $45,000 to $49,999 | 125 (8.6%) | 103 (6.3%) |
| $50,000 to $54,999 | 39 (2.7%) | 114 (7.0%) |
| $55,000 to $64,999 | 146 (10.0%) | 185 (11.3%) |
| $65,000 to $74,999 | 83 (5.7%) | 14 (0.9%) |
| $75,000 to $99,999 | 186 (12.8%) | 58 (3.5%) |
| $100,000+ | 213 (14.6%) | 44 (2.7%) |
| Total | 1,459 (100.0%) | 1,639 (100.0%) |
Earnings by Sex by Educational Attainment in Cleveland County
Average earnings in Cleveland County are $53,397 for men and $36,458 for women, a difference of 31.7%. Men with an educational attainment of graduate degree enjoy the highest average annual earnings of $85,313, while those with high school diploma education earn the least with $42,015. Women with an educational attainment of graduate degree earn the most with the average annual earnings of $56,061, while those with college or associate's degree education have the smallest earnings of $22,895.

| Educational Attainment | Male Income | Female Income |
| Less than High School | - | - |
| High School Diploma | $42,015 | $23,398 |
| College or Associate's Degree | $66,500 | $22,895 |
| Bachelor's Degree | $83,438 | $46,948 |
| Graduate Degree | $85,313 | $56,061 |
| Total | $53,397 | $36,458 |
Family Income in Cleveland County
Family Income Brackets in Cleveland County
According to the Cleveland County family income data, there are 415 families falling into the $100,000 to $149,999 income range, which is the most common income bracket and makes up 21.7% of all families. Conversely, the less than $10,000 income bracket is the least frequent group with only 27 families (1.4%) belonging to this category.

| Income Bracket | # Families | % Families |
| Less than $10,000 | 27 | 1.4% |
| $10,000 to $14,999 | 88 | 4.6% |
| $15,000 to $24,999 | 96 | 5.0% |
| $25,000 to $34,999 | 270 | 14.1% |
| $35,000 to $49,999 | 226 | 11.8% |
| $50,000 to $74,999 | 258 | 13.5% |
| $75,000 to $99,999 | 308 | 16.1% |
| $100,000 to $149,999 | 415 | 21.7% |
| $150,000 to $199,999 | 153 | 8.0% |
| $200,000+ | 75 | 3.9% |
Family Income by Famaliy Size in Cleveland County
5-person families (151 | 7.9%) account for the highest median family income in Cleveland County with $100,320 per family, while 2-person families (1,020 | 53.3%) have the highest median income of $29,616 per family member.

| Income Bracket | # Families | Median Income |
| 2-Person Families | 1,020 (53.3%) | $59,231 |
| 3-Person Families | 440 (23.0%) | $78,235 |
| 4-Person Families | 282 (14.7%) | $100,200 |
| 5-Person Families | 151 (7.9%) | $100,320 |
| 6-Person Families | 15 (0.8%) | $0 |
| 7+ Person Families | 6 (0.3%) | $0 |
| Total | 1,914 (100.0%) | $72,857 |
Family Income by Number of Earners in Cleveland County

| Number of Earners | # Families | Median Income |
| No Earners | 491 (25.7%) | $32,486 |
| 1 Earner | 569 (29.7%) | $54,375 |
| 2 Earners | 798 (41.7%) | $105,341 |
| 3+ Earners | 56 (2.9%) | $0 |
| Total | 1,914 (100.0%) | $72,857 |
Household Income in Cleveland County
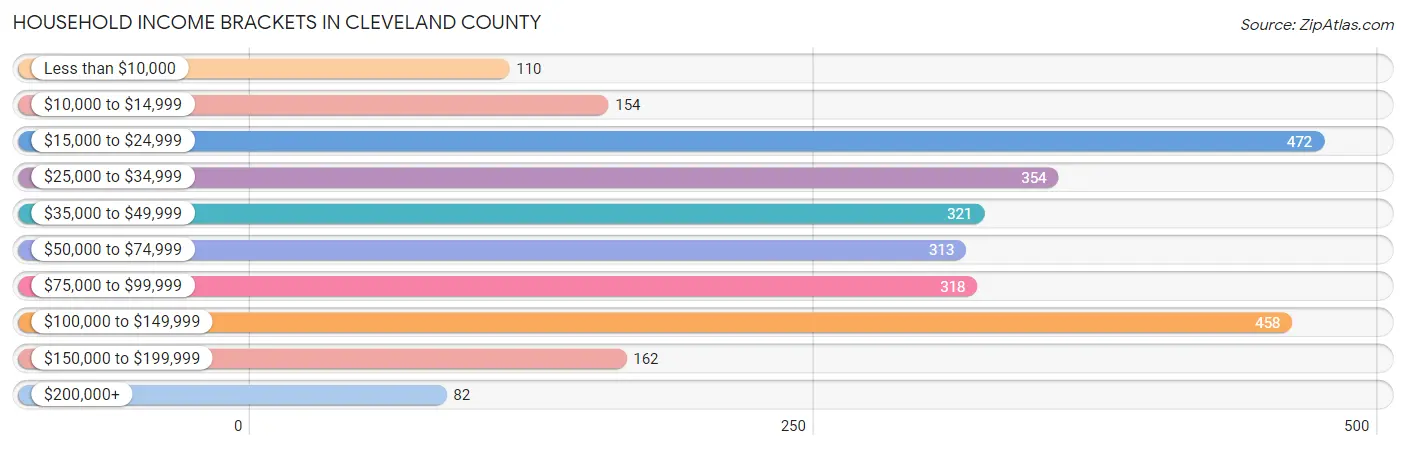
Household Income Brackets in Cleveland County
With 472 households falling in the category, the $15,000 to $24,999 income range is the most frequent in Cleveland County, accounting for 17.2% of all households. In contrast, only 82 households (3.0%) fall into the $200,000+ income bracket, making it the least populous group.
| Income Bracket | # Households | % Households |
| Less than $10,000 | 110 | 4.0% |
| $10,000 to $14,999 | 154 | 5.6% |
| $15,000 to $24,999 | 472 | 17.2% |
| $25,000 to $34,999 | 354 | 12.9% |
| $35,000 to $49,999 | 321 | 11.7% |
| $50,000 to $74,999 | 313 | 11.4% |
| $75,000 to $99,999 | 318 | 11.6% |
| $100,000 to $149,999 | 458 | 16.7% |
| $150,000 to $199,999 | 162 | 5.9% |
| $200,000+ | 82 | 3.0% |
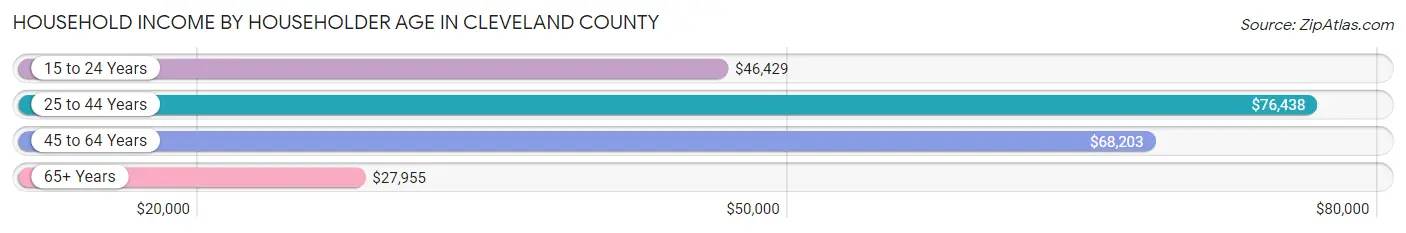
Household Income by Householder Age in Cleveland County
The median household income in Cleveland County is $48,913, with the highest median household income of $76,438 found in the 25 to 44 years age bracket for the primary householder. A total of 649 households (23.7%) fall into this category. Meanwhile, the 65+ years age bracket for the primary householder has the lowest median household income of $27,955, with 916 households (33.4%) in this group.
| Income Bracket | # Households | Median Income |
| 15 to 24 Years | 36 (1.3%) | $46,429 |
| 25 to 44 Years | 649 (23.7%) | $76,438 |
| 45 to 64 Years | 1,141 (41.6%) | $68,203 |
| 65+ Years | 916 (33.4%) | $27,955 |
| Total | 2,742 (100.0%) | $48,913 |
Poverty in Cleveland County
Income Below Poverty by Sex and Age in Cleveland County
With 10.9% poverty level for males and 15.9% for females among the residents of Cleveland County, 15 year old males and 16 and 17 year old females are the most vulnerable to poverty, with 36 males (58.1%) and 54 females (67.5%) in their respective age groups living below the poverty level.

| Age Bracket | Male | Female |
| Under 5 Years | 47 (32.2%) | 1 (0.6%) |
| 5 Years | 0 (0.0%) | 0 (0.0%) |
| 6 to 11 Years | 14 (7.0%) | 81 (26.4%) |
| 12 to 14 Years | 15 (7.5%) | 81 (38.6%) |
| 15 Years | 36 (58.1%) | 0 (0.0%) |
| 16 and 17 Years | 1 (1.1%) | 54 (67.5%) |
| 18 to 24 Years | 89 (34.1%) | 9 (2.8%) |
| 25 to 34 Years | 15 (3.9%) | 107 (25.7%) |
| 35 to 44 Years | 66 (17.1%) | 93 (15.6%) |
| 45 to 54 Years | 33 (7.2%) | 43 (9.6%) |
| 55 to 64 Years | 34 (5.8%) | 91 (16.1%) |
| 65 to 74 Years | 24 (5.8%) | 56 (11.2%) |
| 75 Years and over | 6 (2.2%) | 17 (5.5%) |
| Total | 380 (10.9%) | 633 (15.9%) |
Income Above Poverty by Sex and Age in Cleveland County
According to the poverty statistics in Cleveland County, males aged 5 years and females aged 15 years are the age groups that are most secure financially, with 100.0% of males and 100.0% of females in these age groups living above the poverty line.

| Age Bracket | Male | Female |
| Under 5 Years | 99 (67.8%) | 153 (99.4%) |
| 5 Years | 14 (100.0%) | 0 (0.0%) |
| 6 to 11 Years | 185 (93.0%) | 226 (73.6%) |
| 12 to 14 Years | 185 (92.5%) | 129 (61.4%) |
| 15 Years | 26 (41.9%) | 87 (100.0%) |
| 16 and 17 Years | 94 (99.0%) | 26 (32.5%) |
| 18 to 24 Years | 172 (65.9%) | 309 (97.2%) |
| 25 to 34 Years | 371 (96.1%) | 309 (74.3%) |
| 35 to 44 Years | 319 (82.9%) | 504 (84.4%) |
| 45 to 54 Years | 424 (92.8%) | 404 (90.4%) |
| 55 to 64 Years | 555 (94.2%) | 474 (83.9%) |
| 65 to 74 Years | 391 (94.2%) | 446 (88.8%) |
| 75 Years and over | 263 (97.8%) | 294 (94.5%) |
| Total | 3,098 (89.1%) | 3,361 (84.2%) |
Income Below Poverty Among Married-Couple Families in Cleveland County
The poverty statistics for married-couple families in Cleveland County show that 1.6% or 23 of the total 1,452 families live below the poverty line. Families with no children have the highest poverty rate of 2.3%, comprising of 21 families. On the other hand, families with 3 or 4 children have the lowest poverty rate of 0.0%, which includes 0 families.

| Children | Above Poverty | Below Poverty |
| No Children | 896 (97.7%) | 21 (2.3%) |
| 1 or 2 Children | 395 (99.5%) | 2 (0.5%) |
| 3 or 4 Children | 138 (100.0%) | 0 (0.0%) |
| 5 or more Children | 0 (0.0%) | 0 (0.0%) |
| Total | 1,429 (98.4%) | 23 (1.6%) |
Income Below Poverty Among Single-Parent Households in Cleveland County
According to the poverty data in Cleveland County, 6.6% or 8 single-father households and 40.3% or 137 single-mother households are living below the poverty line. Among single-father households, those with 1 or 2 children have the highest poverty rate, with 5 households (8.8%) experiencing poverty. Likewise, among single-mother households, those with 3 or 4 children have the highest poverty rate, with 35 households (97.2%) falling below the poverty line.

| Children | Single Father | Single Mother |
| No Children | 3 (4.6%) | 21 (17.8%) |
| 1 or 2 Children | 5 (8.8%) | 81 (43.5%) |
| 3 or 4 Children | 0 (0.0%) | 35 (97.2%) |
| 5 or more Children | 0 (0.0%) | 0 (0.0%) |
| Total | 8 (6.6%) | 137 (40.3%) |
Income Below Poverty Among Married-Couple vs Single-Parent Households in Cleveland County
The poverty data for Cleveland County shows that 23 of the married-couple family households (1.6%) and 145 of the single-parent households (31.4%) are living below the poverty level. Within the married-couple family households, those with no children have the highest poverty rate, with 21 households (2.3%) falling below the poverty line. Among the single-parent households, those with 3 or 4 children have the highest poverty rate, with 35 household (97.2%) living below poverty.

| Children | Married-Couple Families | Single-Parent Households |
| No Children | 21 (2.3%) | 24 (13.1%) |
| 1 or 2 Children | 2 (0.5%) | 86 (35.4%) |
| 3 or 4 Children | 0 (0.0%) | 35 (97.2%) |
| 5 or more Children | 0 (0.0%) | 0 (0.0%) |
| Total | 23 (1.6%) | 145 (31.4%) |
Employment Characteristics in Cleveland County
Employment by Class of Employer in Cleveland County
Among the 2,886 employed individuals in Cleveland County, private company employees (1,846 | 64.0%), state government employees (372 | 12.9%), and self-employed (not incorporated) (191 | 6.6%) make up the most common classes of employment.

| Employer Class | # Employees | % Employees |
| Private Company Employees | 1,846 | 64.0% |
| Self-Employed (Incorporated) | 101 | 3.5% |
| Self-Employed (Not Incorporated) | 191 | 6.6% |
| Not-for-profit Organizations | 123 | 4.3% |
| Local Government Employees | 186 | 6.4% |
| State Government Employees | 372 | 12.9% |
| Federal Government Employees | 67 | 2.3% |
| Unpaid Family Workers | 0 | 0.0% |
| Total | 2,886 | 100.0% |
Employment Status by Age in Cleveland County
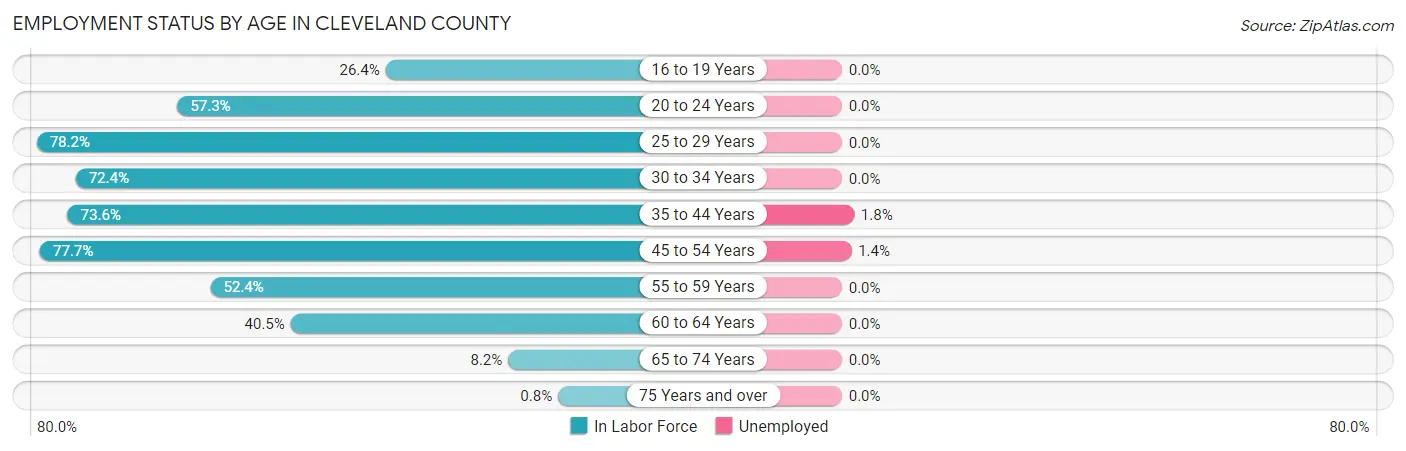
According to the labor force statistics for Cleveland County, out of the total population over 16 years of age (6,167), 47.8% or 2,948 individuals are in the labor force, with 0.8% or 24 of them unemployed. The age group with the highest labor force participation rate is 25 to 29 years, with 78.2% or 279 individuals in the labor force. Within the labor force, the 35 to 44 years age range has the highest percentage of unemployed individuals, with 1.8% or 13 of them being unemployed.
| Age Bracket | In Labor Force | Unemployed |
| 16 to 19 Years | 112 (26.4%) | 0 (0.0%) |
| 20 to 24 Years | 189 (57.3%) | 0 (0.0%) |
| 25 to 29 Years | 279 (78.2%) | 0 (0.0%) |
| 30 to 34 Years | 322 (72.4%) | 0 (0.0%) |
| 35 to 44 Years | 723 (73.6%) | 13 (1.8%) |
| 45 to 54 Years | 702 (77.7%) | 10 (1.4%) |
| 55 to 59 Years | 308 (52.4%) | 0 (0.0%) |
| 60 to 64 Years | 229 (40.5%) | 0 (0.0%) |
| 65 to 74 Years | 77 (8.2%) | 0 (0.0%) |
| 75 Years and over | 5 (0.8%) | 0 (0.0%) |
| Total | 2,948 (47.8%) | 24 (0.8%) |
Employment Status by Educational Attainment in Cleveland County
According to labor force statistics for Cleveland County, 66.7% of individuals (2,563) out of the total population between 25 and 64 years of age (3,842) are in the labor force, with 0.9% or 23 of them being unemployed. The group with the highest labor force participation rate are those with the educational attainment of bachelor's degree or higher, with 79.5% or 558 individuals in the labor force. Within the labor force, individuals with less than high school education have the highest percentage of unemployment, with 5.2% or 3 of them being unemployed.

| Educational Attainment | In Labor Force | Unemployed |
| Less than High School | 58 (20.5%) | 15 (5.2%) |
| High School Diploma | 988 (63.4%) | 31 (2.0%) |
| College / Associate Degree | 959 (73.9%) | 0 (0.0%) |
| Bachelor's Degree or higher | 558 (79.5%) | 0 (0.0%) |
| Total | 2,563 (66.7%) | 35 (0.9%) |
Employment Occupations by Sex in Cleveland County
Management, Business, Science and Arts Occupations
The most common Management, Business, Science and Arts occupations in Cleveland County are Community & Social Service (373 | 12.8%), Health Diagnosing & Treating (324 | 11.1%), Education Instruction & Library (317 | 10.8%), Management (233 | 8.0%), and Health Technologists (107 | 3.7%).

Management, Business, Science and Arts Occupations by Sex
Within the Management, Business, Science and Arts occupations in Cleveland County, the most male-oriented occupations are Architecture & Engineering (100.0%), Education, Arts & Media (92.2%), and Computers, Engineering & Science (64.4%), while the most female-oriented occupations are Arts, Media & Entertainment (100.0%), Education Instruction & Library (90.5%), and Health Diagnosing & Treating (85.5%).

| Occupation | Male | Female |
| Management | 113 (48.5%) | 120 (51.5%) |
| Business & Financial | 34 (59.7%) | 23 (40.4%) |
| Computers, Engineering & Science | 38 (64.4%) | 21 (35.6%) |
| Computers & Mathematics | 18 (46.2%) | 21 (53.8%) |
| Architecture & Engineering | 20 (100.0%) | 0 (0.0%) |
| Life, Physical & Social Science | 0 (0.0%) | 0 (0.0%) |
| Community & Social Service | 77 (20.6%) | 296 (79.4%) |
| Education, Arts & Media | 47 (92.2%) | 4 (7.8%) |
| Legal Services & Support | 0 (0.0%) | 0 (0.0%) |
| Education Instruction & Library | 30 (9.5%) | 287 (90.5%) |
| Arts, Media & Entertainment | 0 (0.0%) | 5 (100.0%) |
| Health Diagnosing & Treating | 47 (14.5%) | 277 (85.5%) |
| Health Technologists | 47 (43.9%) | 60 (56.1%) |
| Total (Category) | 309 (29.5%) | 737 (70.5%) |
| Total (Overall) | 1,432 (49.0%) | 1,491 (51.0%) |
Services Occupations
The most common Services occupations in Cleveland County are Food Preparation & Serving (104 | 3.6%), Personal Care & Service (81 | 2.8%), Security & Protection (58 | 2.0%), Law Enforcement (58 | 2.0%), and Cleaning & Maintenance (54 | 1.8%).

Services Occupations by Sex
Within the Services occupations in Cleveland County, the most male-oriented occupations are Security & Protection (58.6%), Law Enforcement (58.6%), and Cleaning & Maintenance (46.3%), while the most female-oriented occupations are Personal Care & Service (100.0%), Food Preparation & Serving (89.4%), and Healthcare Support (81.2%).

| Occupation | Male | Female |
| Healthcare Support | 3 (18.8%) | 13 (81.2%) |
| Security & Protection | 34 (58.6%) | 24 (41.4%) |
| Firefighting & Prevention | 0 (0.0%) | 0 (0.0%) |
| Law Enforcement | 34 (58.6%) | 24 (41.4%) |
| Food Preparation & Serving | 11 (10.6%) | 93 (89.4%) |
| Cleaning & Maintenance | 25 (46.3%) | 29 (53.7%) |
| Personal Care & Service | 0 (0.0%) | 81 (100.0%) |
| Total (Category) | 73 (23.3%) | 240 (76.7%) |
| Total (Overall) | 1,432 (49.0%) | 1,491 (51.0%) |
Sales and Office Occupations
The most common Sales and Office occupations in Cleveland County are Sales & Related (340 | 11.6%), and Office & Administration (208 | 7.1%).

Sales and Office Occupations by Sex

| Occupation | Male | Female |
| Sales & Related | 89 (26.2%) | 251 (73.8%) |
| Office & Administration | 49 (23.6%) | 159 (76.4%) |
| Total (Category) | 138 (25.2%) | 410 (74.8%) |
| Total (Overall) | 1,432 (49.0%) | 1,491 (51.0%) |
Natural Resources, Construction and Maintenance Occupations
The most common Natural Resources, Construction and Maintenance occupations in Cleveland County are Construction & Extraction (177 | 6.1%), Installation, Maintenance & Repair (152 | 5.2%), and Farming, Fishing & Forestry (83 | 2.8%).

Natural Resources, Construction and Maintenance Occupations by Sex

| Occupation | Male | Female |
| Farming, Fishing & Forestry | 47 (56.6%) | 36 (43.4%) |
| Construction & Extraction | 177 (100.0%) | 0 (0.0%) |
| Installation, Maintenance & Repair | 152 (100.0%) | 0 (0.0%) |
| Total (Category) | 376 (91.3%) | 36 (8.7%) |
| Total (Overall) | 1,432 (49.0%) | 1,491 (51.0%) |
Production, Transportation and Moving Occupations
The most common Production, Transportation and Moving occupations in Cleveland County are Production (390 | 13.3%), Transportation (168 | 5.8%), and Material Moving (46 | 1.6%).

Production, Transportation and Moving Occupations by Sex

| Occupation | Male | Female |
| Production | 360 (92.3%) | 30 (7.7%) |
| Transportation | 132 (78.6%) | 36 (21.4%) |
| Material Moving | 44 (95.7%) | 2 (4.3%) |
| Total (Category) | 536 (88.7%) | 68 (11.3%) |
| Total (Overall) | 1,432 (49.0%) | 1,491 (51.0%) |
Employment Industries by Sex in Cleveland County
Employment Industries in Cleveland County
The major employment industries in Cleveland County include Health Care & Social Assistance (444 | 15.2%), Manufacturing (443 | 15.2%), Educational Services (350 | 12.0%), Retail Trade (326 | 11.2%), and Agriculture, Fishing & Hunting (191 | 6.5%).

Employment Industries by Sex in Cleveland County
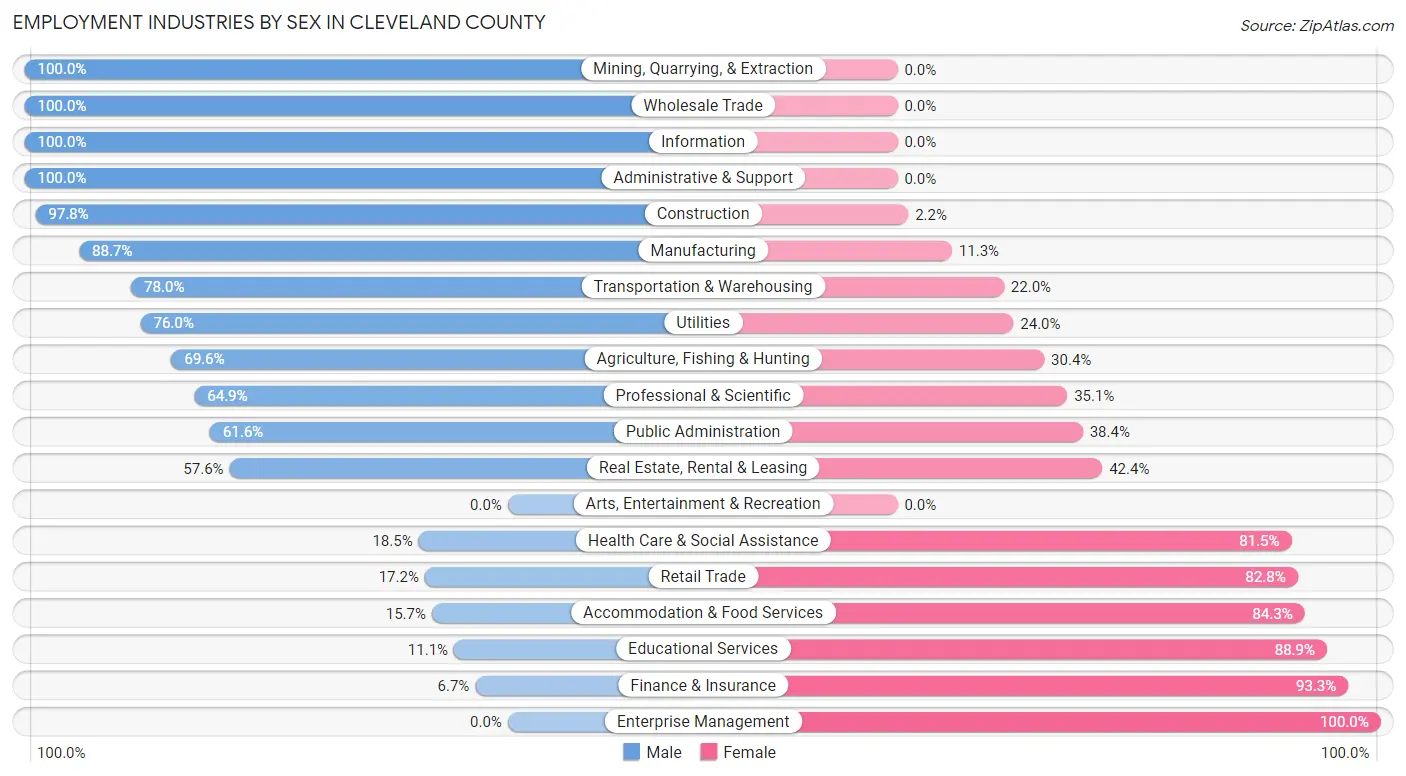
The Cleveland County industries that see more men than women are Mining, Quarrying, & Extraction (100.0%), Wholesale Trade (100.0%), and Information (100.0%), whereas the industries that tend to have a higher number of women are Enterprise Management (100.0%), Finance & Insurance (93.3%), and Educational Services (88.9%).
| Industry | Male | Female |
| Agriculture, Fishing & Hunting | 133 (69.6%) | 58 (30.4%) |
| Mining, Quarrying, & Extraction | 6 (100.0%) | 0 (0.0%) |
| Construction | 175 (97.8%) | 4 (2.2%) |
| Manufacturing | 393 (88.7%) | 50 (11.3%) |
| Wholesale Trade | 34 (100.0%) | 0 (0.0%) |
| Retail Trade | 56 (17.2%) | 270 (82.8%) |
| Transportation & Warehousing | 145 (78.0%) | 41 (22.0%) |
| Utilities | 19 (76.0%) | 6 (24.0%) |
| Information | 15 (100.0%) | 0 (0.0%) |
| Finance & Insurance | 7 (6.7%) | 97 (93.3%) |
| Real Estate, Rental & Leasing | 53 (57.6%) | 39 (42.4%) |
| Professional & Scientific | 72 (64.9%) | 39 (35.1%) |
| Enterprise Management | 0 (0.0%) | 10 (100.0%) |
| Administrative & Support | 15 (100.0%) | 0 (0.0%) |
| Educational Services | 39 (11.1%) | 311 (88.9%) |
| Health Care & Social Assistance | 82 (18.5%) | 362 (81.5%) |
| Arts, Entertainment & Recreation | 0 (0.0%) | 0 (0.0%) |
| Accommodation & Food Services | 11 (15.7%) | 59 (84.3%) |
| Public Administration | 98 (61.6%) | 61 (38.4%) |
| Total | 1,432 (49.0%) | 1,491 (51.0%) |
Education in Cleveland County
School Enrollment in Cleveland County
The most common levels of schooling among the 1,838 students in Cleveland County are high school (489 | 26.6%), middle school (457 | 24.9%), and college / undergraduate (346 | 18.8%).

| School Level | # Students | % Students |
| Nursery / Preschool | 85 | 4.6% |
| Kindergarten | 22 | 1.2% |
| Elementary School | 334 | 18.2% |
| Middle School | 457 | 24.9% |
| High School | 489 | 26.6% |
| College / Undergraduate | 346 | 18.8% |
| Graduate / Professional | 105 | 5.7% |
| Total | 1,838 | 100.0% |
School Enrollment by Age by Funding Source in Cleveland County
Out of a total of 1,838 students who are enrolled in schools in Cleveland County, 110 (6.0%) attend a private institution, while the remaining 1,728 (94.0%) are enrolled in public schools. The age group of 25 to 34 year olds has the highest likelihood of being enrolled in private schools, with 35 (30.2% in the age bracket) enrolled. Conversely, the age group of 10 to 14 year olds has the lowest likelihood of being enrolled in a private school, with 589 (100.0% in the age bracket) attending a public institution.

| Age Bracket | Public School | Private School |
| 3 to 4 Year Olds | 61 (71.8%) | 24 (28.2%) |
| 5 to 9 Year Old | 306 (96.2%) | 12 (3.8%) |
| 10 to 14 Year Olds | 589 (100.0%) | 0 (0.0%) |
| 15 to 17 Year Olds | 310 (96.0%) | 13 (4.0%) |
| 18 to 19 Year Olds | 217 (88.9%) | 27 (11.1%) |
| 20 to 24 Year Olds | 100 (100.0%) | 0 (0.0%) |
| 25 to 34 Year Olds | 81 (69.8%) | 35 (30.2%) |
| 35 Years and over | 63 (100.0%) | 0 (0.0%) |
| Total | 1,728 (94.0%) | 110 (6.0%) |
Educational Attainment by Field of Study in Cleveland County
Education (454 | 50.7%), business (95 | 10.6%), bio, nature & agricultural (76 | 8.5%), science & technology (59 | 6.6%), and engineering (42 | 4.7%) are the most common fields of study among 895 individuals in Cleveland County who have obtained a bachelor's degree or higher.
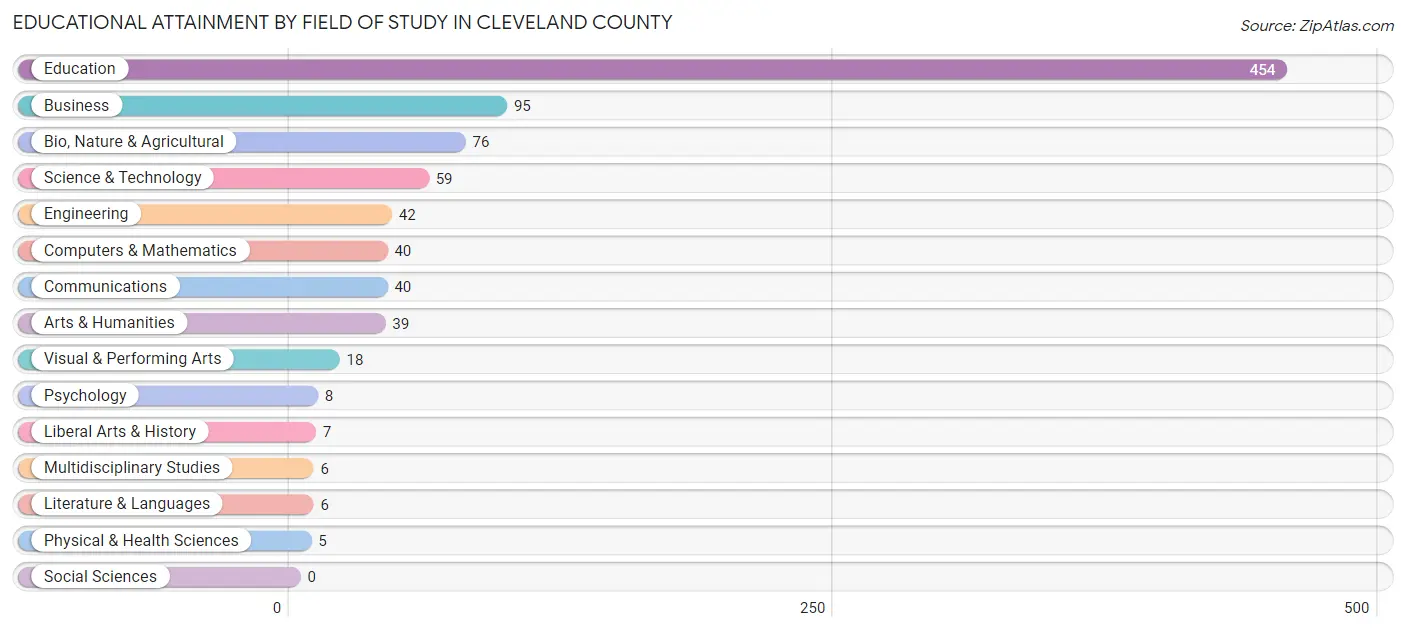
| Field of Study | # Graduates | % Graduates |
| Computers & Mathematics | 40 | 4.5% |
| Bio, Nature & Agricultural | 76 | 8.5% |
| Physical & Health Sciences | 5 | 0.6% |
| Psychology | 8 | 0.9% |
| Social Sciences | 0 | 0.0% |
| Engineering | 42 | 4.7% |
| Multidisciplinary Studies | 6 | 0.7% |
| Science & Technology | 59 | 6.6% |
| Business | 95 | 10.6% |
| Education | 454 | 50.7% |
| Literature & Languages | 6 | 0.7% |
| Liberal Arts & History | 7 | 0.8% |
| Visual & Performing Arts | 18 | 2.0% |
| Communications | 40 | 4.5% |
| Arts & Humanities | 39 | 4.4% |
| Total | 895 | 100.0% |
Transportation & Commute in Cleveland County
Vehicle Availability by Sex in Cleveland County
The most prevalent vehicle ownership categories in Cleveland County are males with 3 vehicles (526, accounting for 37.7%) and females with 3 vehicles (411, making up 35.3%).

| Vehicles Available | Male | Female |
| No Vehicle | 0 (0.0%) | 39 (2.6%) |
| 1 Vehicle | 113 (8.1%) | 123 (8.3%) |
| 2 Vehicles | 492 (35.3%) | 649 (43.5%) |
| 3 Vehicles | 526 (37.7%) | 411 (27.6%) |
| 4 Vehicles | 211 (15.1%) | 186 (12.5%) |
| 5 or more Vehicles | 53 (3.8%) | 83 (5.6%) |
| Total | 1,395 (100.0%) | 1,491 (100.0%) |
Commute Time in Cleveland County
The most frequently occuring commute durations in Cleveland County are 20 to 24 minutes (499 commuters, 18.0%), 30 to 34 minutes (447 commuters, 16.1%), and 15 to 19 minutes (413 commuters, 14.9%).

| Commute Time | # Commuters | % Commuters |
| Less than 5 Minutes | 92 | 3.3% |
| 5 to 9 Minutes | 97 | 3.5% |
| 10 to 14 Minutes | 253 | 9.1% |
| 15 to 19 Minutes | 413 | 14.9% |
| 20 to 24 Minutes | 499 | 18.0% |
| 25 to 29 Minutes | 138 | 5.0% |
| 30 to 34 Minutes | 447 | 16.1% |
| 35 to 39 Minutes | 70 | 2.5% |
| 40 to 44 Minutes | 128 | 4.6% |
| 45 to 59 Minutes | 321 | 11.6% |
| 60 to 89 Minutes | 168 | 6.1% |
| 90 or more Minutes | 148 | 5.3% |
Commute Time by Sex in Cleveland County
The most common commute times in Cleveland County are 45 to 59 minutes (222 commuters, 16.6%) for males and 15 to 19 minutes (299 commuters, 20.8%) for females.

| Commute Time | Male | Female |
| Less than 5 Minutes | 49 (3.7%) | 43 (3.0%) |
| 5 to 9 Minutes | 55 (4.1%) | 42 (2.9%) |
| 10 to 14 Minutes | 68 (5.1%) | 185 (12.9%) |
| 15 to 19 Minutes | 114 (8.5%) | 299 (20.8%) |
| 20 to 24 Minutes | 218 (16.3%) | 281 (19.5%) |
| 25 to 29 Minutes | 45 (3.4%) | 93 (6.5%) |
| 30 to 34 Minutes | 215 (16.1%) | 232 (16.1%) |
| 35 to 39 Minutes | 28 (2.1%) | 42 (2.9%) |
| 40 to 44 Minutes | 57 (4.3%) | 71 (4.9%) |
| 45 to 59 Minutes | 222 (16.6%) | 99 (6.9%) |
| 60 to 89 Minutes | 151 (11.3%) | 17 (1.2%) |
| 90 or more Minutes | 114 (8.5%) | 34 (2.4%) |
Time of Departure to Work by Sex in Cleveland County
The most frequent times of departure to work in Cleveland County are 12:00 AM to 4:59 AM (260, 19.5%) for males and 7:00 AM to 7:29 AM (276, 19.2%) for females.

| Time of Departure | Male | Female |
| 12:00 AM to 4:59 AM | 260 (19.5%) | 15 (1.0%) |
| 5:00 AM to 5:29 AM | 98 (7.3%) | 59 (4.1%) |
| 5:30 AM to 5:59 AM | 130 (9.7%) | 17 (1.2%) |
| 6:00 AM to 6:29 AM | 63 (4.7%) | 51 (3.5%) |
| 6:30 AM to 6:59 AM | 118 (8.8%) | 242 (16.8%) |
| 7:00 AM to 7:29 AM | 167 (12.5%) | 276 (19.2%) |
| 7:30 AM to 7:59 AM | 116 (8.7%) | 262 (18.2%) |
| 8:00 AM to 8:29 AM | 78 (5.8%) | 124 (8.6%) |
| 8:30 AM to 8:59 AM | 4 (0.3%) | 43 (3.0%) |
| 9:00 AM to 9:59 AM | 62 (4.6%) | 5 (0.4%) |
| 10:00 AM to 10:59 AM | 23 (1.7%) | 0 (0.0%) |
| 11:00 AM to 11:59 AM | 0 (0.0%) | 41 (2.9%) |
| 12:00 PM to 3:59 PM | 153 (11.5%) | 52 (3.6%) |
| 4:00 PM to 11:59 PM | 64 (4.8%) | 251 (17.4%) |
| Total | 1,336 (100.0%) | 1,438 (100.0%) |
Housing Occupancy in Cleveland County
Occupancy by Ownership in Cleveland County
Of the total 2,742 dwellings in Cleveland County, owner-occupied units account for 2,292 (83.6%), while renter-occupied units make up 450 (16.4%).

| Occupancy | # Housing Units | % Housing Units |
| Owner Occupied Housing Units | 2,292 | 83.6% |
| Renter-Occupied Housing Units | 450 | 16.4% |
| Total Occupied Housing Units | 2,742 | 100.0% |
Occupancy by Household Size in Cleveland County

| Household Size | # Housing Units | % Housing Units |
| 1-Person Household | 781 | 28.5% |
| 2-Person Household | 1,023 | 37.3% |
| 3-Person Household | 471 | 17.2% |
| 4+ Person Household | 467 | 17.0% |
| Total Housing Units | 2,742 | 100.0% |
Occupancy by Ownership by Household Size in Cleveland County

| Household Size | Owner-occupied | Renter-occupied |
| 1-Person Household | 598 (76.6%) | 183 (23.4%) |
| 2-Person Household | 922 (90.1%) | 101 (9.9%) |
| 3-Person Household | 371 (78.8%) | 100 (21.2%) |
| 4+ Person Household | 401 (85.9%) | 66 (14.1%) |
| Total Housing Units | 2,292 (83.6%) | 450 (16.4%) |
Occupancy by Educational Attainment in Cleveland County

| Household Size | Owner-occupied | Renter-occupied |
| Less than High School | 155 (81.6%) | 35 (18.4%) |
| High School Diploma | 938 (81.9%) | 207 (18.1%) |
| College/Associate Degree | 775 (83.2%) | 156 (16.8%) |
| Bachelor's Degree or higher | 424 (89.1%) | 52 (10.9%) |
Occupancy by Age of Householder in Cleveland County
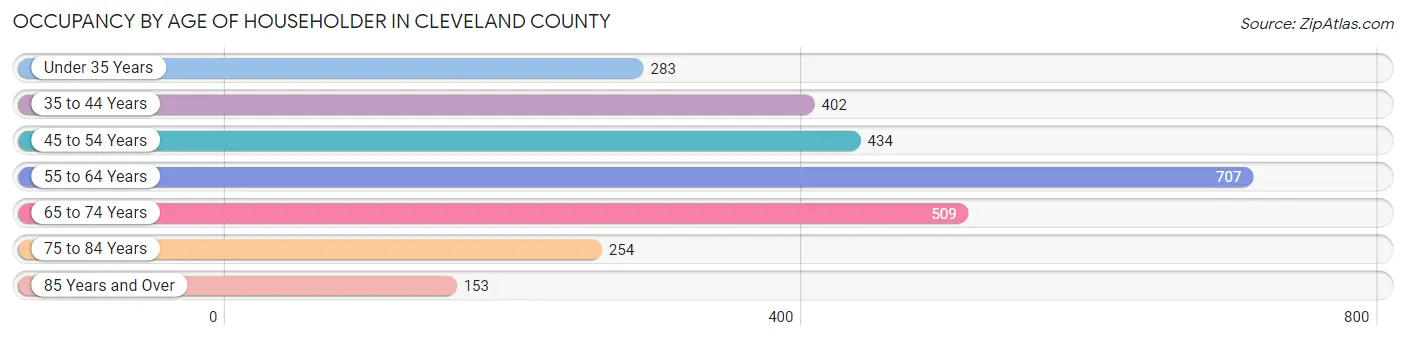
| Age Bracket | # Households | % Households |
| Under 35 Years | 283 | 10.3% |
| 35 to 44 Years | 402 | 14.7% |
| 45 to 54 Years | 434 | 15.8% |
| 55 to 64 Years | 707 | 25.8% |
| 65 to 74 Years | 509 | 18.6% |
| 75 to 84 Years | 254 | 9.3% |
| 85 Years and Over | 153 | 5.6% |
| Total | 2,742 | 100.0% |
Housing Finances in Cleveland County
Median Income by Occupancy in Cleveland County
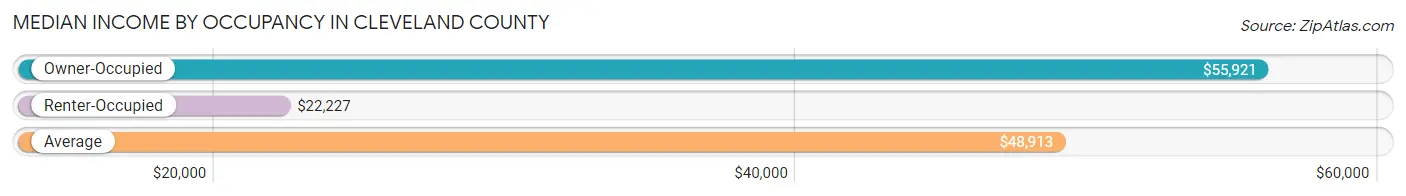
| Occupancy Type | # Households | Median Income |
| Owner-Occupied | 2,292 (83.6%) | $55,921 |
| Renter-Occupied | 450 (16.4%) | $22,227 |
| Average | 2,742 (100.0%) | $48,913 |
Occupancy by Householder Income Bracket in Cleveland County

| Income Bracket | Owner-occupied | Renter-occupied |
| Less than $5,000 | 63 (2.8%) | 42 (9.3%) |
| $5,000 to $9,999 | 6 (0.3%) | 0 (0.0%) |
| $10,000 to $14,999 | 83 (3.6%) | 71 (15.8%) |
| $15,000 to $19,999 | 204 (8.9%) | 63 (14.0%) |
| $20,000 to $24,999 | 146 (6.4%) | 59 (13.1%) |
| $25,000 to $34,999 | 290 (12.7%) | 64 (14.2%) |
| $35,000 to $49,999 | 273 (11.9%) | 47 (10.4%) |
| $50,000 to $74,999 | 274 (11.9%) | 38 (8.4%) |
| $75,000 to $99,999 | 287 (12.5%) | 32 (7.1%) |
| $100,000 to $149,999 | 428 (18.7%) | 29 (6.4%) |
| $150,000 or more | 238 (10.4%) | 5 (1.1%) |
| Total | 2,292 (100.0%) | 450 (100.0%) |
Monthly Housing Cost Tiers in Cleveland County
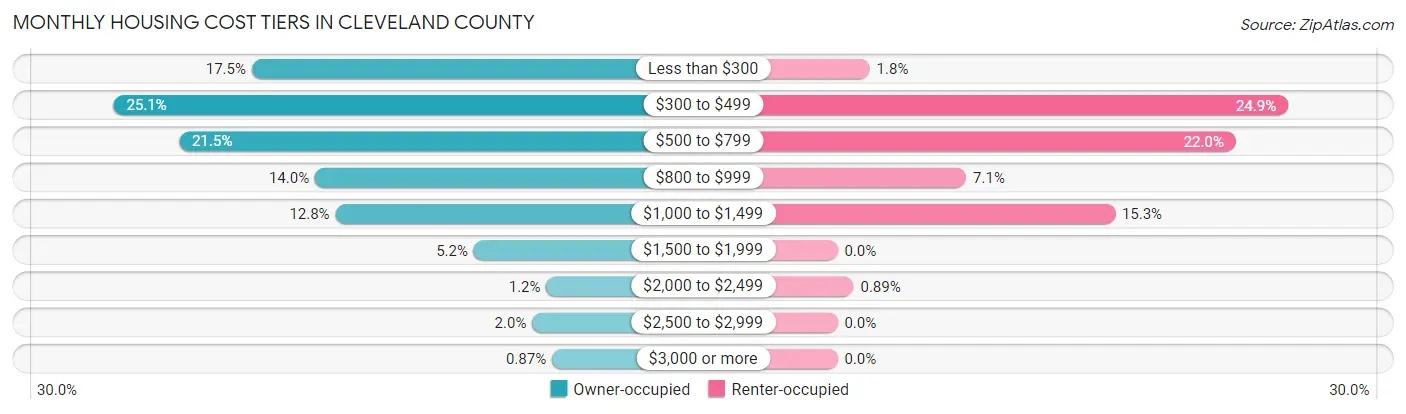
| Monthly Cost | Owner-occupied | Renter-occupied |
| Less than $300 | 400 (17.4%) | 8 (1.8%) |
| $300 to $499 | 575 (25.1%) | 112 (24.9%) |
| $500 to $799 | 492 (21.5%) | 99 (22.0%) |
| $800 to $999 | 320 (14.0%) | 32 (7.1%) |
| $1,000 to $1,499 | 294 (12.8%) | 69 (15.3%) |
| $1,500 to $1,999 | 119 (5.2%) | 0 (0.0%) |
| $2,000 to $2,499 | 27 (1.2%) | 4 (0.9%) |
| $2,500 to $2,999 | 45 (2.0%) | 0 (0.0%) |
| $3,000 or more | 20 (0.9%) | 0 (0.0%) |
| Total | 2,292 (100.0%) | 450 (100.0%) |
Physical Housing Characteristics in Cleveland County
Housing Structures in Cleveland County

| Structure Type | # Housing Units | % Housing Units |
| Single Unit, Detached | 2,018 | 73.6% |
| Single Unit, Attached | 0 | 0.0% |
| 2 Unit Apartments | 13 | 0.5% |
| 3 or 4 Unit Apartments | 39 | 1.4% |
| 5 to 9 Unit Apartments | 5 | 0.2% |
| 10 or more Apartments | 3 | 0.1% |
| Mobile Home / Other | 664 | 24.2% |
| Total | 2,742 | 100.0% |
Housing Structures by Occupancy in Cleveland County

| Structure Type | Owner-occupied | Renter-occupied |
| Single Unit, Detached | 1,663 (82.4%) | 355 (17.6%) |
| Single Unit, Attached | 0 (0.0%) | 0 (0.0%) |
| 2 Unit Apartments | 0 (0.0%) | 13 (100.0%) |
| 3 or 4 Unit Apartments | 0 (0.0%) | 39 (100.0%) |
| 5 to 9 Unit Apartments | 0 (0.0%) | 5 (100.0%) |
| 10 or more Apartments | 0 (0.0%) | 3 (100.0%) |
| Mobile Home / Other | 629 (94.7%) | 35 (5.3%) |
| Total | 2,292 (83.6%) | 450 (16.4%) |
Housing Structures by Number of Rooms in Cleveland County
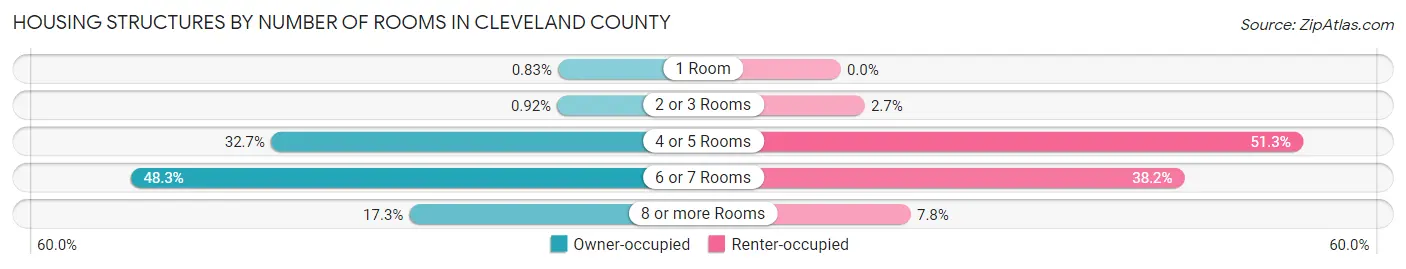
| Number of Rooms | Owner-occupied | Renter-occupied |
| 1 Room | 19 (0.8%) | 0 (0.0%) |
| 2 or 3 Rooms | 21 (0.9%) | 12 (2.7%) |
| 4 or 5 Rooms | 749 (32.7%) | 231 (51.3%) |
| 6 or 7 Rooms | 1,106 (48.2%) | 172 (38.2%) |
| 8 or more Rooms | 397 (17.3%) | 35 (7.8%) |
| Total | 2,292 (100.0%) | 450 (100.0%) |
Housing Structure by Heating Type in Cleveland County

| Heating Type | Owner-occupied | Renter-occupied |
| Utility Gas | 274 (11.9%) | 149 (33.1%) |
| Bottled, Tank, or LP Gas | 470 (20.5%) | 112 (24.9%) |
| Electricity | 1,438 (62.7%) | 149 (33.1%) |
| Fuel Oil or Kerosene | 0 (0.0%) | 0 (0.0%) |
| Coal or Coke | 0 (0.0%) | 0 (0.0%) |
| All other Fuels | 105 (4.6%) | 40 (8.9%) |
| No Fuel Used | 5 (0.2%) | 0 (0.0%) |
| Total | 2,292 (100.0%) | 450 (100.0%) |
Household Vehicle Usage in Cleveland County

| Vehicles per Household | Owner-occupied | Renter-occupied |
| No Vehicle | 63 (2.8%) | 128 (28.4%) |
| 1 Vehicle | 432 (18.9%) | 175 (38.9%) |
| 2 Vehicles | 847 (36.9%) | 110 (24.4%) |
| 3 or more Vehicles | 950 (41.4%) | 37 (8.2%) |
| Total | 2,292 (100.0%) | 450 (100.0%) |
Real Estate & Mortgages in Cleveland County
Real Estate and Mortgage Overview in Cleveland County
| Characteristic | Without Mortgage | With Mortgage |
| Housing Units | 1,421 | 871 |
| Median Property Value | $88,700 | $139,900 |
| Median Household Income | $41,771 | $154 |
| Monthly Housing Costs | $396 | $20 |
| Real Estate Taxes | $647 | $64 |
Property Value by Mortgage Status in Cleveland County

| Property Value | Without Mortgage | With Mortgage |
| Less than $50,000 | 414 (29.1%) | 53 (6.1%) |
| $50,000 to $99,999 | 350 (24.6%) | 220 (25.3%) |
| $100,000 to $299,999 | 592 (41.7%) | 493 (56.6%) |
| $300,000 to $499,999 | 39 (2.7%) | 102 (11.7%) |
| $500,000 to $749,999 | 7 (0.5%) | 3 (0.3%) |
| $750,000 to $999,999 | 0 (0.0%) | 0 (0.0%) |
| $1,000,000 or more | 19 (1.3%) | 0 (0.0%) |
| Total | 1,421 (100.0%) | 871 (100.0%) |
Household Income by Mortgage Status in Cleveland County
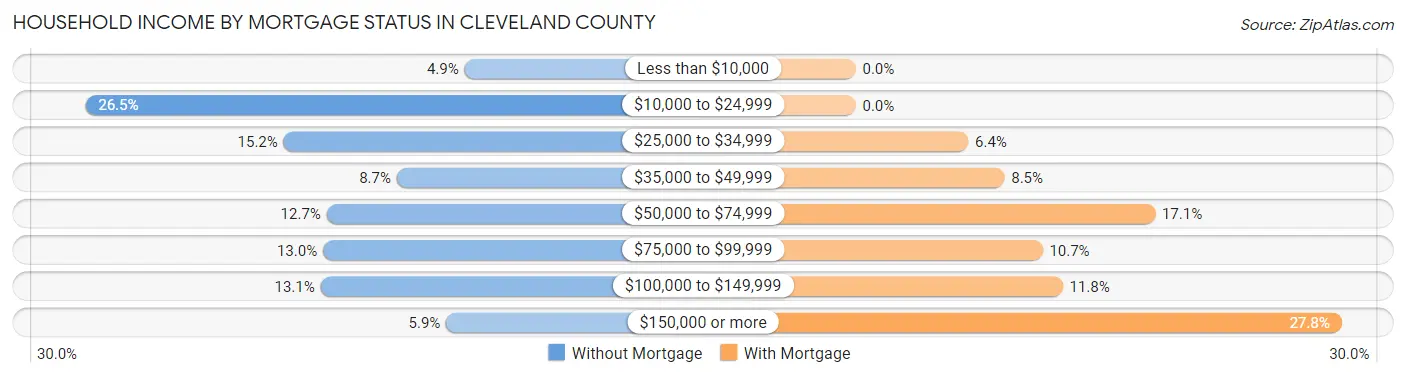
| Household Income | Without Mortgage | With Mortgage |
| Less than $10,000 | 69 (4.9%) | 0 (0.0%) |
| $10,000 to $24,999 | 377 (26.5%) | 0 (0.0%) |
| $25,000 to $34,999 | 216 (15.2%) | 56 (6.4%) |
| $35,000 to $49,999 | 124 (8.7%) | 74 (8.5%) |
| $50,000 to $74,999 | 181 (12.7%) | 149 (17.1%) |
| $75,000 to $99,999 | 184 (13.0%) | 93 (10.7%) |
| $100,000 to $149,999 | 186 (13.1%) | 103 (11.8%) |
| $150,000 or more | 84 (5.9%) | 242 (27.8%) |
| Total | 1,421 (100.0%) | 871 (100.0%) |
Property Value to Household Income Ratio in Cleveland County

| Value-to-Income Ratio | Without Mortgage | With Mortgage |
| Less than 2.0x | 758 (53.3%) | 93,631 (10,749.8%) |
| 2.0x to 2.9x | 266 (18.7%) | 452 (51.9%) |
| 3.0x to 3.9x | 104 (7.3%) | 216 (24.8%) |
| 4.0x or more | 251 (17.7%) | 127 (14.6%) |
| Total | 1,421 (100.0%) | 871 (100.0%) |
Real Estate Taxes by Mortgage Status in Cleveland County
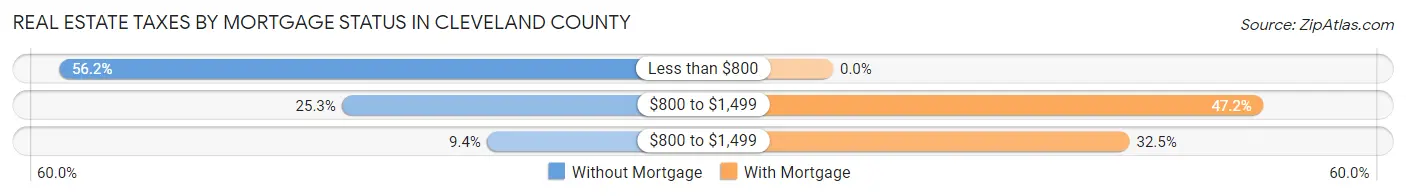
| Property Taxes | Without Mortgage | With Mortgage |
| Less than $800 | 799 (56.2%) | 0 (0.0%) |
| $800 to $1,499 | 359 (25.3%) | 411 (47.2%) |
| $800 to $1,499 | 133 (9.4%) | 283 (32.5%) |
| Total | 1,421 (100.0%) | 871 (100.0%) |
Health & Disability in Cleveland County
Health Insurance Coverage by Age in Cleveland County

| Age Bracket | With Coverage | Without Coverage |
| Under 6 Years | 314 (100.0%) | 0 (0.0%) |
| 6 to 18 Years | 1,408 (98.3%) | 24 (1.7%) |
| 19 to 25 Years | 399 (97.1%) | 12 (2.9%) |
| 26 to 34 Years | 690 (88.5%) | 90 (11.5%) |
| 35 to 44 Years | 939 (95.6%) | 43 (4.4%) |
| 45 to 54 Years | 873 (96.6%) | 31 (3.4%) |
| 55 to 64 Years | 1,089 (94.4%) | 65 (5.6%) |
| 65 to 74 Years | 917 (100.0%) | 0 (0.0%) |
| 75 Years and older | 580 (100.0%) | 0 (0.0%) |
| Total | 7,209 (96.5%) | 265 (3.5%) |
Health Insurance Coverage by Citizenship Status in Cleveland County
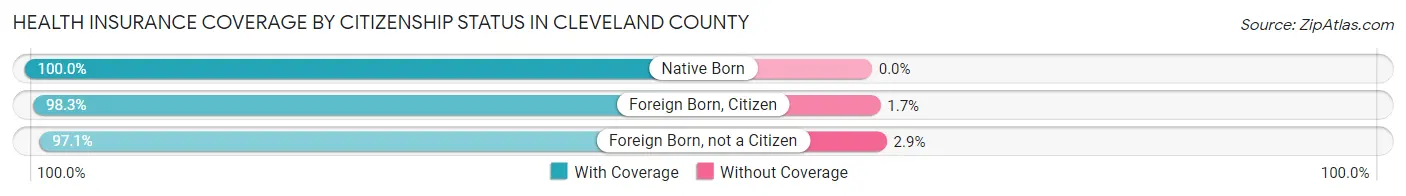
| Citizenship Status | With Coverage | Without Coverage |
| Native Born | 314 (100.0%) | 0 (0.0%) |
| Foreign Born, Citizen | 1,408 (98.3%) | 24 (1.7%) |
| Foreign Born, not a Citizen | 399 (97.1%) | 12 (2.9%) |
Health Insurance Coverage by Household Income in Cleveland County
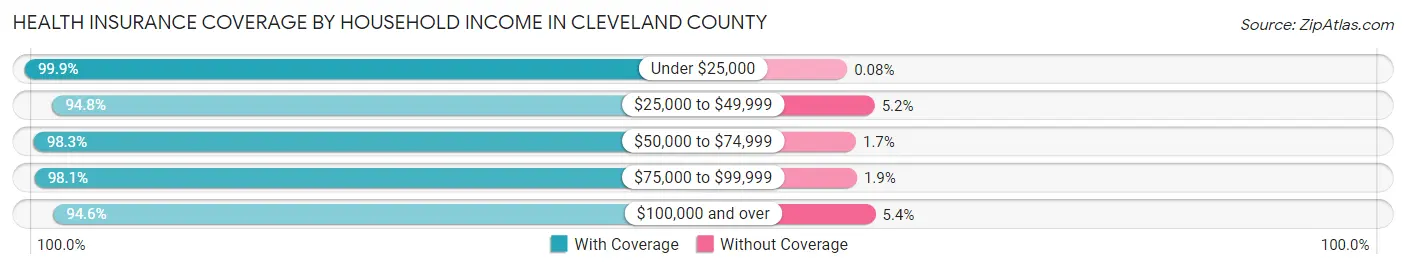
| Household Income | With Coverage | Without Coverage |
| Under $25,000 | 1,320 (99.9%) | 1 (0.1%) |
| $25,000 to $49,999 | 1,866 (94.8%) | 103 (5.2%) |
| $50,000 to $74,999 | 793 (98.3%) | 14 (1.7%) |
| $75,000 to $99,999 | 980 (98.1%) | 19 (1.9%) |
| $100,000 and over | 2,250 (94.6%) | 128 (5.4%) |
Public vs Private Health Insurance Coverage by Age in Cleveland County

| Age Bracket | Public Insurance | Private Insurance |
| Under 6 | 193 (61.5%) | 121 (38.5%) |
| 6 to 18 Years | 745 (52.0%) | 708 (49.4%) |
| 19 to 25 Years | 193 (47.0%) | 247 (60.1%) |
| 25 to 34 Years | 136 (17.4%) | 596 (76.4%) |
| 35 to 44 Years | 324 (33.0%) | 652 (66.4%) |
| 45 to 54 Years | 209 (23.1%) | 694 (76.8%) |
| 55 to 64 Years | 463 (40.1%) | 747 (64.7%) |
| 65 to 74 Years | 917 (100.0%) | 364 (39.7%) |
| 75 Years and over | 580 (100.0%) | 266 (45.9%) |
| Total | 3,760 (50.3%) | 4,395 (58.8%) |
Disability Status by Sex by Age in Cleveland County
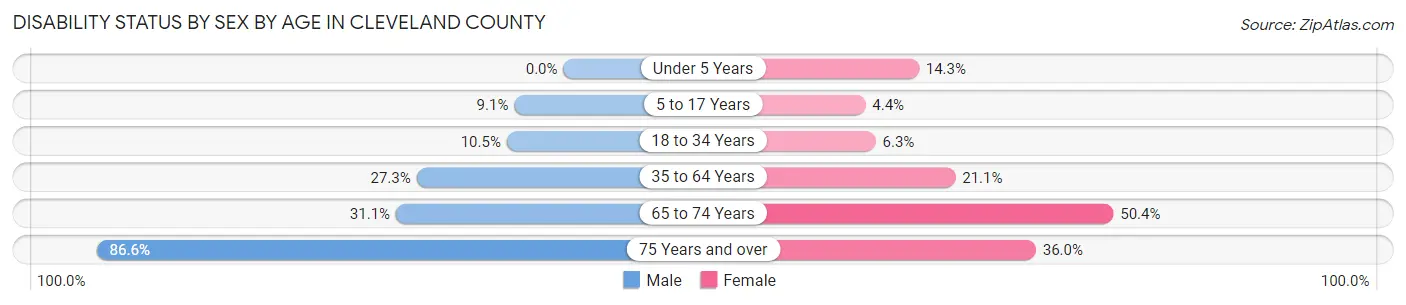
| Age Bracket | Male | Female |
| Under 5 Years | 0 (0.0%) | 22 (14.3%) |
| 5 to 17 Years | 52 (9.1%) | 30 (4.4%) |
| 18 to 34 Years | 68 (10.5%) | 46 (6.3%) |
| 35 to 64 Years | 390 (27.3%) | 339 (21.1%) |
| 65 to 74 Years | 129 (31.1%) | 253 (50.4%) |
| 75 Years and over | 233 (86.6%) | 112 (36.0%) |
Disability Class by Sex by Age in Cleveland County
Disability Class: Hearing Difficulty

| Age Bracket | Male | Female |
| Under 5 Years | 0 (0.0%) | 22 (14.3%) |
| 5 to 17 Years | 0 (0.0%) | 12 (1.8%) |
| 18 to 34 Years | 8 (1.2%) | 4 (0.5%) |
| 35 to 64 Years | 170 (11.9%) | 121 (7.5%) |
| 65 to 74 Years | 111 (26.8%) | 100 (19.9%) |
| 75 Years and over | 164 (61.0%) | 21 (6.8%) |
Disability Class: Vision Difficulty
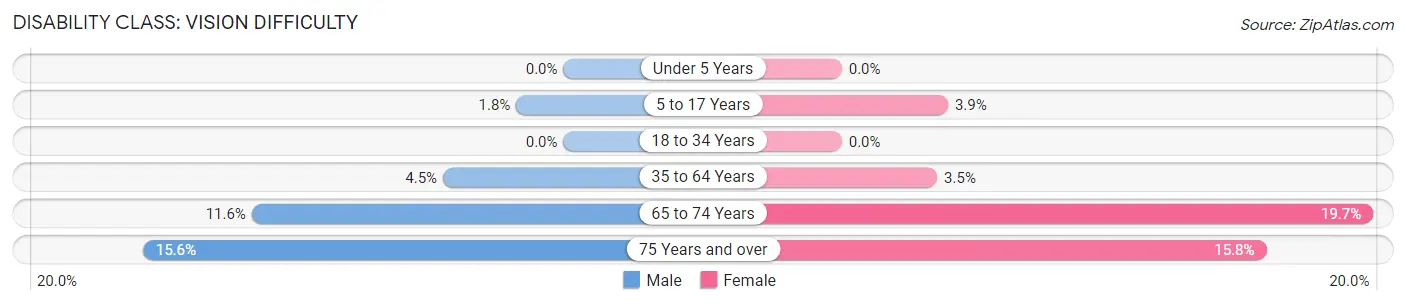
| Age Bracket | Male | Female |
| Under 5 Years | 0 (0.0%) | 0 (0.0%) |
| 5 to 17 Years | 10 (1.8%) | 27 (3.9%) |
| 18 to 34 Years | 0 (0.0%) | 0 (0.0%) |
| 35 to 64 Years | 64 (4.5%) | 57 (3.5%) |
| 65 to 74 Years | 48 (11.6%) | 99 (19.7%) |
| 75 Years and over | 42 (15.6%) | 49 (15.8%) |
Disability Class: Cognitive Difficulty

| Age Bracket | Male | Female |
| 5 to 17 Years | 42 (7.4%) | 12 (1.8%) |
| 18 to 34 Years | 42 (6.5%) | 46 (6.3%) |
| 35 to 64 Years | 109 (7.6%) | 93 (5.8%) |
| 65 to 74 Years | 22 (5.3%) | 52 (10.4%) |
| 75 Years and over | 95 (35.3%) | 42 (13.5%) |
Disability Class: Ambulatory Difficulty

| Age Bracket | Male | Female |
| 5 to 17 Years | 0 (0.0%) | 0 (0.0%) |
| 18 to 34 Years | 13 (2.0%) | 0 (0.0%) |
| 35 to 64 Years | 141 (9.9%) | 181 (11.3%) |
| 65 to 74 Years | 94 (22.7%) | 225 (44.8%) |
| 75 Years and over | 171 (63.6%) | 106 (34.1%) |
Disability Class: Self-Care Difficulty

| Age Bracket | Male | Female |
| 5 to 17 Years | 0 (0.0%) | 3 (0.4%) |
| 18 to 34 Years | 0 (0.0%) | 0 (0.0%) |
| 35 to 64 Years | 51 (3.6%) | 75 (4.7%) |
| 65 to 74 Years | 8 (1.9%) | 67 (13.4%) |
| 75 Years and over | 67 (24.9%) | 57 (18.3%) |
Technology Access in Cleveland County
Computing Device Access in Cleveland County
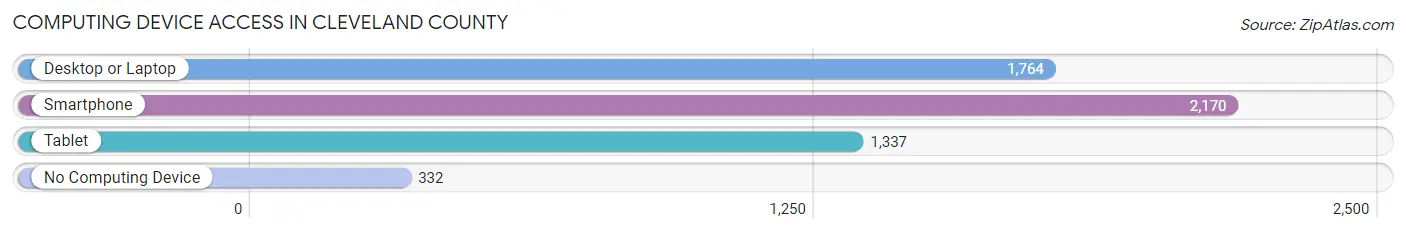
| Device Type | # Households | % Households |
| Desktop or Laptop | 1,764 | 64.3% |
| Smartphone | 2,170 | 79.1% |
| Tablet | 1,337 | 48.8% |
| No Computing Device | 332 | 12.1% |
| Total | 2,742 | 100.0% |
Internet Access in Cleveland County

| Internet Type | # Households | % Households |
| Dial-Up Internet | 50 | 1.8% |
| Broadband Home | 949 | 34.6% |
| Cellular Data Only | 707 | 25.8% |
| Satellite Internet | 314 | 11.5% |
| No Internet | 696 | 25.4% |
| Total | 2,742 | 100.0% |
Cleveland County Summary
Cleveland County is located in the southeastern corner of Arkansas, and is bordered by Jefferson, Grant, and Lincoln counties to the north, Desha County to the east, and Bradley County to the south. The county seat is Rison, and the county has a total area of 545 square miles. As of the 2010 census, the population was 8,689, making it the second least populous county in the state.
History
Cleveland County was formed in 1873 from parts of Bradley and Jefferson counties. It was named for President Grover Cleveland, who had been elected the previous year. The county was largely rural and agricultural until the early 20th century, when the timber industry began to take off. The county was also home to several small towns, including Rison, Kingsland, and New Edinburg.
Geography
Cleveland County is located in the southeastern corner of Arkansas, and is bordered by Jefferson, Grant, and Lincoln counties to the north, Desha County to the east, and Bradley County to the south. The county has a total area of 545 square miles, and is mostly flat with some rolling hills. The terrain is mostly covered in pine and hardwood forests, with some open fields and pastures. The county is drained by the Saline River, which flows through the county from north to south.
Economy
Cleveland County is largely rural and agricultural, with the majority of the population living in small towns and rural areas. The county’s economy is largely based on agriculture, with the main crops being cotton, soybeans, corn, and rice. The timber industry is also an important part of the economy, with the county being home to several sawmills and wood-processing plants. The county also has a small manufacturing sector, with several small factories producing furniture, clothing, and other goods.
Demographics
As of the 2010 census, the population of Cleveland County was 8,689, with a population density of 16 people per square mile. The racial makeup of the county was 79.3% White, 18.2% Black or African American, 0.3% Native American, 0.2% Asian, 0.1% Pacific Islander, 0.7% from other races, and 1.4% from two or more races. Hispanic or Latino of any race were 1.7% of the population.
The median income for a household in the county was $30,945, and the median income for a family was $37,917. The per capita income for the county was $15,945. About 17.2% of the population was below the poverty line.
Common Questions
What is the Total Population of Cleveland County?
Total Population of Cleveland County is 7,548.
What is the Total Male Population of Cleveland County?
Total Male Population of Cleveland County is 3,494.
What is the Total Female Population of Cleveland County?
Total Female Population of Cleveland County is 4,054.
What is the Ratio of Males per 100 Females in Cleveland County?
There are 86.19 Males per 100 Females in Cleveland County.
What is the Ratio of Females per 100 Males in Cleveland County?
There are 116.03 Females per 100 Males in Cleveland County.
What is the Median Population Age in Cleveland County?
Median Population Age in Cleveland County is 42.5 Years.
What is the Average Family Size in Cleveland County
Average Family Size in Cleveland County is 3.4 People.
What is the Average Household Size in Cleveland County
Average Household Size in Cleveland County is 2.7 People.
What is Per Capita Income in Cleveland County?
Per Capita income in Cleveland County is $26,479.
What is the Median Family Income in Cleveland County?
Median Family Income in Cleveland County is $72,857.
What is the Median Household income in Cleveland County?
Median Household Income in Cleveland County is $48,913.
What is Income or Wage Gap in Cleveland County?
Income or Wage Gap in Cleveland County is 35.3%.
Women in Cleveland County earn 64.7 cents for every dollar earned by a man.
What is Inequality or Gini Index in Cleveland County?
Inequality or Gini Index in Cleveland County is 0.45.
How Large is the Labor Force in Cleveland County?
There are 2,948 People in the Labor Forcein in Cleveland County.
What is the Percentage of People in the Labor Force in Cleveland County?
47.8% of People are in the Labor Force in Cleveland County.
What is the Unemployment Rate in Cleveland County?
Unemployment Rate in Cleveland County is 0.8%.