White Plains, AL
White Plains Map
White Plains Overview
815
TOTAL POPULATION
524
MALE POPULATION
291
FEMALE POPULATION
180.07
MALES / 100 FEMALES
55.53
FEMALES / 100 MALES
46.3
MEDIAN AGE
2.9
AVG FAMILY SIZE
2.8
AVG HOUSEHOLD SIZE
$21,103
PER CAPITA INCOME
$57,090
AVG FAMILY INCOME
$56,922
AVG HOUSEHOLD INCOME
0.29
INEQUALITY / GINI INDEX
331
LABOR FORCE [ PEOPLE ]
43.4%
PERCENT IN LABOR FORCE
18.1%
UNEMPLOYMENT RATE
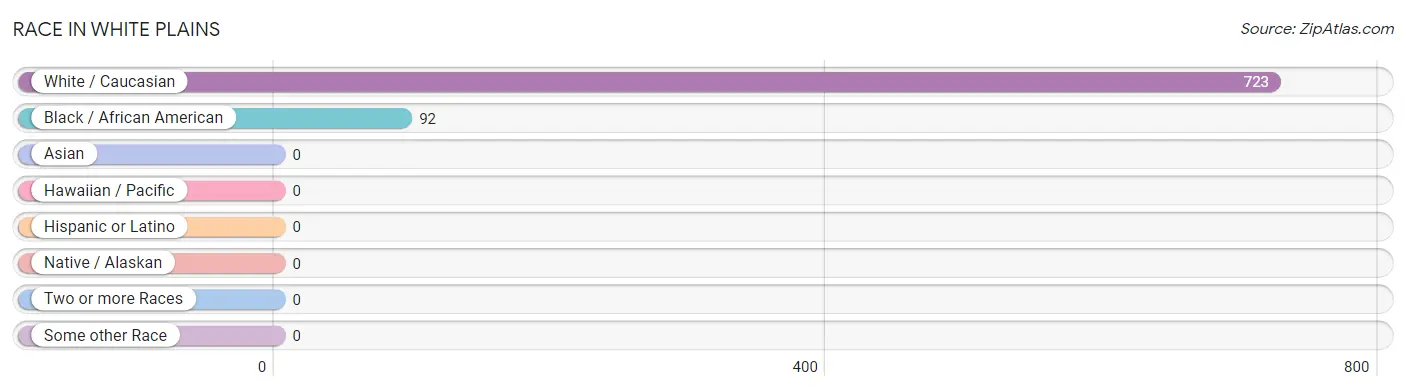
Race in White Plains
The most populous races in White Plains are White / Caucasian (723 | 88.7%), and Black / African American (92 | 11.3%).
| Race | # Population | % Population |
| Asian | 0 | 0.0% |
| Black / African American | 92 | 11.3% |
| Hawaiian / Pacific | 0 | 0.0% |
| Hispanic or Latino | 0 | 0.0% |
| Native / Alaskan | 0 | 0.0% |
| White / Caucasian | 723 | 88.7% |
| Two or more Races | 0 | 0.0% |
| Some other Race | 0 | 0.0% |
| Total | 815 | 100.0% |
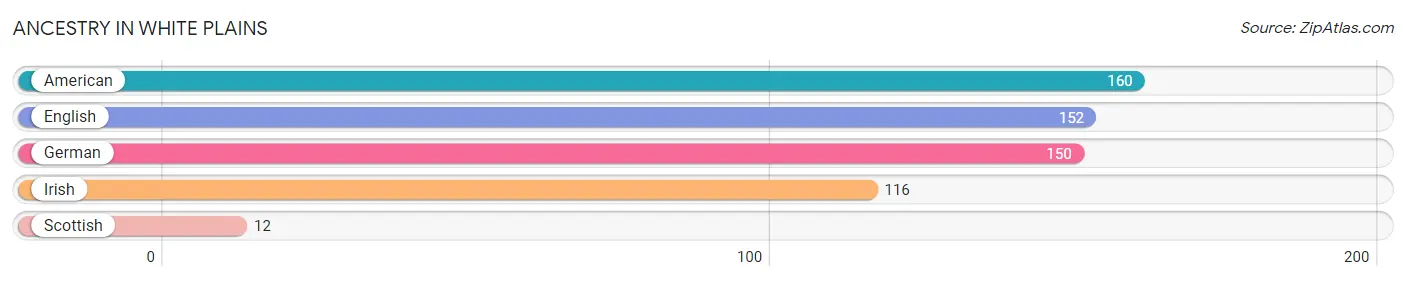
Ancestry in White Plains
The most populous ancestries reported in White Plains are American (160 | 19.6%), English (152 | 18.6%), German (150 | 18.4%), Irish (116 | 14.2%), and Scottish (12 | 1.5%), together accounting for 72.4% of all White Plains residents.
| Ancestry | # Population | % Population |
| American | 160 | 19.6% |
| English | 152 | 18.6% |
| German | 150 | 18.4% |
| Irish | 116 | 14.2% |
| Scottish | 12 | 1.5% | View All 5 Rows |
Immigrants in White Plains

| Immigration Origin | # Population | % Population | View All 0 Rows |
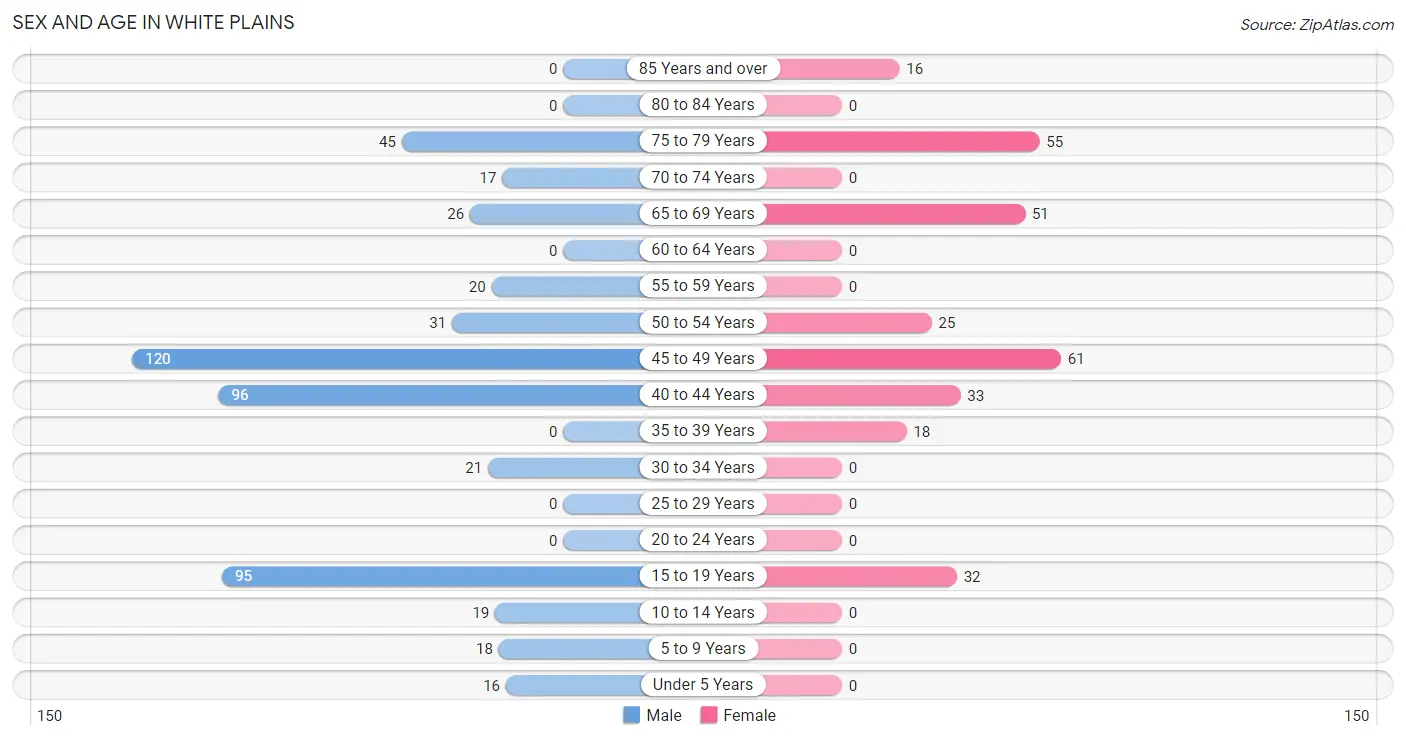
Sex and Age in White Plains
Sex and Age in White Plains
The most populous age groups in White Plains are 45 to 49 Years (120 | 22.9%) for men and 45 to 49 Years (61 | 21.0%) for women.
| Age Bracket | Male | Female |
| Under 5 Years | 16 (3.0%) | 0 (0.0%) |
| 5 to 9 Years | 18 (3.4%) | 0 (0.0%) |
| 10 to 14 Years | 19 (3.6%) | 0 (0.0%) |
| 15 to 19 Years | 95 (18.1%) | 32 (11.0%) |
| 20 to 24 Years | 0 (0.0%) | 0 (0.0%) |
| 25 to 29 Years | 0 (0.0%) | 0 (0.0%) |
| 30 to 34 Years | 21 (4.0%) | 0 (0.0%) |
| 35 to 39 Years | 0 (0.0%) | 18 (6.2%) |
| 40 to 44 Years | 96 (18.3%) | 33 (11.3%) |
| 45 to 49 Years | 120 (22.9%) | 61 (21.0%) |
| 50 to 54 Years | 31 (5.9%) | 25 (8.6%) |
| 55 to 59 Years | 20 (3.8%) | 0 (0.0%) |
| 60 to 64 Years | 0 (0.0%) | 0 (0.0%) |
| 65 to 69 Years | 26 (5.0%) | 51 (17.5%) |
| 70 to 74 Years | 17 (3.2%) | 0 (0.0%) |
| 75 to 79 Years | 45 (8.6%) | 55 (18.9%) |
| 80 to 84 Years | 0 (0.0%) | 0 (0.0%) |
| 85 Years and over | 0 (0.0%) | 16 (5.5%) |
| Total | 524 (100.0%) | 291 (100.0%) |
Families and Households in White Plains
Median Family Size in White Plains
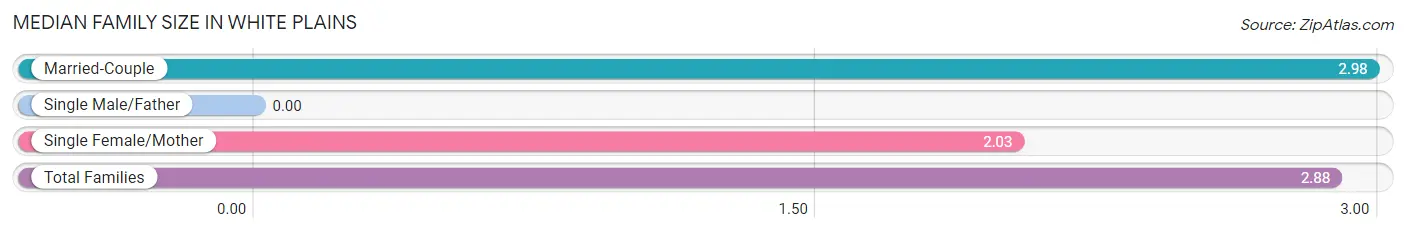
| Family Type | # Families | Family Size |
| Married-Couple | 249 (88.9%) | 2.98 |
| Single Male/Father | 0 (0.0%) | - |
| Single Female/Mother | 31 (11.1%) | 2.03 |
| Total Families | 280 (100.0%) | 2.88 |
Median Household Size in White Plains
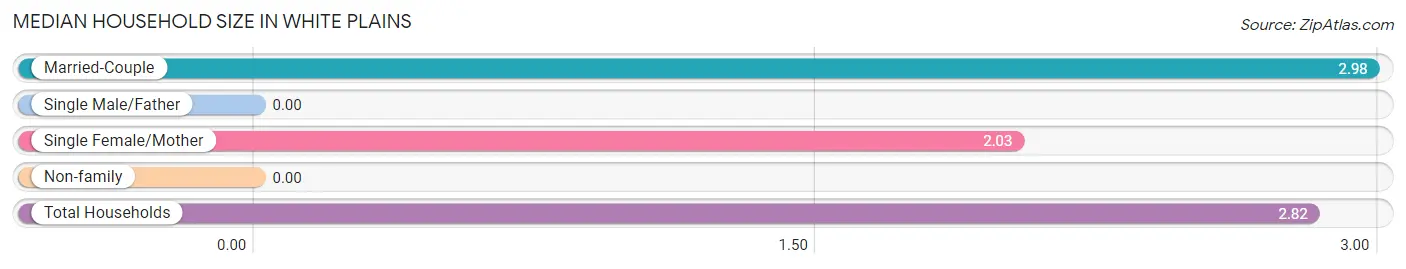
| Household Type | # Households | Household Size |
| Married-Couple | 249 (86.2%) | 2.98 |
| Single Male/Father | 0 (0.0%) | - |
| Single Female/Mother | 31 (10.7%) | 2.03 |
| Non-family | 9 (3.1%) | - |
| Total Households | 289 (100.0%) | 2.82 |
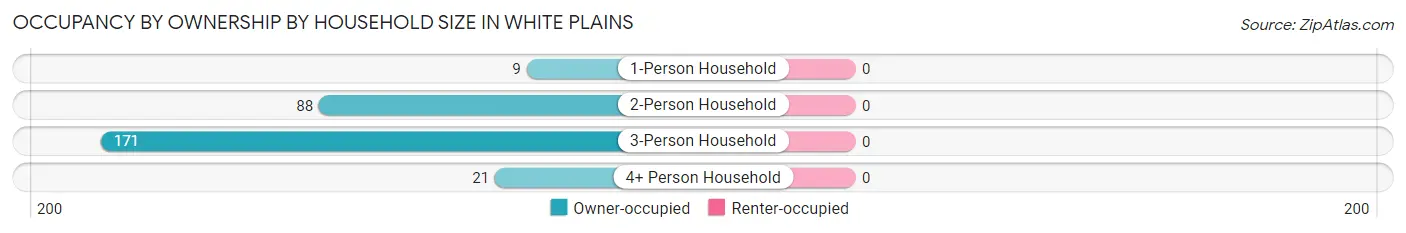
Household Size by Marriage Status in White Plains
Out of a total of 289 households in White Plains, 280 (96.9%) are family households, while 9 (3.1%) are nonfamily households. The most numerous type of family households are 3-person households, comprising 171, and the most common type of nonfamily households are 1-person households, comprising 9.
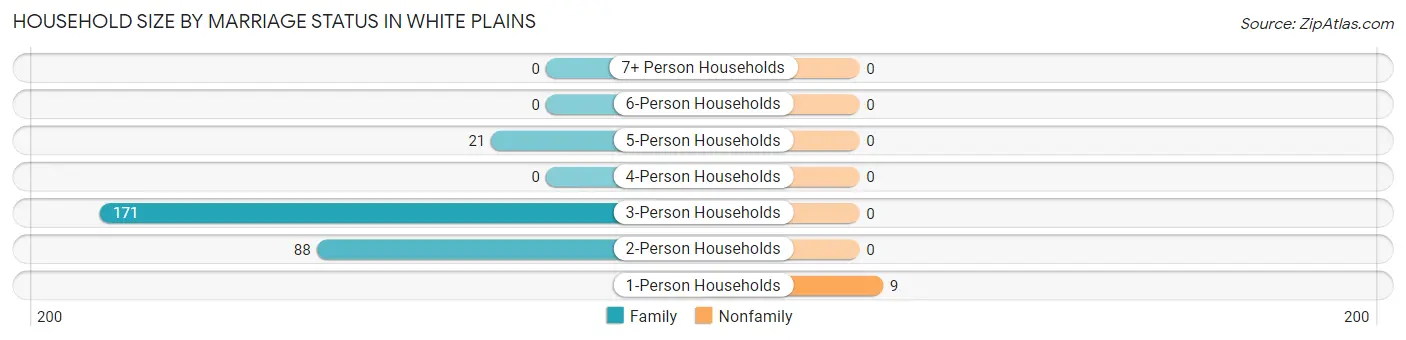
| Household Size | Family Households | Nonfamily Households |
| 1-Person Households | - | 9 (3.1%) |
| 2-Person Households | 88 (30.4%) | 0 (0.0%) |
| 3-Person Households | 171 (59.2%) | 0 (0.0%) |
| 4-Person Households | 0 (0.0%) | 0 (0.0%) |
| 5-Person Households | 21 (7.3%) | 0 (0.0%) |
| 6-Person Households | 0 (0.0%) | 0 (0.0%) |
| 7+ Person Households | 0 (0.0%) | 0 (0.0%) |
| Total | 280 (96.9%) | 9 (3.1%) |
Female Fertility in White Plains
Fertility by Age in White Plains
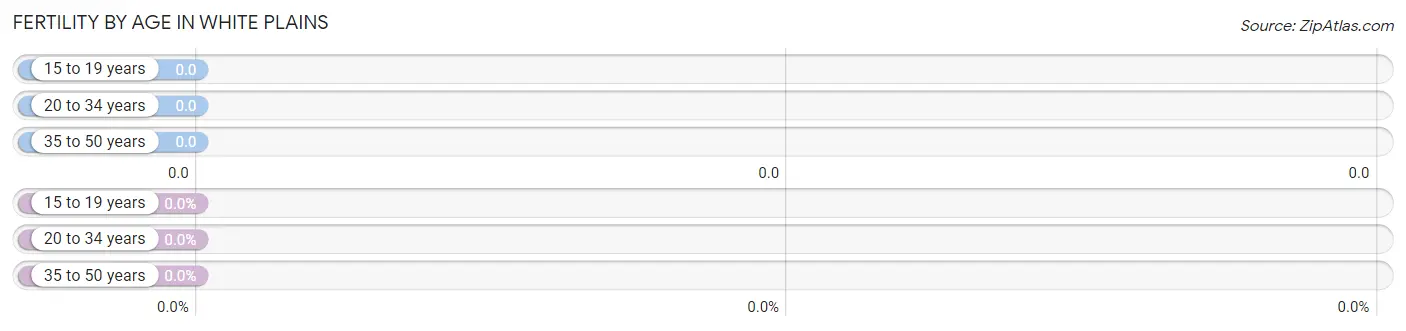
| Age Bracket | Women with Births | Births / 1,000 Women |
| 15 to 19 years | 0 (0.0%) | 0.0 |
| 20 to 34 years | 0 (0.0%) | 0.0 |
| 35 to 50 years | 0 (0.0%) | 0.0 |
| Total | 0 (0.0%) | 0.0 |
Fertility by Age by Marriage Status in White Plains
| Age Bracket | Married | Unmarried |
| 15 to 19 years | 0 (0.0%) | 0 (0.0%) |
| 20 to 34 years | 0 (0.0%) | 0 (0.0%) |
| 35 to 50 years | 0 (0.0%) | 0 (0.0%) |
| Total | 0 (0.0%) | 0 (0.0%) |
Fertility by Education in White Plains
| Educational Attainment | Women with Births | Births / 1,000 Women |
| Less than High School | 0 (0.0%) | 0.0 |
| High School Diploma | 0 (0.0%) | 0.0 |
| College or Associate's Degree | 0 (0.0%) | 0.0 |
| Bachelor's Degree | 0 (0.0%) | 0.0 |
| Graduate Degree | 0 (0.0%) | 0.0 |
| Total | 0 (0.0%) | 0.0 |
Fertility by Education by Marriage Status in White Plains
| Educational Attainment | Married | Unmarried |
| Less than High School | 0 (0.0%) | 0 (0.0%) |
| High School Diploma | 0 (0.0%) | 0 (0.0%) |
| College or Associate's Degree | 0 (0.0%) | 0 (0.0%) |
| Bachelor's Degree | 0 (0.0%) | 0 (0.0%) |
| Graduate Degree | 0 (0.0%) | 0 (0.0%) |
| Total | 0 (0.0%) | 0 (0.0%) |
Income in White Plains
Income Overview in White Plains
Per Capita Income in White Plains is $21,103, while median incomes of families and households are $57,090 and $56,922 respectively.
| Characteristic | Number | Measure |
| Per Capita Income | 815 | $21,103 |
| Median Family Income | 280 | $57,090 |
| Mean Family Income | 280 | $63,627 |
| Median Household Income | 289 | $56,922 |
| Mean Household Income | 289 | $61,986 |
| Income Deficit | 280 | $0 |
| Wage / Income Gap (%) | 815 | 0.00% |
| Wage / Income Gap ($) | 815 | 100.00¢ per $1 |
| Gini / Inequality Index | 815 | 0.29 |
Earnings by Sex in White Plains
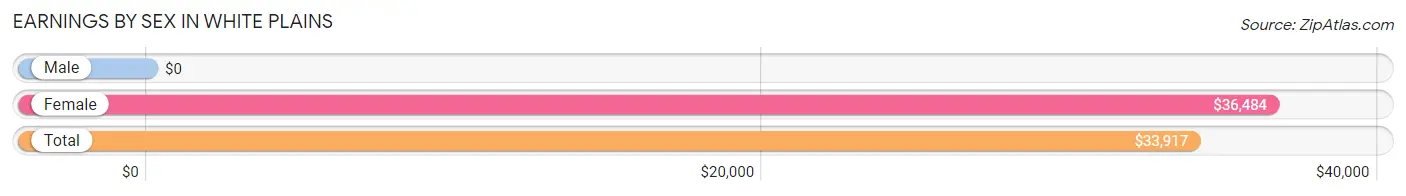
| Sex | Number | Average Earnings |
| Male | 160 (48.3%) | $0 |
| Female | 171 (51.7%) | $36,484 |
| Total | 331 (100.0%) | $33,917 |
Earnings by Sex by Income Bracket in White Plains
The most common earnings brackets in White Plains are $5,000 to $7,499 for men (60 | 37.5%) and $35,000 to $39,999 for women (48 | 28.1%).
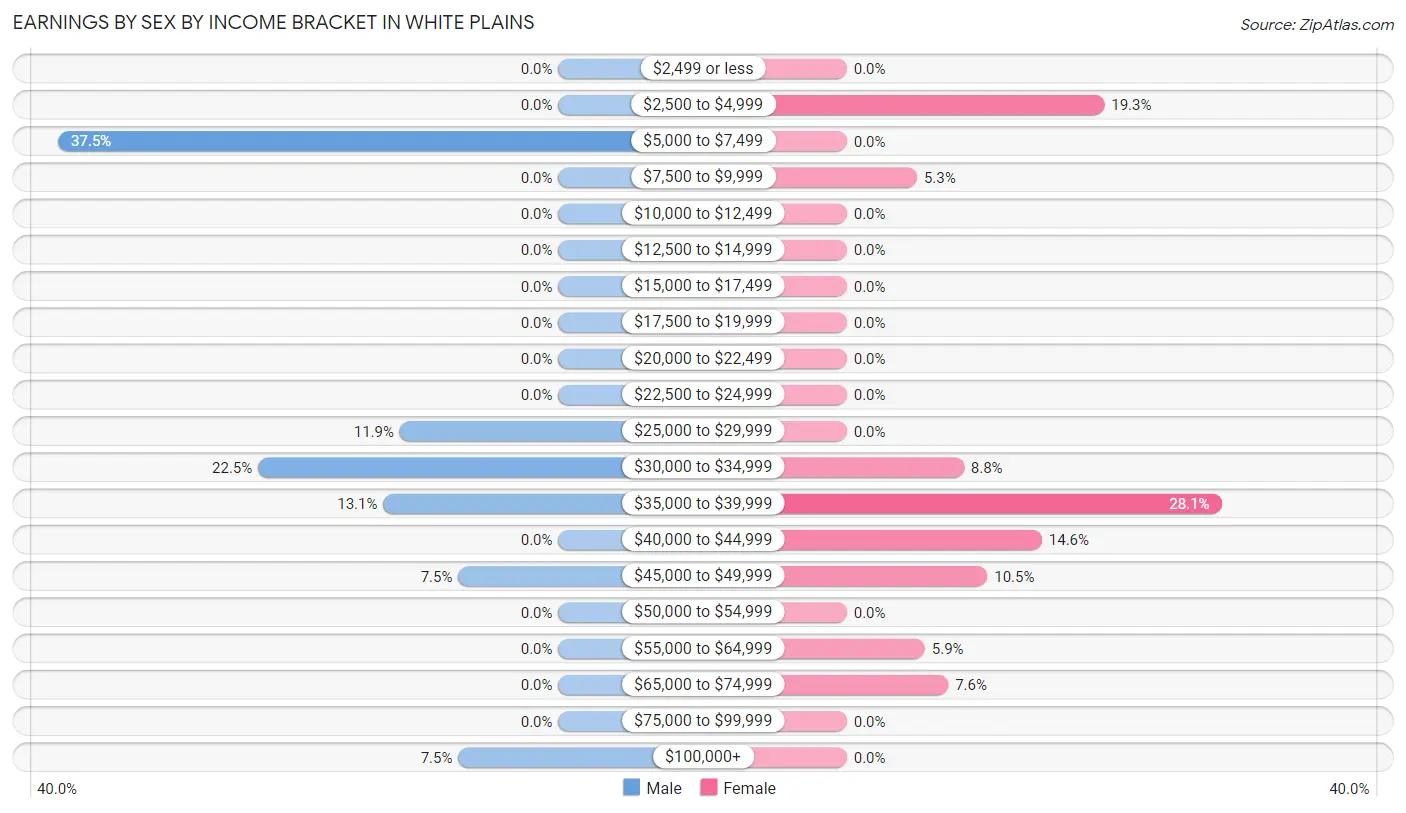
| Income | Male | Female |
| $2,499 or less | 0 (0.0%) | 0 (0.0%) |
| $2,500 to $4,999 | 0 (0.0%) | 33 (19.3%) |
| $5,000 to $7,499 | 60 (37.5%) | 0 (0.0%) |
| $7,500 to $9,999 | 0 (0.0%) | 9 (5.3%) |
| $10,000 to $12,499 | 0 (0.0%) | 0 (0.0%) |
| $12,500 to $14,999 | 0 (0.0%) | 0 (0.0%) |
| $15,000 to $17,499 | 0 (0.0%) | 0 (0.0%) |
| $17,500 to $19,999 | 0 (0.0%) | 0 (0.0%) |
| $20,000 to $22,499 | 0 (0.0%) | 0 (0.0%) |
| $22,500 to $24,999 | 0 (0.0%) | 0 (0.0%) |
| $25,000 to $29,999 | 19 (11.9%) | 0 (0.0%) |
| $30,000 to $34,999 | 36 (22.5%) | 15 (8.8%) |
| $35,000 to $39,999 | 21 (13.1%) | 48 (28.1%) |
| $40,000 to $44,999 | 0 (0.0%) | 25 (14.6%) |
| $45,000 to $49,999 | 12 (7.5%) | 18 (10.5%) |
| $50,000 to $54,999 | 0 (0.0%) | 0 (0.0%) |
| $55,000 to $64,999 | 0 (0.0%) | 10 (5.9%) |
| $65,000 to $74,999 | 0 (0.0%) | 13 (7.6%) |
| $75,000 to $99,999 | 0 (0.0%) | 0 (0.0%) |
| $100,000+ | 12 (7.5%) | 0 (0.0%) |
| Total | 160 (100.0%) | 171 (100.0%) |
Earnings by Sex by Educational Attainment in White Plains
| Educational Attainment | Male Income | Female Income |
| Less than High School | - | - |
| High School Diploma | - | - |
| College or Associate's Degree | - | - |
| Bachelor's Degree | - | - |
| Graduate Degree | - | - |
| Total | - | - |
Family Income in White Plains
Family Income Brackets in White Plains
According to the White Plains family income data, there are 119 families falling into the $50,000 to $74,999 income range, which is the most common income bracket and makes up 42.5% of all families.
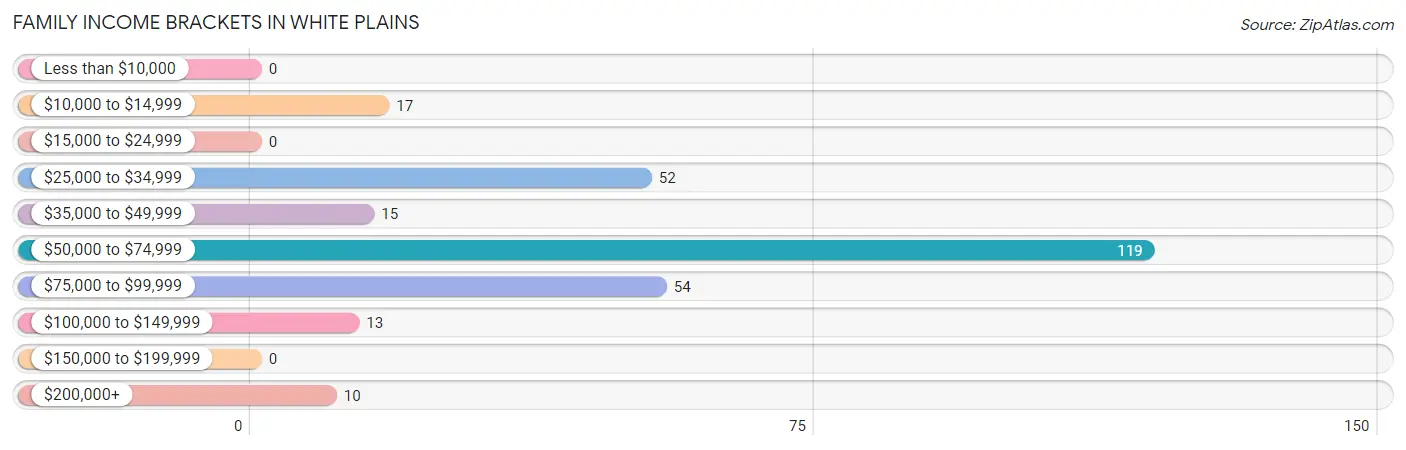
| Income Bracket | # Families | % Families |
| Less than $10,000 | 0 | 0.0% |
| $10,000 to $14,999 | 17 | 6.1% |
| $15,000 to $24,999 | 0 | 0.0% |
| $25,000 to $34,999 | 52 | 18.6% |
| $35,000 to $49,999 | 15 | 5.4% |
| $50,000 to $74,999 | 119 | 42.5% |
| $75,000 to $99,999 | 54 | 19.3% |
| $100,000 to $149,999 | 13 | 4.6% |
| $150,000 to $199,999 | 0 | 0.0% |
| $200,000+ | 10 | 3.6% |
Family Income by Famaliy Size in White Plains
3-person families (171 | 61.1%) account for the highest median family income in White Plains with $56,847 per family, while 3-person families (171 | 61.1%) have the highest median income of $18,949 per family member.
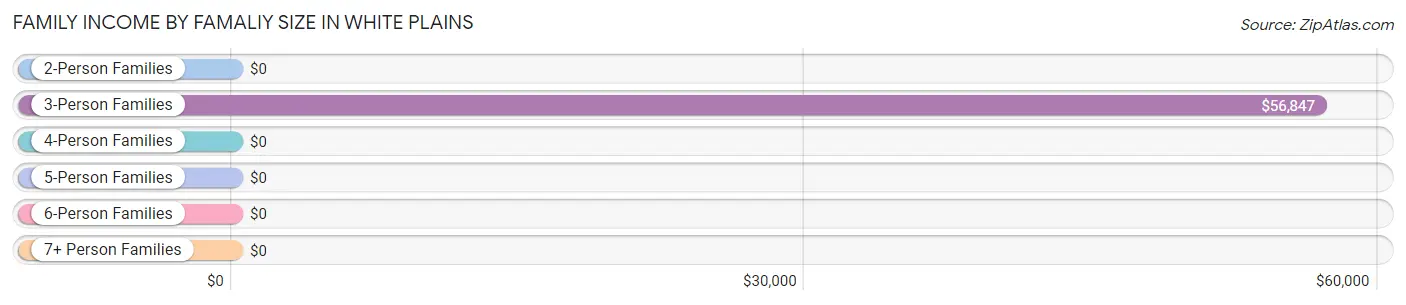
| Income Bracket | # Families | Median Income |
| 2-Person Families | 88 (31.4%) | $0 |
| 3-Person Families | 171 (61.1%) | $56,847 |
| 4-Person Families | 0 (0.0%) | $0 |
| 5-Person Families | 21 (7.5%) | $0 |
| 6-Person Families | 0 (0.0%) | $0 |
| 7+ Person Families | 0 (0.0%) | $0 |
| Total | 280 (100.0%) | $57,090 |
Family Income by Number of Earners in White Plains
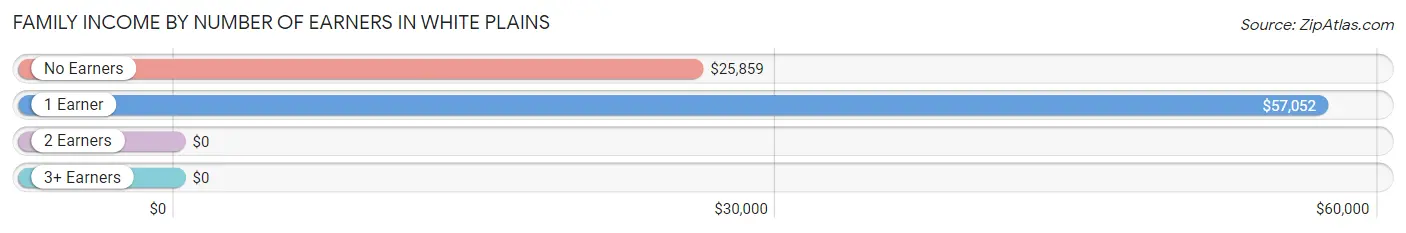
| Number of Earners | # Families | Median Income |
| No Earners | 45 (16.1%) | $25,859 |
| 1 Earner | 140 (50.0%) | $57,052 |
| 2 Earners | 95 (33.9%) | $0 |
| 3+ Earners | 0 (0.0%) | $0 |
| Total | 280 (100.0%) | $57,090 |
Household Income in White Plains
Household Income Brackets in White Plains
With 119 households falling in the category, the $50,000 to $74,999 income range is the most frequent in White Plains, accounting for 41.2% of all households.
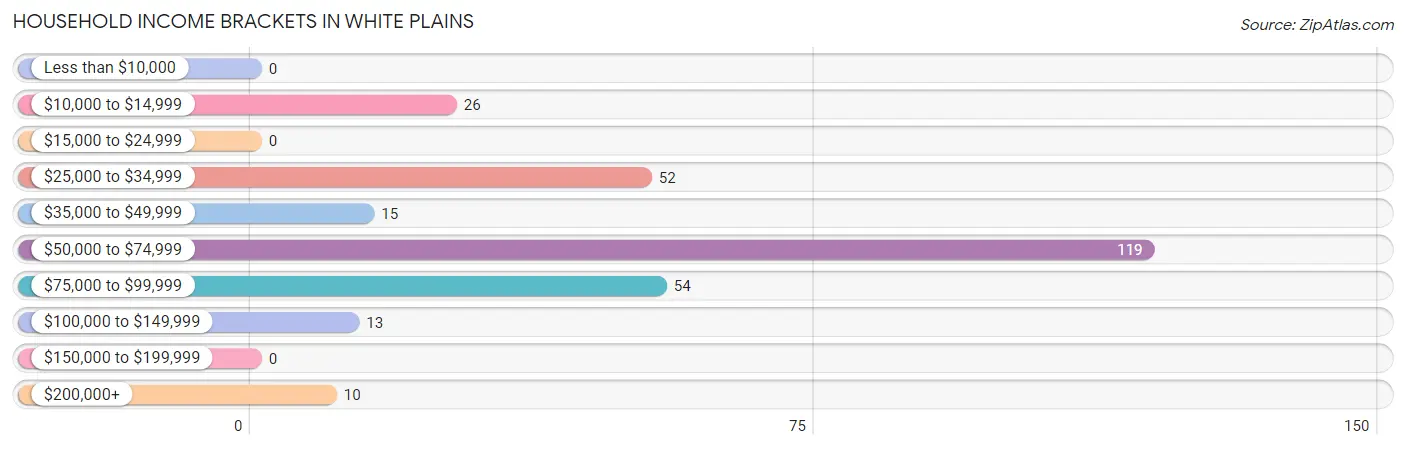
| Income Bracket | # Households | % Households |
| Less than $10,000 | 0 | 0.0% |
| $10,000 to $14,999 | 26 | 9.0% |
| $15,000 to $24,999 | 0 | 0.0% |
| $25,000 to $34,999 | 52 | 18.0% |
| $35,000 to $49,999 | 15 | 5.2% |
| $50,000 to $74,999 | 119 | 41.2% |
| $75,000 to $99,999 | 54 | 18.7% |
| $100,000 to $149,999 | 13 | 4.5% |
| $150,000 to $199,999 | 0 | 0.0% |
| $200,000+ | 10 | 3.5% |
Household Income by Householder Age in White Plains
The median household income in White Plains is $56,922, with the highest median household income of $70,200 found in the 65+ years age bracket for the primary householder. A total of 112 households (38.8%) fall into this category.
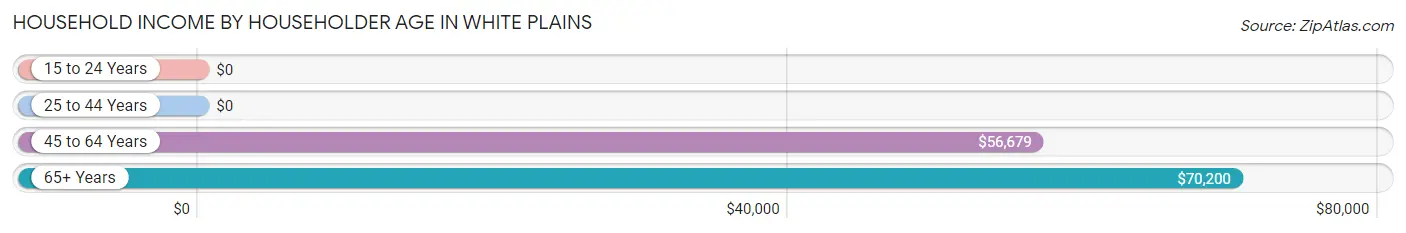
| Income Bracket | # Households | Median Income |
| 15 to 24 Years | 0 (0.0%) | $0 |
| 25 to 44 Years | 57 (19.7%) | $0 |
| 45 to 64 Years | 120 (41.5%) | $56,679 |
| 65+ Years | 112 (38.8%) | $70,200 |
| Total | 289 (100.0%) | $56,922 |
Poverty in White Plains
Income Below Poverty by Sex and Age in White Plains
With 3.2% poverty level for males and 8.9% for females among the residents of White Plains, 65 to 74 year old males and 65 to 74 year old females are the most vulnerable to poverty, with 17 males (39.5%) and 26 females (51.0%) in their respective age groups living below the poverty level.
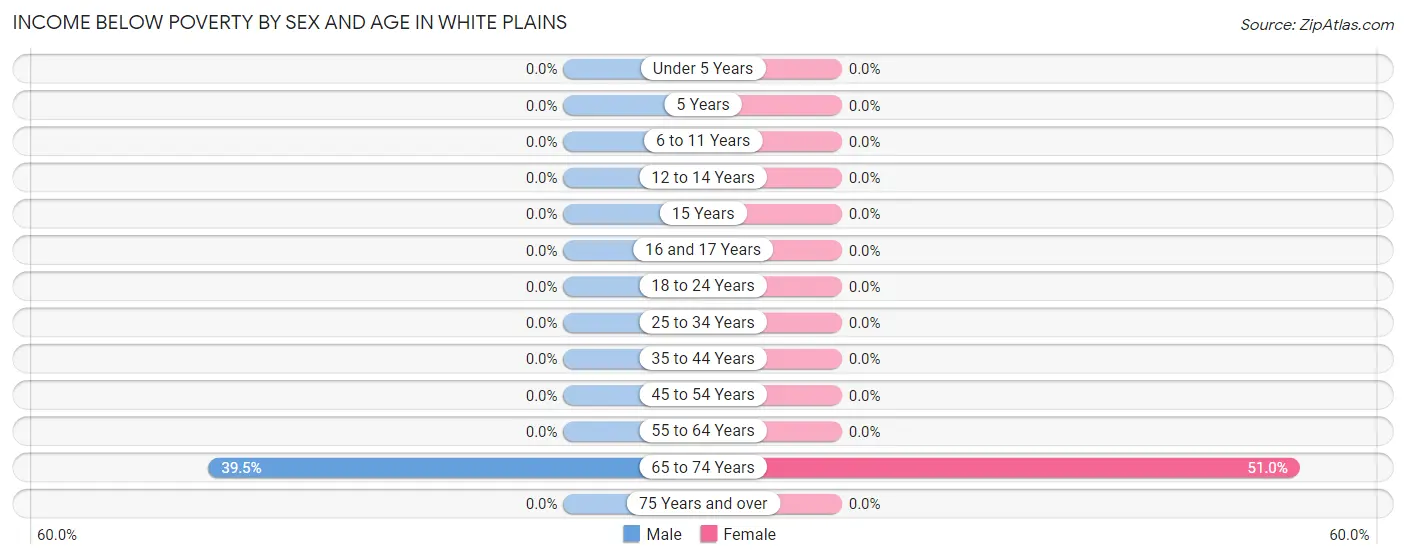
| Age Bracket | Male | Female |
| Under 5 Years | 0 (0.0%) | 0 (0.0%) |
| 5 Years | 0 (0.0%) | 0 (0.0%) |
| 6 to 11 Years | 0 (0.0%) | 0 (0.0%) |
| 12 to 14 Years | 0 (0.0%) | 0 (0.0%) |
| 15 Years | 0 (0.0%) | 0 (0.0%) |
| 16 and 17 Years | 0 (0.0%) | 0 (0.0%) |
| 18 to 24 Years | 0 (0.0%) | 0 (0.0%) |
| 25 to 34 Years | 0 (0.0%) | 0 (0.0%) |
| 35 to 44 Years | 0 (0.0%) | 0 (0.0%) |
| 45 to 54 Years | 0 (0.0%) | 0 (0.0%) |
| 55 to 64 Years | 0 (0.0%) | 0 (0.0%) |
| 65 to 74 Years | 17 (39.5%) | 26 (51.0%) |
| 75 Years and over | 0 (0.0%) | 0 (0.0%) |
| Total | 17 (3.2%) | 26 (8.9%) |
Income Above Poverty by Sex and Age in White Plains
According to the poverty statistics in White Plains, males aged under 5 years and females aged 16 and 17 years are the age groups that are most secure financially, with 100.0% of males and 100.0% of females in these age groups living above the poverty line.
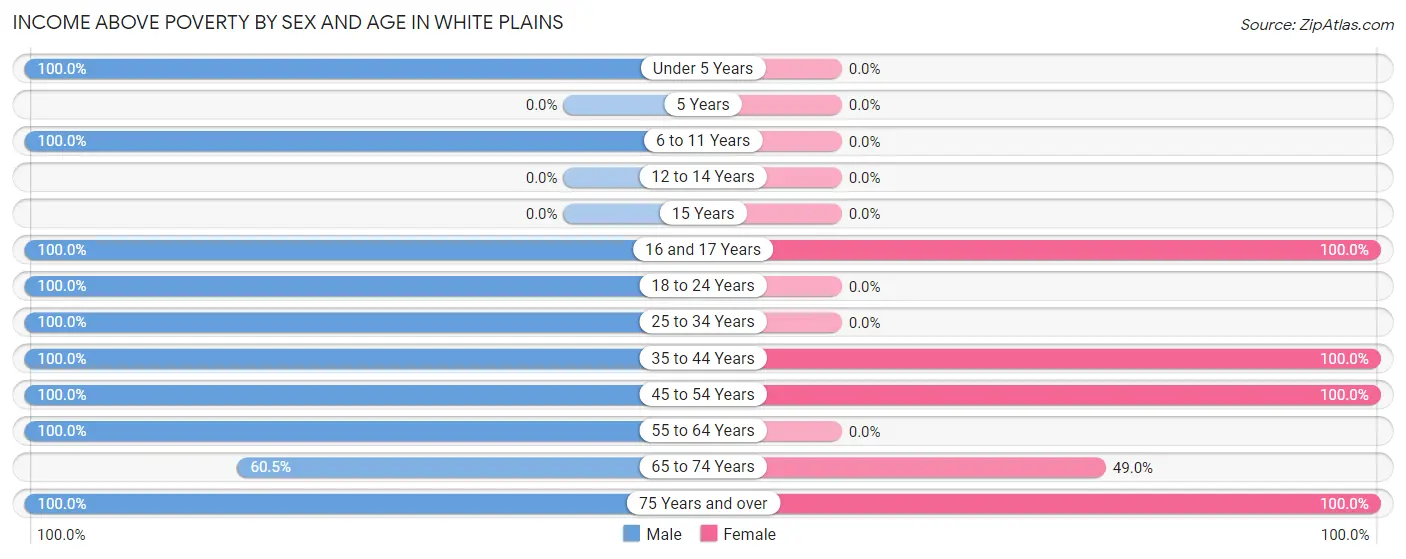
| Age Bracket | Male | Female |
| Under 5 Years | 16 (100.0%) | 0 (0.0%) |
| 5 Years | 0 (0.0%) | 0 (0.0%) |
| 6 to 11 Years | 37 (100.0%) | 0 (0.0%) |
| 12 to 14 Years | 0 (0.0%) | 0 (0.0%) |
| 15 Years | 0 (0.0%) | 0 (0.0%) |
| 16 and 17 Years | 83 (100.0%) | 32 (100.0%) |
| 18 to 24 Years | 12 (100.0%) | 0 (0.0%) |
| 25 to 34 Years | 21 (100.0%) | 0 (0.0%) |
| 35 to 44 Years | 96 (100.0%) | 51 (100.0%) |
| 45 to 54 Years | 151 (100.0%) | 86 (100.0%) |
| 55 to 64 Years | 20 (100.0%) | 0 (0.0%) |
| 65 to 74 Years | 26 (60.5%) | 25 (49.0%) |
| 75 Years and over | 45 (100.0%) | 71 (100.0%) |
| Total | 507 (96.8%) | 265 (91.1%) |
Income Below Poverty Among Married-Couple Families in White Plains
The poverty statistics for married-couple families in White Plains show that 6.8% or 17 of the total 249 families live below the poverty line. Families with no children have the highest poverty rate of 13.6%, comprising of 17 families. On the other hand, families with 1 or 2 children have the lowest poverty rate of 0.0%, which includes 0 families.
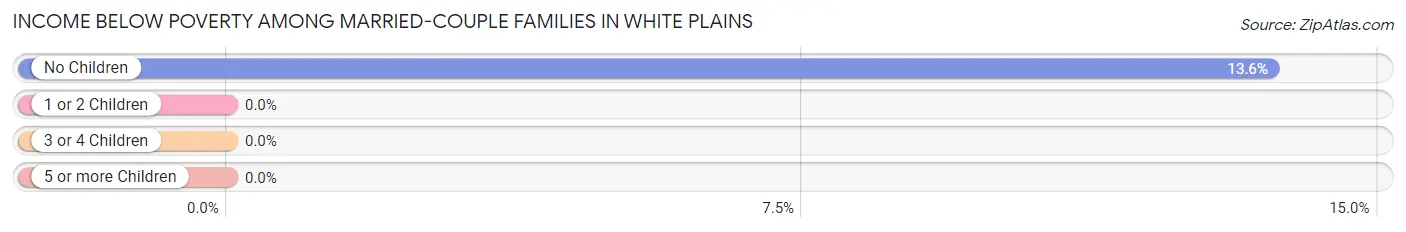
| Children | Above Poverty | Below Poverty |
| No Children | 108 (86.4%) | 17 (13.6%) |
| 1 or 2 Children | 103 (100.0%) | 0 (0.0%) |
| 3 or 4 Children | 21 (100.0%) | 0 (0.0%) |
| 5 or more Children | 0 (0.0%) | 0 (0.0%) |
| Total | 232 (93.2%) | 17 (6.8%) |
Income Below Poverty Among Single-Parent Households in White Plains
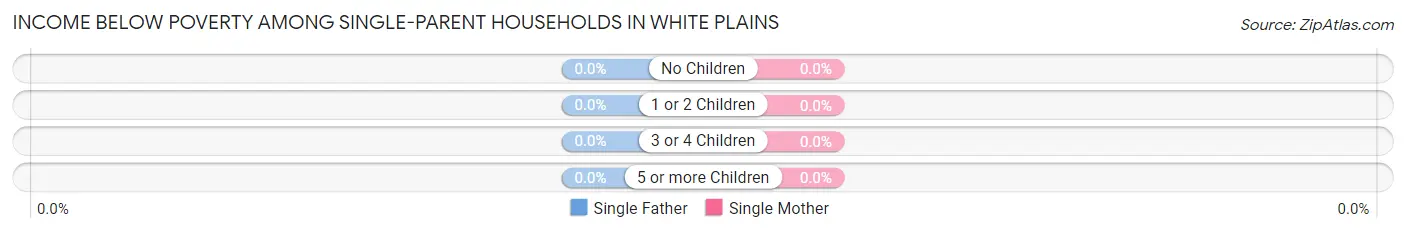
| Children | Single Father | Single Mother |
| No Children | 0 (0.0%) | 0 (0.0%) |
| 1 or 2 Children | 0 (0.0%) | 0 (0.0%) |
| 3 or 4 Children | 0 (0.0%) | 0 (0.0%) |
| 5 or more Children | 0 (0.0%) | 0 (0.0%) |
| Total | 0 (0.0%) | 0 (0.0%) |
Income Below Poverty Among Married-Couple vs Single-Parent Households in White Plains
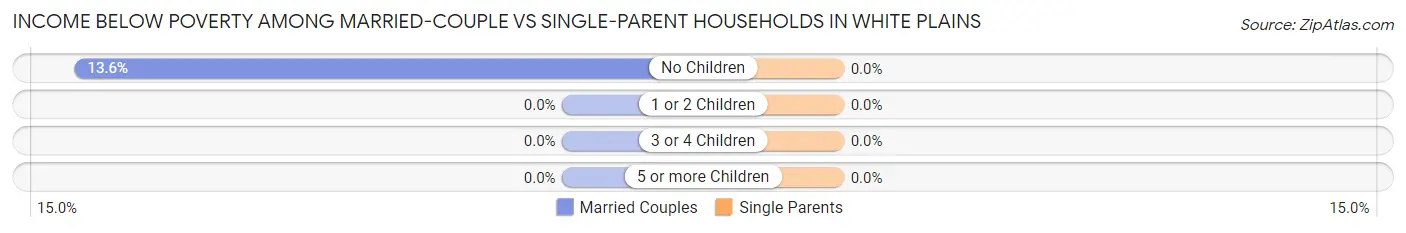
| Children | Married-Couple Families | Single-Parent Households |
| No Children | 17 (13.6%) | 0 (0.0%) |
| 1 or 2 Children | 0 (0.0%) | 0 (0.0%) |
| 3 or 4 Children | 0 (0.0%) | 0 (0.0%) |
| 5 or more Children | 0 (0.0%) | 0 (0.0%) |
| Total | 17 (6.8%) | 0 (0.0%) |
Employment Characteristics in White Plains
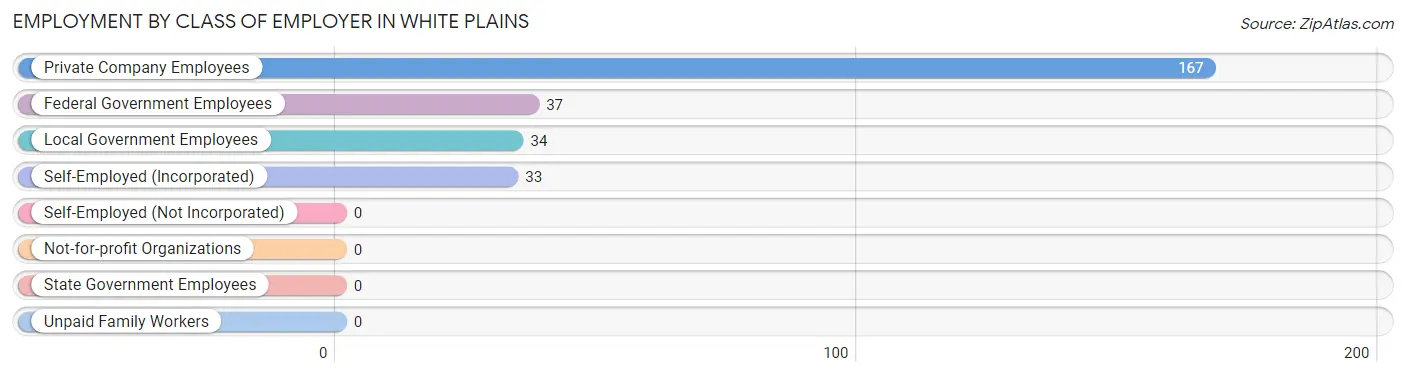
Employment by Class of Employer in White Plains
Among the 271 employed individuals in White Plains, private company employees (167 | 61.6%), federal government employees (37 | 13.7%), and local government employees (34 | 12.6%) make up the most common classes of employment.
| Employer Class | # Employees | % Employees |
| Private Company Employees | 167 | 61.6% |
| Self-Employed (Incorporated) | 33 | 12.2% |
| Self-Employed (Not Incorporated) | 0 | 0.0% |
| Not-for-profit Organizations | 0 | 0.0% |
| Local Government Employees | 34 | 12.6% |
| State Government Employees | 0 | 0.0% |
| Federal Government Employees | 37 | 13.7% |
| Unpaid Family Workers | 0 | 0.0% |
| Total | 271 | 100.0% |
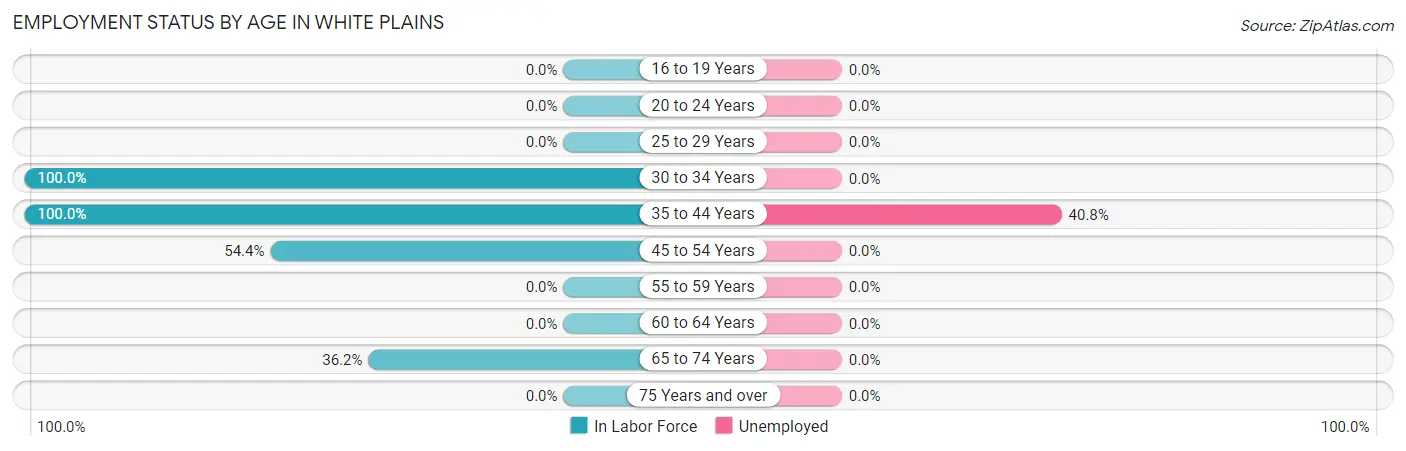
Employment Status by Age in White Plains
According to the labor force statistics for White Plains, out of the total population over 16 years of age (762), 43.4% or 331 individuals are in the labor force, with 18.1% or 60 of them unemployed. The age group with the highest labor force participation rate is 30 to 34 years, with 100.0% or 21 individuals in the labor force. Within the labor force, the 35 to 44 years age range has the highest percentage of unemployed individuals, with 40.8% or 60 of them being unemployed.
| Age Bracket | In Labor Force | Unemployed |
| 16 to 19 Years | 0 (0.0%) | 0 (0.0%) |
| 20 to 24 Years | 0 (0.0%) | 0 (0.0%) |
| 25 to 29 Years | 0 (0.0%) | 0 (0.0%) |
| 30 to 34 Years | 21 (100.0%) | 0 (0.0%) |
| 35 to 44 Years | 147 (100.0%) | 60 (40.8%) |
| 45 to 54 Years | 129 (54.4%) | 0 (0.0%) |
| 55 to 59 Years | 0 (0.0%) | 0 (0.0%) |
| 60 to 64 Years | 0 (0.0%) | 0 (0.0%) |
| 65 to 74 Years | 34 (36.2%) | 0 (0.0%) |
| 75 Years and over | 0 (0.0%) | 0 (0.0%) |
| Total | 331 (43.4%) | 60 (18.1%) |
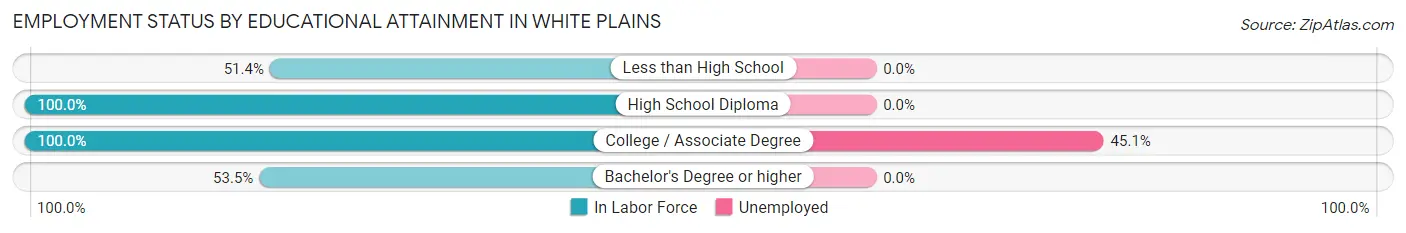
Employment Status by Educational Attainment in White Plains
According to labor force statistics for White Plains, 69.9% of individuals (297) out of the total population between 25 and 64 years of age (425) are in the labor force, with 20.2% or 60 of them being unemployed. The group with the highest labor force participation rate are those with the educational attainment of high school diploma, with 100.0% or 27 individuals in the labor force. Within the labor force, individuals with college / associate degree education have the highest percentage of unemployment, with 45.1% or 60 of them being unemployed.
| Educational Attainment | In Labor Force | Unemployed |
| Less than High School | 114 (51.4%) | 0 (0.0%) |
| High School Diploma | 27 (100.0%) | 0 (0.0%) |
| College / Associate Degree | 133 (100.0%) | 60 (45.1%) |
| Bachelor's Degree or higher | 23 (53.5%) | 0 (0.0%) |
| Total | 297 (69.9%) | 86 (20.2%) |
Employment Occupations by Sex in White Plains
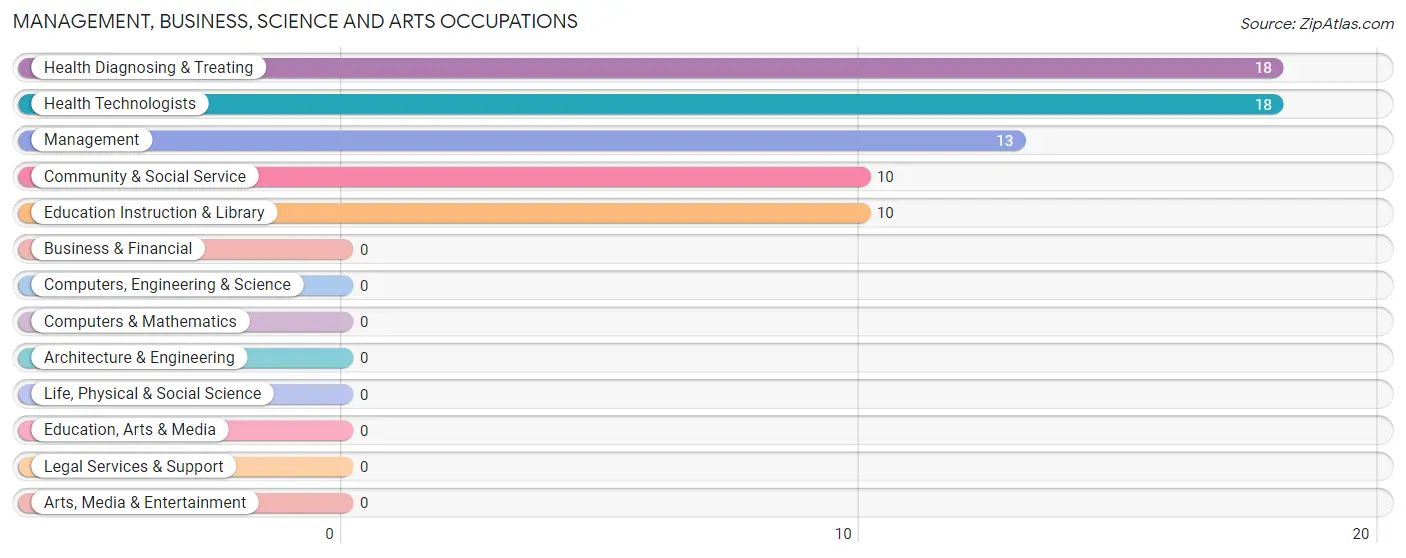
Management, Business, Science and Arts Occupations
The most common Management, Business, Science and Arts occupations in White Plains are Health Diagnosing & Treating (18 | 6.6%), Health Technologists (18 | 6.6%), Management (13 | 4.8%), Community & Social Service (10 | 3.7%), and Education Instruction & Library (10 | 3.7%).
Management, Business, Science and Arts Occupations by Sex
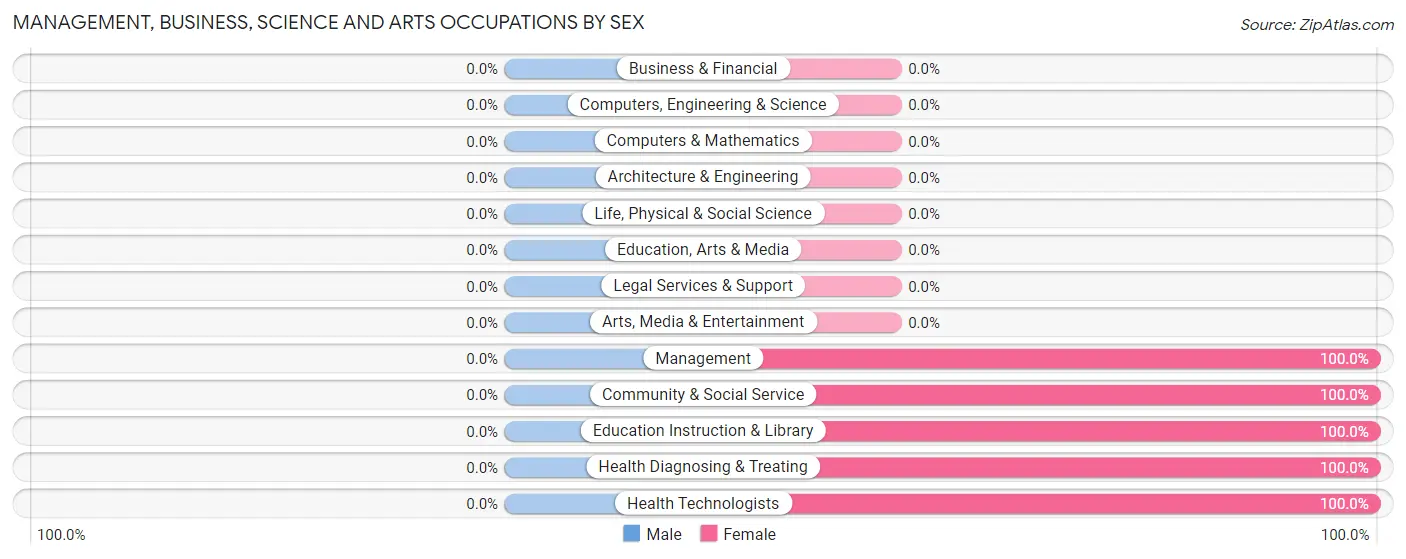
| Occupation | Male | Female |
| Management | 0 (0.0%) | 13 (100.0%) |
| Business & Financial | 0 (0.0%) | 0 (0.0%) |
| Computers, Engineering & Science | 0 (0.0%) | 0 (0.0%) |
| Computers & Mathematics | 0 (0.0%) | 0 (0.0%) |
| Architecture & Engineering | 0 (0.0%) | 0 (0.0%) |
| Life, Physical & Social Science | 0 (0.0%) | 0 (0.0%) |
| Community & Social Service | 0 (0.0%) | 10 (100.0%) |
| Education, Arts & Media | 0 (0.0%) | 0 (0.0%) |
| Legal Services & Support | 0 (0.0%) | 0 (0.0%) |
| Education Instruction & Library | 0 (0.0%) | 10 (100.0%) |
| Arts, Media & Entertainment | 0 (0.0%) | 0 (0.0%) |
| Health Diagnosing & Treating | 0 (0.0%) | 18 (100.0%) |
| Health Technologists | 0 (0.0%) | 18 (100.0%) |
| Total (Category) | 0 (0.0%) | 41 (100.0%) |
| Total (Overall) | 100 (36.9%) | 171 (63.1%) |
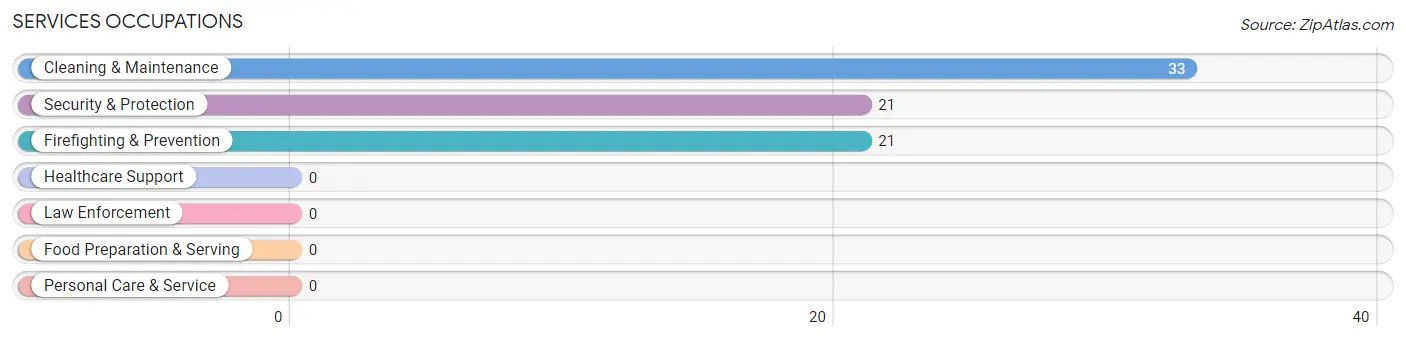
Services Occupations
The most common Services occupations in White Plains are Cleaning & Maintenance (33 | 12.2%), Security & Protection (21 | 7.7%), and Firefighting & Prevention (21 | 7.7%).
Services Occupations by Sex
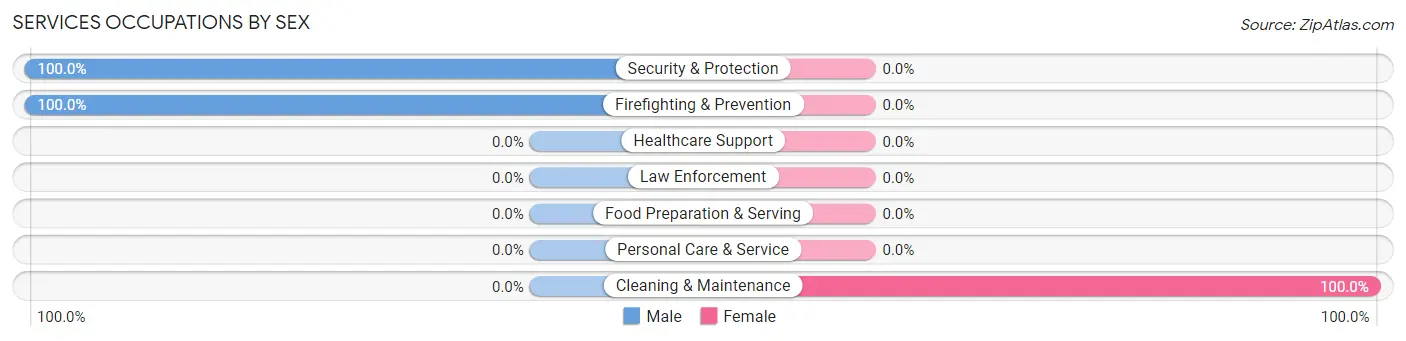
| Occupation | Male | Female |
| Healthcare Support | 0 (0.0%) | 0 (0.0%) |
| Security & Protection | 21 (100.0%) | 0 (0.0%) |
| Firefighting & Prevention | 21 (100.0%) | 0 (0.0%) |
| Law Enforcement | 0 (0.0%) | 0 (0.0%) |
| Food Preparation & Serving | 0 (0.0%) | 0 (0.0%) |
| Cleaning & Maintenance | 0 (0.0%) | 33 (100.0%) |
| Personal Care & Service | 0 (0.0%) | 0 (0.0%) |
| Total (Category) | 21 (38.9%) | 33 (61.1%) |
| Total (Overall) | 100 (36.9%) | 171 (63.1%) |
Sales and Office Occupations
The most common Sales and Office occupations in White Plains are Office & Administration (24 | 8.9%), and Sales & Related (9 | 3.3%).
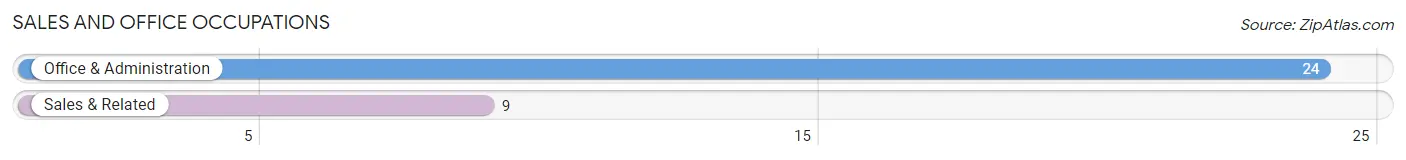
Sales and Office Occupations by Sex
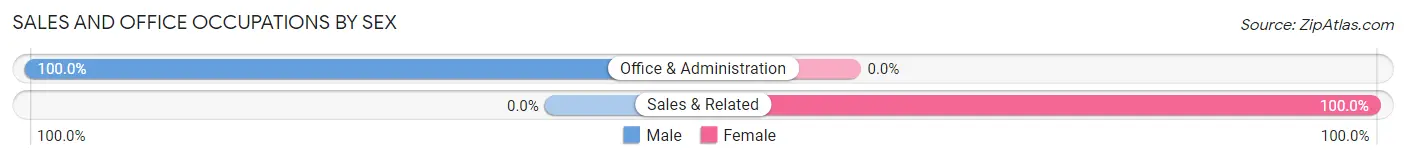
| Occupation | Male | Female |
| Sales & Related | 0 (0.0%) | 9 (100.0%) |
| Office & Administration | 24 (100.0%) | 0 (0.0%) |
| Total (Category) | 24 (72.7%) | 9 (27.3%) |
| Total (Overall) | 100 (36.9%) | 171 (63.1%) |
Natural Resources, Construction and Maintenance Occupations
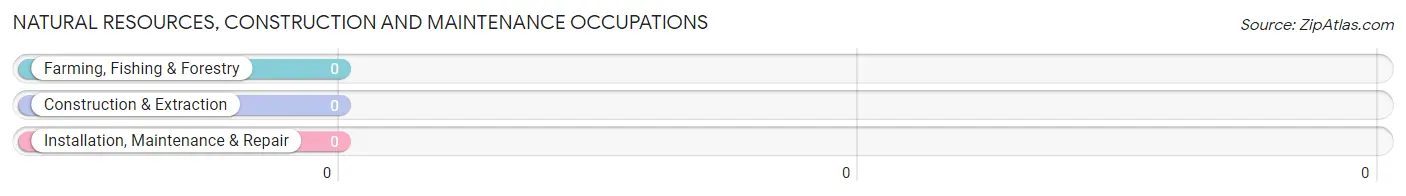
Natural Resources, Construction and Maintenance Occupations by Sex
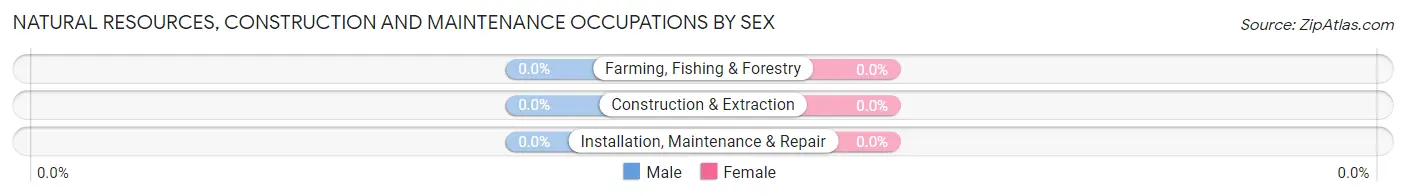
| Occupation | Male | Female |
| Farming, Fishing & Forestry | 0 (0.0%) | 0 (0.0%) |
| Construction & Extraction | 0 (0.0%) | 0 (0.0%) |
| Installation, Maintenance & Repair | 0 (0.0%) | 0 (0.0%) |
| Total (Category) | 0 (0.0%) | 0 (0.0%) |
| Total (Overall) | 100 (36.9%) | 171 (63.1%) |
Production, Transportation and Moving Occupations
The most common Production, Transportation and Moving occupations in White Plains are Production (103 | 38.0%), and Material Moving (40 | 14.8%).
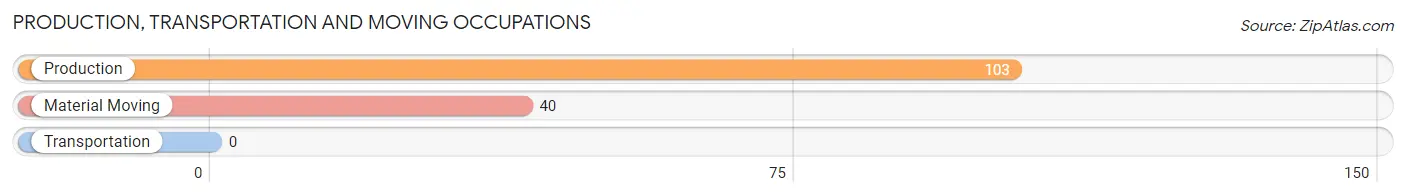
Production, Transportation and Moving Occupations by Sex
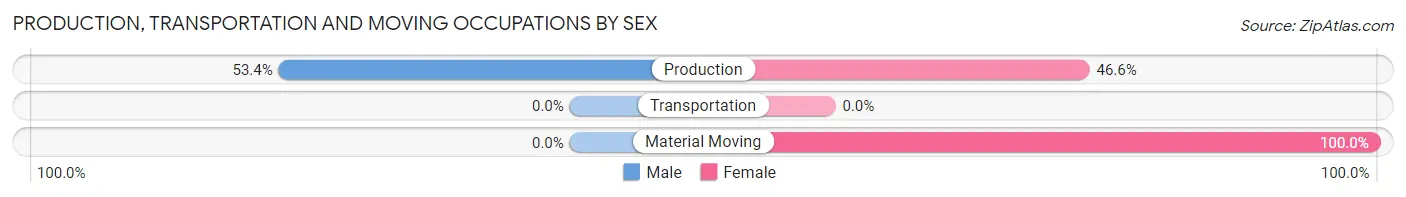
| Occupation | Male | Female |
| Production | 55 (53.4%) | 48 (46.6%) |
| Transportation | 0 (0.0%) | 0 (0.0%) |
| Material Moving | 0 (0.0%) | 40 (100.0%) |
| Total (Category) | 55 (38.5%) | 88 (61.5%) |
| Total (Overall) | 100 (36.9%) | 171 (63.1%) |
Employment Industries by Sex in White Plains
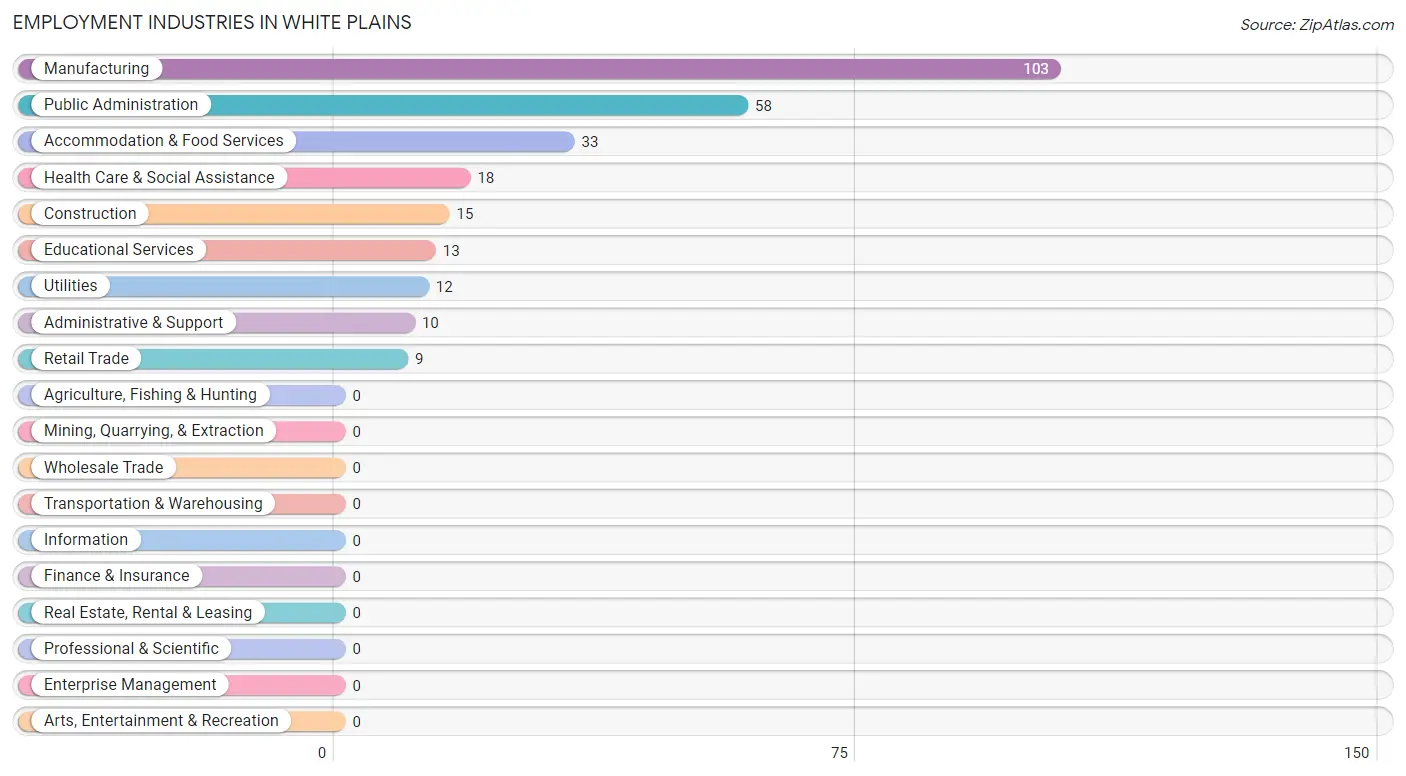
Employment Industries in White Plains
The major employment industries in White Plains include Manufacturing (103 | 38.0%), Public Administration (58 | 21.4%), Accommodation & Food Services (33 | 12.2%), Health Care & Social Assistance (18 | 6.6%), and Construction (15 | 5.5%).
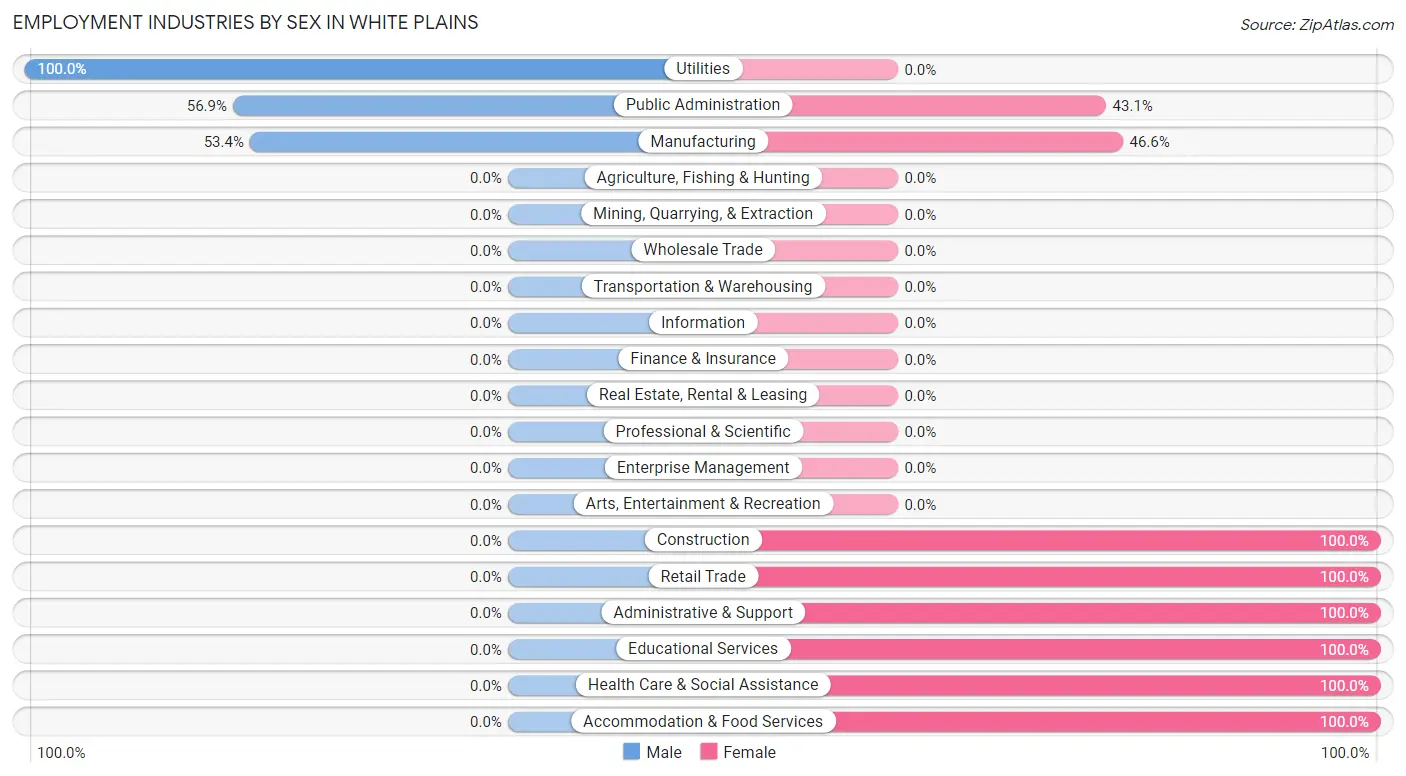
Employment Industries by Sex in White Plains
The White Plains industries that see more men than women are Utilities (100.0%), Public Administration (56.9%), and Manufacturing (53.4%), whereas the industries that tend to have a higher number of women are Construction (100.0%), Retail Trade (100.0%), and Administrative & Support (100.0%).
| Industry | Male | Female |
| Agriculture, Fishing & Hunting | 0 (0.0%) | 0 (0.0%) |
| Mining, Quarrying, & Extraction | 0 (0.0%) | 0 (0.0%) |
| Construction | 0 (0.0%) | 15 (100.0%) |
| Manufacturing | 55 (53.4%) | 48 (46.6%) |
| Wholesale Trade | 0 (0.0%) | 0 (0.0%) |
| Retail Trade | 0 (0.0%) | 9 (100.0%) |
| Transportation & Warehousing | 0 (0.0%) | 0 (0.0%) |
| Utilities | 12 (100.0%) | 0 (0.0%) |
| Information | 0 (0.0%) | 0 (0.0%) |
| Finance & Insurance | 0 (0.0%) | 0 (0.0%) |
| Real Estate, Rental & Leasing | 0 (0.0%) | 0 (0.0%) |
| Professional & Scientific | 0 (0.0%) | 0 (0.0%) |
| Enterprise Management | 0 (0.0%) | 0 (0.0%) |
| Administrative & Support | 0 (0.0%) | 10 (100.0%) |
| Educational Services | 0 (0.0%) | 13 (100.0%) |
| Health Care & Social Assistance | 0 (0.0%) | 18 (100.0%) |
| Arts, Entertainment & Recreation | 0 (0.0%) | 0 (0.0%) |
| Accommodation & Food Services | 0 (0.0%) | 33 (100.0%) |
| Public Administration | 33 (56.9%) | 25 (43.1%) |
| Total | 100 (36.9%) | 171 (63.1%) |
Education in White Plains
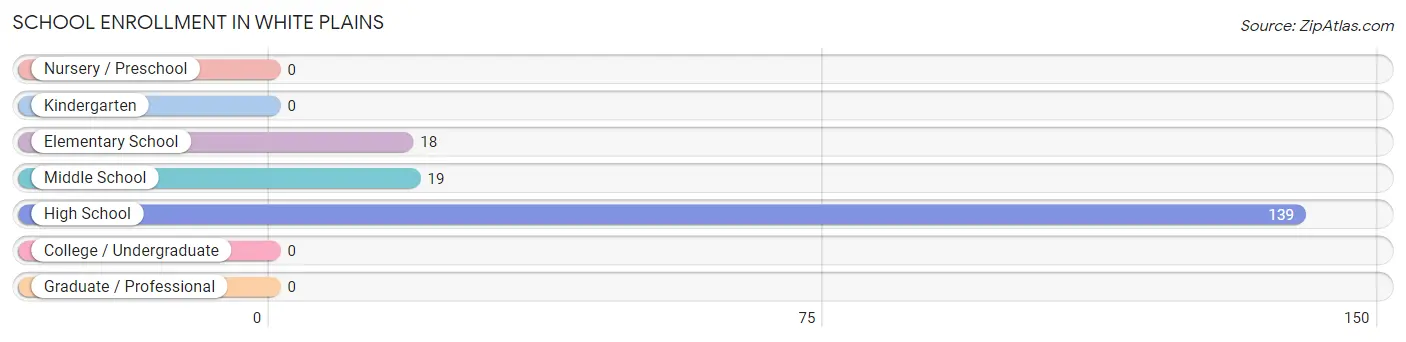
School Enrollment in White Plains
The most common levels of schooling among the 176 students in White Plains are high school (139 | 79.0%), middle school (19 | 10.8%), and elementary school (18 | 10.2%).
| School Level | # Students | % Students |
| Nursery / Preschool | 0 | 0.0% |
| Kindergarten | 0 | 0.0% |
| Elementary School | 18 | 10.2% |
| Middle School | 19 | 10.8% |
| High School | 139 | 79.0% |
| College / Undergraduate | 0 | 0.0% |
| Graduate / Professional | 0 | 0.0% |
| Total | 176 | 100.0% |
School Enrollment by Age by Funding Source in White Plains
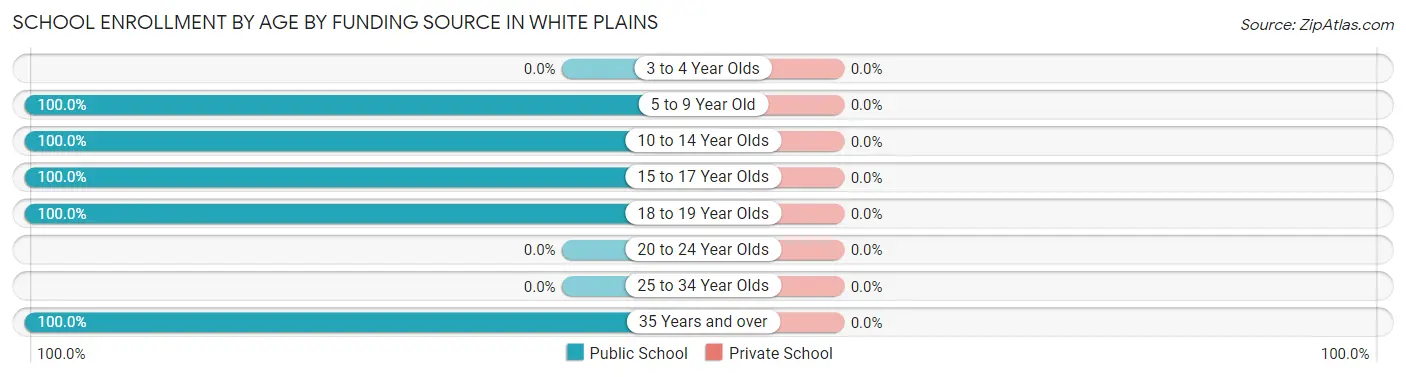
| Age Bracket | Public School | Private School |
| 3 to 4 Year Olds | 0 (0.0%) | 0 (0.0%) |
| 5 to 9 Year Old | 18 (100.0%) | 0 (0.0%) |
| 10 to 14 Year Olds | 19 (100.0%) | 0 (0.0%) |
| 15 to 17 Year Olds | 115 (100.0%) | 0 (0.0%) |
| 18 to 19 Year Olds | 12 (100.0%) | 0 (0.0%) |
| 20 to 24 Year Olds | 0 (0.0%) | 0 (0.0%) |
| 25 to 34 Year Olds | 0 (0.0%) | 0 (0.0%) |
| 35 Years and over | 12 (100.0%) | 0 (0.0%) |
| Total | 176 (100.0%) | 0 (0.0%) |
Educational Attainment by Field of Study in White Plains
Business (33 | 43.4%), science & technology (30 | 39.5%), and education (13 | 17.1%) are the most common fields of study among 76 individuals in White Plains who have obtained a bachelor's degree or higher.
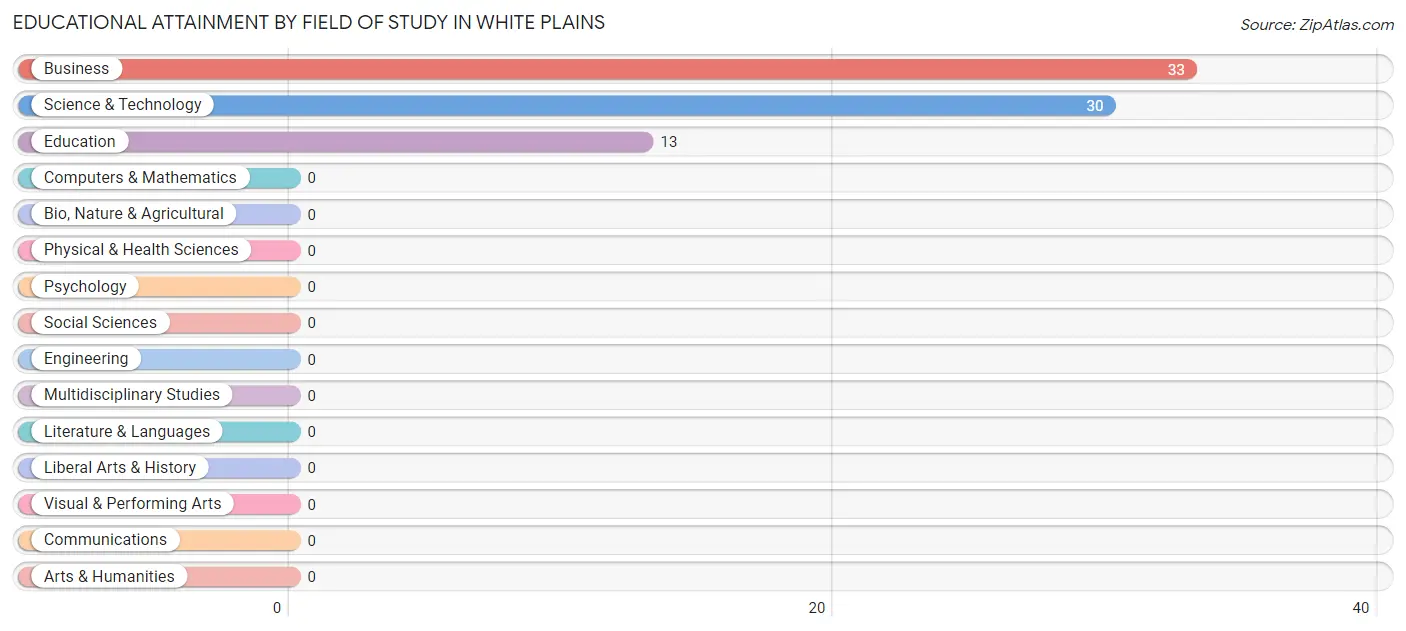
| Field of Study | # Graduates | % Graduates |
| Computers & Mathematics | 0 | 0.0% |
| Bio, Nature & Agricultural | 0 | 0.0% |
| Physical & Health Sciences | 0 | 0.0% |
| Psychology | 0 | 0.0% |
| Social Sciences | 0 | 0.0% |
| Engineering | 0 | 0.0% |
| Multidisciplinary Studies | 0 | 0.0% |
| Science & Technology | 30 | 39.5% |
| Business | 33 | 43.4% |
| Education | 13 | 17.1% |
| Literature & Languages | 0 | 0.0% |
| Liberal Arts & History | 0 | 0.0% |
| Visual & Performing Arts | 0 | 0.0% |
| Communications | 0 | 0.0% |
| Arts & Humanities | 0 | 0.0% |
| Total | 76 | 100.0% |
Transportation & Commute in White Plains
Vehicle Availability by Sex in White Plains
The most prevalent vehicle ownership categories in White Plains are males with 5 or more vehicles (36, accounting for 36.0%) and females with 5 or more vehicles (33, making up 21.0%).
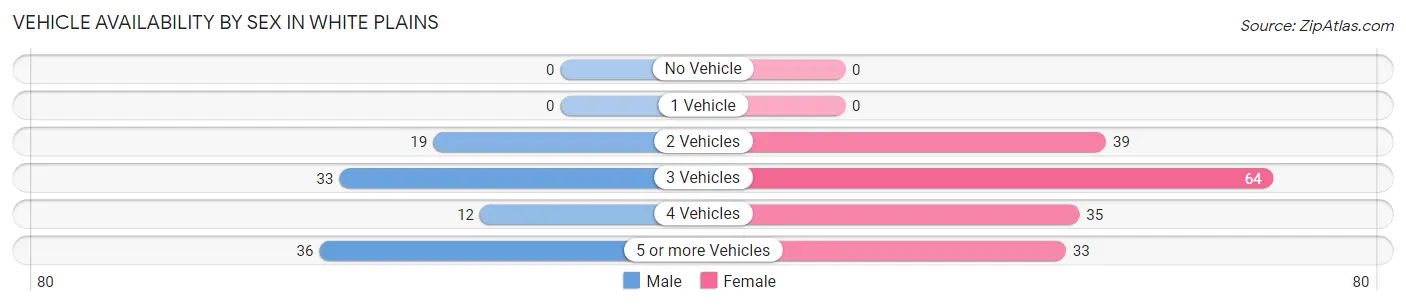
| Vehicles Available | Male | Female |
| No Vehicle | 0 (0.0%) | 0 (0.0%) |
| 1 Vehicle | 0 (0.0%) | 0 (0.0%) |
| 2 Vehicles | 19 (19.0%) | 39 (22.8%) |
| 3 Vehicles | 33 (33.0%) | 64 (37.4%) |
| 4 Vehicles | 12 (12.0%) | 35 (20.5%) |
| 5 or more Vehicles | 36 (36.0%) | 33 (19.3%) |
| Total | 100 (100.0%) | 171 (100.0%) |
Commute Time in White Plains
The most frequently occuring commute durations in White Plains are 35 to 39 minutes (61 commuters, 22.5%), 20 to 24 minutes (49 commuters, 18.1%), and 90 or more minutes (36 commuters, 13.3%).
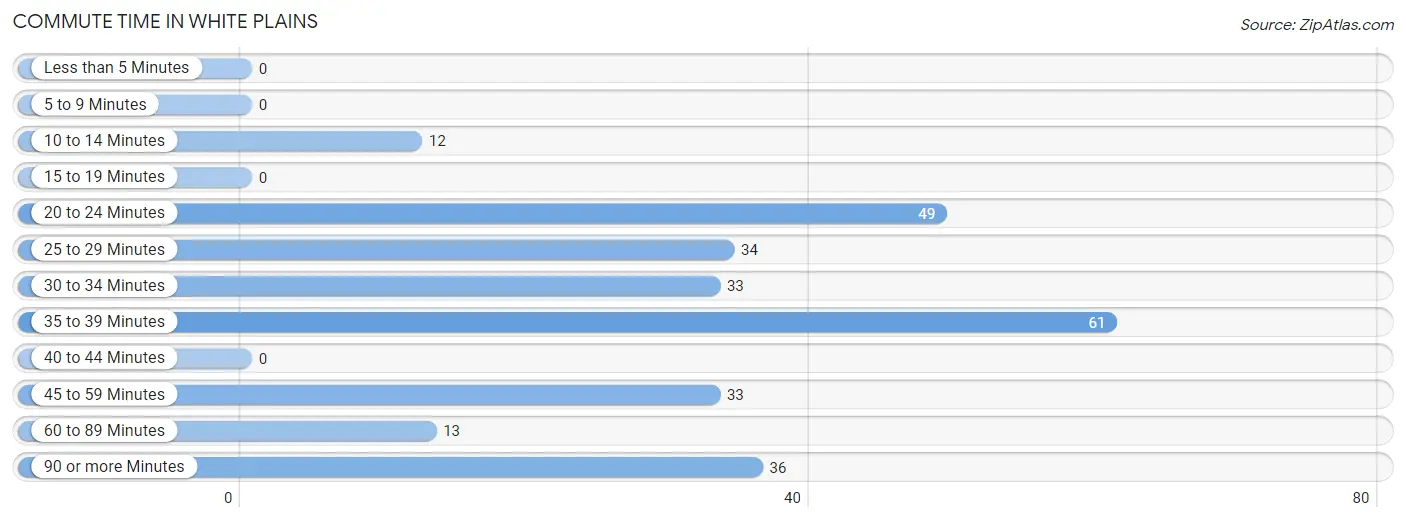
| Commute Time | # Commuters | % Commuters |
| Less than 5 Minutes | 0 | 0.0% |
| 5 to 9 Minutes | 0 | 0.0% |
| 10 to 14 Minutes | 12 | 4.4% |
| 15 to 19 Minutes | 0 | 0.0% |
| 20 to 24 Minutes | 49 | 18.1% |
| 25 to 29 Minutes | 34 | 12.6% |
| 30 to 34 Minutes | 33 | 12.2% |
| 35 to 39 Minutes | 61 | 22.5% |
| 40 to 44 Minutes | 0 | 0.0% |
| 45 to 59 Minutes | 33 | 12.2% |
| 60 to 89 Minutes | 13 | 4.8% |
| 90 or more Minutes | 36 | 13.3% |
Commute Time by Sex in White Plains
The most common commute times in White Plains are 90 or more minutes (36 commuters, 36.0%) for males and 25 to 29 minutes (34 commuters, 19.9%) for females.
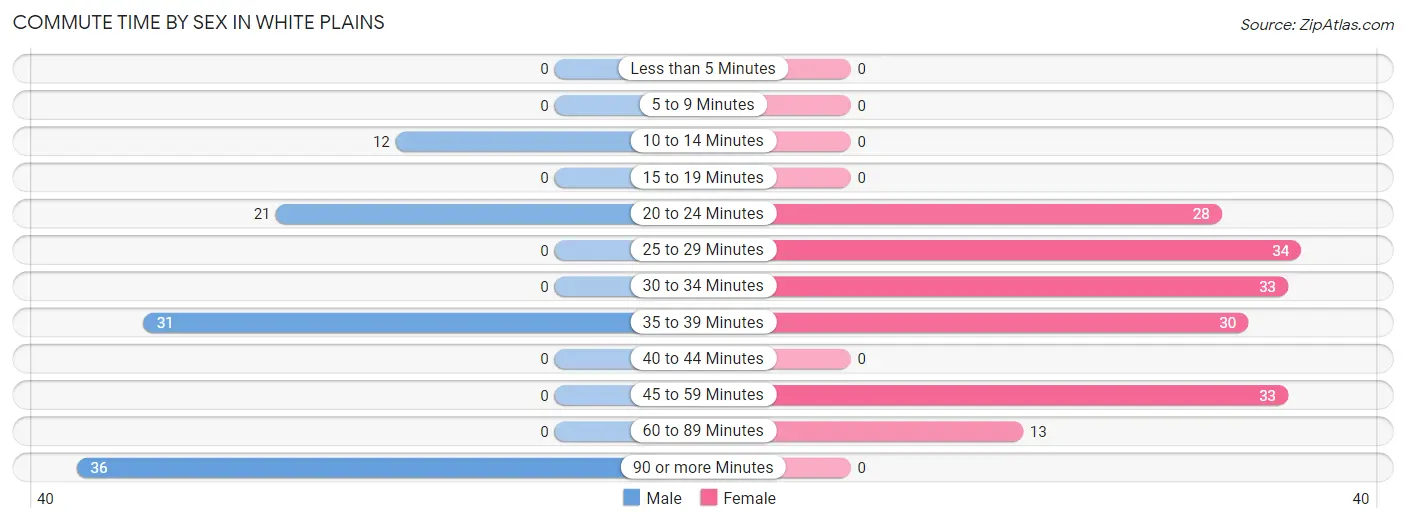
| Commute Time | Male | Female |
| Less than 5 Minutes | 0 (0.0%) | 0 (0.0%) |
| 5 to 9 Minutes | 0 (0.0%) | 0 (0.0%) |
| 10 to 14 Minutes | 12 (12.0%) | 0 (0.0%) |
| 15 to 19 Minutes | 0 (0.0%) | 0 (0.0%) |
| 20 to 24 Minutes | 21 (21.0%) | 28 (16.4%) |
| 25 to 29 Minutes | 0 (0.0%) | 34 (19.9%) |
| 30 to 34 Minutes | 0 (0.0%) | 33 (19.3%) |
| 35 to 39 Minutes | 31 (31.0%) | 30 (17.5%) |
| 40 to 44 Minutes | 0 (0.0%) | 0 (0.0%) |
| 45 to 59 Minutes | 0 (0.0%) | 33 (19.3%) |
| 60 to 89 Minutes | 0 (0.0%) | 13 (7.6%) |
| 90 or more Minutes | 36 (36.0%) | 0 (0.0%) |
Time of Departure to Work by Sex in White Plains
The most frequent times of departure to work in White Plains are 12:00 AM to 4:59 AM (36, 36.0%) for males and 5:30 AM to 5:59 AM (63, 36.8%) for females.
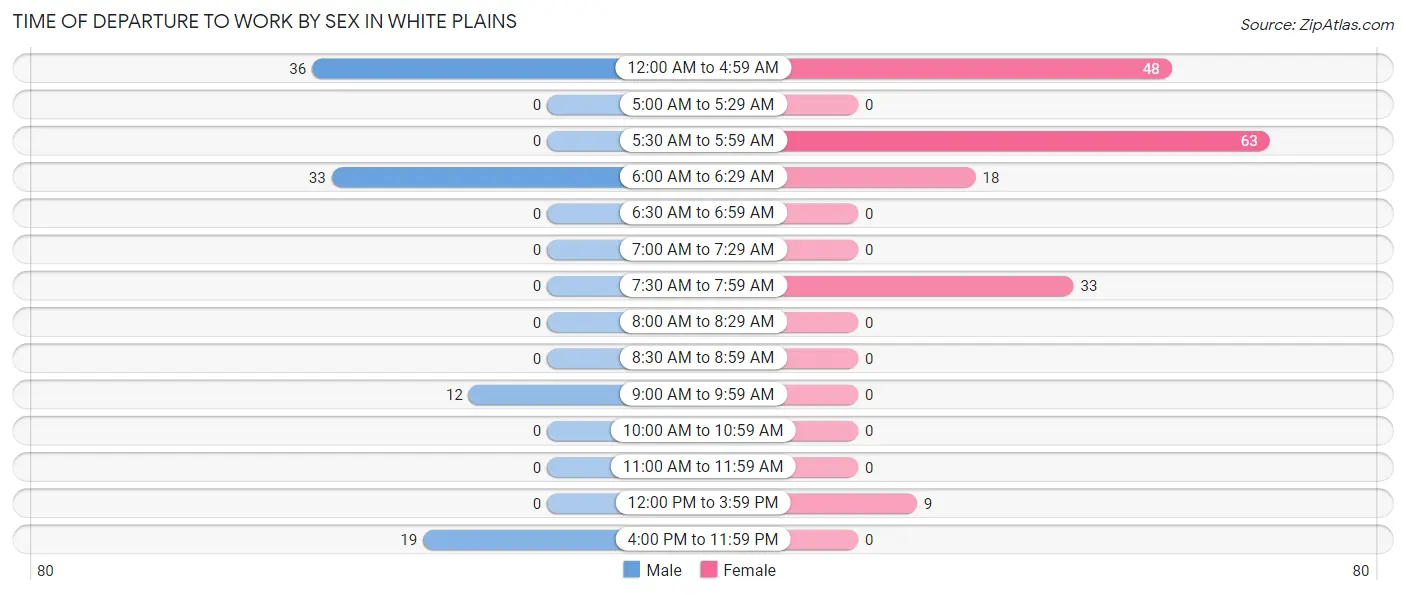
| Time of Departure | Male | Female |
| 12:00 AM to 4:59 AM | 36 (36.0%) | 48 (28.1%) |
| 5:00 AM to 5:29 AM | 0 (0.0%) | 0 (0.0%) |
| 5:30 AM to 5:59 AM | 0 (0.0%) | 63 (36.8%) |
| 6:00 AM to 6:29 AM | 33 (33.0%) | 18 (10.5%) |
| 6:30 AM to 6:59 AM | 0 (0.0%) | 0 (0.0%) |
| 7:00 AM to 7:29 AM | 0 (0.0%) | 0 (0.0%) |
| 7:30 AM to 7:59 AM | 0 (0.0%) | 33 (19.3%) |
| 8:00 AM to 8:29 AM | 0 (0.0%) | 0 (0.0%) |
| 8:30 AM to 8:59 AM | 0 (0.0%) | 0 (0.0%) |
| 9:00 AM to 9:59 AM | 12 (12.0%) | 0 (0.0%) |
| 10:00 AM to 10:59 AM | 0 (0.0%) | 0 (0.0%) |
| 11:00 AM to 11:59 AM | 0 (0.0%) | 0 (0.0%) |
| 12:00 PM to 3:59 PM | 0 (0.0%) | 9 (5.3%) |
| 4:00 PM to 11:59 PM | 19 (19.0%) | 0 (0.0%) |
| Total | 100 (100.0%) | 171 (100.0%) |
Housing Occupancy in White Plains
Occupancy by Ownership in White Plains
Of the total 289 dwellings in White Plains, owner-occupied units account for 289 (100.0%), while renter-occupied units make up 0 (0.0%).
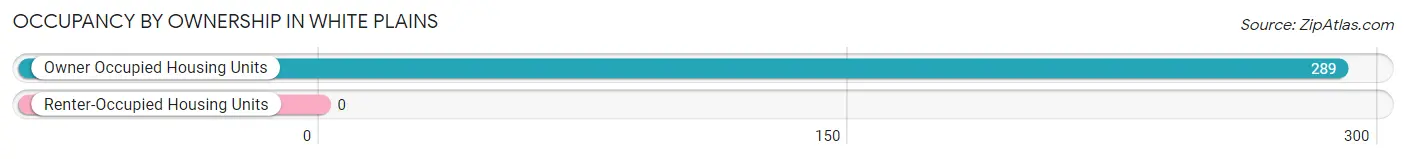
| Occupancy | # Housing Units | % Housing Units |
| Owner Occupied Housing Units | 289 | 100.0% |
| Renter-Occupied Housing Units | 0 | 0.0% |
| Total Occupied Housing Units | 289 | 100.0% |
Occupancy by Household Size in White Plains
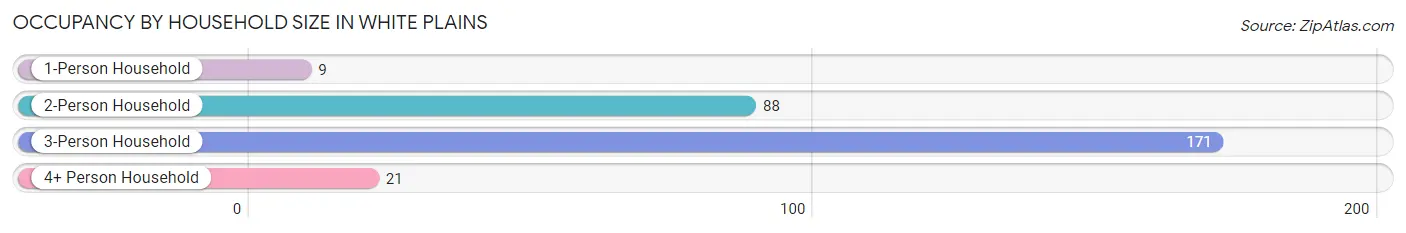
| Household Size | # Housing Units | % Housing Units |
| 1-Person Household | 9 | 3.1% |
| 2-Person Household | 88 | 30.4% |
| 3-Person Household | 171 | 59.2% |
| 4+ Person Household | 21 | 7.3% |
| Total Housing Units | 289 | 100.0% |
Occupancy by Ownership by Household Size in White Plains
| Household Size | Owner-occupied | Renter-occupied |
| 1-Person Household | 9 (100.0%) | 0 (0.0%) |
| 2-Person Household | 88 (100.0%) | 0 (0.0%) |
| 3-Person Household | 171 (100.0%) | 0 (0.0%) |
| 4+ Person Household | 21 (100.0%) | 0 (0.0%) |
| Total Housing Units | 289 (100.0%) | 0 (0.0%) |
Occupancy by Educational Attainment in White Plains
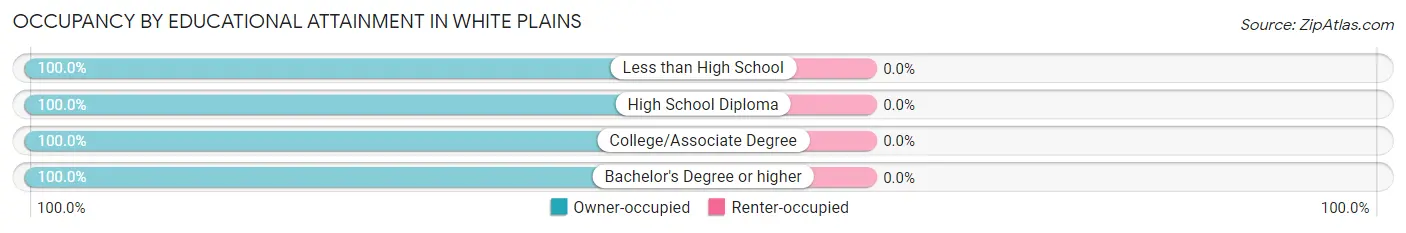
| Household Size | Owner-occupied | Renter-occupied |
| Less than High School | 128 (100.0%) | 0 (0.0%) |
| High School Diploma | 57 (100.0%) | 0 (0.0%) |
| College/Associate Degree | 48 (100.0%) | 0 (0.0%) |
| Bachelor's Degree or higher | 56 (100.0%) | 0 (0.0%) |
Occupancy by Age of Householder in White Plains
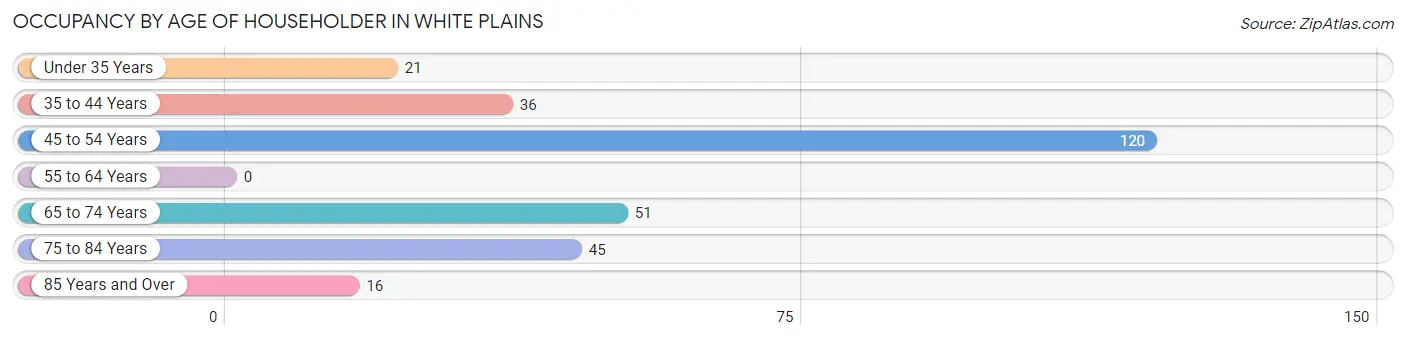
| Age Bracket | # Households | % Households |
| Under 35 Years | 21 | 7.3% |
| 35 to 44 Years | 36 | 12.5% |
| 45 to 54 Years | 120 | 41.5% |
| 55 to 64 Years | 0 | 0.0% |
| 65 to 74 Years | 51 | 17.6% |
| 75 to 84 Years | 45 | 15.6% |
| 85 Years and Over | 16 | 5.5% |
| Total | 289 | 100.0% |
Housing Finances in White Plains
Median Income by Occupancy in White Plains
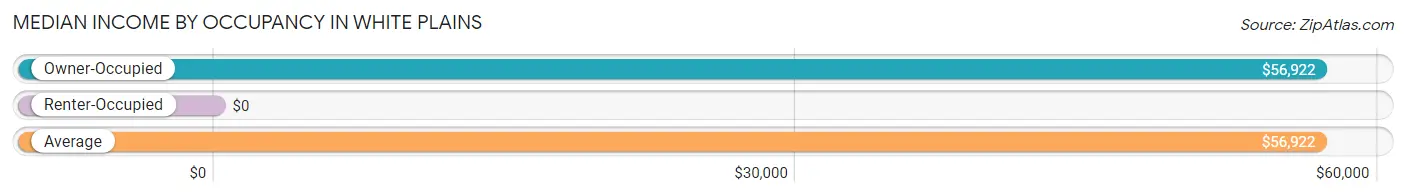
| Occupancy Type | # Households | Median Income |
| Owner-Occupied | 289 (100.0%) | $56,922 |
| Renter-Occupied | 0 (0.0%) | $0 |
| Average | 289 (100.0%) | $56,922 |
Occupancy by Householder Income Bracket in White Plains
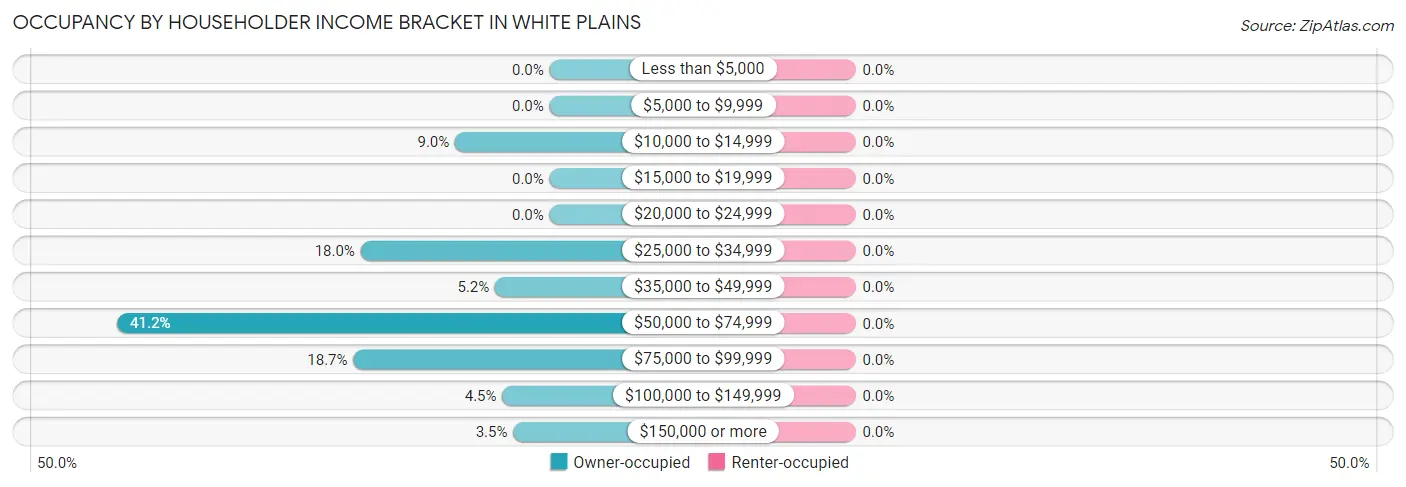
| Income Bracket | Owner-occupied | Renter-occupied |
| Less than $5,000 | 0 (0.0%) | 0 (0.0%) |
| $5,000 to $9,999 | 0 (0.0%) | 0 (0.0%) |
| $10,000 to $14,999 | 26 (9.0%) | 0 (0.0%) |
| $15,000 to $19,999 | 0 (0.0%) | 0 (0.0%) |
| $20,000 to $24,999 | 0 (0.0%) | 0 (0.0%) |
| $25,000 to $34,999 | 52 (18.0%) | 0 (0.0%) |
| $35,000 to $49,999 | 15 (5.2%) | 0 (0.0%) |
| $50,000 to $74,999 | 119 (41.2%) | 0 (0.0%) |
| $75,000 to $99,999 | 54 (18.7%) | 0 (0.0%) |
| $100,000 to $149,999 | 13 (4.5%) | 0 (0.0%) |
| $150,000 or more | 10 (3.5%) | 0 (0.0%) |
| Total | 289 (100.0%) | 0 (0.0%) |
Monthly Housing Cost Tiers in White Plains
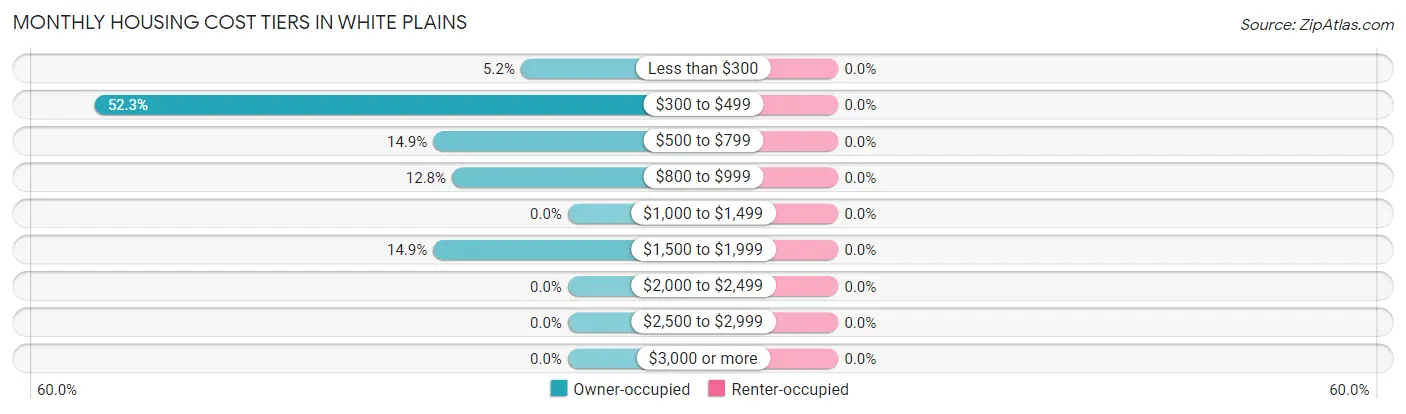
| Monthly Cost | Owner-occupied | Renter-occupied |
| Less than $300 | 15 (5.2%) | 0 (0.0%) |
| $300 to $499 | 151 (52.2%) | 0 (0.0%) |
| $500 to $799 | 43 (14.9%) | 0 (0.0%) |
| $800 to $999 | 37 (12.8%) | 0 (0.0%) |
| $1,000 to $1,499 | 0 (0.0%) | 0 (0.0%) |
| $1,500 to $1,999 | 43 (14.9%) | 0 (0.0%) |
| $2,000 to $2,499 | 0 (0.0%) | 0 (0.0%) |
| $2,500 to $2,999 | 0 (0.0%) | 0 (0.0%) |
| $3,000 or more | 0 (0.0%) | 0 (0.0%) |
| Total | 289 (100.0%) | 0 (0.0%) |
Physical Housing Characteristics in White Plains
Housing Structures in White Plains
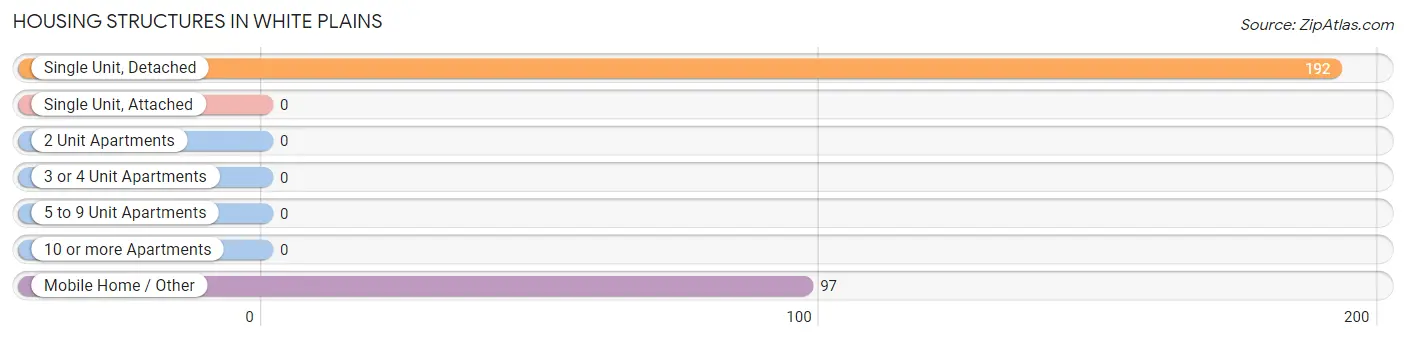
| Structure Type | # Housing Units | % Housing Units |
| Single Unit, Detached | 192 | 66.4% |
| Single Unit, Attached | 0 | 0.0% |
| 2 Unit Apartments | 0 | 0.0% |
| 3 or 4 Unit Apartments | 0 | 0.0% |
| 5 to 9 Unit Apartments | 0 | 0.0% |
| 10 or more Apartments | 0 | 0.0% |
| Mobile Home / Other | 97 | 33.6% |
| Total | 289 | 100.0% |
Housing Structures by Occupancy in White Plains
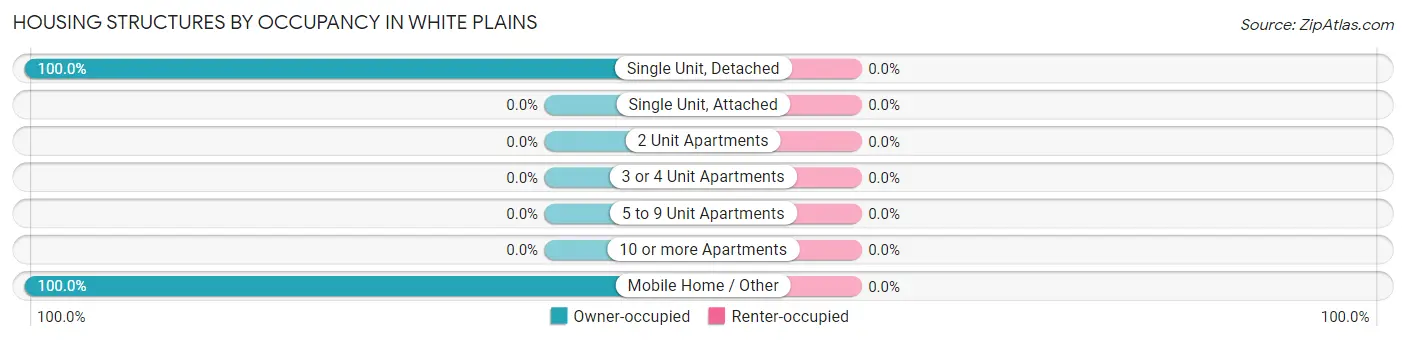
| Structure Type | Owner-occupied | Renter-occupied |
| Single Unit, Detached | 192 (100.0%) | 0 (0.0%) |
| Single Unit, Attached | 0 (0.0%) | 0 (0.0%) |
| 2 Unit Apartments | 0 (0.0%) | 0 (0.0%) |
| 3 or 4 Unit Apartments | 0 (0.0%) | 0 (0.0%) |
| 5 to 9 Unit Apartments | 0 (0.0%) | 0 (0.0%) |
| 10 or more Apartments | 0 (0.0%) | 0 (0.0%) |
| Mobile Home / Other | 97 (100.0%) | 0 (0.0%) |
| Total | 289 (100.0%) | 0 (0.0%) |
Housing Structures by Number of Rooms in White Plains
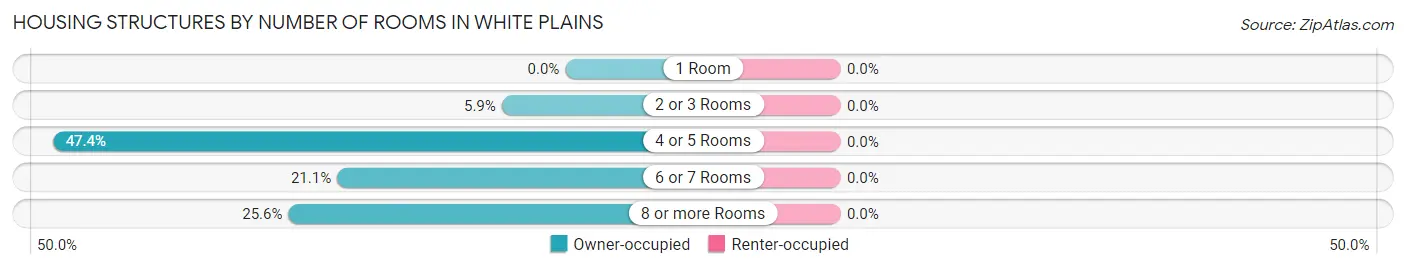
| Number of Rooms | Owner-occupied | Renter-occupied |
| 1 Room | 0 (0.0%) | 0 (0.0%) |
| 2 or 3 Rooms | 17 (5.9%) | 0 (0.0%) |
| 4 or 5 Rooms | 137 (47.4%) | 0 (0.0%) |
| 6 or 7 Rooms | 61 (21.1%) | 0 (0.0%) |
| 8 or more Rooms | 74 (25.6%) | 0 (0.0%) |
| Total | 289 (100.0%) | 0 (0.0%) |
Housing Structure by Heating Type in White Plains
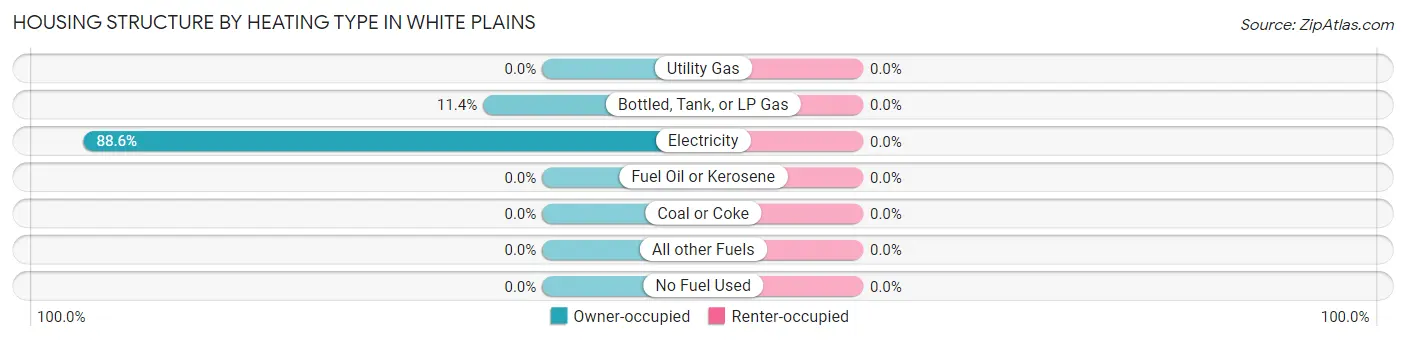
| Heating Type | Owner-occupied | Renter-occupied |
| Utility Gas | 0 (0.0%) | 0 (0.0%) |
| Bottled, Tank, or LP Gas | 33 (11.4%) | 0 (0.0%) |
| Electricity | 256 (88.6%) | 0 (0.0%) |
| Fuel Oil or Kerosene | 0 (0.0%) | 0 (0.0%) |
| Coal or Coke | 0 (0.0%) | 0 (0.0%) |
| All other Fuels | 0 (0.0%) | 0 (0.0%) |
| No Fuel Used | 0 (0.0%) | 0 (0.0%) |
| Total | 289 (100.0%) | 0 (0.0%) |
Household Vehicle Usage in White Plains
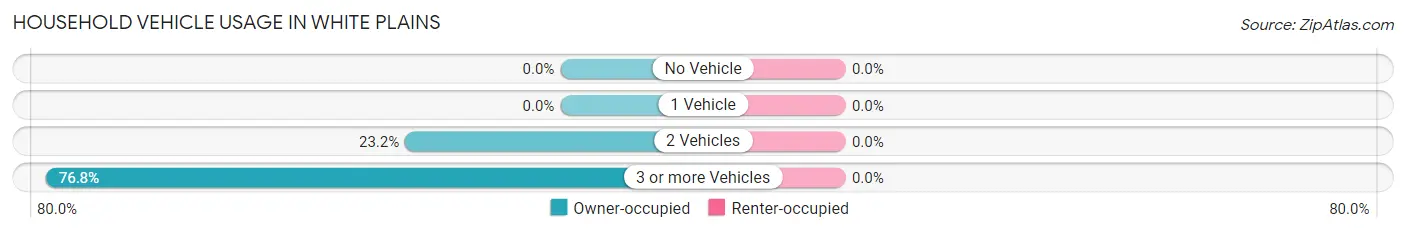
| Vehicles per Household | Owner-occupied | Renter-occupied |
| No Vehicle | 0 (0.0%) | 0 (0.0%) |
| 1 Vehicle | 0 (0.0%) | 0 (0.0%) |
| 2 Vehicles | 67 (23.2%) | 0 (0.0%) |
| 3 or more Vehicles | 222 (76.8%) | 0 (0.0%) |
| Total | 289 (100.0%) | 0 (0.0%) |
Real Estate & Mortgages in White Plains
Real Estate and Mortgage Overview in White Plains
| Characteristic | Without Mortgage | With Mortgage |
| Housing Units | 198 | 91 |
| Median Property Value | - | - |
| Median Household Income | $56,903 | $0 |
| Monthly Housing Costs | $406 | $0 |
| Real Estate Taxes | - | - |
Property Value by Mortgage Status in White Plains
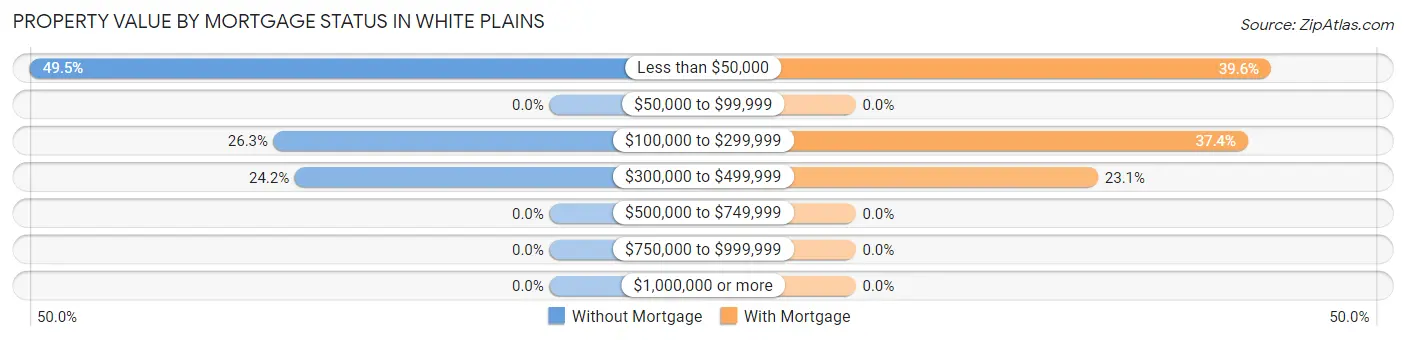
| Property Value | Without Mortgage | With Mortgage |
| Less than $50,000 | 98 (49.5%) | 36 (39.6%) |
| $50,000 to $99,999 | 0 (0.0%) | 0 (0.0%) |
| $100,000 to $299,999 | 52 (26.3%) | 34 (37.4%) |
| $300,000 to $499,999 | 48 (24.2%) | 21 (23.1%) |
| $500,000 to $749,999 | 0 (0.0%) | 0 (0.0%) |
| $750,000 to $999,999 | 0 (0.0%) | 0 (0.0%) |
| $1,000,000 or more | 0 (0.0%) | 0 (0.0%) |
| Total | 198 (100.0%) | 91 (100.0%) |
Household Income by Mortgage Status in White Plains
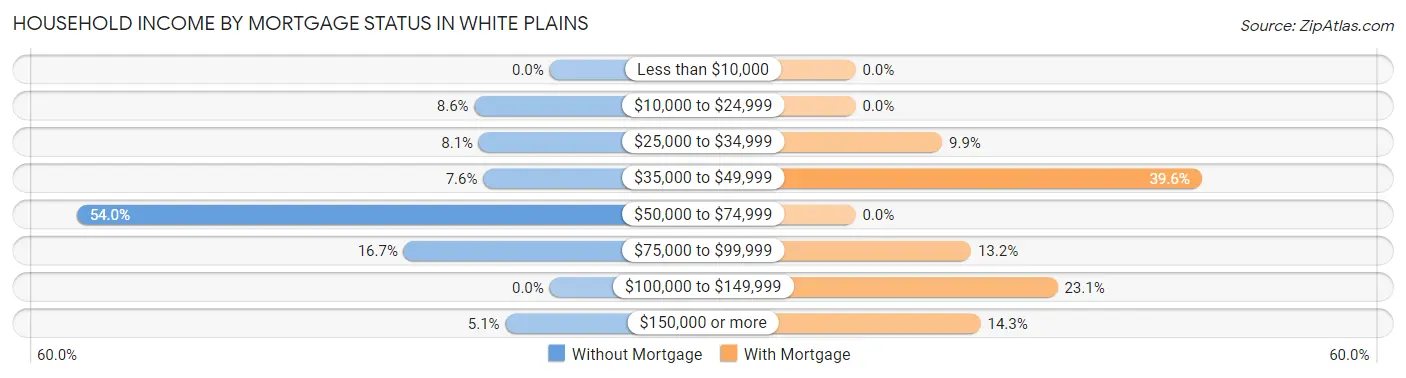
| Household Income | Without Mortgage | With Mortgage |
| Less than $10,000 | 0 (0.0%) | 0 (0.0%) |
| $10,000 to $24,999 | 17 (8.6%) | 0 (0.0%) |
| $25,000 to $34,999 | 16 (8.1%) | 9 (9.9%) |
| $35,000 to $49,999 | 15 (7.6%) | 36 (39.6%) |
| $50,000 to $74,999 | 107 (54.0%) | 0 (0.0%) |
| $75,000 to $99,999 | 33 (16.7%) | 12 (13.2%) |
| $100,000 to $149,999 | 0 (0.0%) | 21 (23.1%) |
| $150,000 or more | 10 (5.1%) | 13 (14.3%) |
| Total | 198 (100.0%) | 91 (100.0%) |
Property Value to Household Income Ratio in White Plains
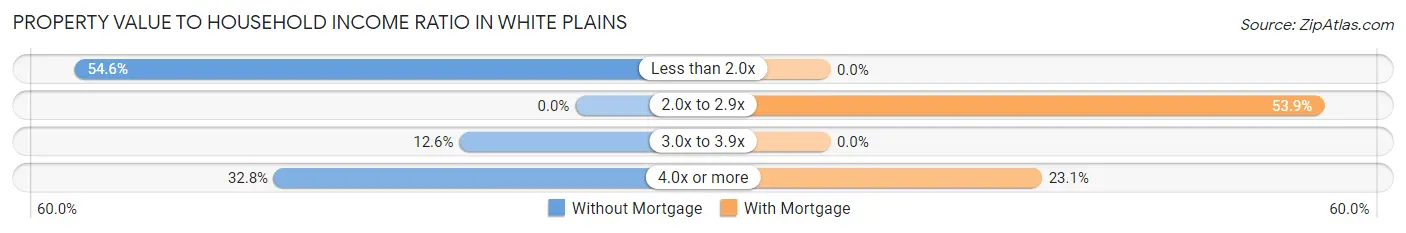
| Value-to-Income Ratio | Without Mortgage | With Mortgage |
| Less than 2.0x | 108 (54.5%) | 0 (0.0%) |
| 2.0x to 2.9x | 0 (0.0%) | 49 (53.8%) |
| 3.0x to 3.9x | 25 (12.6%) | 0 (0.0%) |
| 4.0x or more | 65 (32.8%) | 21 (23.1%) |
| Total | 198 (100.0%) | 91 (100.0%) |
Real Estate Taxes by Mortgage Status in White Plains
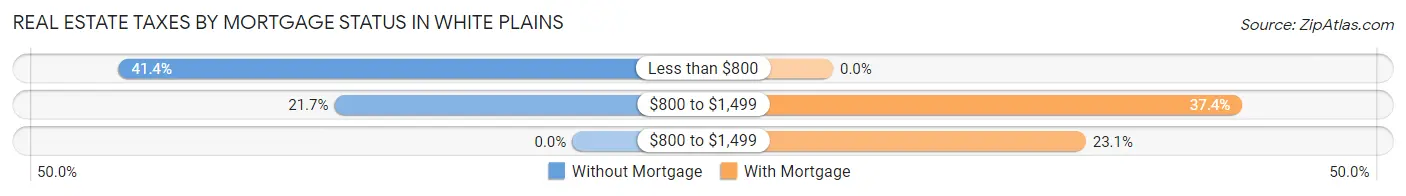
| Property Taxes | Without Mortgage | With Mortgage |
| Less than $800 | 82 (41.4%) | 0 (0.0%) |
| $800 to $1,499 | 43 (21.7%) | 34 (37.4%) |
| $800 to $1,499 | 0 (0.0%) | 21 (23.1%) |
| Total | 198 (100.0%) | 91 (100.0%) |
Health & Disability in White Plains
Health Insurance Coverage by Age in White Plains
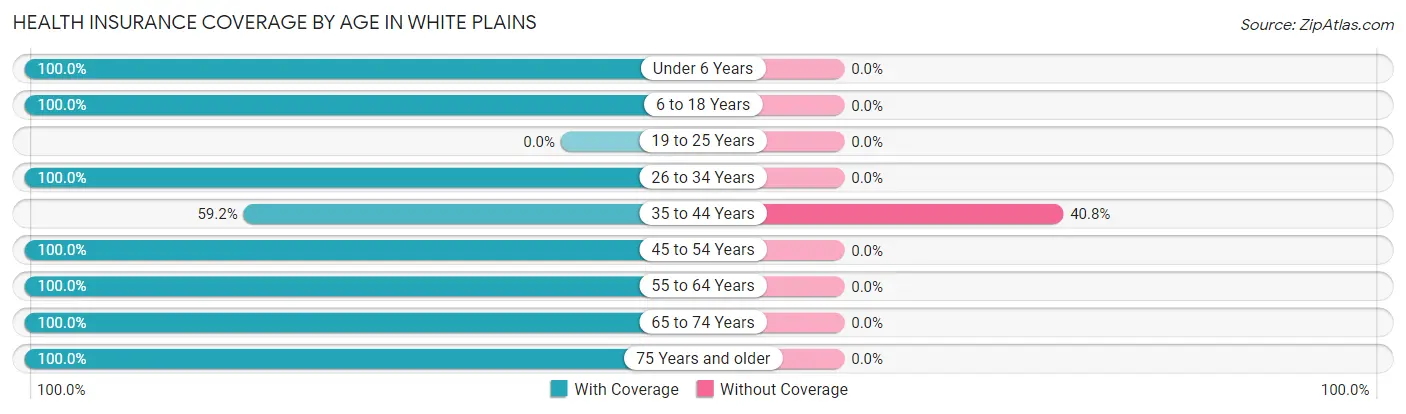
| Age Bracket | With Coverage | Without Coverage |
| Under 6 Years | 16 (100.0%) | 0 (0.0%) |
| 6 to 18 Years | 164 (100.0%) | 0 (0.0%) |
| 19 to 25 Years | 0 (0.0%) | 0 (0.0%) |
| 26 to 34 Years | 21 (100.0%) | 0 (0.0%) |
| 35 to 44 Years | 87 (59.2%) | 60 (40.8%) |
| 45 to 54 Years | 237 (100.0%) | 0 (0.0%) |
| 55 to 64 Years | 20 (100.0%) | 0 (0.0%) |
| 65 to 74 Years | 94 (100.0%) | 0 (0.0%) |
| 75 Years and older | 116 (100.0%) | 0 (0.0%) |
| Total | 755 (92.6%) | 60 (7.4%) |
Health Insurance Coverage by Citizenship Status in White Plains
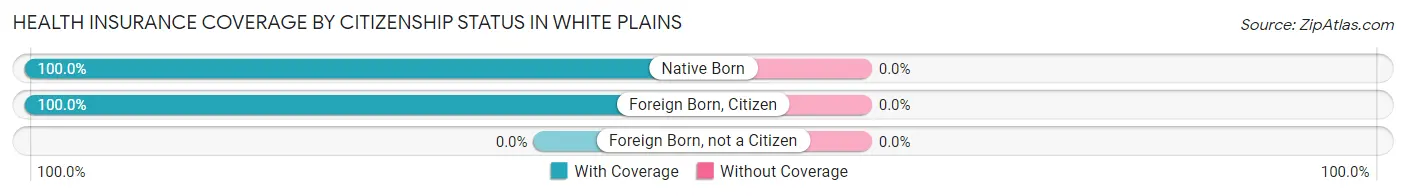
| Citizenship Status | With Coverage | Without Coverage |
| Native Born | 16 (100.0%) | 0 (0.0%) |
| Foreign Born, Citizen | 164 (100.0%) | 0 (0.0%) |
| Foreign Born, not a Citizen | 0 (0.0%) | 0 (0.0%) |
Health Insurance Coverage by Household Income in White Plains
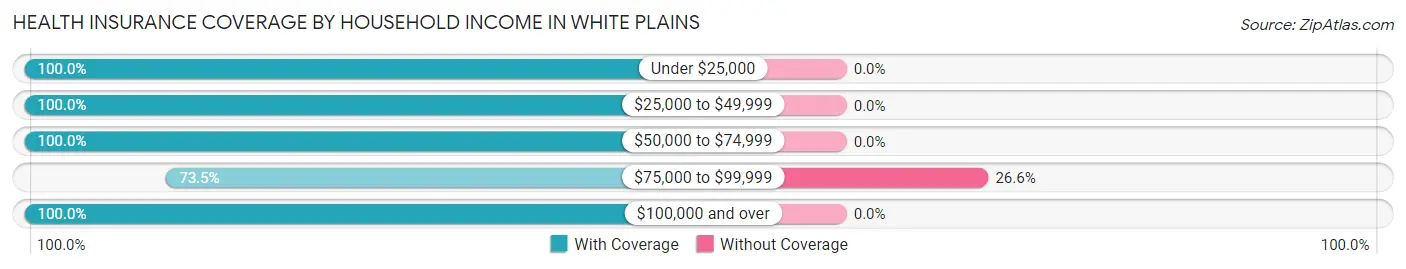
| Household Income | With Coverage | Without Coverage |
| Under $25,000 | 43 (100.0%) | 0 (0.0%) |
| $25,000 to $49,999 | 164 (100.0%) | 0 (0.0%) |
| $50,000 to $74,999 | 323 (100.0%) | 0 (0.0%) |
| $75,000 to $99,999 | 166 (73.5%) | 60 (26.6%) |
| $100,000 and over | 59 (100.0%) | 0 (0.0%) |
Public vs Private Health Insurance Coverage by Age in White Plains
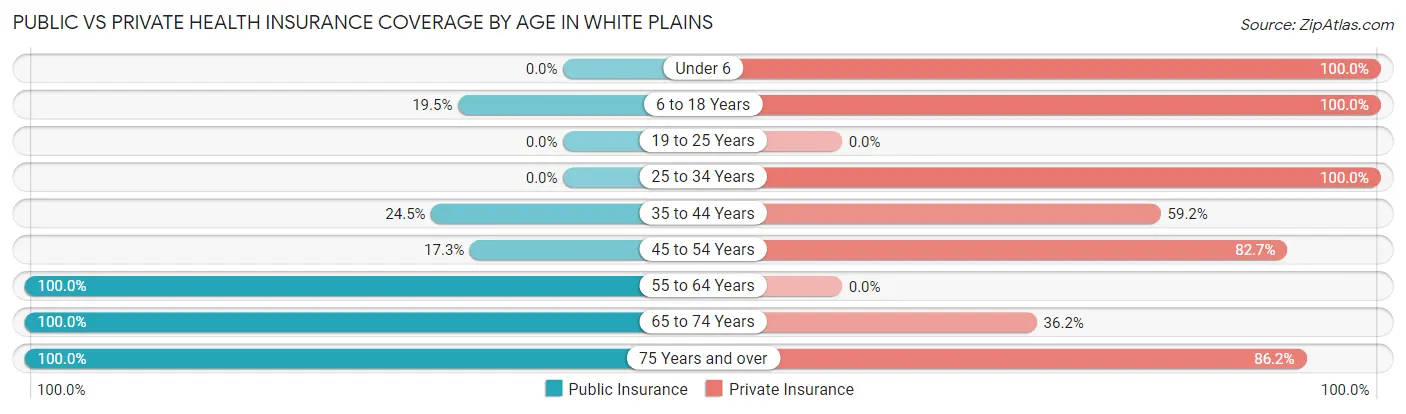
| Age Bracket | Public Insurance | Private Insurance |
| Under 6 | 0 (0.0%) | 16 (100.0%) |
| 6 to 18 Years | 32 (19.5%) | 164 (100.0%) |
| 19 to 25 Years | 0 (0.0%) | 0 (0.0%) |
| 25 to 34 Years | 0 (0.0%) | 21 (100.0%) |
| 35 to 44 Years | 36 (24.5%) | 87 (59.2%) |
| 45 to 54 Years | 41 (17.3%) | 196 (82.7%) |
| 55 to 64 Years | 20 (100.0%) | 0 (0.0%) |
| 65 to 74 Years | 94 (100.0%) | 34 (36.2%) |
| 75 Years and over | 116 (100.0%) | 100 (86.2%) |
| Total | 339 (41.6%) | 618 (75.8%) |
Disability Status by Sex by Age in White Plains
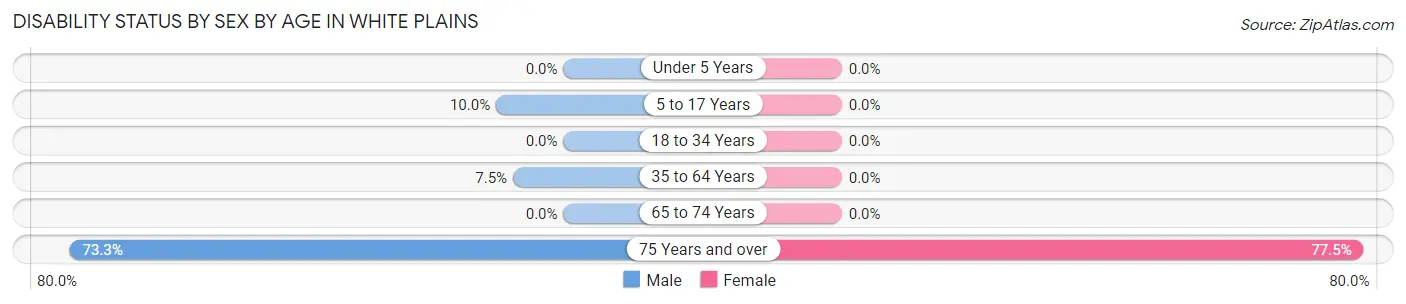
| Age Bracket | Male | Female |
| Under 5 Years | 0 (0.0%) | 0 (0.0%) |
| 5 to 17 Years | 12 (10.0%) | 0 (0.0%) |
| 18 to 34 Years | 0 (0.0%) | 0 (0.0%) |
| 35 to 64 Years | 20 (7.5%) | 0 (0.0%) |
| 65 to 74 Years | 0 (0.0%) | 0 (0.0%) |
| 75 Years and over | 33 (73.3%) | 55 (77.5%) |
Disability Class by Sex by Age in White Plains
Disability Class: Hearing Difficulty
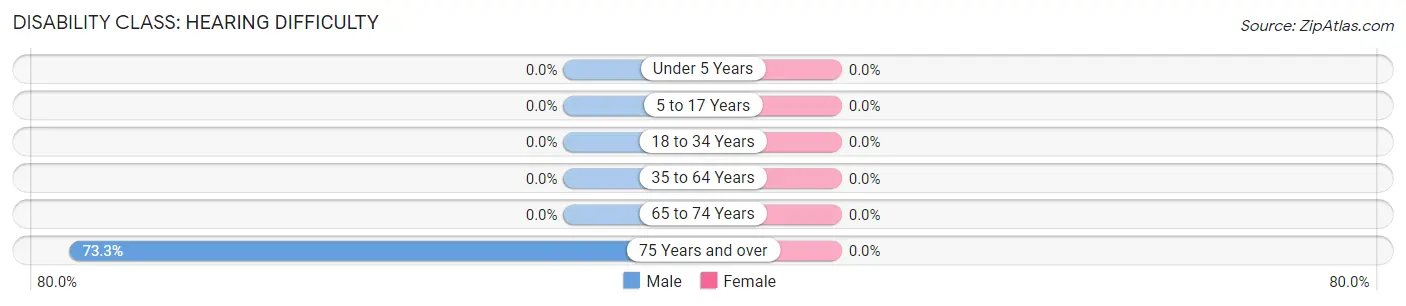
| Age Bracket | Male | Female |
| Under 5 Years | 0 (0.0%) | 0 (0.0%) |
| 5 to 17 Years | 0 (0.0%) | 0 (0.0%) |
| 18 to 34 Years | 0 (0.0%) | 0 (0.0%) |
| 35 to 64 Years | 0 (0.0%) | 0 (0.0%) |
| 65 to 74 Years | 0 (0.0%) | 0 (0.0%) |
| 75 Years and over | 33 (73.3%) | 0 (0.0%) |
Disability Class: Vision Difficulty
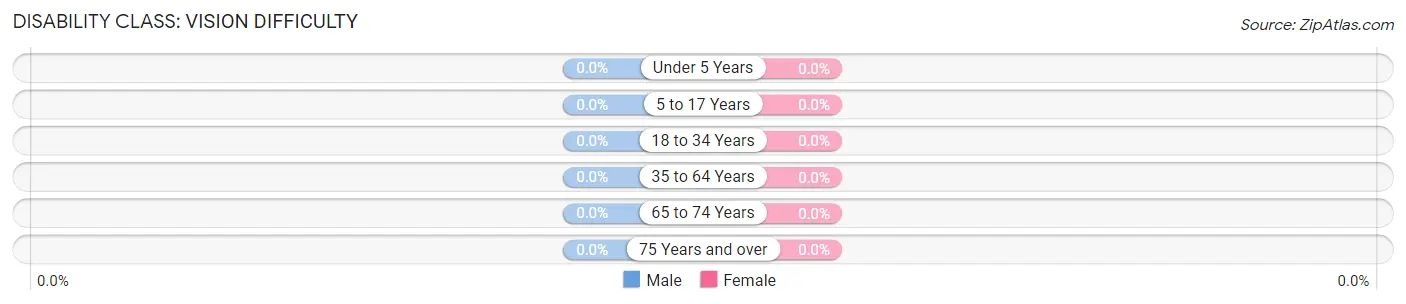
| Age Bracket | Male | Female |
| Under 5 Years | 0 (0.0%) | 0 (0.0%) |
| 5 to 17 Years | 0 (0.0%) | 0 (0.0%) |
| 18 to 34 Years | 0 (0.0%) | 0 (0.0%) |
| 35 to 64 Years | 0 (0.0%) | 0 (0.0%) |
| 65 to 74 Years | 0 (0.0%) | 0 (0.0%) |
| 75 Years and over | 0 (0.0%) | 0 (0.0%) |
Disability Class: Cognitive Difficulty
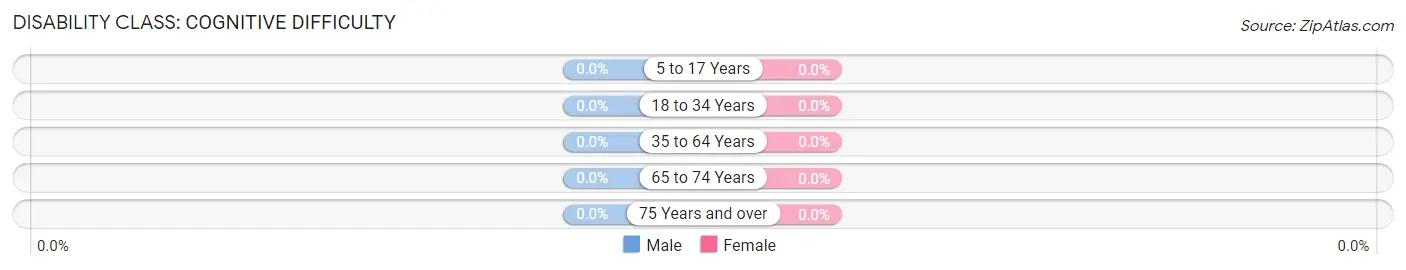
| Age Bracket | Male | Female |
| 5 to 17 Years | 0 (0.0%) | 0 (0.0%) |
| 18 to 34 Years | 0 (0.0%) | 0 (0.0%) |
| 35 to 64 Years | 0 (0.0%) | 0 (0.0%) |
| 65 to 74 Years | 0 (0.0%) | 0 (0.0%) |
| 75 Years and over | 0 (0.0%) | 0 (0.0%) |
Disability Class: Ambulatory Difficulty
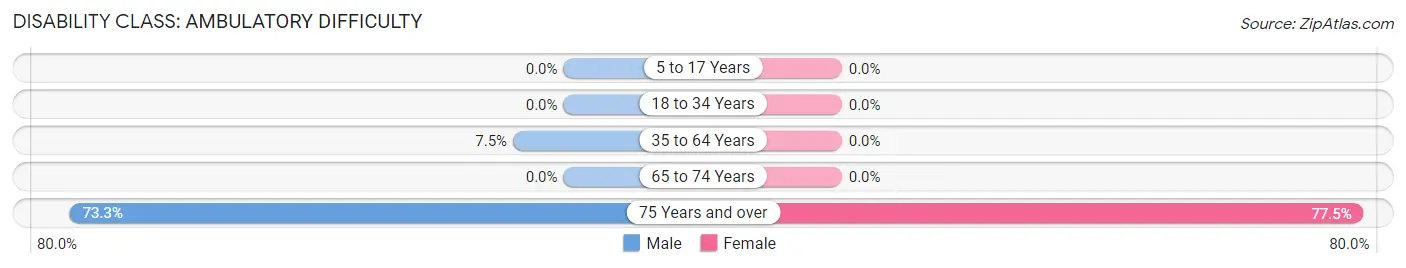
| Age Bracket | Male | Female |
| 5 to 17 Years | 0 (0.0%) | 0 (0.0%) |
| 18 to 34 Years | 0 (0.0%) | 0 (0.0%) |
| 35 to 64 Years | 20 (7.5%) | 0 (0.0%) |
| 65 to 74 Years | 0 (0.0%) | 0 (0.0%) |
| 75 Years and over | 33 (73.3%) | 55 (77.5%) |
Disability Class: Self-Care Difficulty
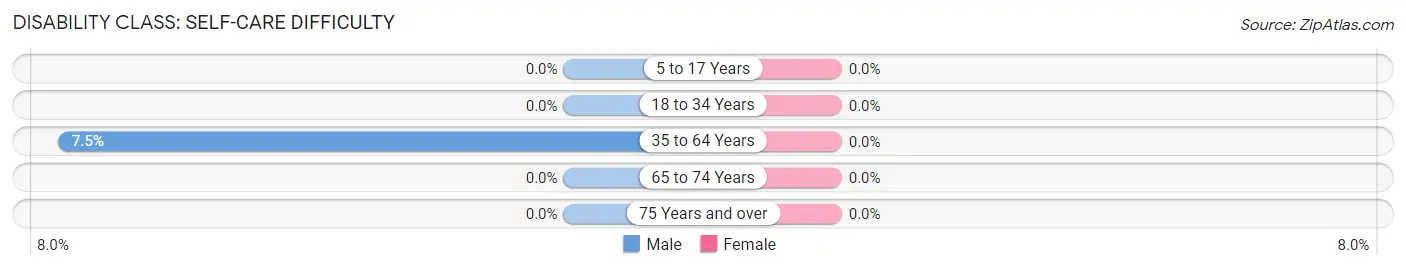
| Age Bracket | Male | Female |
| 5 to 17 Years | 0 (0.0%) | 0 (0.0%) |
| 18 to 34 Years | 0 (0.0%) | 0 (0.0%) |
| 35 to 64 Years | 20 (7.5%) | 0 (0.0%) |
| 65 to 74 Years | 0 (0.0%) | 0 (0.0%) |
| 75 Years and over | 0 (0.0%) | 0 (0.0%) |
Technology Access in White Plains
Computing Device Access in White Plains
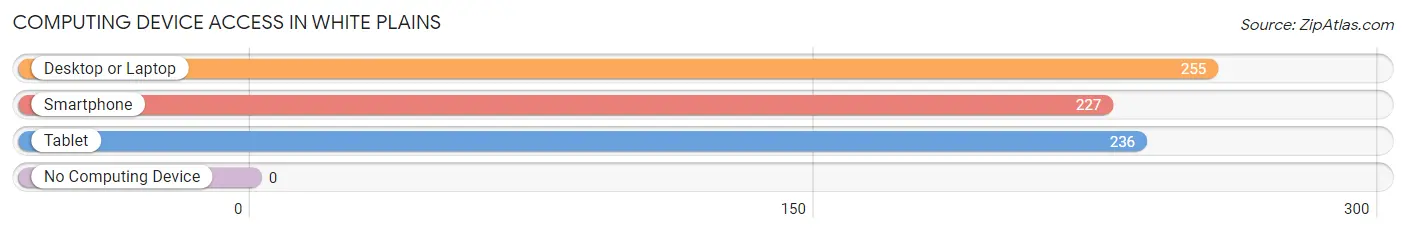
| Device Type | # Households | % Households |
| Desktop or Laptop | 255 | 88.2% |
| Smartphone | 227 | 78.5% |
| Tablet | 236 | 81.7% |
| No Computing Device | 0 | 0.0% |
| Total | 289 | 100.0% |
Internet Access in White Plains
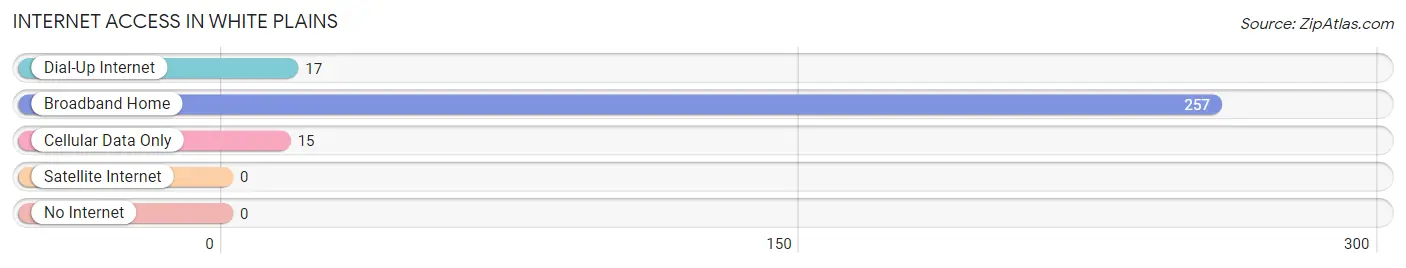
| Internet Type | # Households | % Households |
| Dial-Up Internet | 17 | 5.9% |
| Broadband Home | 257 | 88.9% |
| Cellular Data Only | 15 | 5.2% |
| Satellite Internet | 0 | 0.0% |
| No Internet | 0 | 0.0% |
| Total | 289 | 100.0% |
White Plains Summary
White Plains is a small town located in the state of Alabama, in the United States. It is situated in the northwest corner of the state, in the foothills of the Appalachian Mountains. The town has a population of just over 1,000 people, and is part of the Cullman County. White Plains is known for its rural charm and its close proximity to the larger cities of Birmingham and Huntsville.
History
White Plains was founded in 1818 by a group of settlers from North Carolina. The town was named after the white plains of the surrounding area. The settlers were attracted to the area due to its fertile soil and abundant natural resources. The town quickly grew and became a thriving agricultural center.
In the late 19th century, the town began to experience a period of growth and prosperity. The railroad was extended to White Plains in 1887, and the town became a major shipping center for the surrounding area. The town also became a popular tourist destination, as it was located near several popular attractions, such as the nearby Noccalula Falls.
In the early 20th century, White Plains experienced a period of decline. The railroad was abandoned in the 1920s, and the town’s population began to decline. The Great Depression further exacerbated the town’s economic woes, and the population continued to decline until the 1950s.
In the late 20th century, White Plains began to experience a period of revitalization. The town was designated as a historic district in the 1980s, and several historic buildings were restored. The town also began to attract new businesses and industries, and the population began to increase.
Geography
White Plains is located in the northwest corner of Alabama, in the foothills of the Appalachian Mountains. The town is situated at the intersection of US Highway 278 and Alabama State Route 69. The town is located approximately 30 miles north of Birmingham and 40 miles south of Huntsville.
The town is situated in a hilly region, with elevations ranging from 500 to 1,000 feet above sea level. The town is located in the Black Warrior River watershed, and is surrounded by several small creeks and streams. The town is located in a temperate climate, with mild winters and hot, humid summers.
Economy
White Plains is a small, rural town, and the economy is largely based on agriculture. The town is home to several small farms, which produce a variety of crops, including corn, soybeans, and cotton. The town is also home to several small businesses, including restaurants, retail stores, and service providers.
The town is also home to several manufacturing companies, which produce a variety of products, including furniture, clothing, and automotive parts. The town is also home to several small industries, which produce a variety of products, including paper products, plastics, and chemicals.
Demographics
White Plains has a population of just over 1,000 people, and is part of the Cullman County. The town is predominantly white, with a small African American population. The town is also home to a small Hispanic population. The median household income in White Plains is $35,000, and the median home value is $90,000. The town has a low unemployment rate, and the poverty rate is below the national average.
Common Questions
What is the Total Population of White Plains?
Total Population of White Plains is 815.
What is the Total Male Population of White Plains?
Total Male Population of White Plains is 524.
What is the Total Female Population of White Plains?
Total Female Population of White Plains is 291.
What is the Ratio of Males per 100 Females in White Plains?
There are 180.07 Males per 100 Females in White Plains.
What is the Ratio of Females per 100 Males in White Plains?
There are 55.53 Females per 100 Males in White Plains.
What is the Median Population Age in White Plains?
Median Population Age in White Plains is 46.3 Years.
What is the Average Family Size in White Plains
Average Family Size in White Plains is 2.9 People.
What is the Average Household Size in White Plains
Average Household Size in White Plains is 2.8 People.
What is Per Capita Income in White Plains?
Per Capita income in White Plains is $21,103.
What is the Median Family Income in White Plains?
Median Family Income in White Plains is $57,090.
What is the Median Household income in White Plains?
Median Household Income in White Plains is $56,922.
What is Inequality or Gini Index in White Plains?
Inequality or Gini Index in White Plains is 0.29.
How Large is the Labor Force in White Plains?
There are 331 People in the Labor Forcein in White Plains.
What is the Percentage of People in the Labor Force in White Plains?
43.4% of People are in the Labor Force in White Plains.
What is the Unemployment Rate in White Plains?
Unemployment Rate in White Plains is 18.1%.