Weaver, AL
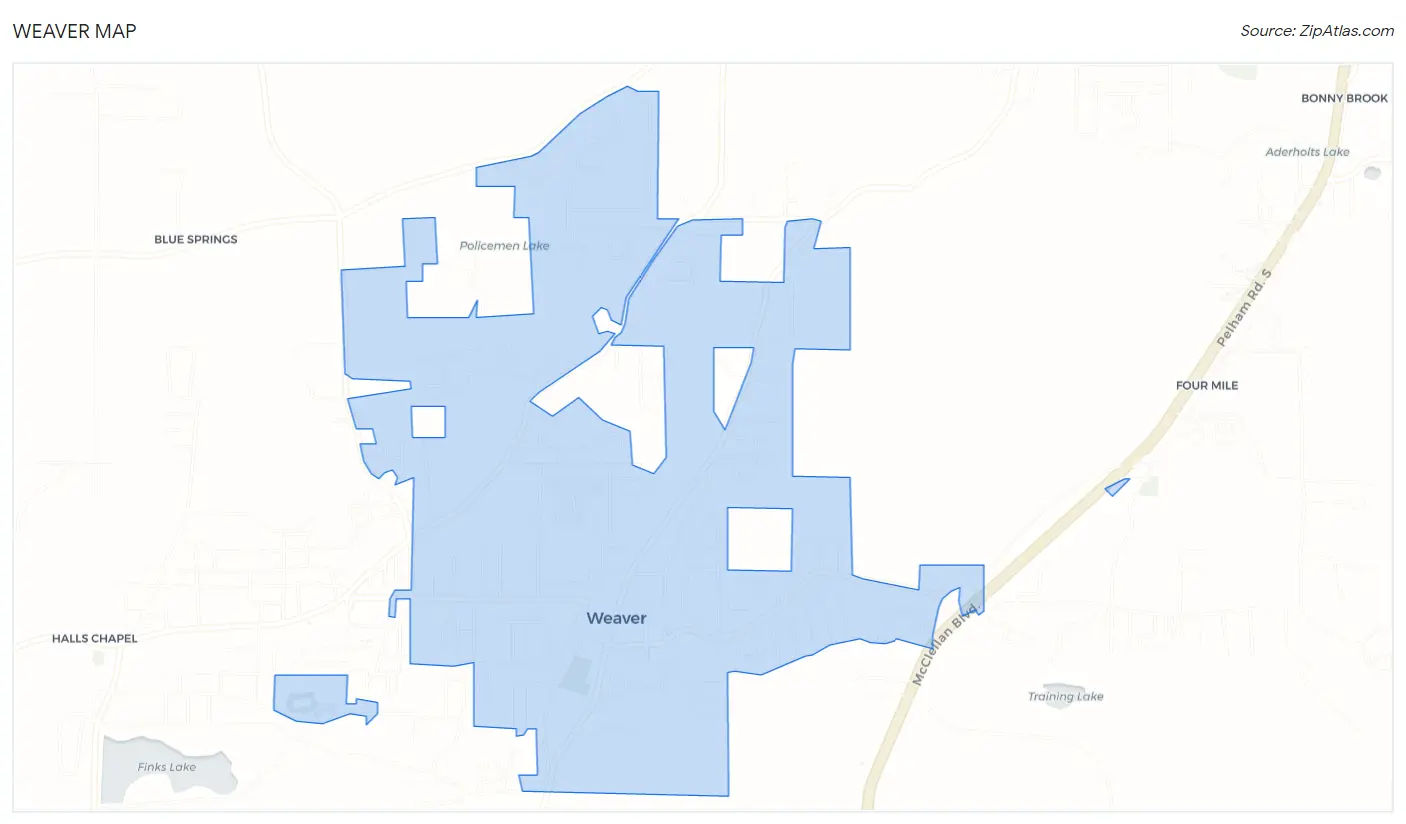
Weaver Map
Weaver Overview
3,312
TOTAL POPULATION
1,599
MALE POPULATION
1,713
FEMALE POPULATION
93.35
MALES / 100 FEMALES
107.13
FEMALES / 100 MALES
34.4
MEDIAN AGE
3.6
AVG FAMILY SIZE
3.0
AVG HOUSEHOLD SIZE
$26,922
PER CAPITA INCOME
$95,625
AVG FAMILY INCOME
$81,250
AVG HOUSEHOLD INCOME
24.2%
WAGE / INCOME GAP [ % ]
75.8¢/ $1
WAGE / INCOME GAP [ $ ]
$7,500
FAMILY INCOME DEFICIT
0.35
INEQUALITY / GINI INDEX
1,458
LABOR FORCE [ PEOPLE ]
58.3%
PERCENT IN LABOR FORCE
3.8%
UNEMPLOYMENT RATE
Weaver Zip Codes
Weaver Area Codes
Race in Weaver
The most populous races in Weaver are White / Caucasian (2,454 | 74.1%), Black / African American (616 | 18.6%), and Hispanic or Latino (163 | 4.9%).
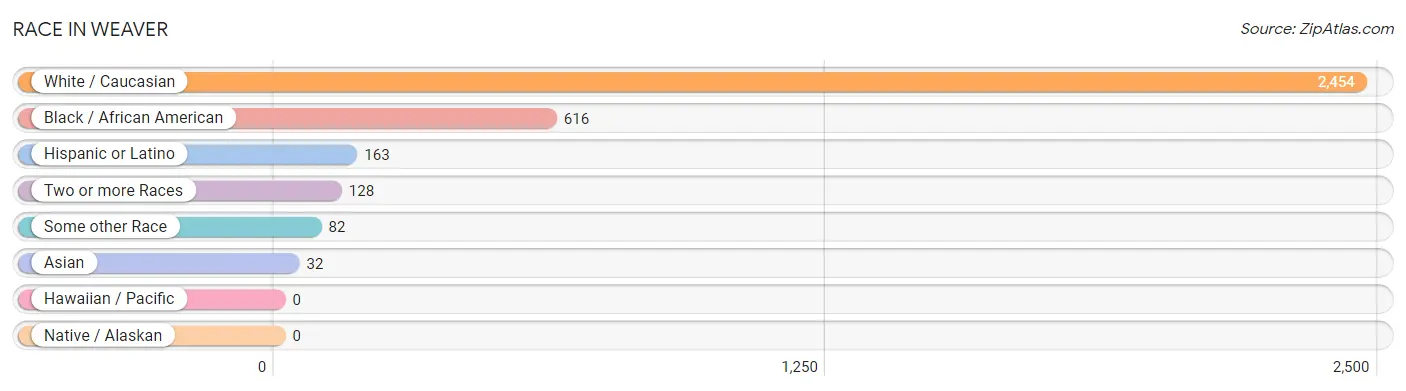
| Race | # Population | % Population |
| Asian | 32 | 1.0% |
| Black / African American | 616 | 18.6% |
| Hawaiian / Pacific | 0 | 0.0% |
| Hispanic or Latino | 163 | 4.9% |
| Native / Alaskan | 0 | 0.0% |
| White / Caucasian | 2,454 | 74.1% |
| Two or more Races | 128 | 3.9% |
| Some other Race | 82 | 2.5% |
| Total | 3,312 | 100.0% |
Ancestry in Weaver
The most populous ancestries reported in Weaver are American (677 | 20.4%), German (407 | 12.3%), Irish (342 | 10.3%), English (251 | 7.6%), and European (195 | 5.9%), together accounting for 56.5% of all Weaver residents.
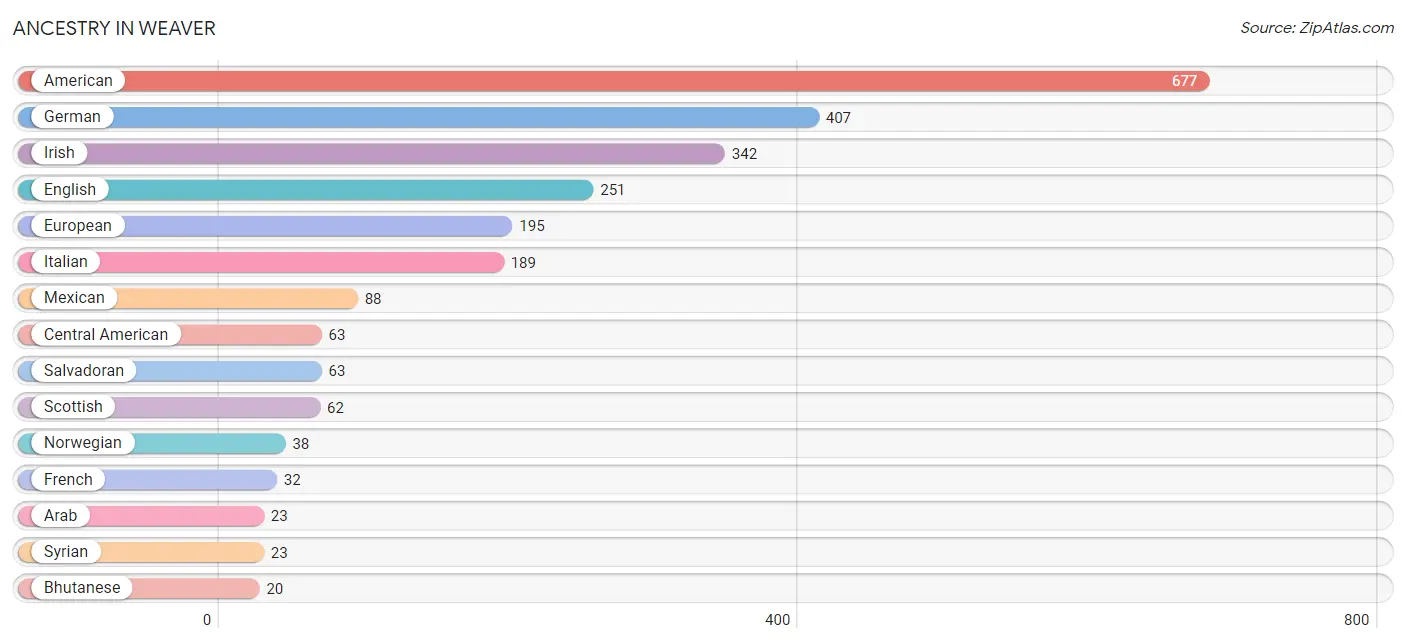
| Ancestry | # Population | % Population |
| American | 677 | 20.4% |
| Arab | 23 | 0.7% |
| Bhutanese | 20 | 0.6% |
| Burmese | 20 | 0.6% |
| Central American | 63 | 1.9% |
| Cherokee | 3 | 0.1% |
| Danish | 10 | 0.3% |
| English | 251 | 7.6% |
| European | 195 | 5.9% |
| French | 32 | 1.0% |
| German | 407 | 12.3% |
| Irish | 342 | 10.3% |
| Italian | 189 | 5.7% |
| Lithuanian | 9 | 0.3% |
| Mexican | 88 | 2.7% |
| Norwegian | 38 | 1.1% |
| Polish | 6 | 0.2% |
| Puerto Rican | 12 | 0.4% |
| Salvadoran | 63 | 1.9% |
| Scottish | 62 | 1.9% |
| Syrian | 23 | 0.7% |
| Thai | 5 | 0.2% |
| Welsh | 5 | 0.2% | View All 23 Rows |
Immigrants in Weaver
The most numerous immigrant groups reported in Weaver came from Europe (40 | 1.2%), Latin America (30 | 0.9%), Asia (25 | 0.7%), Central America (23 | 0.7%), and Germany (23 | 0.7%), together accounting for 4.2% of all Weaver residents.
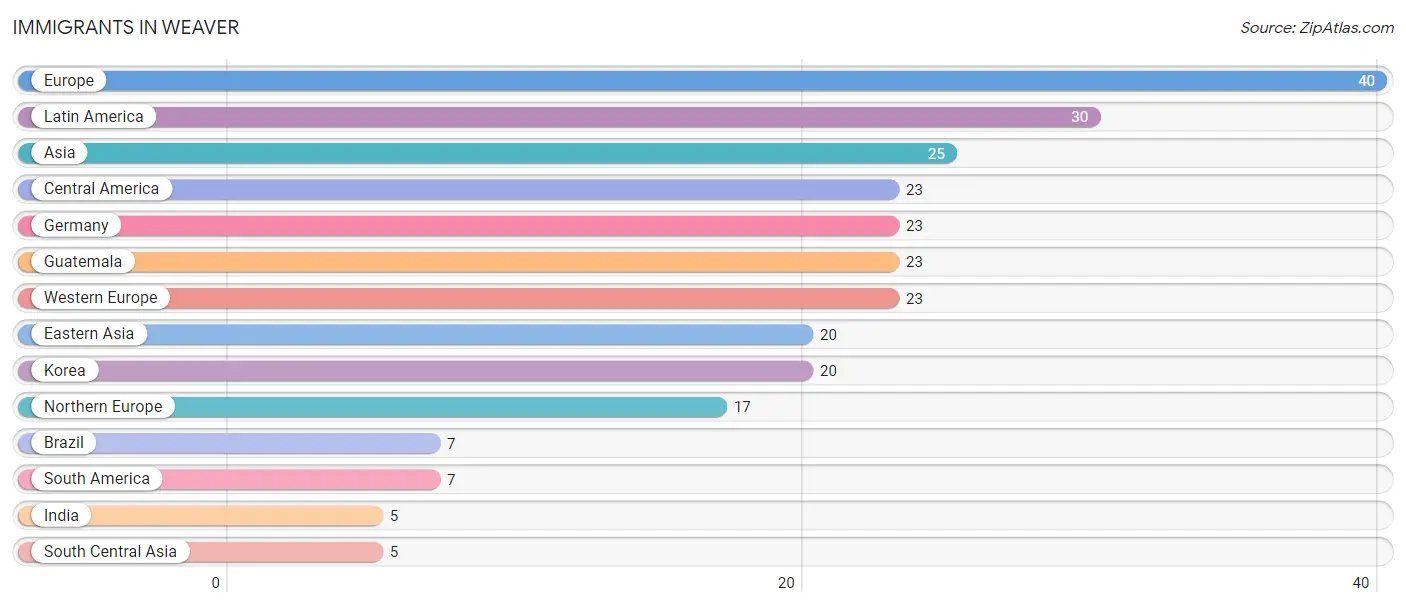
| Immigration Origin | # Population | % Population |
| Asia | 25 | 0.7% |
| Brazil | 7 | 0.2% |
| Central America | 23 | 0.7% |
| Eastern Asia | 20 | 0.6% |
| Europe | 40 | 1.2% |
| Germany | 23 | 0.7% |
| Guatemala | 23 | 0.7% |
| India | 5 | 0.2% |
| Korea | 20 | 0.6% |
| Latin America | 30 | 0.9% |
| Northern Europe | 17 | 0.5% |
| South America | 7 | 0.2% |
| South Central Asia | 5 | 0.2% |
| Western Europe | 23 | 0.7% | View All 14 Rows |
Sex and Age in Weaver
Sex and Age in Weaver
The most populous age groups in Weaver are 20 to 24 Years (222 | 13.9%) for men and 30 to 34 Years (276 | 16.1%) for women.
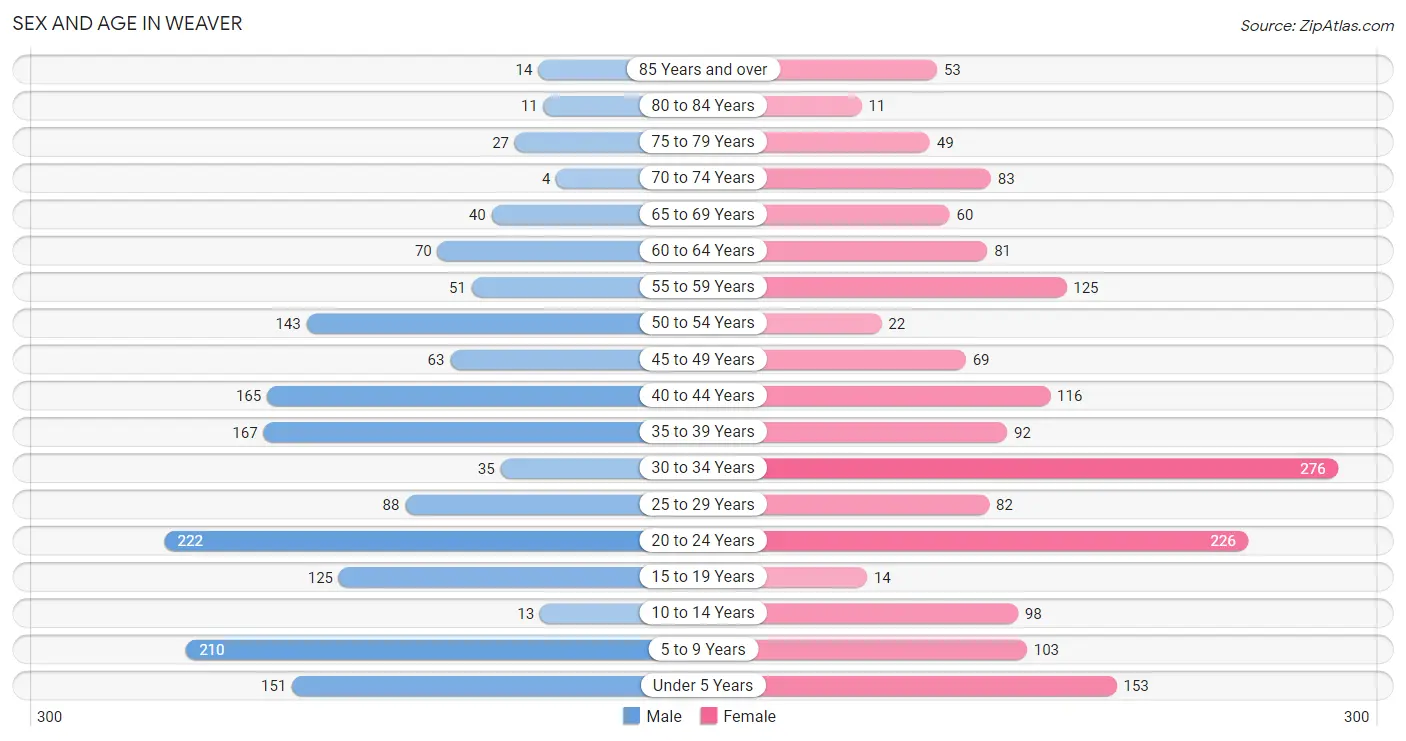
| Age Bracket | Male | Female |
| Under 5 Years | 151 (9.4%) | 153 (8.9%) |
| 5 to 9 Years | 210 (13.1%) | 103 (6.0%) |
| 10 to 14 Years | 13 (0.8%) | 98 (5.7%) |
| 15 to 19 Years | 125 (7.8%) | 14 (0.8%) |
| 20 to 24 Years | 222 (13.9%) | 226 (13.2%) |
| 25 to 29 Years | 88 (5.5%) | 82 (4.8%) |
| 30 to 34 Years | 35 (2.2%) | 276 (16.1%) |
| 35 to 39 Years | 167 (10.4%) | 92 (5.4%) |
| 40 to 44 Years | 165 (10.3%) | 116 (6.8%) |
| 45 to 49 Years | 63 (3.9%) | 69 (4.0%) |
| 50 to 54 Years | 143 (8.9%) | 22 (1.3%) |
| 55 to 59 Years | 51 (3.2%) | 125 (7.3%) |
| 60 to 64 Years | 70 (4.4%) | 81 (4.7%) |
| 65 to 69 Years | 40 (2.5%) | 60 (3.5%) |
| 70 to 74 Years | 4 (0.3%) | 83 (4.9%) |
| 75 to 79 Years | 27 (1.7%) | 49 (2.9%) |
| 80 to 84 Years | 11 (0.7%) | 11 (0.6%) |
| 85 Years and over | 14 (0.9%) | 53 (3.1%) |
| Total | 1,599 (100.0%) | 1,713 (100.0%) |
Families and Households in Weaver
Median Family Size in Weaver
The median family size in Weaver is 3.57 persons per family, with single female/mother families (74 | 10.1%) accounting for the largest median family size of 4.27 persons per family. On the other hand, single male/father families (101 | 13.7%) represent the smallest median family size with 2.44 persons per family.
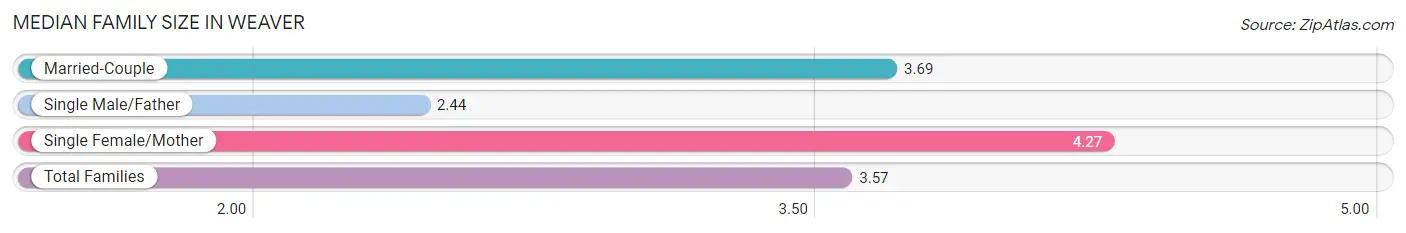
| Family Type | # Families | Family Size |
| Married-Couple | 561 (76.2%) | 3.69 |
| Single Male/Father | 101 (13.7%) | 2.44 |
| Single Female/Mother | 74 (10.1%) | 4.27 |
| Total Families | 736 (100.0%) | 3.57 |
Median Household Size in Weaver
The median household size in Weaver is 2.99 persons per household, with single female/mother households (74 | 6.7%) accounting for the largest median household size of 5.77 persons per household. non-family households (370 | 33.5%) represent the smallest median household size with 1.23 persons per household.
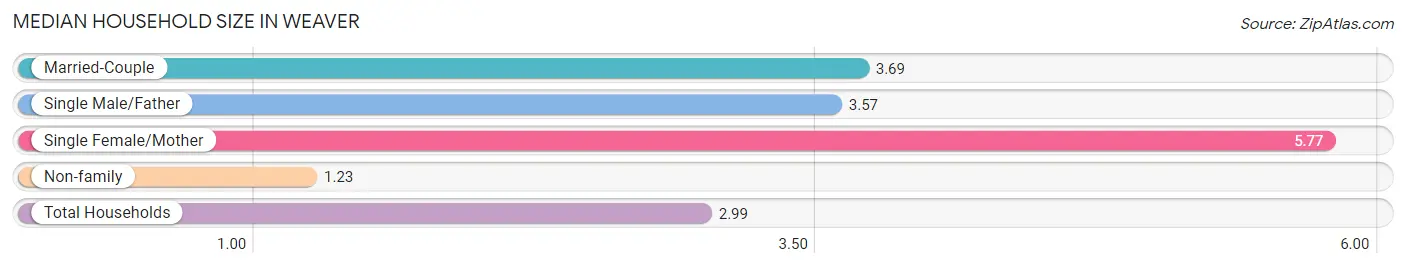
| Household Type | # Households | Household Size |
| Married-Couple | 561 (50.7%) | 3.69 |
| Single Male/Father | 101 (9.1%) | 3.57 |
| Single Female/Mother | 74 (6.7%) | 5.77 |
| Non-family | 370 (33.5%) | 1.23 |
| Total Households | 1,106 (100.0%) | 2.99 |
Household Size by Marriage Status in Weaver
Out of a total of 1,106 households in Weaver, 736 (66.5%) are family households, while 370 (33.5%) are nonfamily households. The most numerous type of family households are 2-person households, comprising 255, and the most common type of nonfamily households are 1-person households, comprising 306.
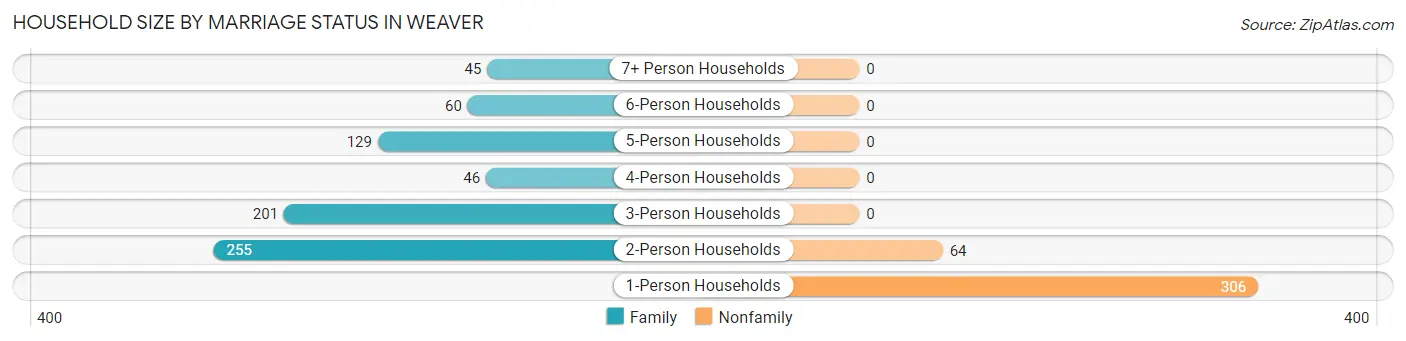
| Household Size | Family Households | Nonfamily Households |
| 1-Person Households | - | 306 (27.7%) |
| 2-Person Households | 255 (23.1%) | 64 (5.8%) |
| 3-Person Households | 201 (18.2%) | 0 (0.0%) |
| 4-Person Households | 46 (4.2%) | 0 (0.0%) |
| 5-Person Households | 129 (11.7%) | 0 (0.0%) |
| 6-Person Households | 60 (5.4%) | 0 (0.0%) |
| 7+ Person Households | 45 (4.1%) | 0 (0.0%) |
| Total | 736 (66.5%) | 370 (33.5%) |
Female Fertility in Weaver
Fertility by Age in Weaver
Average fertility rate in Weaver is 44.0 births per 1,000 women. Women in the age bracket of 20 to 34 years have the highest fertility rate with 67.0 births per 1,000 women. Women in the age bracket of 20 to 34 years acount for 100.0% of all women with births.
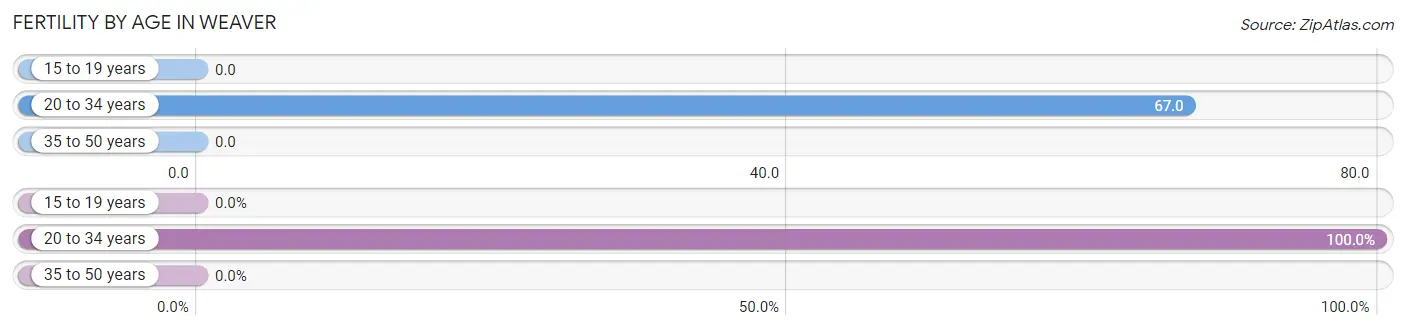
| Age Bracket | Women with Births | Births / 1,000 Women |
| 15 to 19 years | 0 (0.0%) | 0.0 |
| 20 to 34 years | 39 (100.0%) | 67.0 |
| 35 to 50 years | 0 (0.0%) | 0.0 |
| Total | 39 (100.0%) | 44.0 |
Fertility by Age by Marriage Status in Weaver
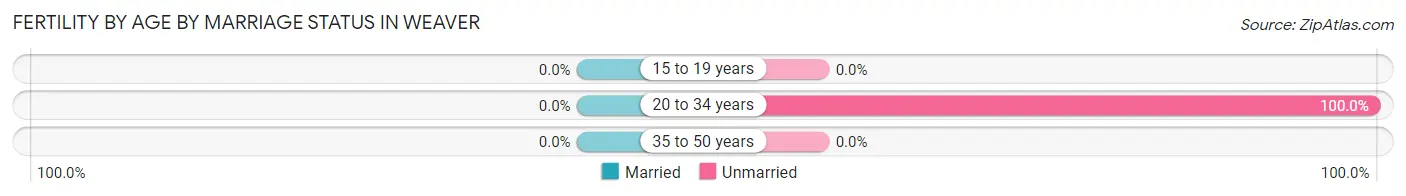
| Age Bracket | Married | Unmarried |
| 15 to 19 years | 0 (0.0%) | 0 (0.0%) |
| 20 to 34 years | 0 (0.0%) | 39 (100.0%) |
| 35 to 50 years | 0 (0.0%) | 0 (0.0%) |
| Total | 0 (0.0%) | 39 (100.0%) |
Fertility by Education in Weaver
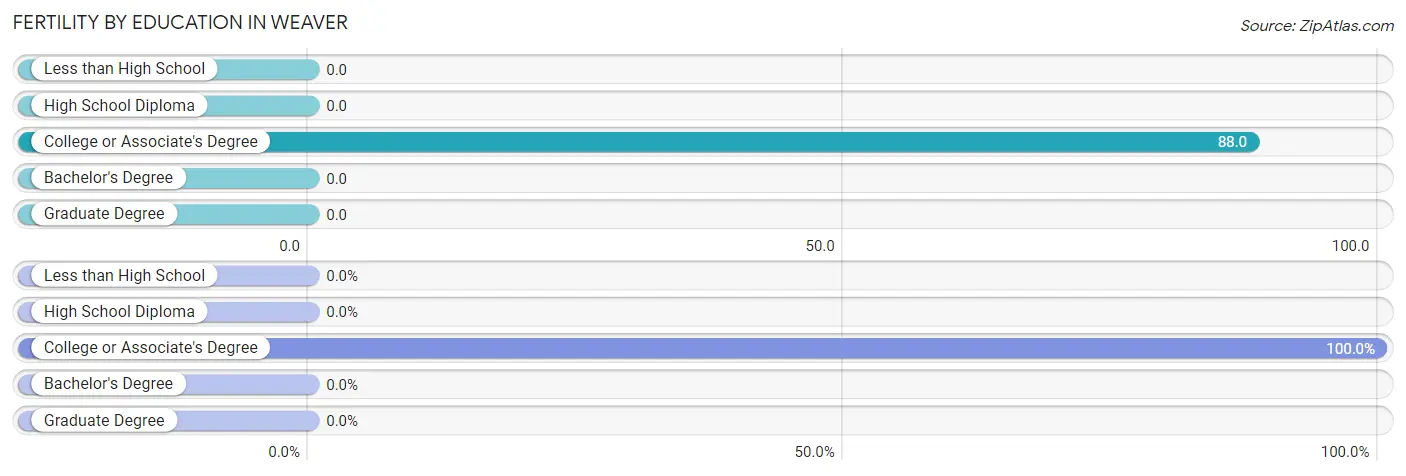
| Educational Attainment | Women with Births | Births / 1,000 Women |
| Less than High School | 0 (0.0%) | 0.0 |
| High School Diploma | 0 (0.0%) | 0.0 |
| College or Associate's Degree | 39 (100.0%) | 88.0 |
| Bachelor's Degree | 0 (0.0%) | 0.0 |
| Graduate Degree | 0 (0.0%) | 0.0 |
| Total | 39 (100.0%) | 44.0 |
Fertility by Education by Marriage Status in Weaver
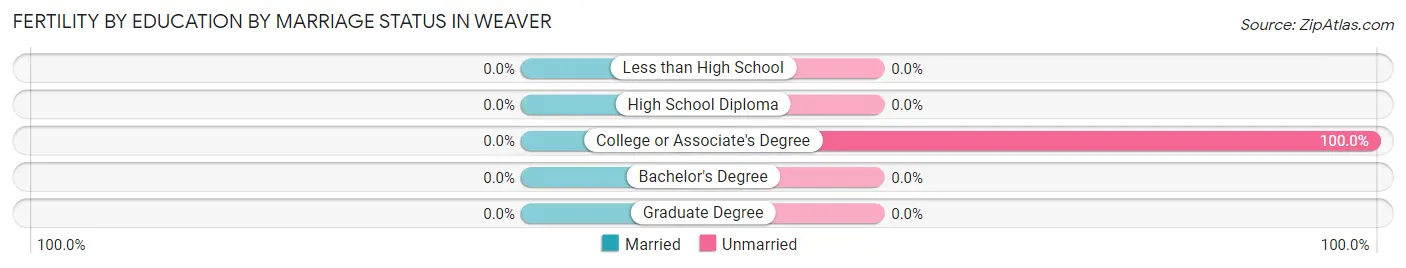
| Educational Attainment | Married | Unmarried |
| Less than High School | 0 (0.0%) | 0 (0.0%) |
| High School Diploma | 0 (0.0%) | 0 (0.0%) |
| College or Associate's Degree | 0 (0.0%) | 39 (100.0%) |
| Bachelor's Degree | 0 (0.0%) | 0 (0.0%) |
| Graduate Degree | 0 (0.0%) | 0 (0.0%) |
| Total | 0 (0.0%) | 39 (100.0%) |
Income in Weaver
Income Overview in Weaver
Per Capita Income in Weaver is $26,922, while median incomes of families and households are $95,625 and $81,250 respectively.
| Characteristic | Number | Measure |
| Per Capita Income | 3,312 | $26,922 |
| Median Family Income | 736 | $95,625 |
| Mean Family Income | 736 | $91,485 |
| Median Household Income | 1,106 | $81,250 |
| Mean Household Income | 1,106 | $77,860 |
| Income Deficit | 736 | $7,500 |
| Wage / Income Gap (%) | 3,312 | 24.25% |
| Wage / Income Gap ($) | 3,312 | 75.75¢ per $1 |
| Gini / Inequality Index | 3,312 | 0.35 |
Earnings by Sex in Weaver
Average Earnings in Weaver are $44,676, $49,047 for men and $37,155 for women, a difference of 24.2%.
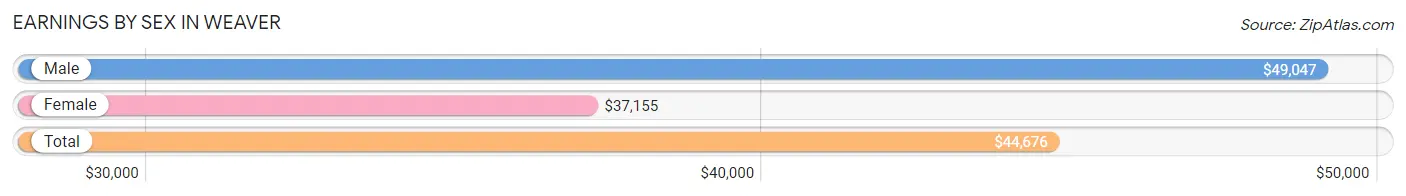
| Sex | Number | Average Earnings |
| Male | 969 (60.1%) | $49,047 |
| Female | 644 (39.9%) | $37,155 |
| Total | 1,613 (100.0%) | $44,676 |
Earnings by Sex by Income Bracket in Weaver
The most common earnings brackets in Weaver are $75,000 to $99,999 for men (210 | 21.7%) and $5,000 to $7,499 for women (125 | 19.4%).
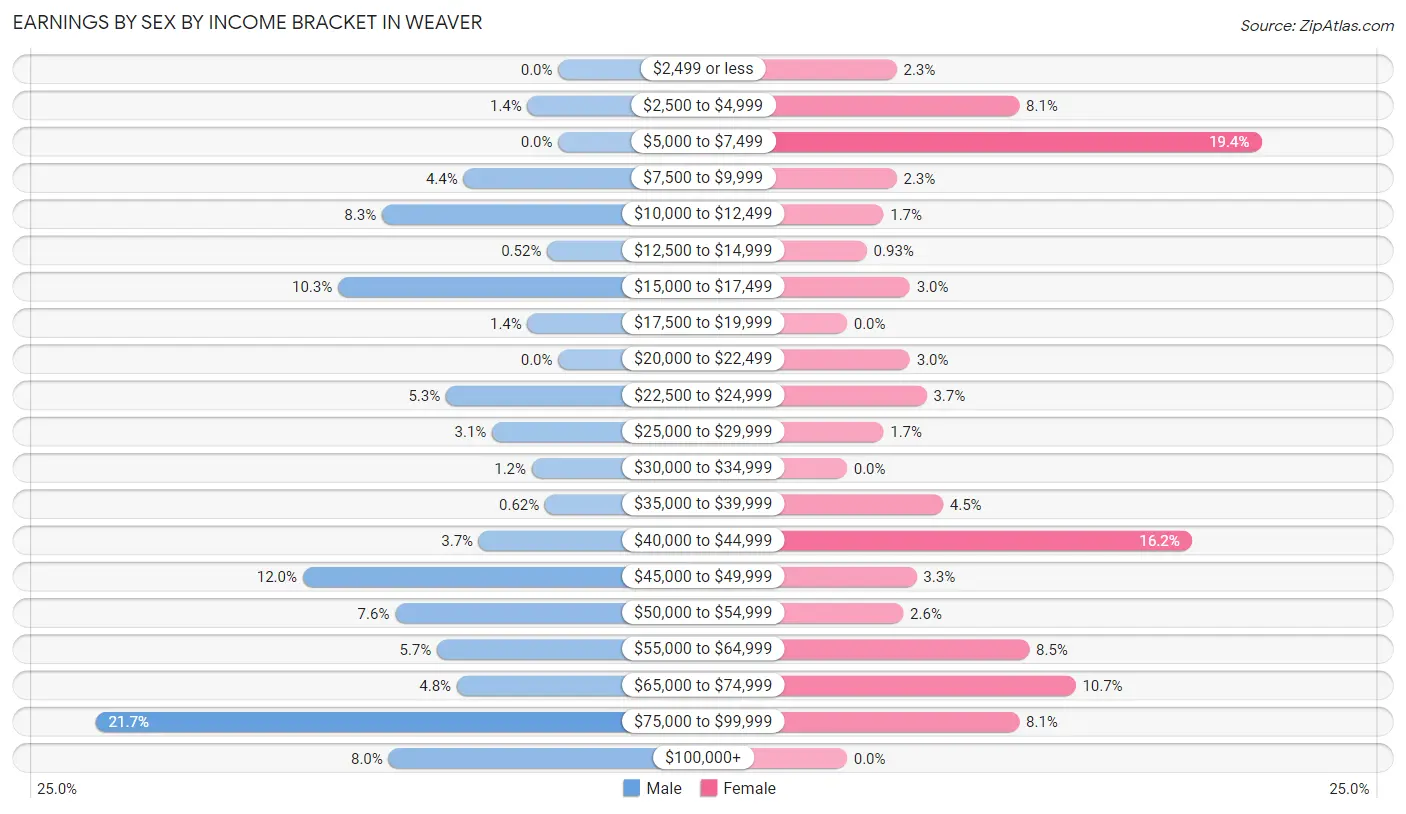
| Income | Male | Female |
| $2,499 or less | 0 (0.0%) | 15 (2.3%) |
| $2,500 to $4,999 | 14 (1.4%) | 52 (8.1%) |
| $5,000 to $7,499 | 0 (0.0%) | 125 (19.4%) |
| $7,500 to $9,999 | 43 (4.4%) | 15 (2.3%) |
| $10,000 to $12,499 | 80 (8.3%) | 11 (1.7%) |
| $12,500 to $14,999 | 5 (0.5%) | 6 (0.9%) |
| $15,000 to $17,499 | 100 (10.3%) | 19 (2.9%) |
| $17,500 to $19,999 | 14 (1.4%) | 0 (0.0%) |
| $20,000 to $22,499 | 0 (0.0%) | 19 (2.9%) |
| $22,500 to $24,999 | 51 (5.3%) | 24 (3.7%) |
| $25,000 to $29,999 | 30 (3.1%) | 11 (1.7%) |
| $30,000 to $34,999 | 12 (1.2%) | 0 (0.0%) |
| $35,000 to $39,999 | 6 (0.6%) | 29 (4.5%) |
| $40,000 to $44,999 | 36 (3.7%) | 104 (16.2%) |
| $45,000 to $49,999 | 116 (12.0%) | 21 (3.3%) |
| $50,000 to $54,999 | 74 (7.6%) | 17 (2.6%) |
| $55,000 to $64,999 | 55 (5.7%) | 55 (8.5%) |
| $65,000 to $74,999 | 46 (4.8%) | 69 (10.7%) |
| $75,000 to $99,999 | 210 (21.7%) | 52 (8.1%) |
| $100,000+ | 77 (8.0%) | 0 (0.0%) |
| Total | 969 (100.0%) | 644 (100.0%) |
Earnings by Sex by Educational Attainment in Weaver
Average earnings in Weaver are $52,956 for men and $44,865 for women, a difference of 15.3%. Men with an educational attainment of graduate degree enjoy the highest average annual earnings of $135,503, while those with less than high school education earn the least with $48,250. Women with an educational attainment of graduate degree earn the most with the average annual earnings of $73,350, while those with college or associate's degree education have the smallest earnings of $23,594.
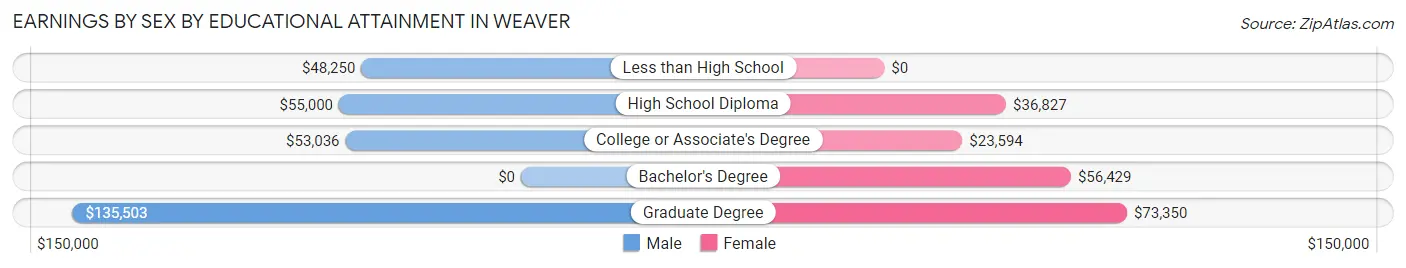
| Educational Attainment | Male Income | Female Income |
| Less than High School | $48,250 | $0 |
| High School Diploma | $55,000 | $36,827 |
| College or Associate's Degree | $53,036 | $23,594 |
| Bachelor's Degree | - | - |
| Graduate Degree | $135,503 | $73,350 |
| Total | $52,956 | $44,865 |
Family Income in Weaver
Family Income Brackets in Weaver
According to the Weaver family income data, there are 293 families falling into the $100,000 to $149,999 income range, which is the most common income bracket and makes up 39.8% of all families.
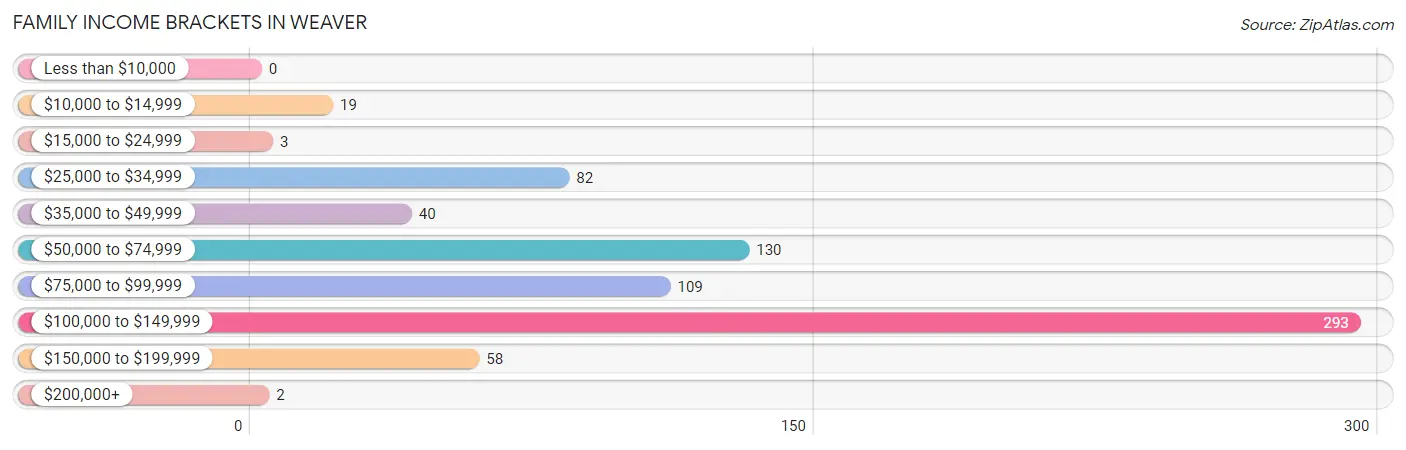
| Income Bracket | # Families | % Families |
| Less than $10,000 | 0 | 0.0% |
| $10,000 to $14,999 | 19 | 2.6% |
| $15,000 to $24,999 | 3 | 0.4% |
| $25,000 to $34,999 | 82 | 11.1% |
| $35,000 to $49,999 | 40 | 5.4% |
| $50,000 to $74,999 | 130 | 17.7% |
| $75,000 to $99,999 | 109 | 14.8% |
| $100,000 to $149,999 | 293 | 39.8% |
| $150,000 to $199,999 | 58 | 7.9% |
| $200,000+ | 2 | 0.3% |
Family Income by Famaliy Size in Weaver
7+ person families (45 | 6.1%) account for the highest median family income in Weaver with $120,250 per family, while 2-person families (305 | 41.4%) have the highest median income of $35,347 per family member.
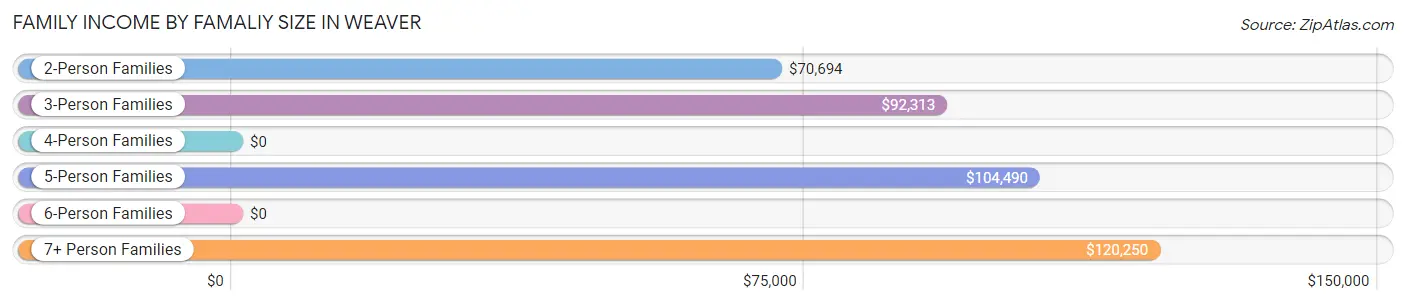
| Income Bracket | # Families | Median Income |
| 2-Person Families | 305 (41.4%) | $70,694 |
| 3-Person Families | 241 (32.7%) | $92,313 |
| 4-Person Families | 46 (6.2%) | $0 |
| 5-Person Families | 90 (12.2%) | $104,490 |
| 6-Person Families | 9 (1.2%) | $0 |
| 7+ Person Families | 45 (6.1%) | $120,250 |
| Total | 736 (100.0%) | $95,625 |
Family Income by Number of Earners in Weaver
The median family income in Weaver is $95,625, with families comprising 2 earners (300) having the highest median family income of $110,313, while families with no earners (70) have the lowest median family income of $64,219, accounting for 40.8% and 9.5% of families, respectively.
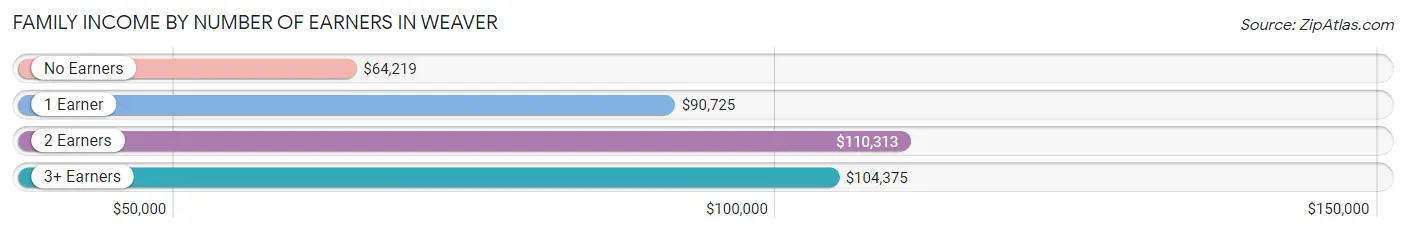
| Number of Earners | # Families | Median Income |
| No Earners | 70 (9.5%) | $64,219 |
| 1 Earner | 282 (38.3%) | $90,725 |
| 2 Earners | 300 (40.8%) | $110,313 |
| 3+ Earners | 84 (11.4%) | $104,375 |
| Total | 736 (100.0%) | $95,625 |
Household Income in Weaver
Household Income Brackets in Weaver
With 355 households falling in the category, the $100,000 to $149,999 income range is the most frequent in Weaver, accounting for 32.1% of all households. In contrast, only 2 households (0.2%) fall into the $200,000+ income bracket, making it the least populous group.
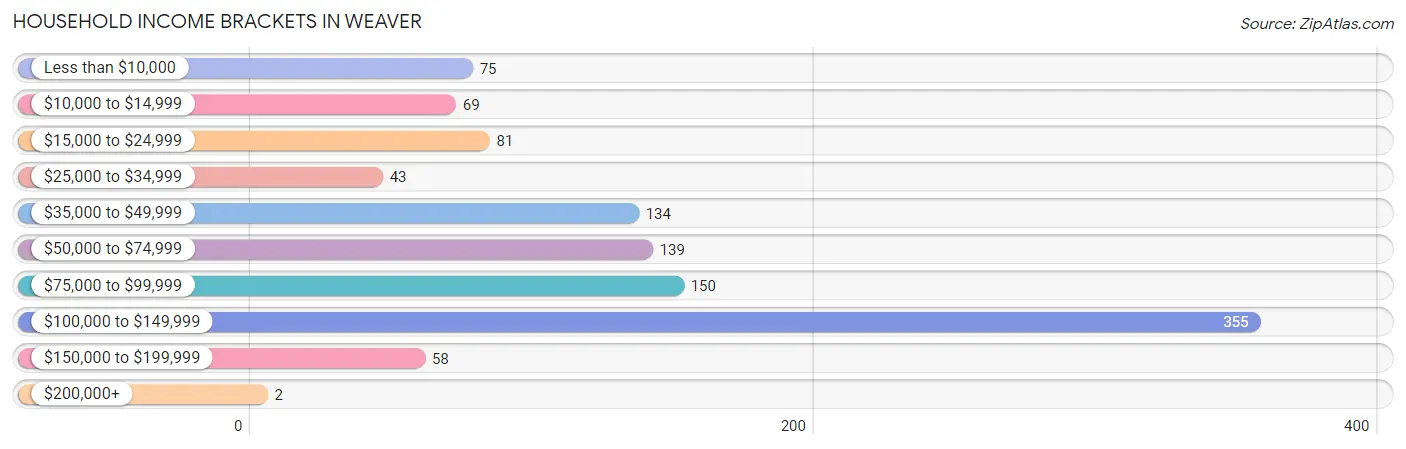
| Income Bracket | # Households | % Households |
| Less than $10,000 | 75 | 6.8% |
| $10,000 to $14,999 | 69 | 6.2% |
| $15,000 to $24,999 | 81 | 7.3% |
| $25,000 to $34,999 | 43 | 3.9% |
| $35,000 to $49,999 | 134 | 12.1% |
| $50,000 to $74,999 | 139 | 12.6% |
| $75,000 to $99,999 | 150 | 13.6% |
| $100,000 to $149,999 | 355 | 32.1% |
| $150,000 to $199,999 | 58 | 5.2% |
| $200,000+ | 2 | 0.2% |
Household Income by Householder Age in Weaver
The median household income in Weaver is $81,250, with the highest median household income of $148,237 found in the 15 to 24 years age bracket for the primary householder. A total of 55 households (5.0%) fall into this category. Meanwhile, the 65+ years age bracket for the primary householder has the lowest median household income of $0, with 237 households (21.4%) in this group.
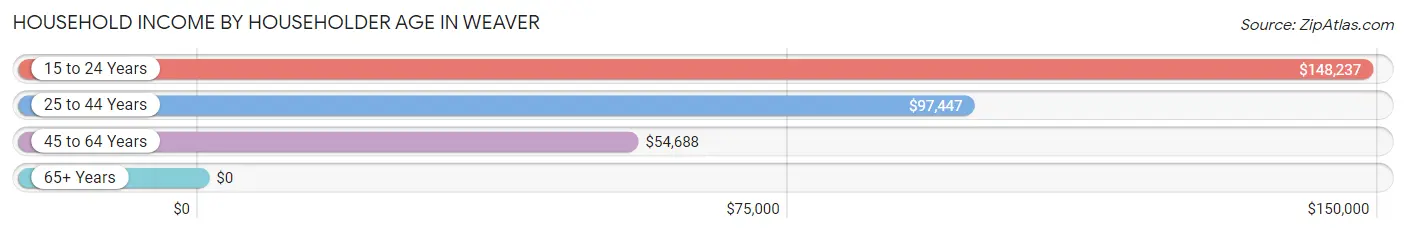
| Income Bracket | # Households | Median Income |
| 15 to 24 Years | 55 (5.0%) | $148,237 |
| 25 to 44 Years | 485 (43.9%) | $97,447 |
| 45 to 64 Years | 329 (29.7%) | $54,688 |
| 65+ Years | 237 (21.4%) | $0 |
| Total | 1,106 (100.0%) | $81,250 |
Poverty in Weaver
Income Below Poverty by Sex and Age in Weaver
With 11.4% poverty level for males and 13.9% for females among the residents of Weaver, 12 to 14 year old males and 55 to 64 year old females are the most vulnerable to poverty, with 10 males (100.0%) and 66 females (32.0%) in their respective age groups living below the poverty level.
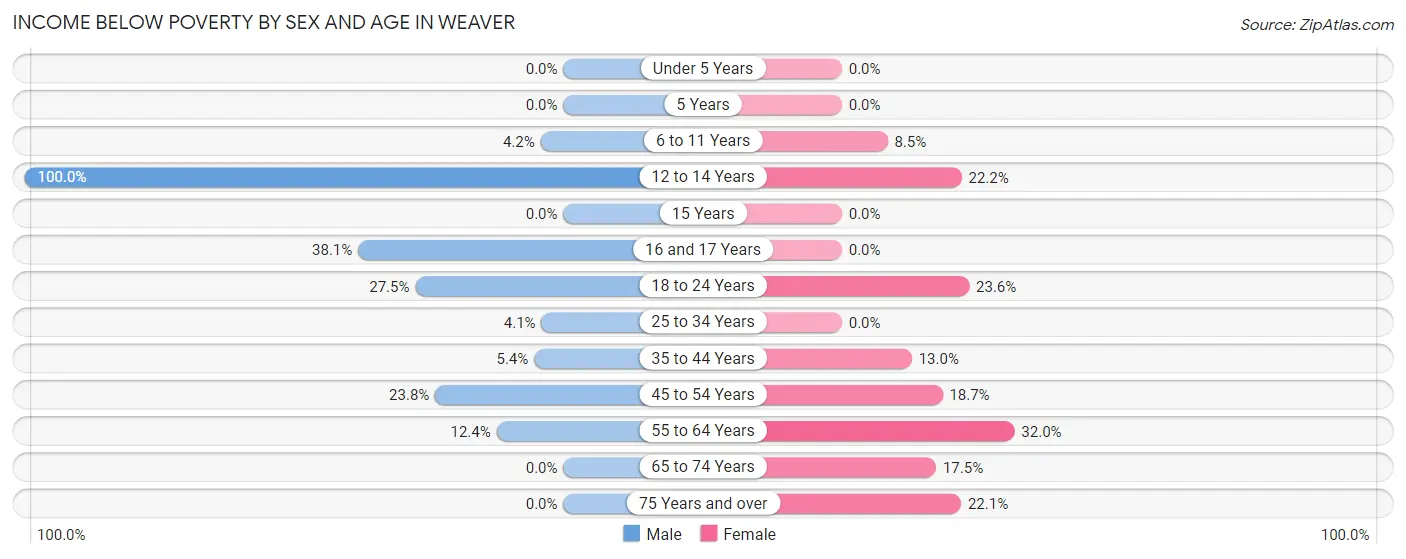
| Age Bracket | Male | Female |
| Under 5 Years | 0 (0.0%) | 0 (0.0%) |
| 5 Years | 0 (0.0%) | 0 (0.0%) |
| 6 to 11 Years | 9 (4.2%) | 10 (8.5%) |
| 12 to 14 Years | 10 (100.0%) | 10 (22.2%) |
| 15 Years | 0 (0.0%) | 0 (0.0%) |
| 16 and 17 Years | 16 (38.1%) | 0 (0.0%) |
| 18 to 24 Years | 61 (27.5%) | 56 (23.6%) |
| 25 to 34 Years | 5 (4.1%) | 0 (0.0%) |
| 35 to 44 Years | 18 (5.4%) | 27 (13.0%) |
| 45 to 54 Years | 49 (23.8%) | 17 (18.7%) |
| 55 to 64 Years | 15 (12.4%) | 66 (32.0%) |
| 65 to 74 Years | 0 (0.0%) | 25 (17.5%) |
| 75 Years and over | 0 (0.0%) | 25 (22.1%) |
| Total | 183 (11.4%) | 236 (13.9%) |
Income Above Poverty by Sex and Age in Weaver
According to the poverty statistics in Weaver, males aged under 5 years and females aged under 5 years are the age groups that are most secure financially, with 100.0% of males and 100.0% of females in these age groups living above the poverty line.
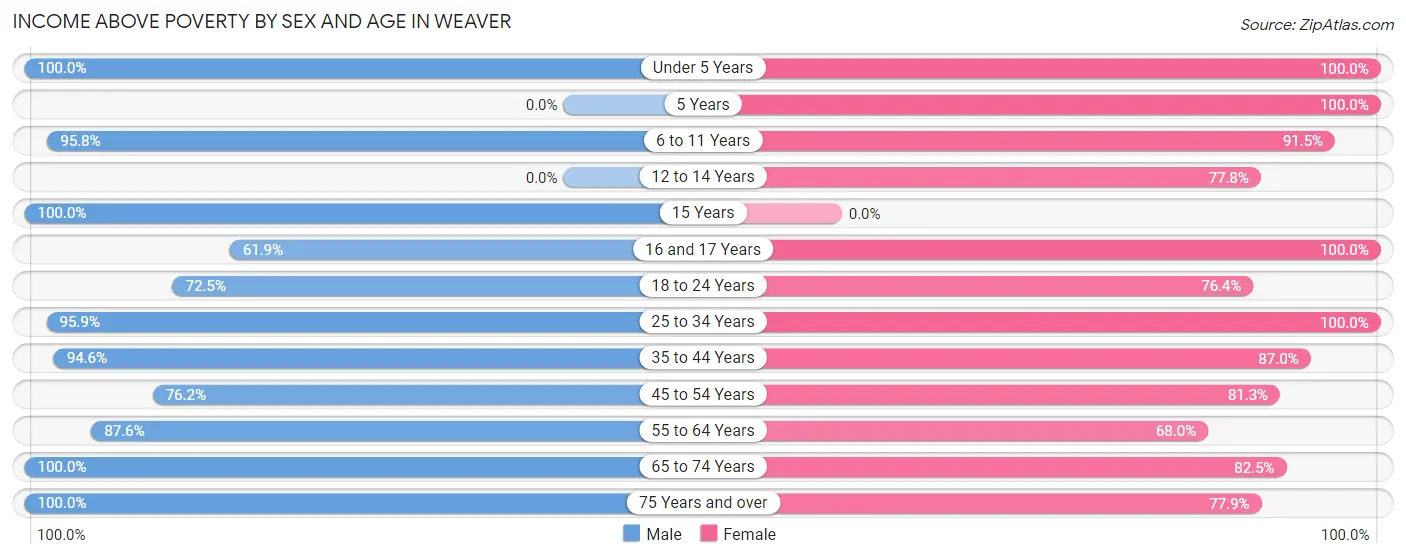
| Age Bracket | Male | Female |
| Under 5 Years | 151 (100.0%) | 153 (100.0%) |
| 5 Years | 0 (0.0%) | 23 (100.0%) |
| 6 to 11 Years | 204 (95.8%) | 108 (91.5%) |
| 12 to 14 Years | 0 (0.0%) | 35 (77.8%) |
| 15 Years | 83 (100.0%) | 0 (0.0%) |
| 16 and 17 Years | 26 (61.9%) | 3 (100.0%) |
| 18 to 24 Years | 161 (72.5%) | 181 (76.4%) |
| 25 to 34 Years | 118 (95.9%) | 358 (100.0%) |
| 35 to 44 Years | 314 (94.6%) | 181 (87.0%) |
| 45 to 54 Years | 157 (76.2%) | 74 (81.3%) |
| 55 to 64 Years | 106 (87.6%) | 140 (68.0%) |
| 65 to 74 Years | 44 (100.0%) | 118 (82.5%) |
| 75 Years and over | 52 (100.0%) | 88 (77.9%) |
| Total | 1,416 (88.6%) | 1,462 (86.1%) |
Income Below Poverty Among Married-Couple Families in Weaver
The poverty statistics for married-couple families in Weaver show that 5.0% or 28 of the total 561 families live below the poverty line. Families with 3 or 4 children have the highest poverty rate of 42.9%, comprising of 9 families. On the other hand, families with 1 or 2 children have the lowest poverty rate of 0.0%, which includes 0 families.
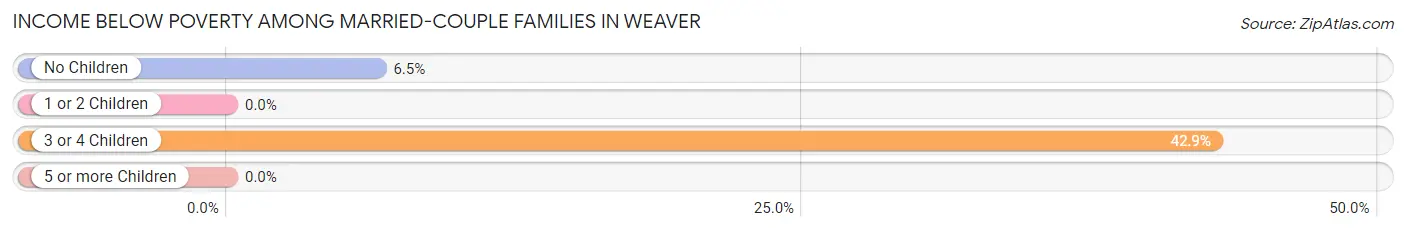
| Children | Above Poverty | Below Poverty |
| No Children | 275 (93.5%) | 19 (6.5%) |
| 1 or 2 Children | 213 (100.0%) | 0 (0.0%) |
| 3 or 4 Children | 12 (57.1%) | 9 (42.9%) |
| 5 or more Children | 33 (100.0%) | 0 (0.0%) |
| Total | 533 (95.0%) | 28 (5.0%) |
Income Below Poverty Among Single-Parent Households in Weaver
| Children | Single Father | Single Mother |
| No Children | 0 (0.0%) | 0 (0.0%) |
| 1 or 2 Children | 0 (0.0%) | 0 (0.0%) |
| 3 or 4 Children | 0 (0.0%) | 0 (0.0%) |
| 5 or more Children | 0 (0.0%) | 0 (0.0%) |
| Total | 0 (0.0%) | 0 (0.0%) |
Income Below Poverty Among Married-Couple vs Single-Parent Households in Weaver
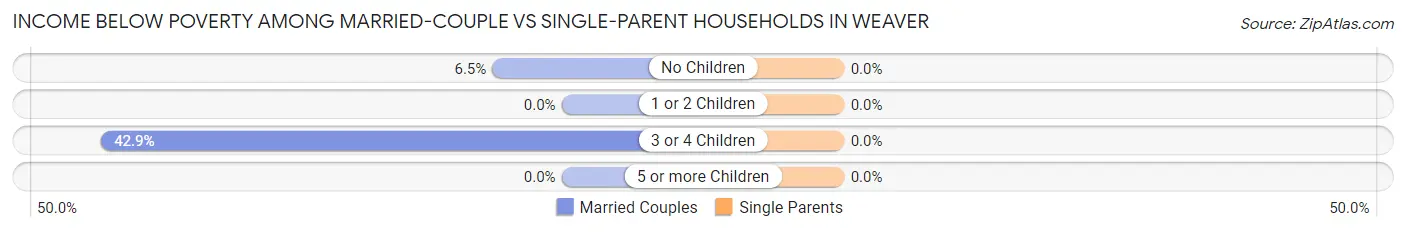
| Children | Married-Couple Families | Single-Parent Households |
| No Children | 19 (6.5%) | 0 (0.0%) |
| 1 or 2 Children | 0 (0.0%) | 0 (0.0%) |
| 3 or 4 Children | 9 (42.9%) | 0 (0.0%) |
| 5 or more Children | 0 (0.0%) | 0 (0.0%) |
| Total | 28 (5.0%) | 0 (0.0%) |
Employment Characteristics in Weaver
Employment by Class of Employer in Weaver
Among the 1,316 employed individuals in Weaver, private company employees (689 | 52.4%), state government employees (162 | 12.3%), and not-for-profit organizations (152 | 11.6%) make up the most common classes of employment.
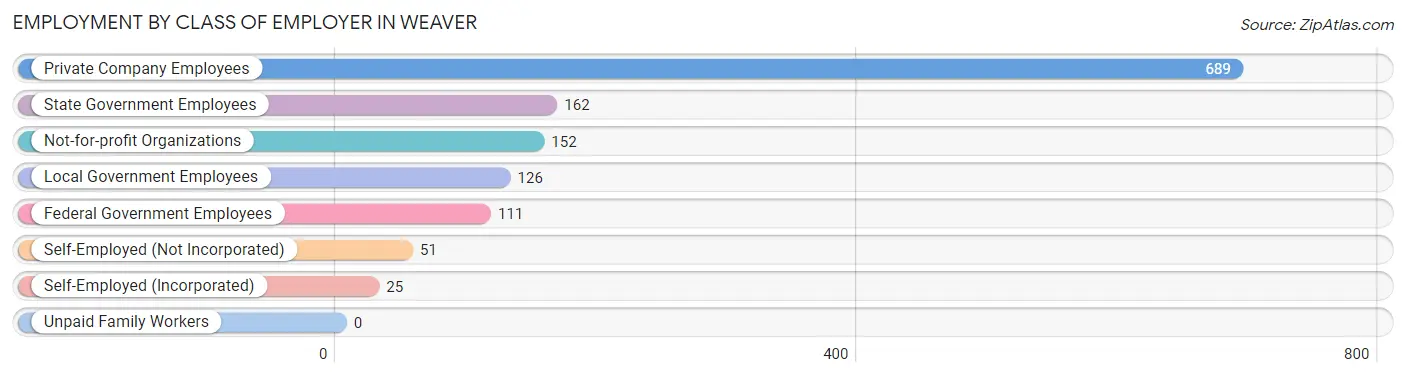
| Employer Class | # Employees | % Employees |
| Private Company Employees | 689 | 52.4% |
| Self-Employed (Incorporated) | 25 | 1.9% |
| Self-Employed (Not Incorporated) | 51 | 3.9% |
| Not-for-profit Organizations | 152 | 11.6% |
| Local Government Employees | 126 | 9.6% |
| State Government Employees | 162 | 12.3% |
| Federal Government Employees | 111 | 8.4% |
| Unpaid Family Workers | 0 | 0.0% |
| Total | 1,316 | 100.0% |
Employment Status by Age in Weaver
According to the labor force statistics for Weaver, out of the total population over 16 years of age (2,501), 58.3% or 1,458 individuals are in the labor force, with 3.8% or 55 of them unemployed. The age group with the highest labor force participation rate is 35 to 44 years, with 78.1% or 422 individuals in the labor force. Within the labor force, the 65 to 74 years age range has the highest percentage of unemployed individuals, with 41.7% or 10 of them being unemployed.
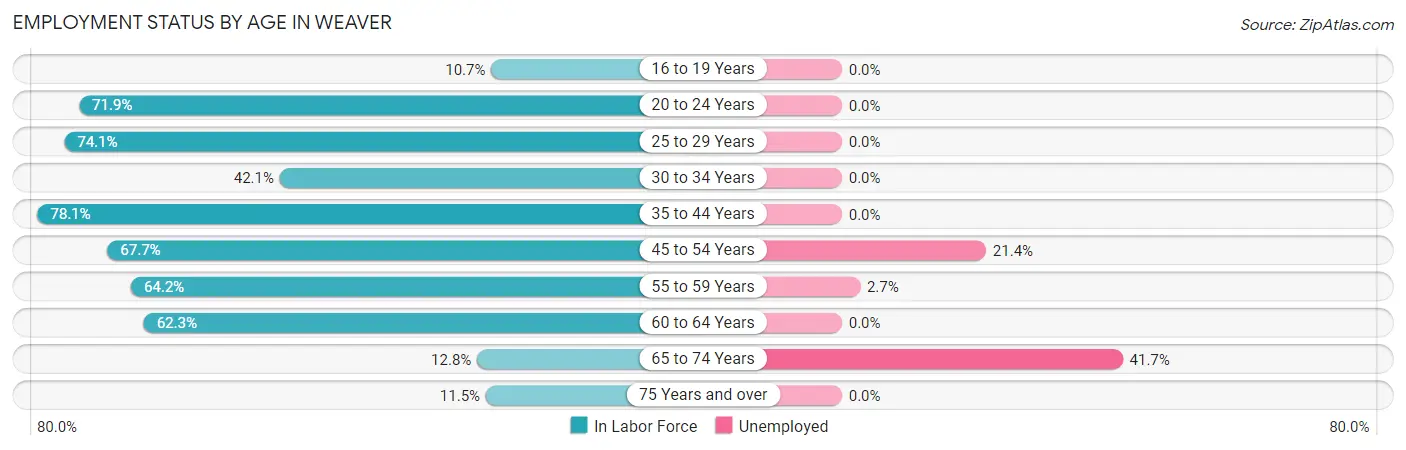
| Age Bracket | In Labor Force | Unemployed |
| 16 to 19 Years | 6 (10.7%) | 0 (0.0%) |
| 20 to 24 Years | 322 (71.9%) | 0 (0.0%) |
| 25 to 29 Years | 126 (74.1%) | 0 (0.0%) |
| 30 to 34 Years | 131 (42.1%) | 0 (0.0%) |
| 35 to 44 Years | 422 (78.1%) | 0 (0.0%) |
| 45 to 54 Years | 201 (67.7%) | 43 (21.4%) |
| 55 to 59 Years | 113 (64.2%) | 3 (2.7%) |
| 60 to 64 Years | 94 (62.3%) | 0 (0.0%) |
| 65 to 74 Years | 24 (12.8%) | 10 (41.7%) |
| 75 Years and over | 19 (11.5%) | 0 (0.0%) |
| Total | 1,458 (58.3%) | 55 (3.8%) |
Employment Status by Educational Attainment in Weaver
According to labor force statistics for Weaver, 66.1% of individuals (1,087) out of the total population between 25 and 64 years of age (1,645) are in the labor force, with 4.2% or 46 of them being unemployed. The group with the highest labor force participation rate are those with the educational attainment of less than high school, with 79.9% or 203 individuals in the labor force. Within the labor force, individuals with less than high school education have the highest percentage of unemployment, with 21.2% or 43 of them being unemployed.
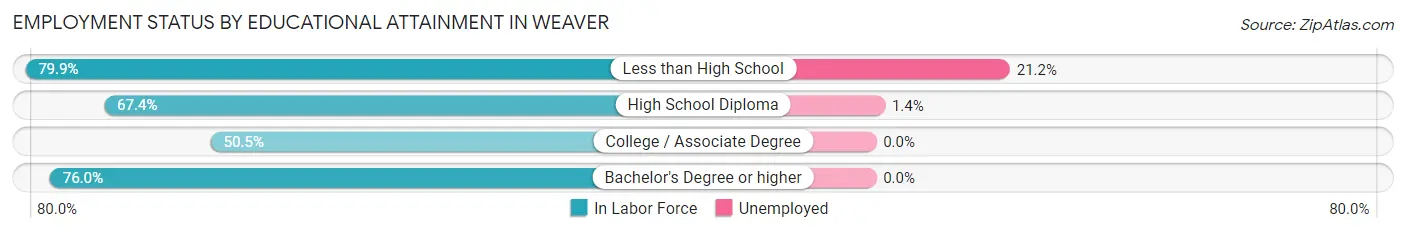
| Educational Attainment | In Labor Force | Unemployed |
| Less than High School | 203 (79.9%) | 54 (21.2%) |
| High School Diploma | 217 (67.4%) | 5 (1.4%) |
| College / Associate Degree | 288 (50.5%) | 0 (0.0%) |
| Bachelor's Degree or higher | 379 (76.0%) | 0 (0.0%) |
| Total | 1,087 (66.1%) | 69 (4.2%) |
Employment Occupations by Sex in Weaver
Management, Business, Science and Arts Occupations
The most common Management, Business, Science and Arts occupations in Weaver are Community & Social Service (167 | 11.9%), Education Instruction & Library (134 | 9.6%), Management (109 | 7.8%), Computers, Engineering & Science (100 | 7.1%), and Business & Financial (66 | 4.7%).
Management, Business, Science and Arts Occupations by Sex
Within the Management, Business, Science and Arts occupations in Weaver, the most male-oriented occupations are Architecture & Engineering (100.0%), Education, Arts & Media (100.0%), and Management (91.7%), while the most female-oriented occupations are Computers & Mathematics (100.0%), Life, Physical & Social Science (100.0%), and Health Technologists (100.0%).
| Occupation | Male | Female |
| Management | 100 (91.7%) | 9 (8.3%) |
| Business & Financial | 16 (24.2%) | 50 (75.8%) |
| Computers, Engineering & Science | 52 (52.0%) | 48 (48.0%) |
| Computers & Mathematics | 0 (0.0%) | 23 (100.0%) |
| Architecture & Engineering | 52 (100.0%) | 0 (0.0%) |
| Life, Physical & Social Science | 0 (0.0%) | 25 (100.0%) |
| Community & Social Service | 71 (42.5%) | 96 (57.5%) |
| Education, Arts & Media | 33 (100.0%) | 0 (0.0%) |
| Legal Services & Support | 0 (0.0%) | 0 (0.0%) |
| Education Instruction & Library | 38 (28.4%) | 96 (71.6%) |
| Arts, Media & Entertainment | 0 (0.0%) | 0 (0.0%) |
| Health Diagnosing & Treating | 12 (20.0%) | 48 (80.0%) |
| Health Technologists | 0 (0.0%) | 37 (100.0%) |
| Total (Category) | 251 (50.0%) | 251 (50.0%) |
| Total (Overall) | 864 (61.6%) | 538 (38.4%) |
Services Occupations
The most common Services occupations in Weaver are Personal Care & Service (77 | 5.5%), Food Preparation & Serving (31 | 2.2%), Cleaning & Maintenance (18 | 1.3%), Security & Protection (5 | 0.4%), and Law Enforcement (5 | 0.4%).
Services Occupations by Sex
Within the Services occupations in Weaver, the most male-oriented occupations are Security & Protection (100.0%), Law Enforcement (100.0%), and Food Preparation & Serving (41.9%), while the most female-oriented occupations are Cleaning & Maintenance (100.0%), Personal Care & Service (100.0%), and Food Preparation & Serving (58.1%).
| Occupation | Male | Female |
| Healthcare Support | 0 (0.0%) | 0 (0.0%) |
| Security & Protection | 5 (100.0%) | 0 (0.0%) |
| Firefighting & Prevention | 0 (0.0%) | 0 (0.0%) |
| Law Enforcement | 5 (100.0%) | 0 (0.0%) |
| Food Preparation & Serving | 13 (41.9%) | 18 (58.1%) |
| Cleaning & Maintenance | 0 (0.0%) | 18 (100.0%) |
| Personal Care & Service | 0 (0.0%) | 77 (100.0%) |
| Total (Category) | 18 (13.7%) | 113 (86.3%) |
| Total (Overall) | 864 (61.6%) | 538 (38.4%) |
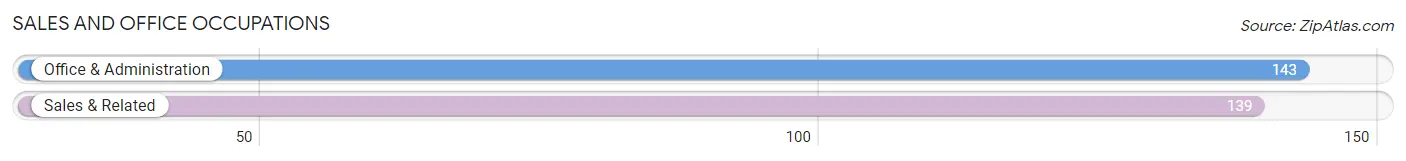
Sales and Office Occupations
The most common Sales and Office occupations in Weaver are Office & Administration (143 | 10.2%), and Sales & Related (139 | 9.9%).
Sales and Office Occupations by Sex
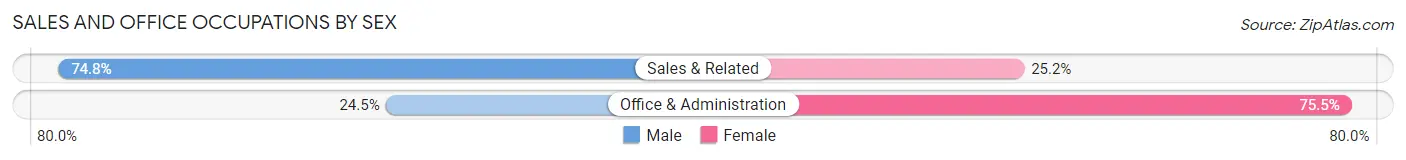
| Occupation | Male | Female |
| Sales & Related | 104 (74.8%) | 35 (25.2%) |
| Office & Administration | 35 (24.5%) | 108 (75.5%) |
| Total (Category) | 139 (49.3%) | 143 (50.7%) |
| Total (Overall) | 864 (61.6%) | 538 (38.4%) |
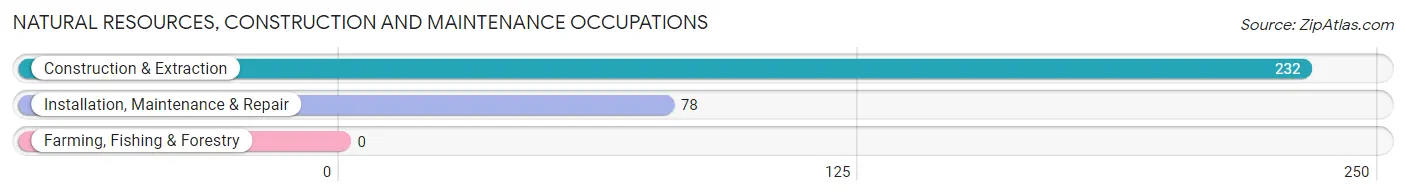
Natural Resources, Construction and Maintenance Occupations
The most common Natural Resources, Construction and Maintenance occupations in Weaver are Construction & Extraction (232 | 16.6%), and Installation, Maintenance & Repair (78 | 5.6%).
Natural Resources, Construction and Maintenance Occupations by Sex
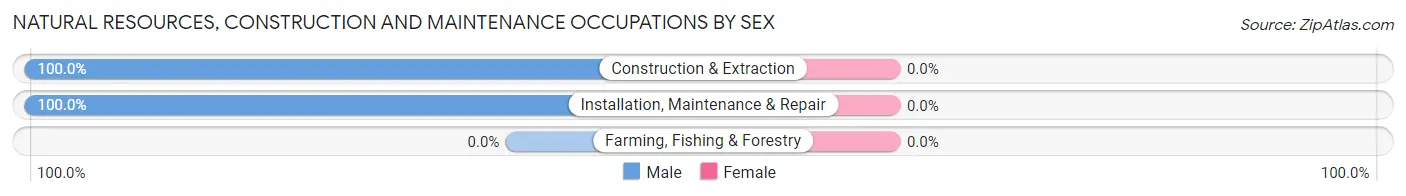
| Occupation | Male | Female |
| Farming, Fishing & Forestry | 0 (0.0%) | 0 (0.0%) |
| Construction & Extraction | 232 (100.0%) | 0 (0.0%) |
| Installation, Maintenance & Repair | 78 (100.0%) | 0 (0.0%) |
| Total (Category) | 310 (100.0%) | 0 (0.0%) |
| Total (Overall) | 864 (61.6%) | 538 (38.4%) |
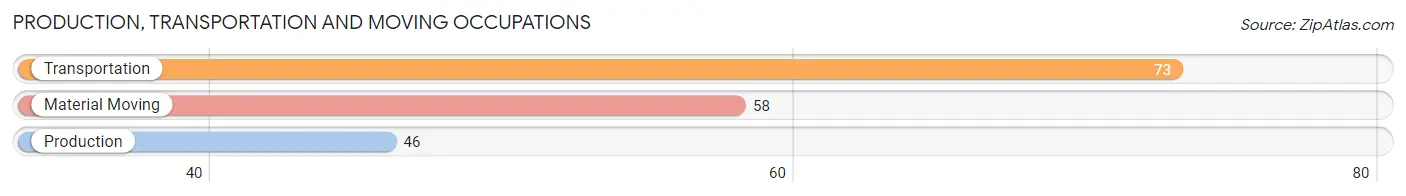
Production, Transportation and Moving Occupations
The most common Production, Transportation and Moving occupations in Weaver are Transportation (73 | 5.2%), Material Moving (58 | 4.1%), and Production (46 | 3.3%).
Production, Transportation and Moving Occupations by Sex
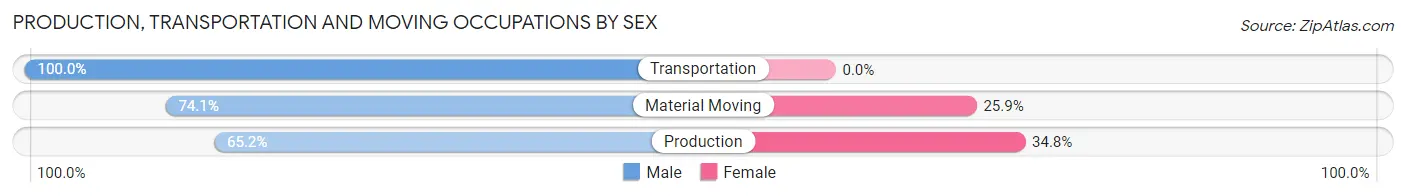
| Occupation | Male | Female |
| Production | 30 (65.2%) | 16 (34.8%) |
| Transportation | 73 (100.0%) | 0 (0.0%) |
| Material Moving | 43 (74.1%) | 15 (25.9%) |
| Total (Category) | 146 (82.5%) | 31 (17.5%) |
| Total (Overall) | 864 (61.6%) | 538 (38.4%) |
Employment Industries by Sex in Weaver
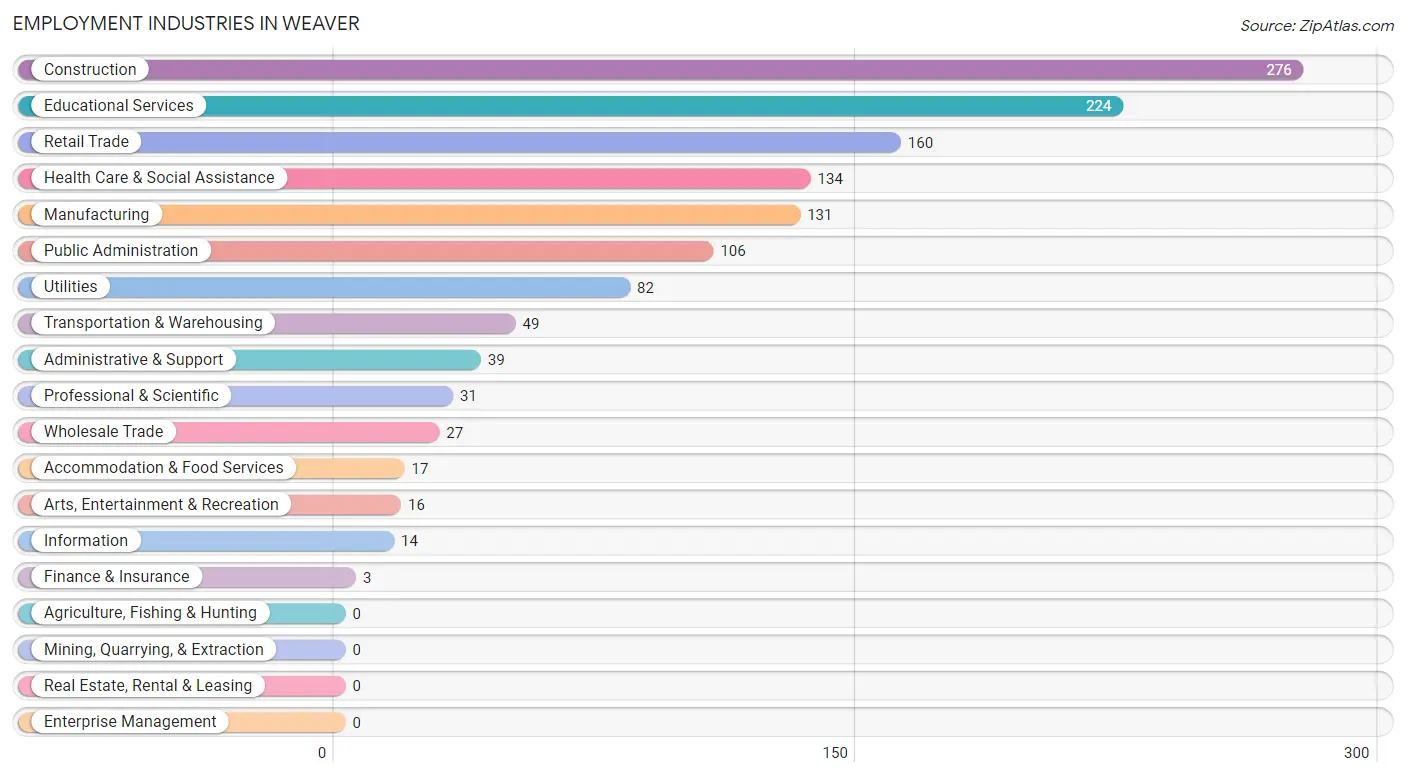
Employment Industries in Weaver
The major employment industries in Weaver include Construction (276 | 19.7%), Educational Services (224 | 16.0%), Retail Trade (160 | 11.4%), Health Care & Social Assistance (134 | 9.6%), and Manufacturing (131 | 9.3%).
Employment Industries by Sex in Weaver
The Weaver industries that see more men than women are Construction (100.0%), Wholesale Trade (100.0%), and Transportation & Warehousing (100.0%), whereas the industries that tend to have a higher number of women are Finance & Insurance (100.0%), Arts, Entertainment & Recreation (100.0%), and Health Care & Social Assistance (79.8%).
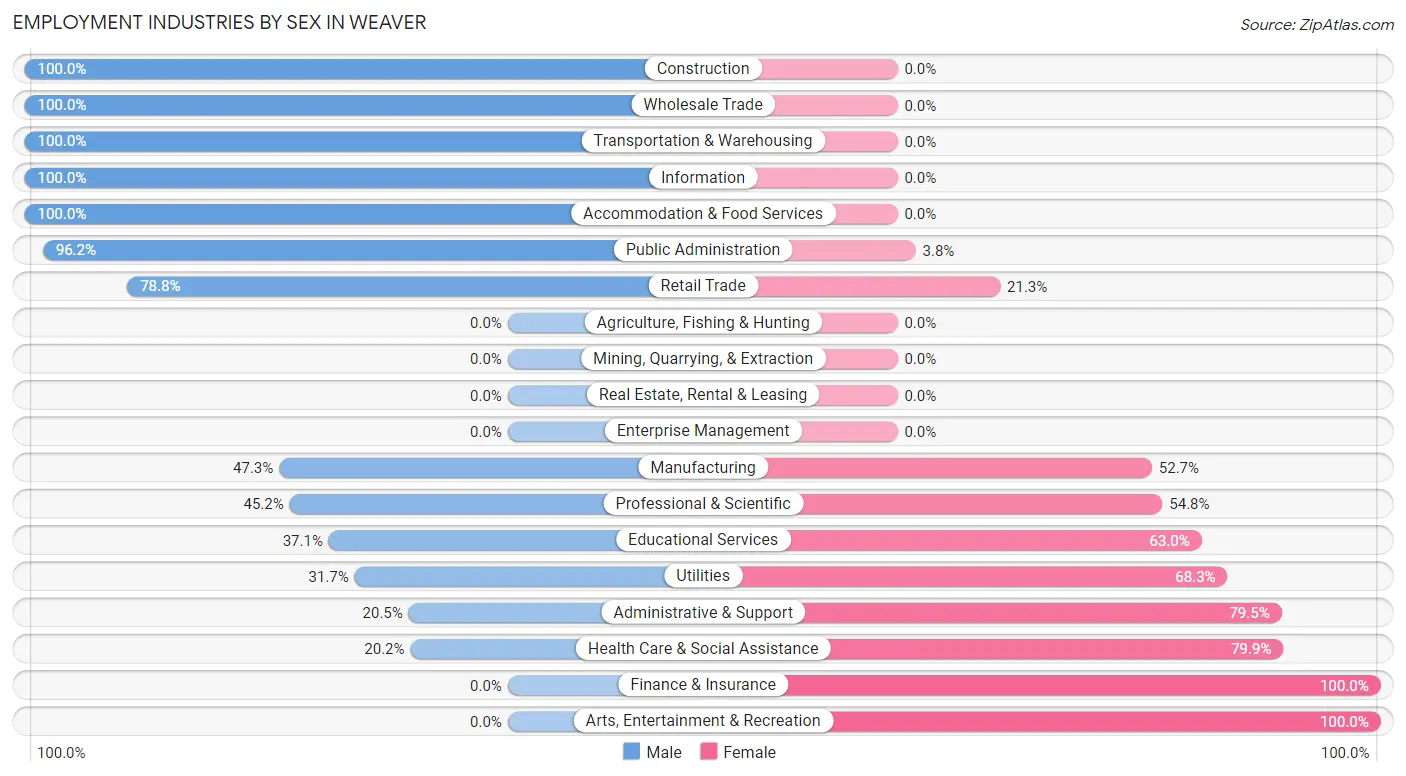
| Industry | Male | Female |
| Agriculture, Fishing & Hunting | 0 (0.0%) | 0 (0.0%) |
| Mining, Quarrying, & Extraction | 0 (0.0%) | 0 (0.0%) |
| Construction | 276 (100.0%) | 0 (0.0%) |
| Manufacturing | 62 (47.3%) | 69 (52.7%) |
| Wholesale Trade | 27 (100.0%) | 0 (0.0%) |
| Retail Trade | 126 (78.7%) | 34 (21.2%) |
| Transportation & Warehousing | 49 (100.0%) | 0 (0.0%) |
| Utilities | 26 (31.7%) | 56 (68.3%) |
| Information | 14 (100.0%) | 0 (0.0%) |
| Finance & Insurance | 0 (0.0%) | 3 (100.0%) |
| Real Estate, Rental & Leasing | 0 (0.0%) | 0 (0.0%) |
| Professional & Scientific | 14 (45.2%) | 17 (54.8%) |
| Enterprise Management | 0 (0.0%) | 0 (0.0%) |
| Administrative & Support | 8 (20.5%) | 31 (79.5%) |
| Educational Services | 83 (37.0%) | 141 (62.9%) |
| Health Care & Social Assistance | 27 (20.2%) | 107 (79.8%) |
| Arts, Entertainment & Recreation | 0 (0.0%) | 16 (100.0%) |
| Accommodation & Food Services | 17 (100.0%) | 0 (0.0%) |
| Public Administration | 102 (96.2%) | 4 (3.8%) |
| Total | 864 (61.6%) | 538 (38.4%) |
Education in Weaver
School Enrollment in Weaver
The most common levels of schooling among the 893 students in Weaver are college / undergraduate (281 | 31.5%), elementary school (244 | 27.3%), and high school (146 | 16.4%).
| School Level | # Students | % Students |
| Nursery / Preschool | 41 | 4.6% |
| Kindergarten | 54 | 6.0% |
| Elementary School | 244 | 27.3% |
| Middle School | 78 | 8.7% |
| High School | 146 | 16.4% |
| College / Undergraduate | 281 | 31.5% |
| Graduate / Professional | 49 | 5.5% |
| Total | 893 | 100.0% |
School Enrollment by Age by Funding Source in Weaver
Out of a total of 893 students who are enrolled in schools in Weaver, 212 (23.7%) attend a private institution, while the remaining 681 (76.3%) are enrolled in public schools. The age group of 20 to 24 year olds has the highest likelihood of being enrolled in private schools, with 52 (80.0% in the age bracket) enrolled. Conversely, the age group of 18 to 19 year olds has the lowest likelihood of being enrolled in a private school, with 11 (100.0% in the age bracket) attending a public institution.
| Age Bracket | Public School | Private School |
| 3 to 4 Year Olds | 0 (0.0%) | 0 (0.0%) |
| 5 to 9 Year Old | 246 (78.6%) | 67 (21.4%) |
| 10 to 14 Year Olds | 60 (54.0%) | 51 (46.0%) |
| 15 to 17 Year Olds | 86 (67.2%) | 42 (32.8%) |
| 18 to 19 Year Olds | 11 (100.0%) | 0 (0.0%) |
| 20 to 24 Year Olds | 13 (20.0%) | 52 (80.0%) |
| 25 to 34 Year Olds | 239 (100.0%) | 0 (0.0%) |
| 35 Years and over | 26 (100.0%) | 0 (0.0%) |
| Total | 681 (76.3%) | 212 (23.7%) |
Educational Attainment by Field of Study in Weaver
Science & technology (146 | 24.7%), business (114 | 19.3%), education (94 | 15.9%), liberal arts & history (60 | 10.2%), and visual & performing arts (55 | 9.3%) are the most common fields of study among 590 individuals in Weaver who have obtained a bachelor's degree or higher.
| Field of Study | # Graduates | % Graduates |
| Computers & Mathematics | 49 | 8.3% |
| Bio, Nature & Agricultural | 0 | 0.0% |
| Physical & Health Sciences | 0 | 0.0% |
| Psychology | 0 | 0.0% |
| Social Sciences | 14 | 2.4% |
| Engineering | 0 | 0.0% |
| Multidisciplinary Studies | 10 | 1.7% |
| Science & Technology | 146 | 24.7% |
| Business | 114 | 19.3% |
| Education | 94 | 15.9% |
| Literature & Languages | 0 | 0.0% |
| Liberal Arts & History | 60 | 10.2% |
| Visual & Performing Arts | 55 | 9.3% |
| Communications | 29 | 4.9% |
| Arts & Humanities | 19 | 3.2% |
| Total | 590 | 100.0% |
Transportation & Commute in Weaver
Vehicle Availability by Sex in Weaver
The most prevalent vehicle ownership categories in Weaver are males with 4 vehicles (246, accounting for 28.8%) and females with 4 vehicles (116, making up 53.4%).
| Vehicles Available | Male | Female |
| No Vehicle | 4 (0.5%) | 4 (0.9%) |
| 1 Vehicle | 91 (10.6%) | 57 (12.4%) |
| 2 Vehicles | 213 (24.9%) | 200 (43.4%) |
| 3 Vehicles | 160 (18.7%) | 76 (16.5%) |
| 4 Vehicles | 246 (28.8%) | 116 (25.2%) |
| 5 or more Vehicles | 141 (16.5%) | 8 (1.7%) |
| Total | 855 (100.0%) | 461 (100.0%) |
Commute Time in Weaver
The most frequently occuring commute durations in Weaver are 30 to 34 minutes (364 commuters, 28.7%), 60 to 89 minutes (172 commuters, 13.6%), and 10 to 14 minutes (167 commuters, 13.2%).
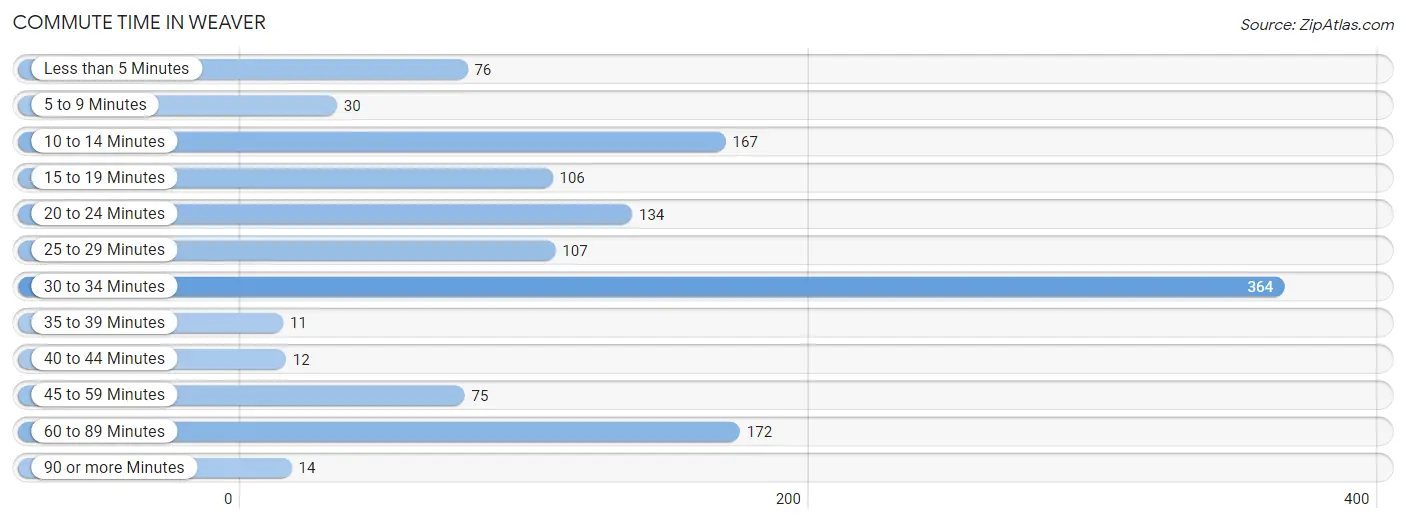
| Commute Time | # Commuters | % Commuters |
| Less than 5 Minutes | 76 | 6.0% |
| 5 to 9 Minutes | 30 | 2.4% |
| 10 to 14 Minutes | 167 | 13.2% |
| 15 to 19 Minutes | 106 | 8.4% |
| 20 to 24 Minutes | 134 | 10.6% |
| 25 to 29 Minutes | 107 | 8.4% |
| 30 to 34 Minutes | 364 | 28.7% |
| 35 to 39 Minutes | 11 | 0.9% |
| 40 to 44 Minutes | 12 | 0.9% |
| 45 to 59 Minutes | 75 | 5.9% |
| 60 to 89 Minutes | 172 | 13.6% |
| 90 or more Minutes | 14 | 1.1% |
Commute Time by Sex in Weaver
The most common commute times in Weaver are 30 to 34 minutes (308 commuters, 36.0%) for males and 10 to 14 minutes (64 commuters, 15.5%) for females.
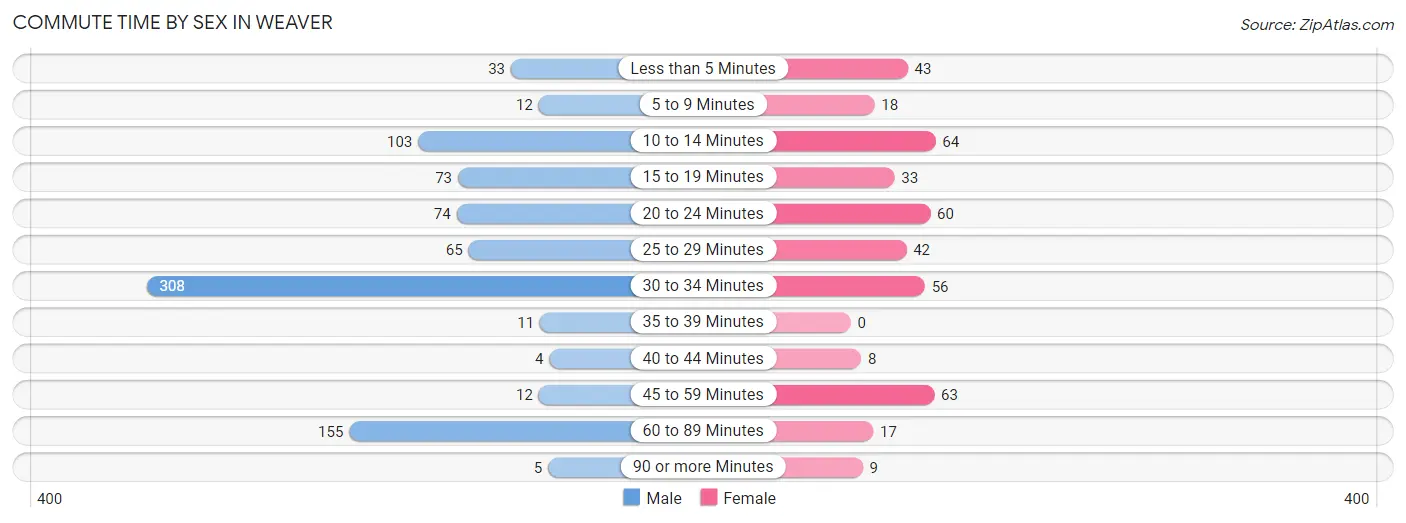
| Commute Time | Male | Female |
| Less than 5 Minutes | 33 (3.9%) | 43 (10.4%) |
| 5 to 9 Minutes | 12 (1.4%) | 18 (4.4%) |
| 10 to 14 Minutes | 103 (12.0%) | 64 (15.5%) |
| 15 to 19 Minutes | 73 (8.5%) | 33 (8.0%) |
| 20 to 24 Minutes | 74 (8.6%) | 60 (14.5%) |
| 25 to 29 Minutes | 65 (7.6%) | 42 (10.2%) |
| 30 to 34 Minutes | 308 (36.0%) | 56 (13.6%) |
| 35 to 39 Minutes | 11 (1.3%) | 0 (0.0%) |
| 40 to 44 Minutes | 4 (0.5%) | 8 (1.9%) |
| 45 to 59 Minutes | 12 (1.4%) | 63 (15.2%) |
| 60 to 89 Minutes | 155 (18.1%) | 17 (4.1%) |
| 90 or more Minutes | 5 (0.6%) | 9 (2.2%) |
Time of Departure to Work by Sex in Weaver
The most frequent times of departure to work in Weaver are 7:00 AM to 7:29 AM (232, 27.1%) for males and 7:00 AM to 7:29 AM (93, 22.5%) for females.
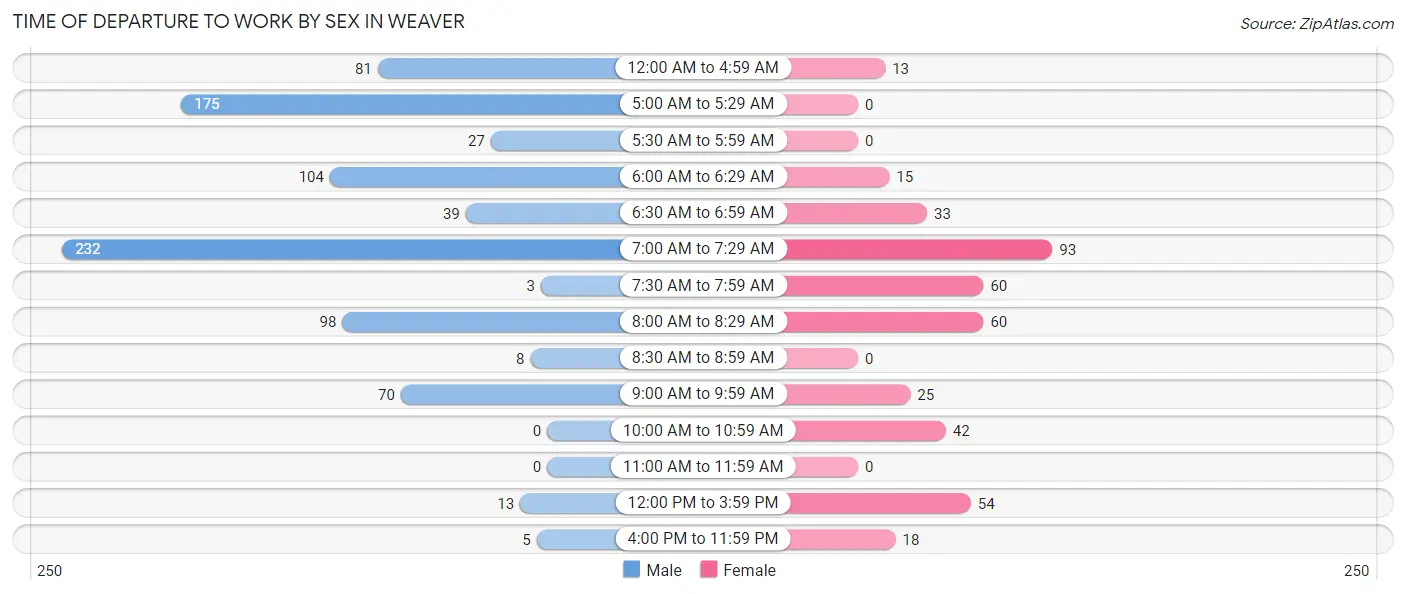
| Time of Departure | Male | Female |
| 12:00 AM to 4:59 AM | 81 (9.5%) | 13 (3.2%) |
| 5:00 AM to 5:29 AM | 175 (20.5%) | 0 (0.0%) |
| 5:30 AM to 5:59 AM | 27 (3.2%) | 0 (0.0%) |
| 6:00 AM to 6:29 AM | 104 (12.2%) | 15 (3.6%) |
| 6:30 AM to 6:59 AM | 39 (4.6%) | 33 (8.0%) |
| 7:00 AM to 7:29 AM | 232 (27.1%) | 93 (22.5%) |
| 7:30 AM to 7:59 AM | 3 (0.4%) | 60 (14.5%) |
| 8:00 AM to 8:29 AM | 98 (11.5%) | 60 (14.5%) |
| 8:30 AM to 8:59 AM | 8 (0.9%) | 0 (0.0%) |
| 9:00 AM to 9:59 AM | 70 (8.2%) | 25 (6.0%) |
| 10:00 AM to 10:59 AM | 0 (0.0%) | 42 (10.2%) |
| 11:00 AM to 11:59 AM | 0 (0.0%) | 0 (0.0%) |
| 12:00 PM to 3:59 PM | 13 (1.5%) | 54 (13.1%) |
| 4:00 PM to 11:59 PM | 5 (0.6%) | 18 (4.4%) |
| Total | 855 (100.0%) | 413 (100.0%) |
Housing Occupancy in Weaver
Occupancy by Ownership in Weaver
Of the total 1,106 dwellings in Weaver, owner-occupied units account for 914 (82.6%), while renter-occupied units make up 192 (17.4%).
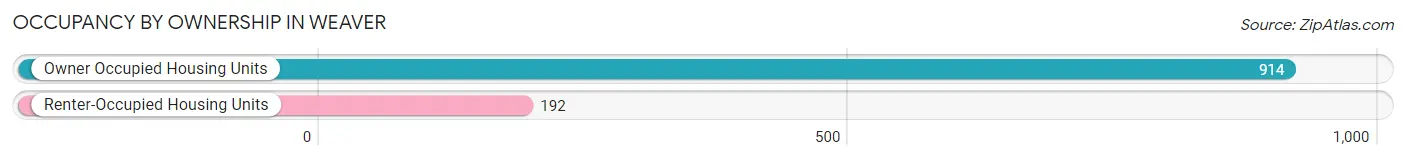
| Occupancy | # Housing Units | % Housing Units |
| Owner Occupied Housing Units | 914 | 82.6% |
| Renter-Occupied Housing Units | 192 | 17.4% |
| Total Occupied Housing Units | 1,106 | 100.0% |
Occupancy by Household Size in Weaver
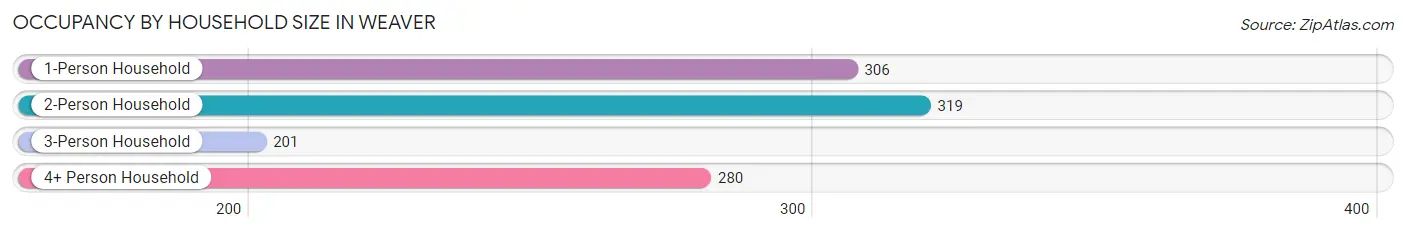
| Household Size | # Housing Units | % Housing Units |
| 1-Person Household | 306 | 27.7% |
| 2-Person Household | 319 | 28.8% |
| 3-Person Household | 201 | 18.2% |
| 4+ Person Household | 280 | 25.3% |
| Total Housing Units | 1,106 | 100.0% |
Occupancy by Ownership by Household Size in Weaver
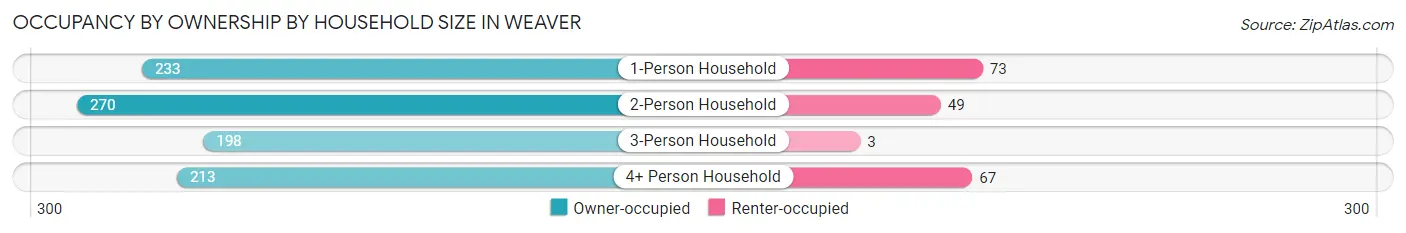
| Household Size | Owner-occupied | Renter-occupied |
| 1-Person Household | 233 (76.1%) | 73 (23.9%) |
| 2-Person Household | 270 (84.6%) | 49 (15.4%) |
| 3-Person Household | 198 (98.5%) | 3 (1.5%) |
| 4+ Person Household | 213 (76.1%) | 67 (23.9%) |
| Total Housing Units | 914 (82.6%) | 192 (17.4%) |
Occupancy by Educational Attainment in Weaver
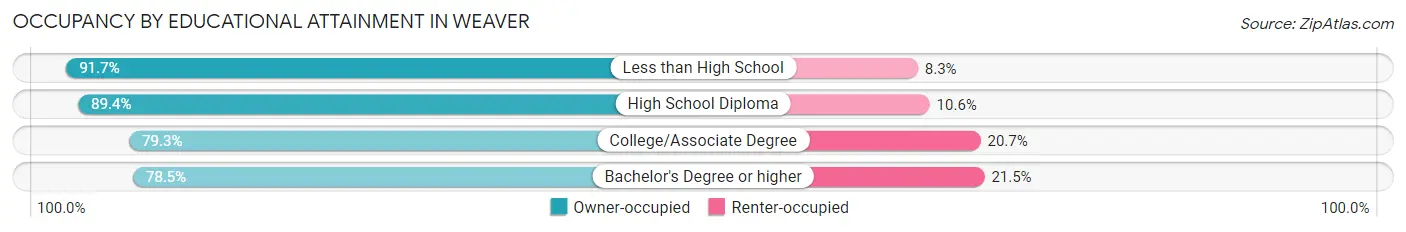
| Household Size | Owner-occupied | Renter-occupied |
| Less than High School | 111 (91.7%) | 10 (8.3%) |
| High School Diploma | 219 (89.4%) | 26 (10.6%) |
| College/Associate Degree | 295 (79.3%) | 77 (20.7%) |
| Bachelor's Degree or higher | 289 (78.5%) | 79 (21.5%) |
Occupancy by Age of Householder in Weaver
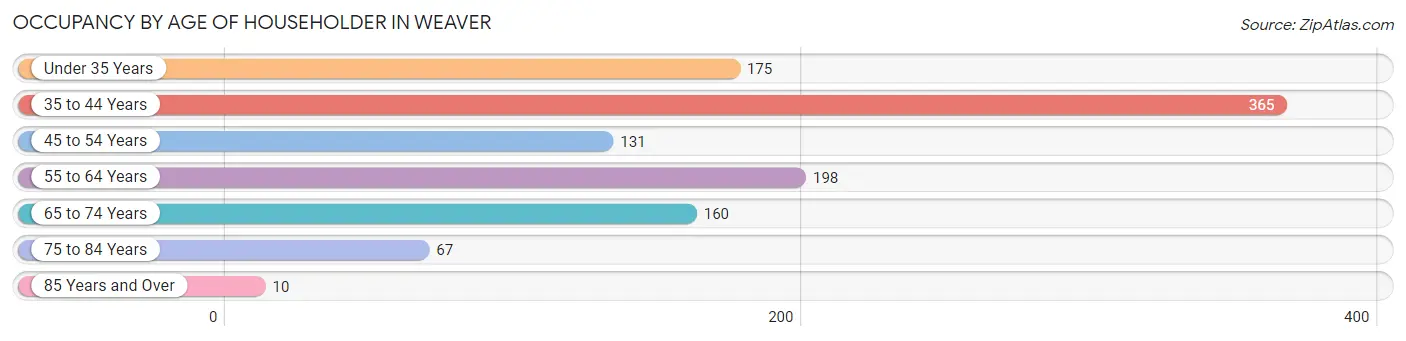
| Age Bracket | # Households | % Households |
| Under 35 Years | 175 | 15.8% |
| 35 to 44 Years | 365 | 33.0% |
| 45 to 54 Years | 131 | 11.8% |
| 55 to 64 Years | 198 | 17.9% |
| 65 to 74 Years | 160 | 14.5% |
| 75 to 84 Years | 67 | 6.1% |
| 85 Years and Over | 10 | 0.9% |
| Total | 1,106 | 100.0% |
Housing Finances in Weaver
Median Income by Occupancy in Weaver
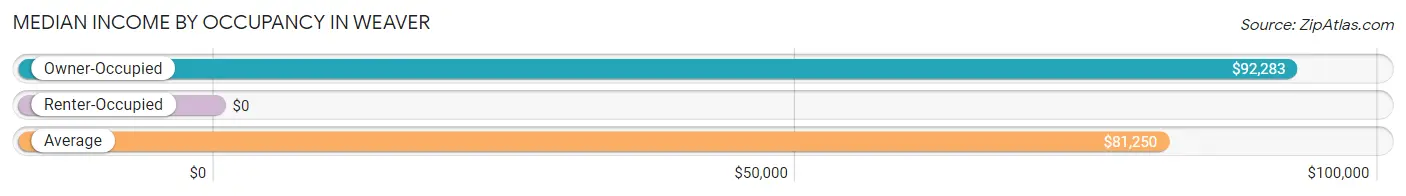
| Occupancy Type | # Households | Median Income |
| Owner-Occupied | 914 (82.6%) | $92,283 |
| Renter-Occupied | 192 (17.4%) | $0 |
| Average | 1,106 (100.0%) | $81,250 |
Occupancy by Householder Income Bracket in Weaver
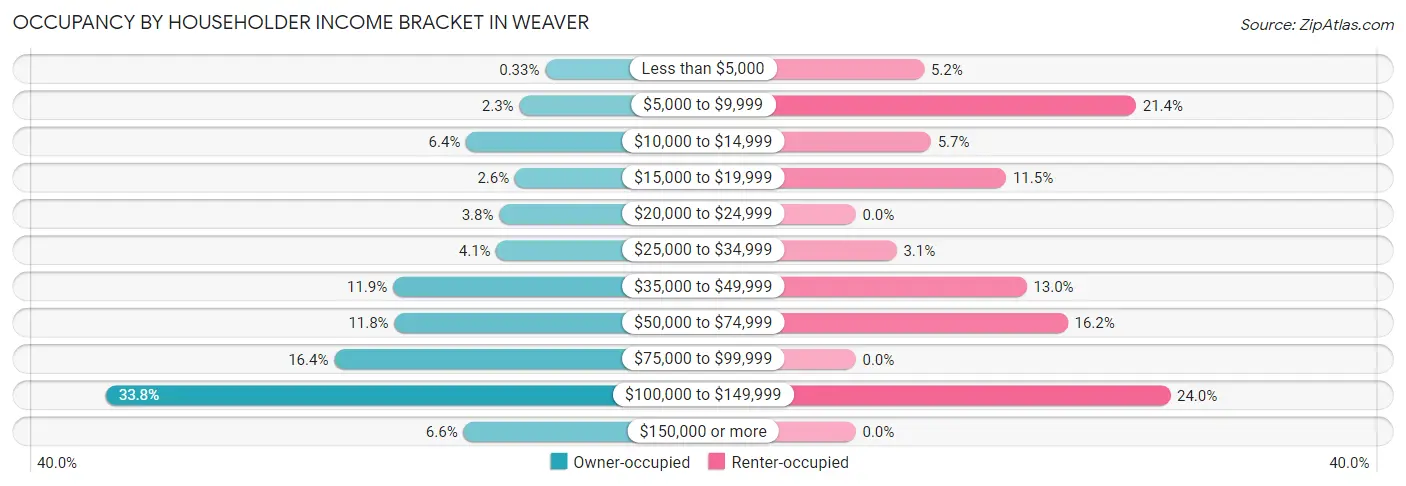
| Income Bracket | Owner-occupied | Renter-occupied |
| Less than $5,000 | 3 (0.3%) | 10 (5.2%) |
| $5,000 to $9,999 | 21 (2.3%) | 41 (21.3%) |
| $10,000 to $14,999 | 58 (6.4%) | 11 (5.7%) |
| $15,000 to $19,999 | 24 (2.6%) | 22 (11.5%) |
| $20,000 to $24,999 | 35 (3.8%) | 0 (0.0%) |
| $25,000 to $34,999 | 37 (4.1%) | 6 (3.1%) |
| $35,000 to $49,999 | 109 (11.9%) | 25 (13.0%) |
| $50,000 to $74,999 | 108 (11.8%) | 31 (16.2%) |
| $75,000 to $99,999 | 150 (16.4%) | 0 (0.0%) |
| $100,000 to $149,999 | 309 (33.8%) | 46 (24.0%) |
| $150,000 or more | 60 (6.6%) | 0 (0.0%) |
| Total | 914 (100.0%) | 192 (100.0%) |
Monthly Housing Cost Tiers in Weaver
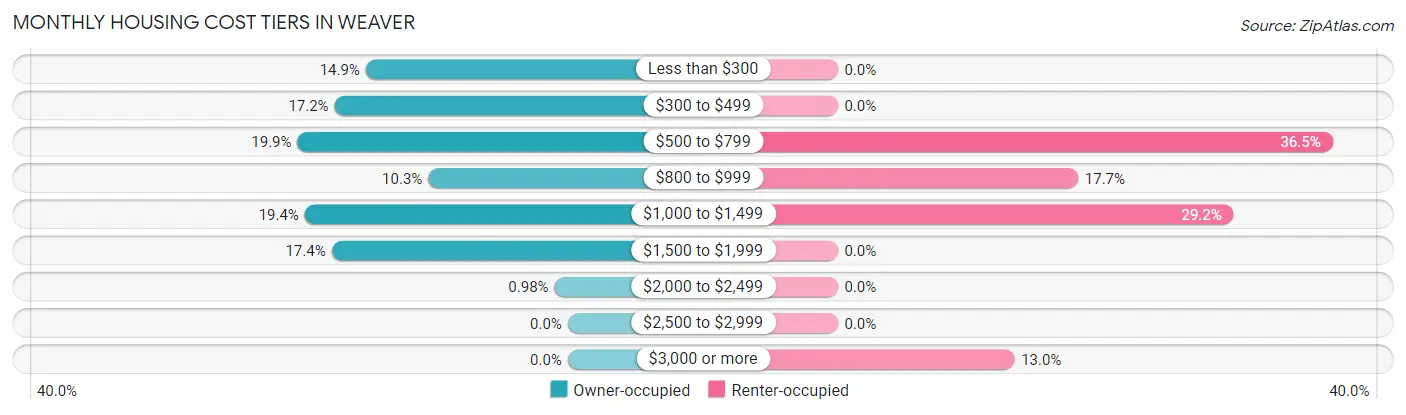
| Monthly Cost | Owner-occupied | Renter-occupied |
| Less than $300 | 136 (14.9%) | 0 (0.0%) |
| $300 to $499 | 157 (17.2%) | 0 (0.0%) |
| $500 to $799 | 182 (19.9%) | 70 (36.5%) |
| $800 to $999 | 94 (10.3%) | 34 (17.7%) |
| $1,000 to $1,499 | 177 (19.4%) | 56 (29.2%) |
| $1,500 to $1,999 | 159 (17.4%) | 0 (0.0%) |
| $2,000 to $2,499 | 9 (1.0%) | 0 (0.0%) |
| $2,500 to $2,999 | 0 (0.0%) | 0 (0.0%) |
| $3,000 or more | 0 (0.0%) | 25 (13.0%) |
| Total | 914 (100.0%) | 192 (100.0%) |
Physical Housing Characteristics in Weaver
Housing Structures in Weaver
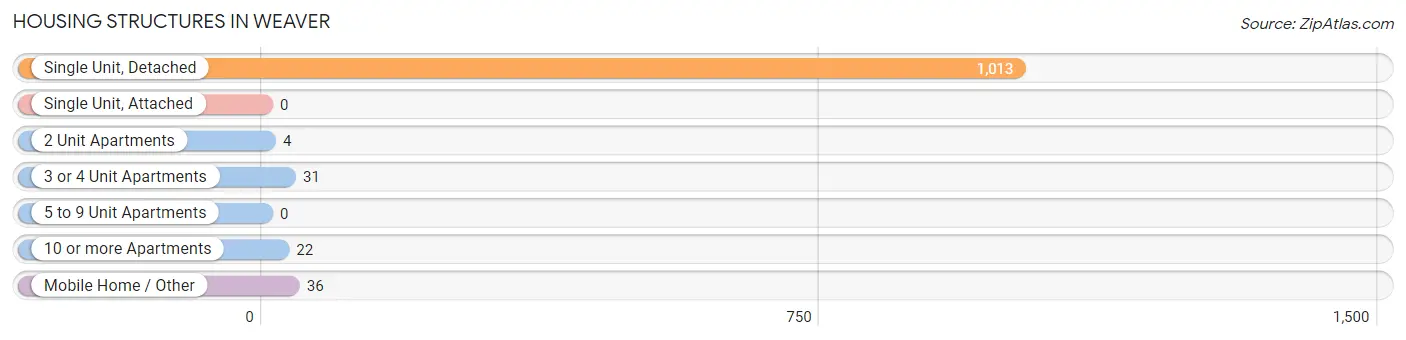
| Structure Type | # Housing Units | % Housing Units |
| Single Unit, Detached | 1,013 | 91.6% |
| Single Unit, Attached | 0 | 0.0% |
| 2 Unit Apartments | 4 | 0.4% |
| 3 or 4 Unit Apartments | 31 | 2.8% |
| 5 to 9 Unit Apartments | 0 | 0.0% |
| 10 or more Apartments | 22 | 2.0% |
| Mobile Home / Other | 36 | 3.3% |
| Total | 1,106 | 100.0% |
Housing Structures by Occupancy in Weaver
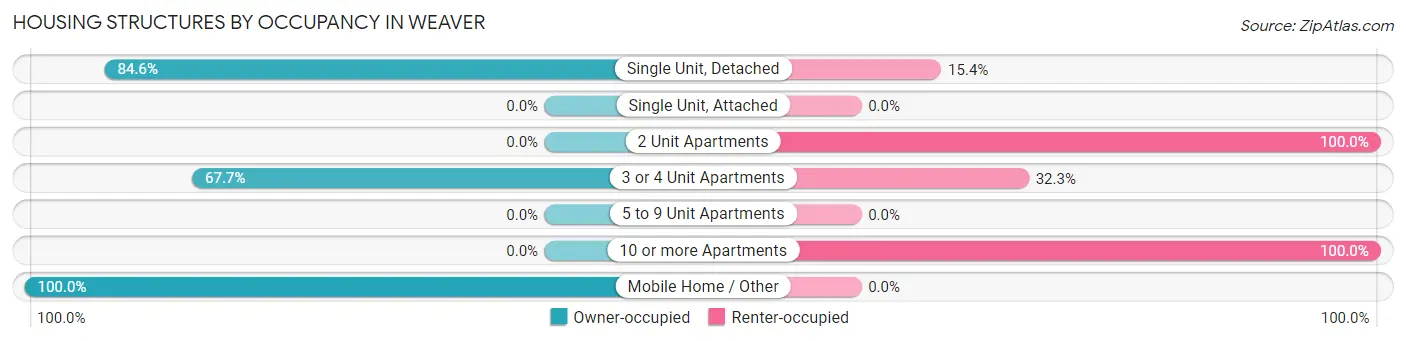
| Structure Type | Owner-occupied | Renter-occupied |
| Single Unit, Detached | 857 (84.6%) | 156 (15.4%) |
| Single Unit, Attached | 0 (0.0%) | 0 (0.0%) |
| 2 Unit Apartments | 0 (0.0%) | 4 (100.0%) |
| 3 or 4 Unit Apartments | 21 (67.7%) | 10 (32.3%) |
| 5 to 9 Unit Apartments | 0 (0.0%) | 0 (0.0%) |
| 10 or more Apartments | 0 (0.0%) | 22 (100.0%) |
| Mobile Home / Other | 36 (100.0%) | 0 (0.0%) |
| Total | 914 (82.6%) | 192 (17.4%) |
Housing Structures by Number of Rooms in Weaver
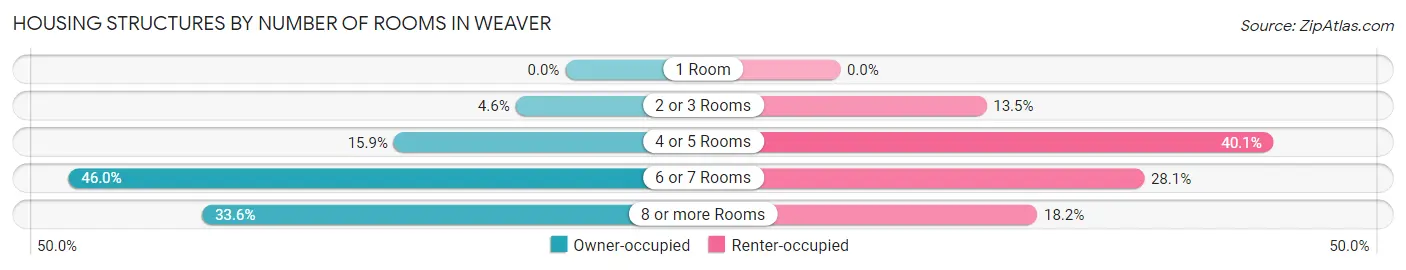
| Number of Rooms | Owner-occupied | Renter-occupied |
| 1 Room | 0 (0.0%) | 0 (0.0%) |
| 2 or 3 Rooms | 42 (4.6%) | 26 (13.5%) |
| 4 or 5 Rooms | 145 (15.9%) | 77 (40.1%) |
| 6 or 7 Rooms | 420 (46.0%) | 54 (28.1%) |
| 8 or more Rooms | 307 (33.6%) | 35 (18.2%) |
| Total | 914 (100.0%) | 192 (100.0%) |
Housing Structure by Heating Type in Weaver
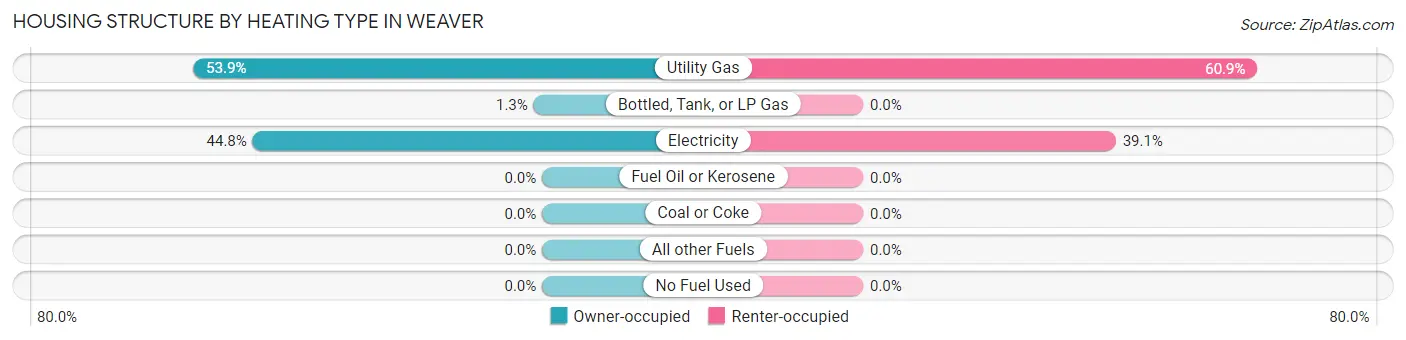
| Heating Type | Owner-occupied | Renter-occupied |
| Utility Gas | 493 (53.9%) | 117 (60.9%) |
| Bottled, Tank, or LP Gas | 12 (1.3%) | 0 (0.0%) |
| Electricity | 409 (44.8%) | 75 (39.1%) |
| Fuel Oil or Kerosene | 0 (0.0%) | 0 (0.0%) |
| Coal or Coke | 0 (0.0%) | 0 (0.0%) |
| All other Fuels | 0 (0.0%) | 0 (0.0%) |
| No Fuel Used | 0 (0.0%) | 0 (0.0%) |
| Total | 914 (100.0%) | 192 (100.0%) |
Household Vehicle Usage in Weaver
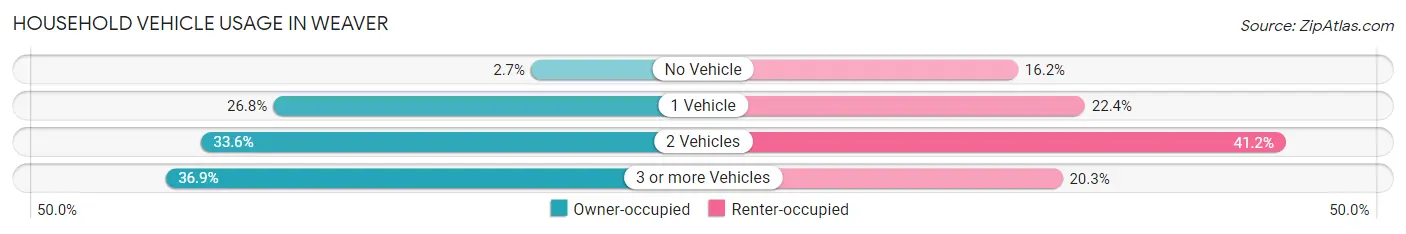
| Vehicles per Household | Owner-occupied | Renter-occupied |
| No Vehicle | 25 (2.7%) | 31 (16.2%) |
| 1 Vehicle | 245 (26.8%) | 43 (22.4%) |
| 2 Vehicles | 307 (33.6%) | 79 (41.1%) |
| 3 or more Vehicles | 337 (36.9%) | 39 (20.3%) |
| Total | 914 (100.0%) | 192 (100.0%) |
Real Estate & Mortgages in Weaver
Real Estate and Mortgage Overview in Weaver
| Characteristic | Without Mortgage | With Mortgage |
| Housing Units | 362 | 552 |
| Median Property Value | $98,600 | $146,200 |
| Median Household Income | $53,958 | $60 |
| Monthly Housing Costs | $337 | $0 |
| Real Estate Taxes | $407 | $47 |
Property Value by Mortgage Status in Weaver
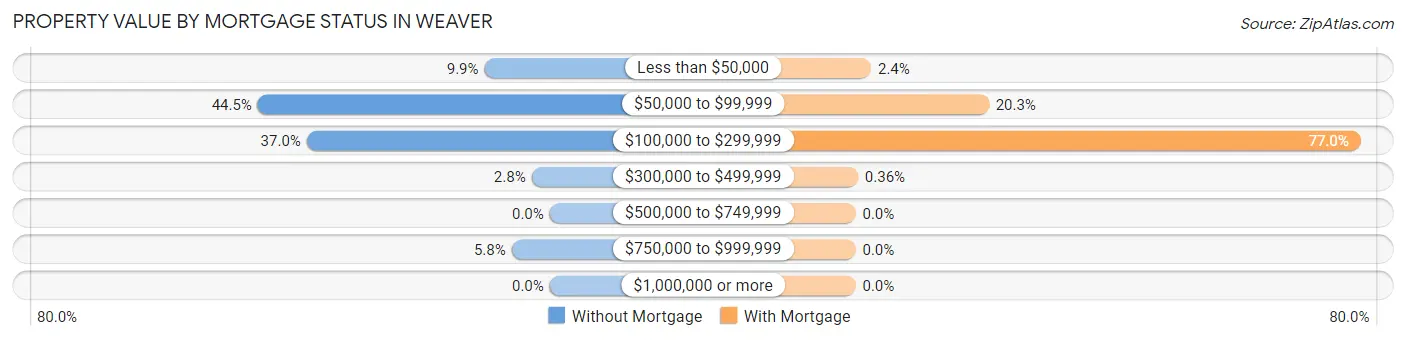
| Property Value | Without Mortgage | With Mortgage |
| Less than $50,000 | 36 (9.9%) | 13 (2.4%) |
| $50,000 to $99,999 | 161 (44.5%) | 112 (20.3%) |
| $100,000 to $299,999 | 134 (37.0%) | 425 (77.0%) |
| $300,000 to $499,999 | 10 (2.8%) | 2 (0.4%) |
| $500,000 to $749,999 | 0 (0.0%) | 0 (0.0%) |
| $750,000 to $999,999 | 21 (5.8%) | 0 (0.0%) |
| $1,000,000 or more | 0 (0.0%) | 0 (0.0%) |
| Total | 362 (100.0%) | 552 (100.0%) |
Household Income by Mortgage Status in Weaver
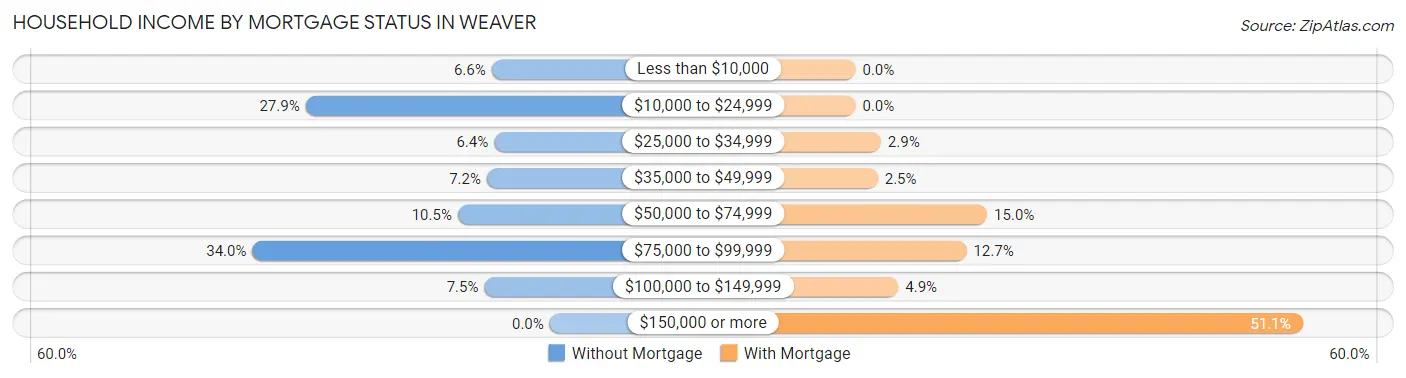
| Household Income | Without Mortgage | With Mortgage |
| Less than $10,000 | 24 (6.6%) | 0 (0.0%) |
| $10,000 to $24,999 | 101 (27.9%) | 0 (0.0%) |
| $25,000 to $34,999 | 23 (6.4%) | 16 (2.9%) |
| $35,000 to $49,999 | 26 (7.2%) | 14 (2.5%) |
| $50,000 to $74,999 | 38 (10.5%) | 83 (15.0%) |
| $75,000 to $99,999 | 123 (34.0%) | 70 (12.7%) |
| $100,000 to $149,999 | 27 (7.5%) | 27 (4.9%) |
| $150,000 or more | 0 (0.0%) | 282 (51.1%) |
| Total | 362 (100.0%) | 552 (100.0%) |
Property Value to Household Income Ratio in Weaver
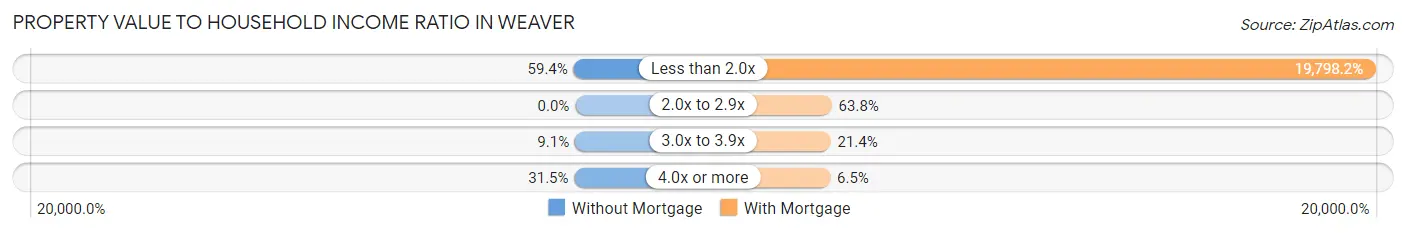
| Value-to-Income Ratio | Without Mortgage | With Mortgage |
| Less than 2.0x | 215 (59.4%) | 109,286 (19,798.2%) |
| 2.0x to 2.9x | 0 (0.0%) | 352 (63.8%) |
| 3.0x to 3.9x | 33 (9.1%) | 118 (21.4%) |
| 4.0x or more | 114 (31.5%) | 36 (6.5%) |
| Total | 362 (100.0%) | 552 (100.0%) |
Real Estate Taxes by Mortgage Status in Weaver
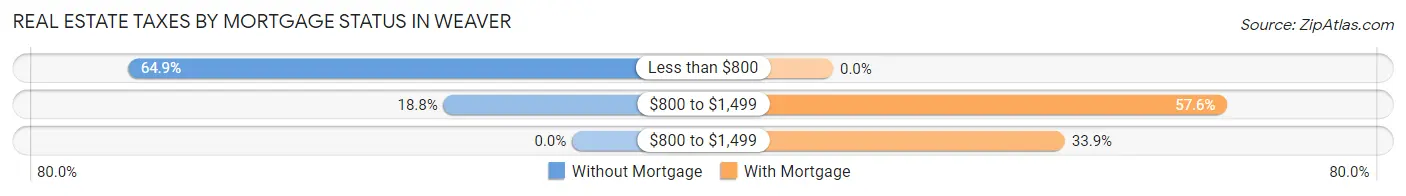
| Property Taxes | Without Mortgage | With Mortgage |
| Less than $800 | 235 (64.9%) | 0 (0.0%) |
| $800 to $1,499 | 68 (18.8%) | 318 (57.6%) |
| $800 to $1,499 | 0 (0.0%) | 187 (33.9%) |
| Total | 362 (100.0%) | 552 (100.0%) |
Health & Disability in Weaver
Health Insurance Coverage by Age in Weaver
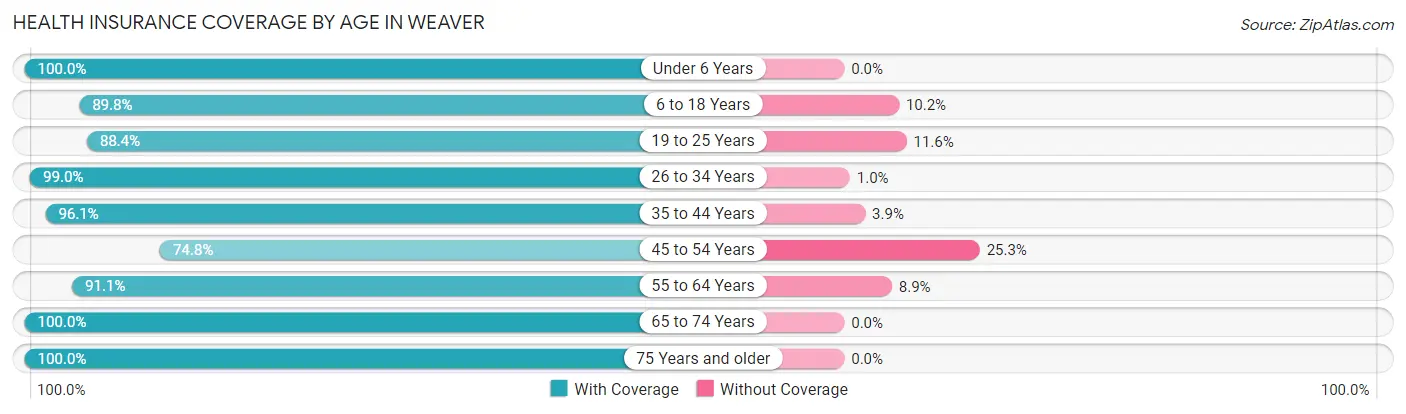
| Age Bracket | With Coverage | Without Coverage |
| Under 6 Years | 327 (100.0%) | 0 (0.0%) |
| 6 to 18 Years | 485 (89.8%) | 55 (10.2%) |
| 19 to 25 Years | 396 (88.4%) | 52 (11.6%) |
| 26 to 34 Years | 476 (99.0%) | 5 (1.0%) |
| 35 to 44 Years | 519 (96.1%) | 21 (3.9%) |
| 45 to 54 Years | 222 (74.8%) | 75 (25.3%) |
| 55 to 64 Years | 298 (91.1%) | 29 (8.9%) |
| 65 to 74 Years | 187 (100.0%) | 0 (0.0%) |
| 75 Years and older | 165 (100.0%) | 0 (0.0%) |
| Total | 3,075 (92.8%) | 237 (7.2%) |
Health Insurance Coverage by Citizenship Status in Weaver
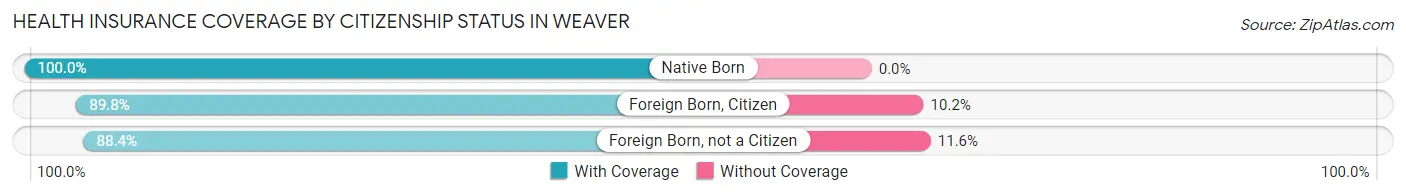
| Citizenship Status | With Coverage | Without Coverage |
| Native Born | 327 (100.0%) | 0 (0.0%) |
| Foreign Born, Citizen | 485 (89.8%) | 55 (10.2%) |
| Foreign Born, not a Citizen | 396 (88.4%) | 52 (11.6%) |
Health Insurance Coverage by Household Income in Weaver
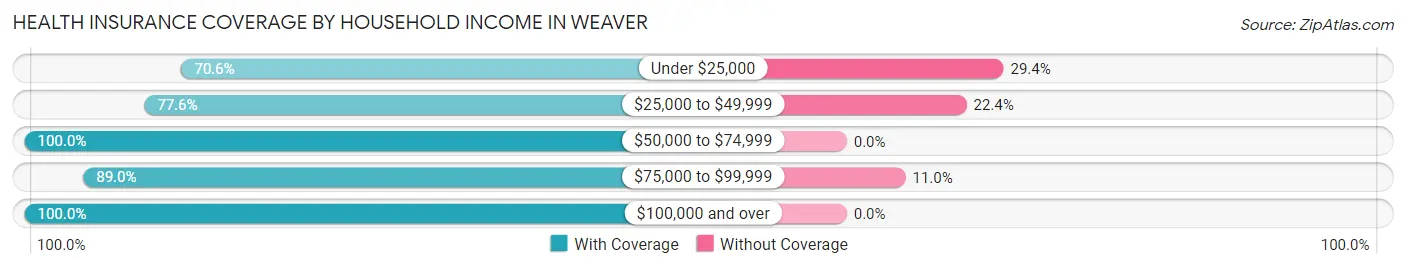
| Household Income | With Coverage | Without Coverage |
| Under $25,000 | 202 (70.6%) | 84 (29.4%) |
| $25,000 to $49,999 | 377 (77.6%) | 109 (22.4%) |
| $50,000 to $74,999 | 317 (100.0%) | 0 (0.0%) |
| $75,000 to $99,999 | 356 (89.0%) | 44 (11.0%) |
| $100,000 and over | 1,823 (100.0%) | 0 (0.0%) |
Public vs Private Health Insurance Coverage by Age in Weaver
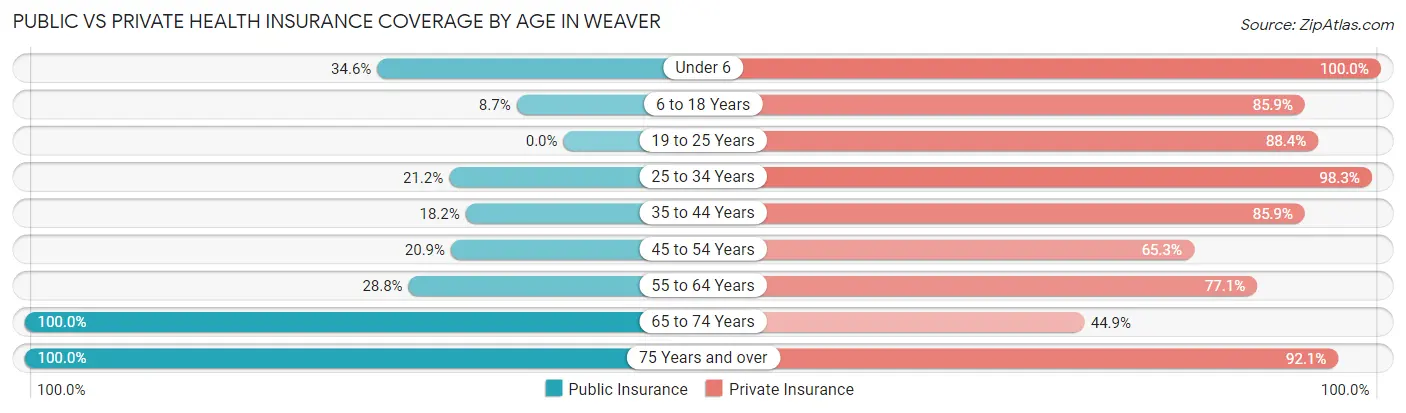
| Age Bracket | Public Insurance | Private Insurance |
| Under 6 | 113 (34.6%) | 327 (100.0%) |
| 6 to 18 Years | 47 (8.7%) | 464 (85.9%) |
| 19 to 25 Years | 0 (0.0%) | 396 (88.4%) |
| 25 to 34 Years | 102 (21.2%) | 473 (98.3%) |
| 35 to 44 Years | 98 (18.1%) | 464 (85.9%) |
| 45 to 54 Years | 62 (20.9%) | 194 (65.3%) |
| 55 to 64 Years | 94 (28.7%) | 252 (77.1%) |
| 65 to 74 Years | 187 (100.0%) | 84 (44.9%) |
| 75 Years and over | 165 (100.0%) | 152 (92.1%) |
| Total | 868 (26.2%) | 2,806 (84.7%) |
Disability Status by Sex by Age in Weaver
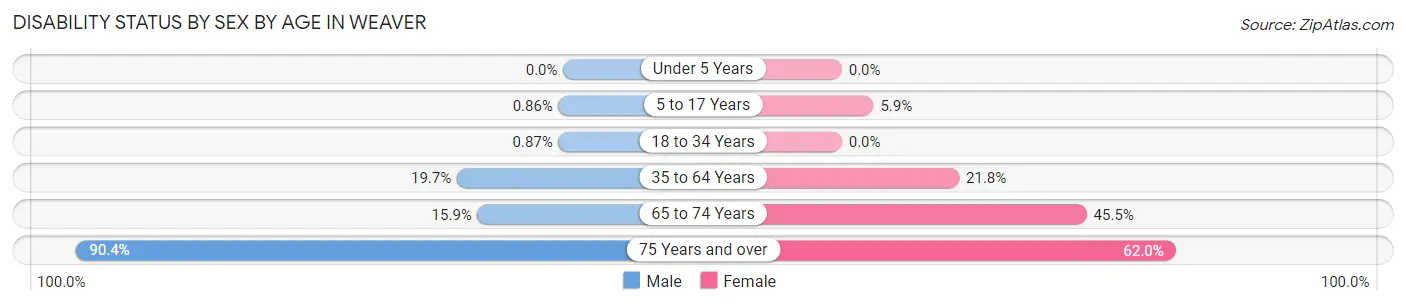
| Age Bracket | Male | Female |
| Under 5 Years | 0 (0.0%) | 0 (0.0%) |
| 5 to 17 Years | 3 (0.9%) | 12 (5.9%) |
| 18 to 34 Years | 3 (0.9%) | 0 (0.0%) |
| 35 to 64 Years | 130 (19.7%) | 110 (21.8%) |
| 65 to 74 Years | 7 (15.9%) | 65 (45.5%) |
| 75 Years and over | 47 (90.4%) | 70 (62.0%) |
Disability Class by Sex by Age in Weaver
Disability Class: Hearing Difficulty
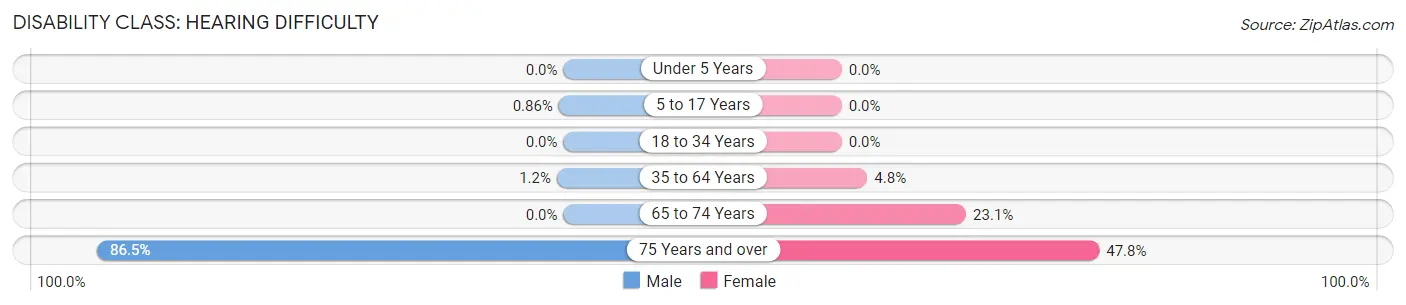
| Age Bracket | Male | Female |
| Under 5 Years | 0 (0.0%) | 0 (0.0%) |
| 5 to 17 Years | 3 (0.9%) | 0 (0.0%) |
| 18 to 34 Years | 0 (0.0%) | 0 (0.0%) |
| 35 to 64 Years | 8 (1.2%) | 24 (4.8%) |
| 65 to 74 Years | 0 (0.0%) | 33 (23.1%) |
| 75 Years and over | 45 (86.5%) | 54 (47.8%) |
Disability Class: Vision Difficulty
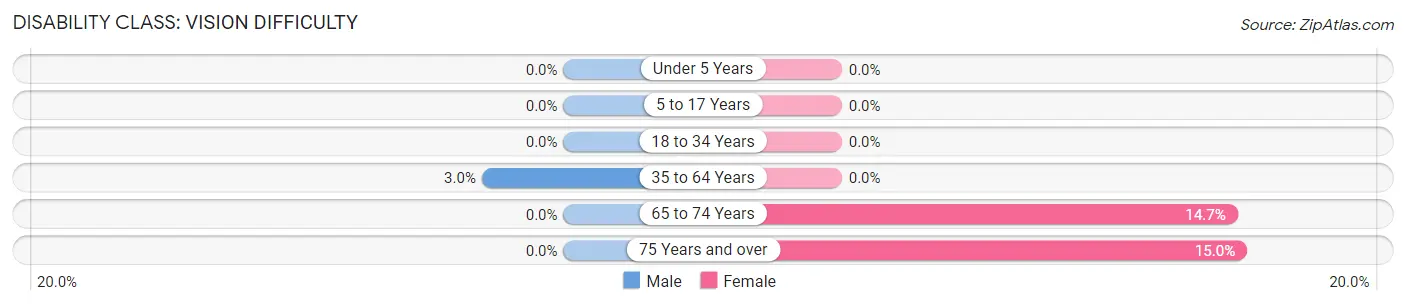
| Age Bracket | Male | Female |
| Under 5 Years | 0 (0.0%) | 0 (0.0%) |
| 5 to 17 Years | 0 (0.0%) | 0 (0.0%) |
| 18 to 34 Years | 0 (0.0%) | 0 (0.0%) |
| 35 to 64 Years | 20 (3.0%) | 0 (0.0%) |
| 65 to 74 Years | 0 (0.0%) | 21 (14.7%) |
| 75 Years and over | 0 (0.0%) | 17 (15.0%) |
Disability Class: Cognitive Difficulty
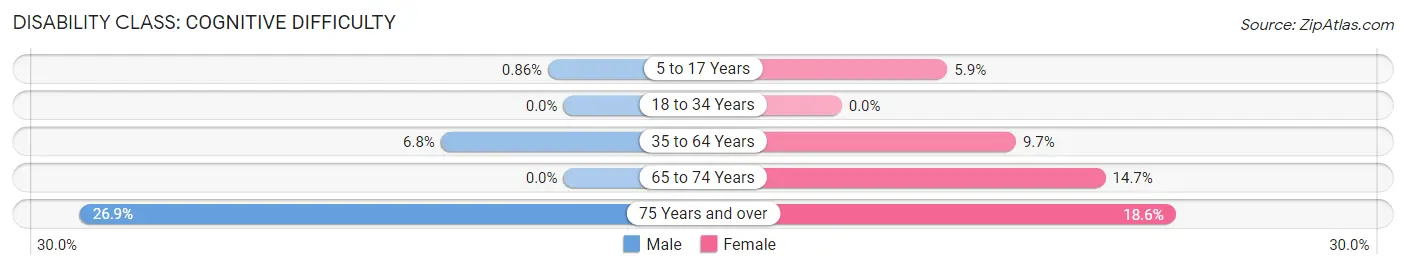
| Age Bracket | Male | Female |
| 5 to 17 Years | 3 (0.9%) | 12 (5.9%) |
| 18 to 34 Years | 0 (0.0%) | 0 (0.0%) |
| 35 to 64 Years | 45 (6.8%) | 49 (9.7%) |
| 65 to 74 Years | 0 (0.0%) | 21 (14.7%) |
| 75 Years and over | 14 (26.9%) | 21 (18.6%) |
Disability Class: Ambulatory Difficulty
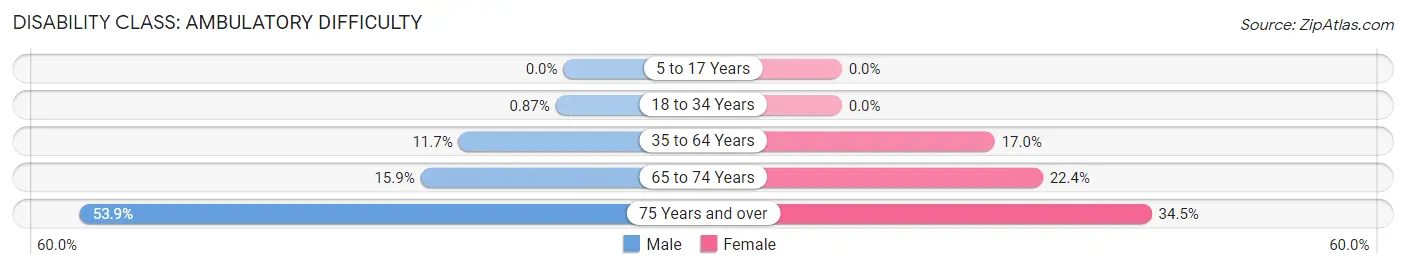
| Age Bracket | Male | Female |
| 5 to 17 Years | 0 (0.0%) | 0 (0.0%) |
| 18 to 34 Years | 3 (0.9%) | 0 (0.0%) |
| 35 to 64 Years | 77 (11.7%) | 86 (17.0%) |
| 65 to 74 Years | 7 (15.9%) | 32 (22.4%) |
| 75 Years and over | 28 (53.8%) | 39 (34.5%) |
Disability Class: Self-Care Difficulty
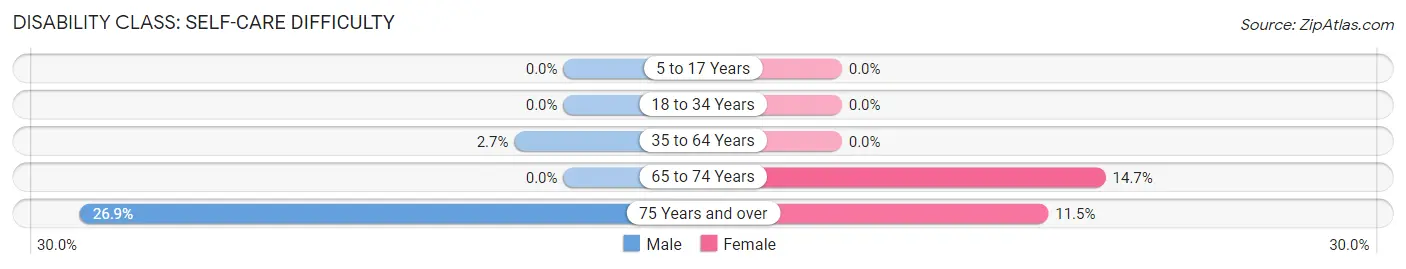
| Age Bracket | Male | Female |
| 5 to 17 Years | 0 (0.0%) | 0 (0.0%) |
| 18 to 34 Years | 0 (0.0%) | 0 (0.0%) |
| 35 to 64 Years | 18 (2.7%) | 0 (0.0%) |
| 65 to 74 Years | 0 (0.0%) | 21 (14.7%) |
| 75 Years and over | 14 (26.9%) | 13 (11.5%) |
Technology Access in Weaver
Computing Device Access in Weaver
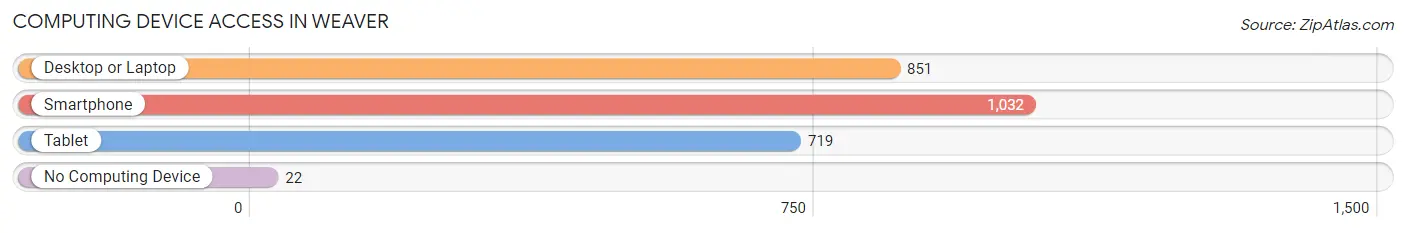
| Device Type | # Households | % Households |
| Desktop or Laptop | 851 | 76.9% |
| Smartphone | 1,032 | 93.3% |
| Tablet | 719 | 65.0% |
| No Computing Device | 22 | 2.0% |
| Total | 1,106 | 100.0% |
Internet Access in Weaver
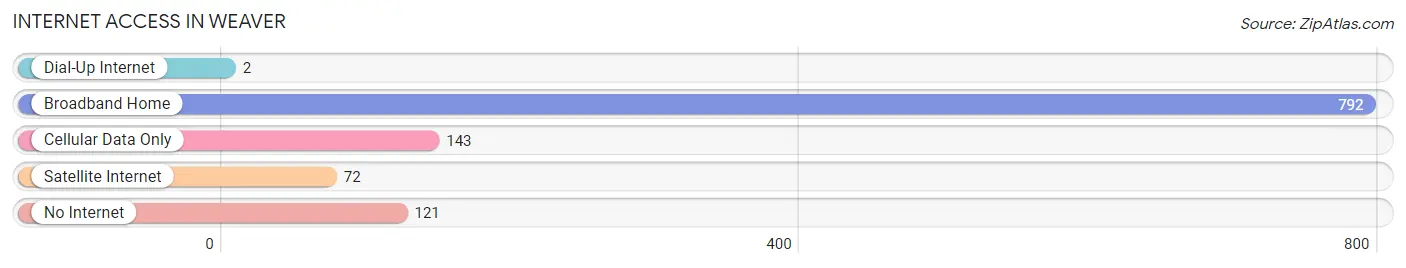
| Internet Type | # Households | % Households |
| Dial-Up Internet | 2 | 0.2% |
| Broadband Home | 792 | 71.6% |
| Cellular Data Only | 143 | 12.9% |
| Satellite Internet | 72 | 6.5% |
| No Internet | 121 | 10.9% |
| Total | 1,106 | 100.0% |
Weaver Summary
Weaver is a small city located in Calhoun County, Alabama. It is situated in the foothills of the Appalachian Mountains, approximately 10 miles east of Anniston. The city has a population of approximately 2,500 people and covers an area of 1.7 square miles.
The history of Weaver dates back to the early 1800s when the area was first settled by European settlers. The city was originally known as “Weaver’s Crossroads” and was named after a local family. The city was officially incorporated in 1891 and was named after the Weaver family.
The economy of Weaver is largely based on agriculture and manufacturing. The city is home to several large manufacturing plants, including a paper mill, a steel mill, and a textile mill. The city also has a number of small businesses, including restaurants, retail stores, and service providers.
The geography of Weaver is characterized by rolling hills and valleys. The city is located in the foothills of the Appalachian Mountains and is surrounded by forests and farmland. The city is located near several rivers, including the Coosa River and the Talladega Creek.
The demographics of Weaver are largely white, with a small African American population. The median household income is approximately $35,000, and the median home value is approximately $90,000. The city has a low unemployment rate and a high rate of homeownership.
Weaver is served by the Calhoun County School System, which includes two elementary schools, one middle school, and one high school. The city also has a number of private schools, including a Catholic school and a Christian school. The city is home to several churches, including Baptist, Methodist, and Presbyterian.
Weaver is a small city with a rich history and a vibrant economy. The city is home to a diverse population and is surrounded by beautiful natural scenery. The city is a great place to live, work, and raise a family.
Common Questions
What is the Total Population of Weaver?
Total Population of Weaver is 3,312.
What is the Total Male Population of Weaver?
Total Male Population of Weaver is 1,599.
What is the Total Female Population of Weaver?
Total Female Population of Weaver is 1,713.
What is the Ratio of Males per 100 Females in Weaver?
There are 93.35 Males per 100 Females in Weaver.
What is the Ratio of Females per 100 Males in Weaver?
There are 107.13 Females per 100 Males in Weaver.
What is the Median Population Age in Weaver?
Median Population Age in Weaver is 34.4 Years.
What is the Average Family Size in Weaver
Average Family Size in Weaver is 3.6 People.
What is the Average Household Size in Weaver
Average Household Size in Weaver is 3.0 People.
What is Per Capita Income in Weaver?
Per Capita income in Weaver is $26,922.
What is the Median Family Income in Weaver?
Median Family Income in Weaver is $95,625.
What is the Median Household income in Weaver?
Median Household Income in Weaver is $81,250.
What is Income or Wage Gap in Weaver?
Income or Wage Gap in Weaver is 24.2%.
Women in Weaver earn 75.8 cents for every dollar earned by a man.
What is Family Income Deficit in Weaver?
Family Income Deficit in Weaver is $7,500.
Families that are below poverty line in Weaver earn $7,500 less on average than the poverty threshold level.
What is Inequality or Gini Index in Weaver?
Inequality or Gini Index in Weaver is 0.35.
How Large is the Labor Force in Weaver?
There are 1,458 People in the Labor Forcein in Weaver.
What is the Percentage of People in the Labor Force in Weaver?
58.3% of People are in the Labor Force in Weaver.
What is the Unemployment Rate in Weaver?
Unemployment Rate in Weaver is 3.8%.