Thomasville, AL
Thomasville Map
Thomasville Overview
3,656
TOTAL POPULATION
1,519
MALE POPULATION
2,137
FEMALE POPULATION
71.08
MALES / 100 FEMALES
140.68
FEMALES / 100 MALES
37.9
MEDIAN AGE
4.0
AVG FAMILY SIZE
2.6
AVG HOUSEHOLD SIZE
$25,678
PER CAPITA INCOME
$54,692
AVG FAMILY INCOME
$45,429
AVG HOUSEHOLD INCOME
36.6%
WAGE / INCOME GAP [ % ]
63.4¢/ $1
WAGE / INCOME GAP [ $ ]
0.50
INEQUALITY / GINI INDEX
1,423
LABOR FORCE [ PEOPLE ]
50.2%
PERCENT IN LABOR FORCE
9.8%
UNEMPLOYMENT RATE
Thomasville Zip Codes
Thomasville Area Codes
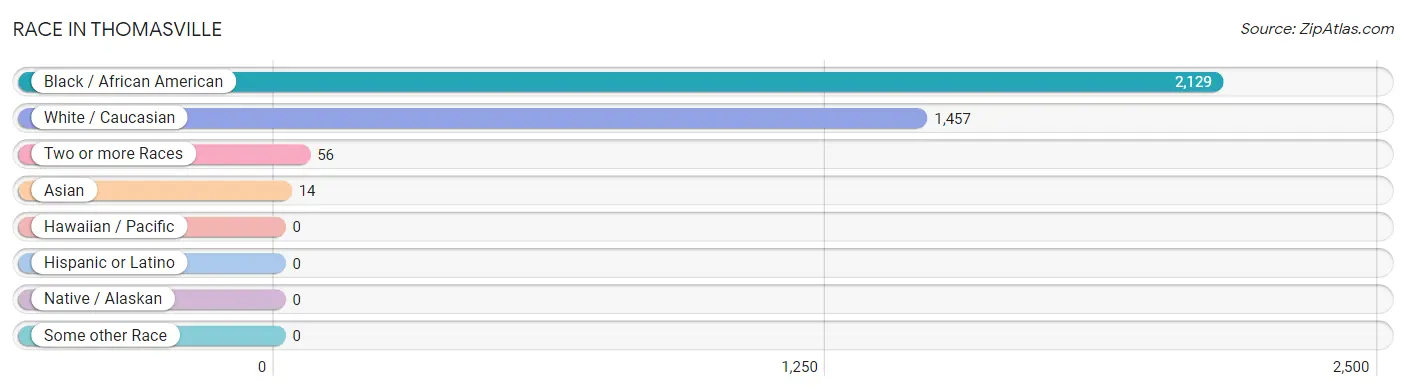
Race in Thomasville
The most populous races in Thomasville are Black / African American (2,129 | 58.2%), White / Caucasian (1,457 | 39.9%), and Two or more Races (56 | 1.5%).
| Race | # Population | % Population |
| Asian | 14 | 0.4% |
| Black / African American | 2,129 | 58.2% |
| Hawaiian / Pacific | 0 | 0.0% |
| Hispanic or Latino | 0 | 0.0% |
| Native / Alaskan | 0 | 0.0% |
| White / Caucasian | 1,457 | 39.9% |
| Two or more Races | 56 | 1.5% |
| Some other Race | 0 | 0.0% |
| Total | 3,656 | 100.0% |
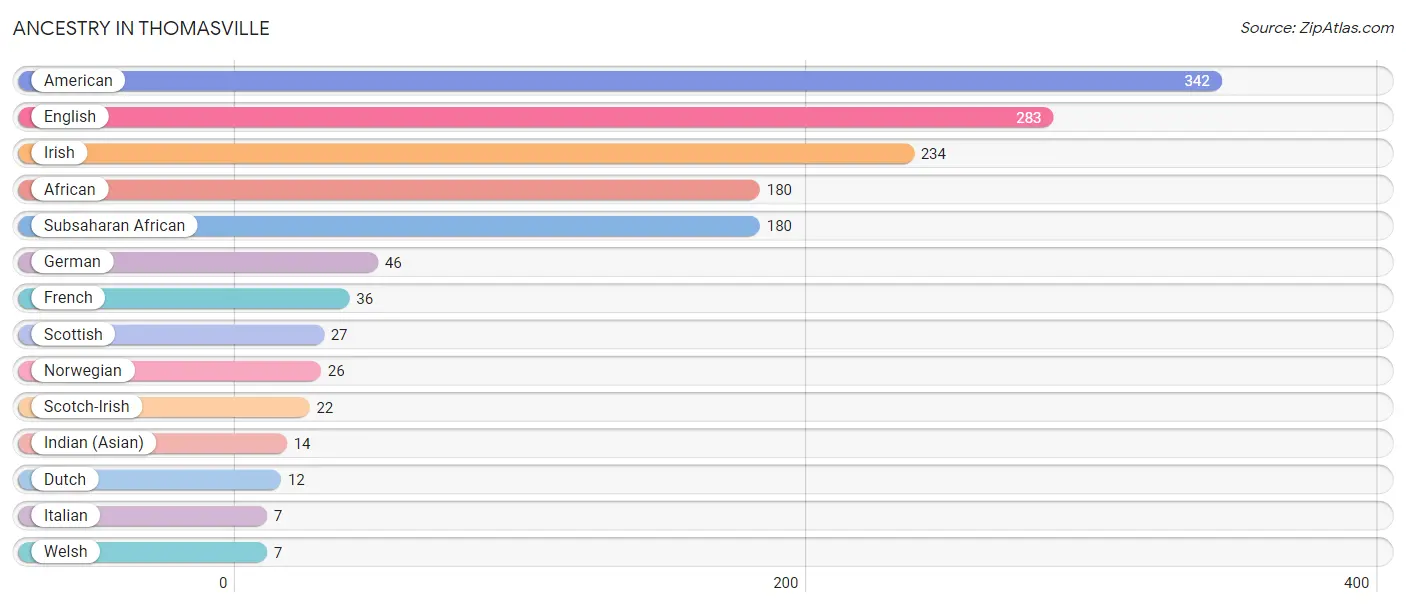
Ancestry in Thomasville
The most populous ancestries reported in Thomasville are American (342 | 9.3%), English (283 | 7.7%), Irish (234 | 6.4%), African (180 | 4.9%), and Subsaharan African (180 | 4.9%), together accounting for 33.3% of all Thomasville residents.
| Ancestry | # Population | % Population |
| African | 180 | 4.9% |
| American | 342 | 9.3% |
| Dutch | 12 | 0.3% |
| English | 283 | 7.7% |
| French | 36 | 1.0% |
| German | 46 | 1.3% |
| Indian (Asian) | 14 | 0.4% |
| Irish | 234 | 6.4% |
| Italian | 7 | 0.2% |
| Norwegian | 26 | 0.7% |
| Scotch-Irish | 22 | 0.6% |
| Scottish | 27 | 0.7% |
| Subsaharan African | 180 | 4.9% |
| Welsh | 7 | 0.2% | View All 14 Rows |
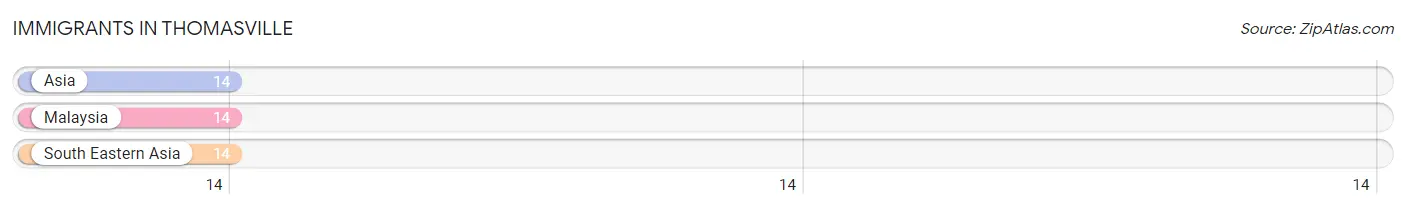
Immigrants in Thomasville
The most numerous immigrant groups reported in Thomasville came from Asia (14 | 0.4%), Malaysia (14 | 0.4%), and South Eastern Asia (14 | 0.4%), together accounting for 1.1% of all Thomasville residents.
| Immigration Origin | # Population | % Population |
| Asia | 14 | 0.4% |
| Malaysia | 14 | 0.4% |
| South Eastern Asia | 14 | 0.4% | View All 3 Rows |
Sex and Age in Thomasville
Sex and Age in Thomasville
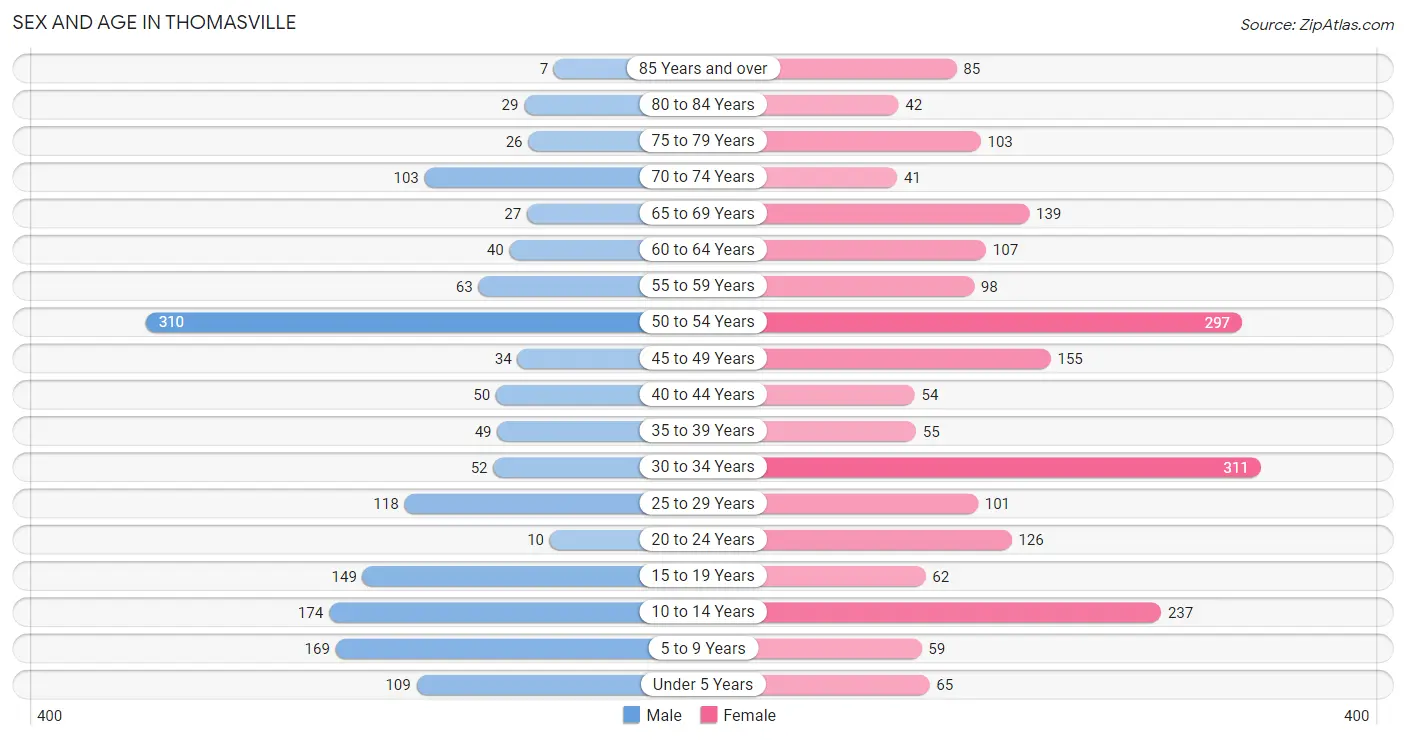
The most populous age groups in Thomasville are 50 to 54 Years (310 | 20.4%) for men and 30 to 34 Years (311 | 14.5%) for women.
| Age Bracket | Male | Female |
| Under 5 Years | 109 (7.2%) | 65 (3.0%) |
| 5 to 9 Years | 169 (11.1%) | 59 (2.8%) |
| 10 to 14 Years | 174 (11.5%) | 237 (11.1%) |
| 15 to 19 Years | 149 (9.8%) | 62 (2.9%) |
| 20 to 24 Years | 10 (0.7%) | 126 (5.9%) |
| 25 to 29 Years | 118 (7.8%) | 101 (4.7%) |
| 30 to 34 Years | 52 (3.4%) | 311 (14.5%) |
| 35 to 39 Years | 49 (3.2%) | 55 (2.6%) |
| 40 to 44 Years | 50 (3.3%) | 54 (2.5%) |
| 45 to 49 Years | 34 (2.2%) | 155 (7.2%) |
| 50 to 54 Years | 310 (20.4%) | 297 (13.9%) |
| 55 to 59 Years | 63 (4.2%) | 98 (4.6%) |
| 60 to 64 Years | 40 (2.6%) | 107 (5.0%) |
| 65 to 69 Years | 27 (1.8%) | 139 (6.5%) |
| 70 to 74 Years | 103 (6.8%) | 41 (1.9%) |
| 75 to 79 Years | 26 (1.7%) | 103 (4.8%) |
| 80 to 84 Years | 29 (1.9%) | 42 (2.0%) |
| 85 Years and over | 7 (0.5%) | 85 (4.0%) |
| Total | 1,519 (100.0%) | 2,137 (100.0%) |
Families and Households in Thomasville
Median Family Size in Thomasville
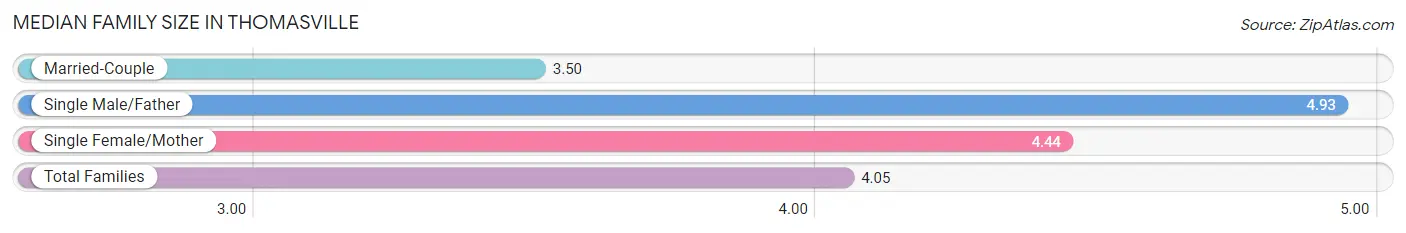
The median family size in Thomasville is 4.05 persons per family, with single male/father families (97 | 13.9%) accounting for the largest median family size of 4.93 persons per family. On the other hand, married-couple families (338 | 48.6%) represent the smallest median family size with 3.50 persons per family.
| Family Type | # Families | Family Size |
| Married-Couple | 338 (48.6%) | 3.50 |
| Single Male/Father | 97 (13.9%) | 4.93 |
| Single Female/Mother | 261 (37.5%) | 4.44 |
| Total Families | 696 (100.0%) | 4.05 |
Median Household Size in Thomasville
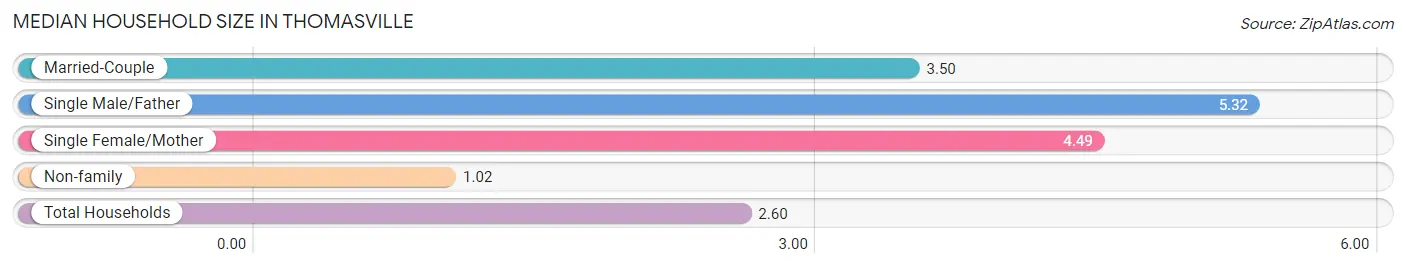
The median household size in Thomasville is 2.60 persons per household, with single male/father households (97 | 7.1%) accounting for the largest median household size of 5.32 persons per household. non-family households (669 | 49.0%) represent the smallest median household size with 1.02 persons per household.
| Household Type | # Households | Household Size |
| Married-Couple | 338 (24.8%) | 3.50 |
| Single Male/Father | 97 (7.1%) | 5.32 |
| Single Female/Mother | 261 (19.1%) | 4.49 |
| Non-family | 669 (49.0%) | 1.02 |
| Total Households | 1,365 (100.0%) | 2.60 |
Household Size by Marriage Status in Thomasville
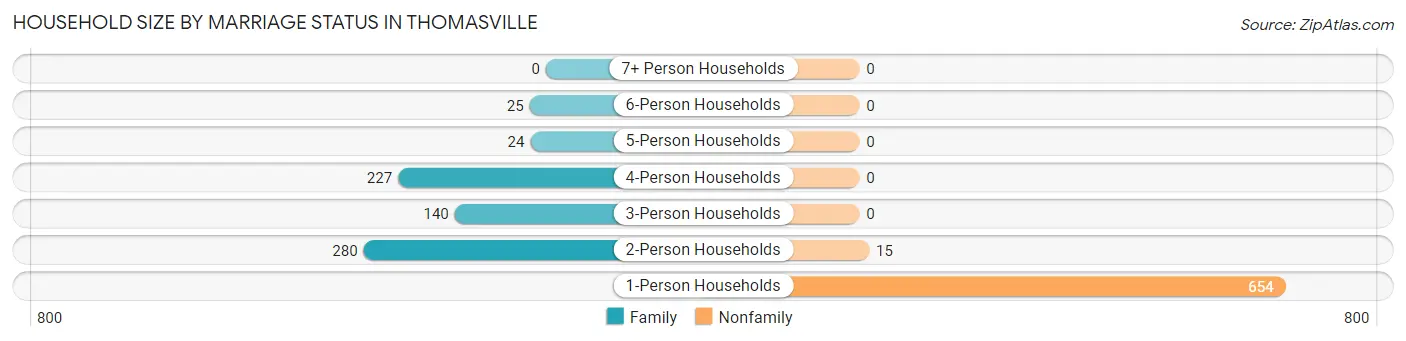
Out of a total of 1,365 households in Thomasville, 696 (51.0%) are family households, while 669 (49.0%) are nonfamily households. The most numerous type of family households are 2-person households, comprising 280, and the most common type of nonfamily households are 1-person households, comprising 654.
| Household Size | Family Households | Nonfamily Households |
| 1-Person Households | - | 654 (47.9%) |
| 2-Person Households | 280 (20.5%) | 15 (1.1%) |
| 3-Person Households | 140 (10.3%) | 0 (0.0%) |
| 4-Person Households | 227 (16.6%) | 0 (0.0%) |
| 5-Person Households | 24 (1.8%) | 0 (0.0%) |
| 6-Person Households | 25 (1.8%) | 0 (0.0%) |
| 7+ Person Households | 0 (0.0%) | 0 (0.0%) |
| Total | 696 (51.0%) | 669 (49.0%) |
Female Fertility in Thomasville
Fertility by Age in Thomasville
Average fertility rate in Thomasville is 66.0 births per 1,000 women. Women in the age bracket of 20 to 34 years have the highest fertility rate with 108.0 births per 1,000 women. Women in the age bracket of 20 to 34 years acount for 100.0% of all women with births.
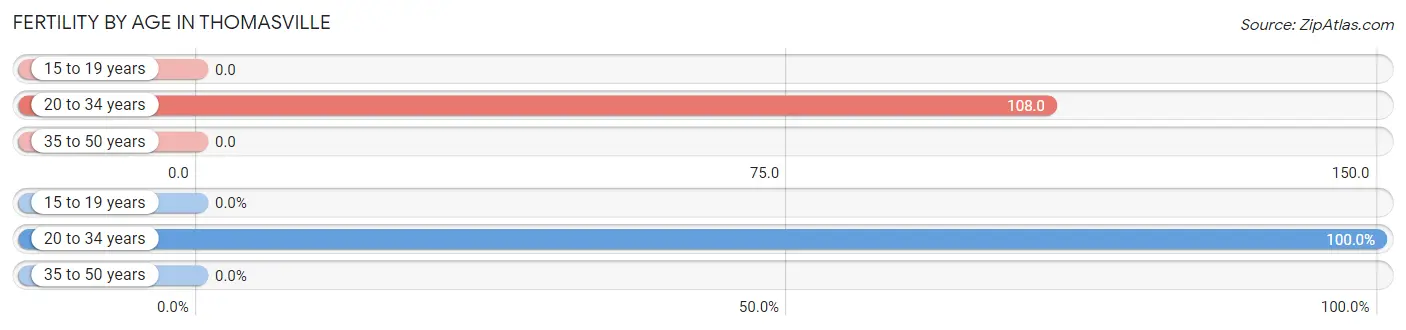
| Age Bracket | Women with Births | Births / 1,000 Women |
| 15 to 19 years | 0 (0.0%) | 0.0 |
| 20 to 34 years | 58 (100.0%) | 108.0 |
| 35 to 50 years | 0 (0.0%) | 0.0 |
| Total | 58 (100.0%) | 66.0 |
Fertility by Age by Marriage Status in Thomasville
12.1% of women with births (58) in Thomasville are married. The highest percentage of unmarried women with births falls into 20 to 34 years age bracket with 87.9% of them unmarried at the time of birth, while the lowest percentage of unmarried women with births belong to 20 to 34 years age bracket with 87.9% of them unmarried.
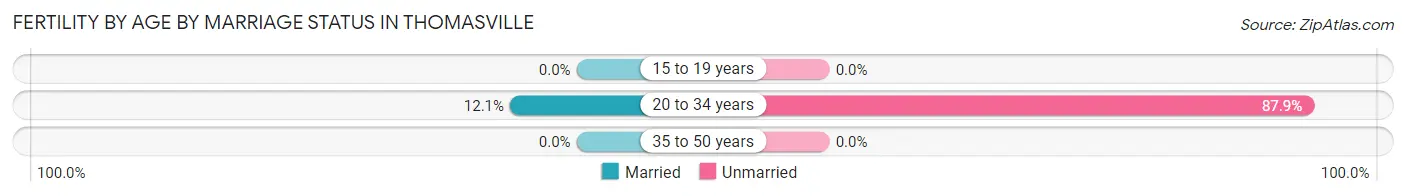
| Age Bracket | Married | Unmarried |
| 15 to 19 years | 0 (0.0%) | 0 (0.0%) |
| 20 to 34 years | 7 (12.1%) | 51 (87.9%) |
| 35 to 50 years | 0 (0.0%) | 0 (0.0%) |
| Total | 7 (12.1%) | 51 (87.9%) |
Fertility by Education in Thomasville
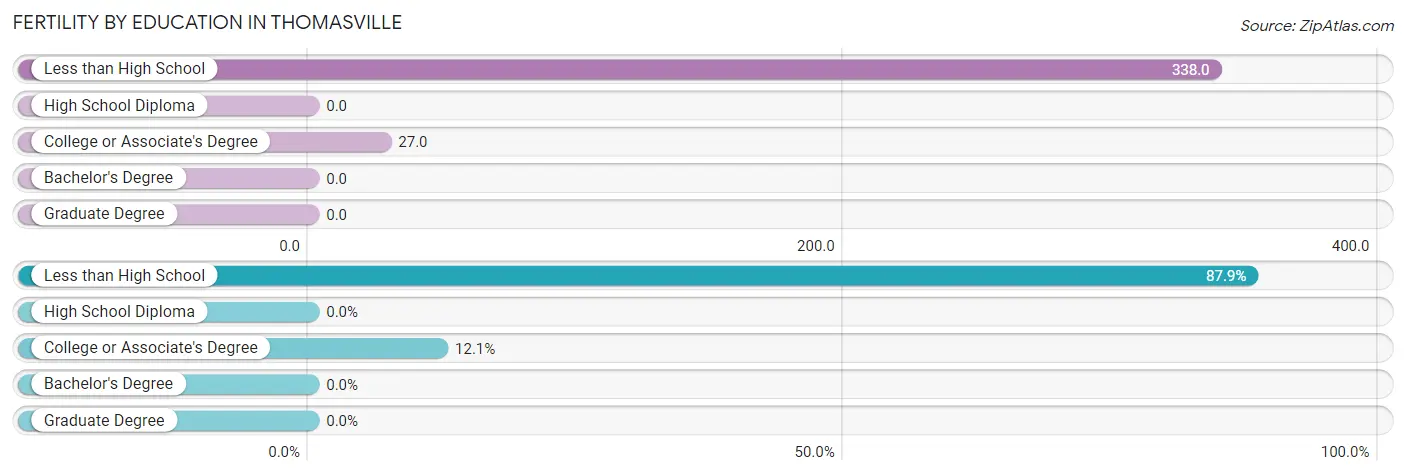
| Educational Attainment | Women with Births | Births / 1,000 Women |
| Less than High School | 51 (87.9%) | 338.0 |
| High School Diploma | 0 (0.0%) | 0.0 |
| College or Associate's Degree | 7 (12.1%) | 27.0 |
| Bachelor's Degree | 0 (0.0%) | 0.0 |
| Graduate Degree | 0 (0.0%) | 0.0 |
| Total | 58 (100.0%) | 66.0 |
Fertility by Education by Marriage Status in Thomasville
87.9% of women with births in Thomasville are unmarried. Women with the educational attainment of college or associate's degree are most likely to be married with 100.0% of them married at childbirth, while women with the educational attainment of less than high school are least likely to be married with 100.0% of them unmarried at childbirth.
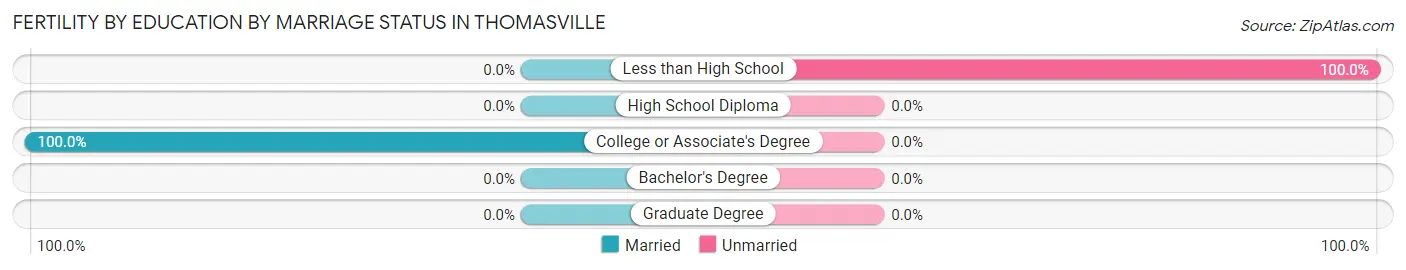
| Educational Attainment | Married | Unmarried |
| Less than High School | 0 (0.0%) | 51 (100.0%) |
| High School Diploma | 0 (0.0%) | 0 (0.0%) |
| College or Associate's Degree | 7 (100.0%) | 0 (0.0%) |
| Bachelor's Degree | 0 (0.0%) | 0 (0.0%) |
| Graduate Degree | 0 (0.0%) | 0 (0.0%) |
| Total | 7 (12.1%) | 51 (87.9%) |
Income in Thomasville
Income Overview in Thomasville
Per Capita Income in Thomasville is $25,678, while median incomes of families and households are $54,692 and $45,429 respectively.
| Characteristic | Number | Measure |
| Per Capita Income | 3,656 | $25,678 |
| Median Family Income | 696 | $54,692 |
| Mean Family Income | 696 | $84,281 |
| Median Household Income | 1,365 | $45,429 |
| Mean Household Income | 1,365 | $65,211 |
| Income Deficit | 696 | $0 |
| Wage / Income Gap (%) | 3,656 | 36.63% |
| Wage / Income Gap ($) | 3,656 | 63.37¢ per $1 |
| Gini / Inequality Index | 3,656 | 0.50 |
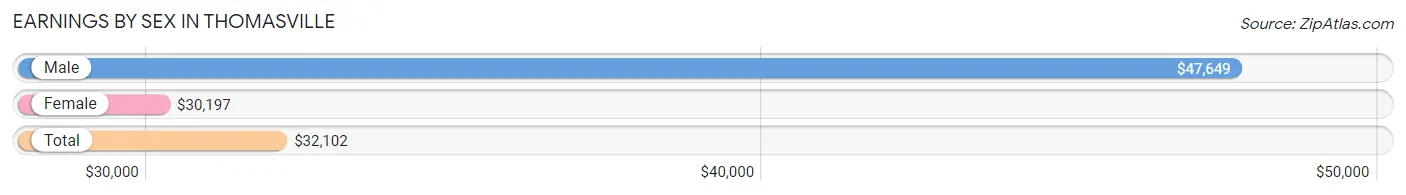
Earnings by Sex in Thomasville
Average Earnings in Thomasville are $32,102, $47,649 for men and $30,197 for women, a difference of 36.6%.
| Sex | Number | Average Earnings |
| Male | 614 (44.0%) | $47,649 |
| Female | 782 (56.0%) | $30,197 |
| Total | 1,396 (100.0%) | $32,102 |
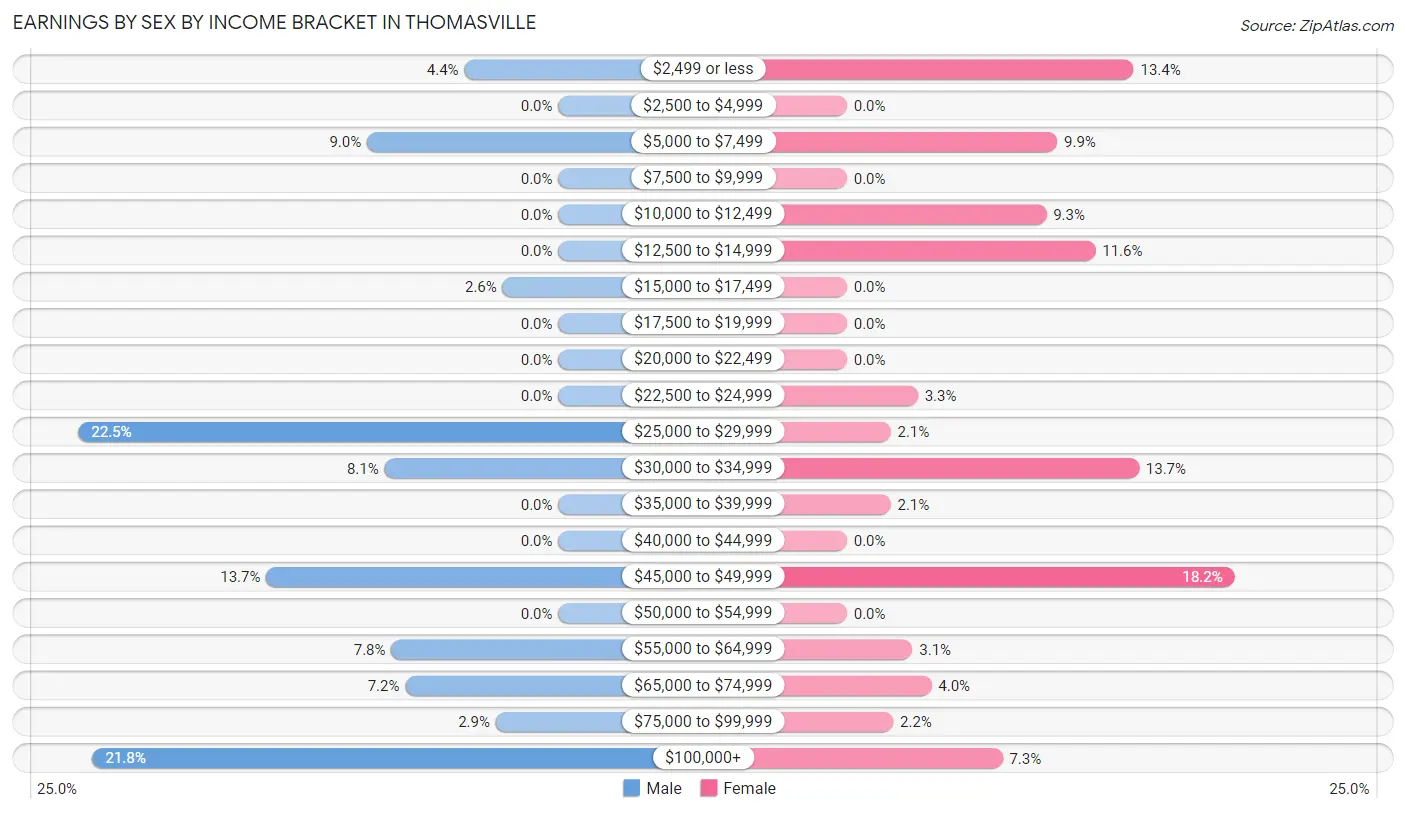
Earnings by Sex by Income Bracket in Thomasville
The most common earnings brackets in Thomasville are $25,000 to $29,999 for men (138 | 22.5%) and $45,000 to $49,999 for women (142 | 18.2%).
| Income | Male | Female |
| $2,499 or less | 27 (4.4%) | 105 (13.4%) |
| $2,500 to $4,999 | 0 (0.0%) | 0 (0.0%) |
| $5,000 to $7,499 | 55 (9.0%) | 77 (9.9%) |
| $7,500 to $9,999 | 0 (0.0%) | 0 (0.0%) |
| $10,000 to $12,499 | 0 (0.0%) | 73 (9.3%) |
| $12,500 to $14,999 | 0 (0.0%) | 91 (11.6%) |
| $15,000 to $17,499 | 16 (2.6%) | 0 (0.0%) |
| $17,500 to $19,999 | 0 (0.0%) | 0 (0.0%) |
| $20,000 to $22,499 | 0 (0.0%) | 0 (0.0%) |
| $22,500 to $24,999 | 0 (0.0%) | 26 (3.3%) |
| $25,000 to $29,999 | 138 (22.5%) | 16 (2.1%) |
| $30,000 to $34,999 | 50 (8.1%) | 107 (13.7%) |
| $35,000 to $39,999 | 0 (0.0%) | 16 (2.1%) |
| $40,000 to $44,999 | 0 (0.0%) | 0 (0.0%) |
| $45,000 to $49,999 | 84 (13.7%) | 142 (18.2%) |
| $50,000 to $54,999 | 0 (0.0%) | 0 (0.0%) |
| $55,000 to $64,999 | 48 (7.8%) | 24 (3.1%) |
| $65,000 to $74,999 | 44 (7.2%) | 31 (4.0%) |
| $75,000 to $99,999 | 18 (2.9%) | 17 (2.2%) |
| $100,000+ | 134 (21.8%) | 57 (7.3%) |
| Total | 614 (100.0%) | 782 (100.0%) |
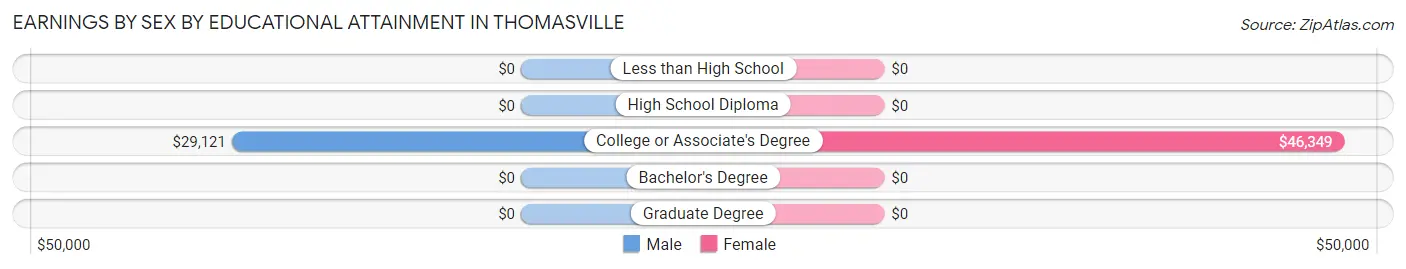
Earnings by Sex by Educational Attainment in Thomasville
Average earnings in Thomasville are $48,340 for men and $32,689 for women, a difference of 32.4%. Men with an educational attainment of college or associate's degree enjoy the highest average annual earnings of $29,121, while those with college or associate's degree education earn the least with $29,121. Women with an educational attainment of college or associate's degree earn the most with the average annual earnings of $46,349, while those with college or associate's degree education have the smallest earnings of $46,349.
| Educational Attainment | Male Income | Female Income |
| Less than High School | - | - |
| High School Diploma | - | - |
| College or Associate's Degree | $29,121 | $46,349 |
| Bachelor's Degree | - | - |
| Graduate Degree | - | - |
| Total | $48,340 | $32,689 |
Family Income in Thomasville
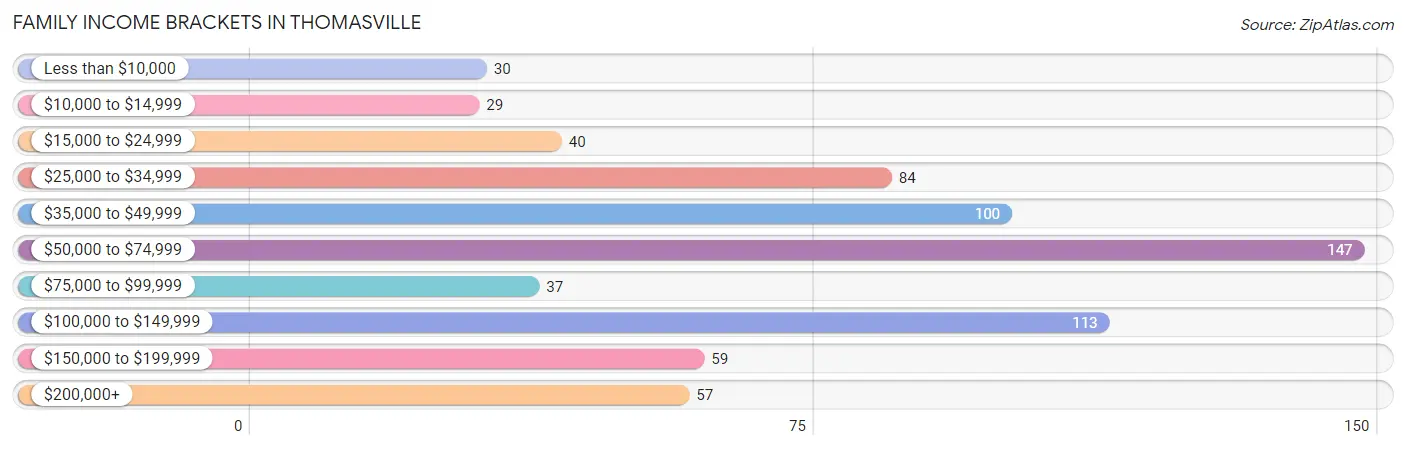
Family Income Brackets in Thomasville
According to the Thomasville family income data, there are 147 families falling into the $50,000 to $74,999 income range, which is the most common income bracket and makes up 21.1% of all families. Conversely, the $10,000 to $14,999 income bracket is the least frequent group with only 29 families (4.2%) belonging to this category.
| Income Bracket | # Families | % Families |
| Less than $10,000 | 30 | 4.3% |
| $10,000 to $14,999 | 29 | 4.2% |
| $15,000 to $24,999 | 40 | 5.7% |
| $25,000 to $34,999 | 84 | 12.1% |
| $35,000 to $49,999 | 100 | 14.4% |
| $50,000 to $74,999 | 147 | 21.1% |
| $75,000 to $99,999 | 37 | 5.3% |
| $100,000 to $149,999 | 113 | 16.2% |
| $150,000 to $199,999 | 59 | 8.5% |
| $200,000+ | 57 | 8.2% |
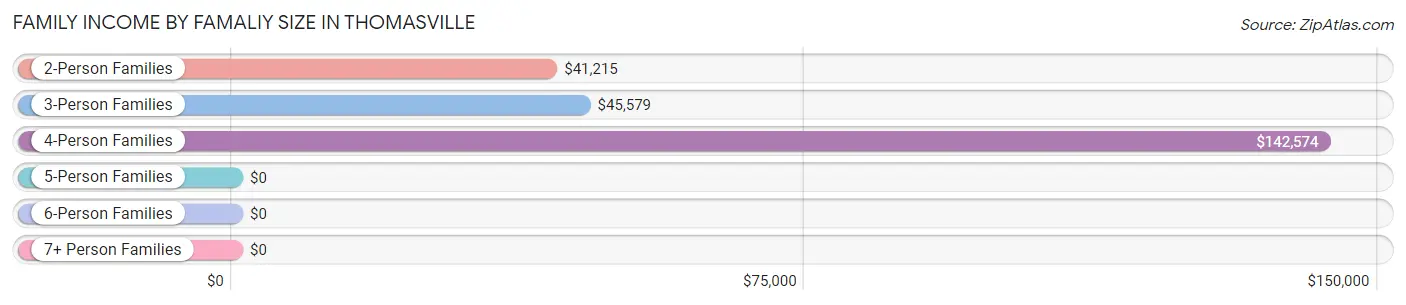
Family Income by Famaliy Size in Thomasville
4-person families (227 | 32.6%) account for the highest median family income in Thomasville with $142,574 per family, while 4-person families (227 | 32.6%) have the highest median income of $35,644 per family member.
| Income Bracket | # Families | Median Income |
| 2-Person Families | 325 (46.7%) | $41,215 |
| 3-Person Families | 95 (13.7%) | $45,579 |
| 4-Person Families | 227 (32.6%) | $142,574 |
| 5-Person Families | 24 (3.5%) | $0 |
| 6-Person Families | 25 (3.6%) | $0 |
| 7+ Person Families | 0 (0.0%) | $0 |
| Total | 696 (100.0%) | $54,692 |
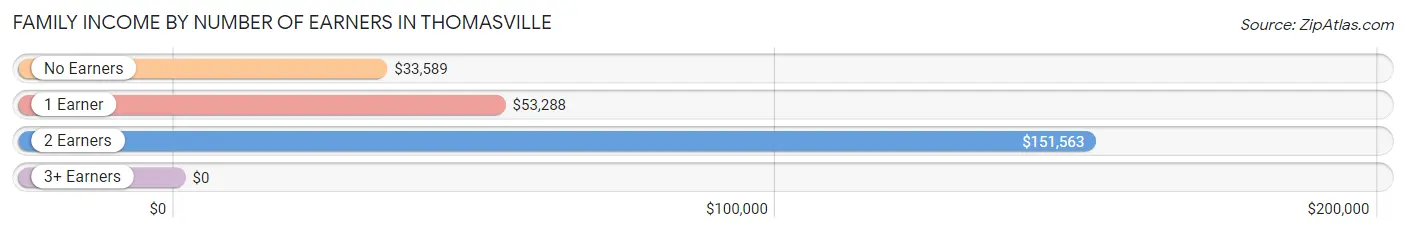
Family Income by Number of Earners in Thomasville
| Number of Earners | # Families | Median Income |
| No Earners | 207 (29.7%) | $33,589 |
| 1 Earner | 261 (37.5%) | $53,288 |
| 2 Earners | 203 (29.2%) | $151,563 |
| 3+ Earners | 25 (3.6%) | $0 |
| Total | 696 (100.0%) | $54,692 |
Household Income in Thomasville
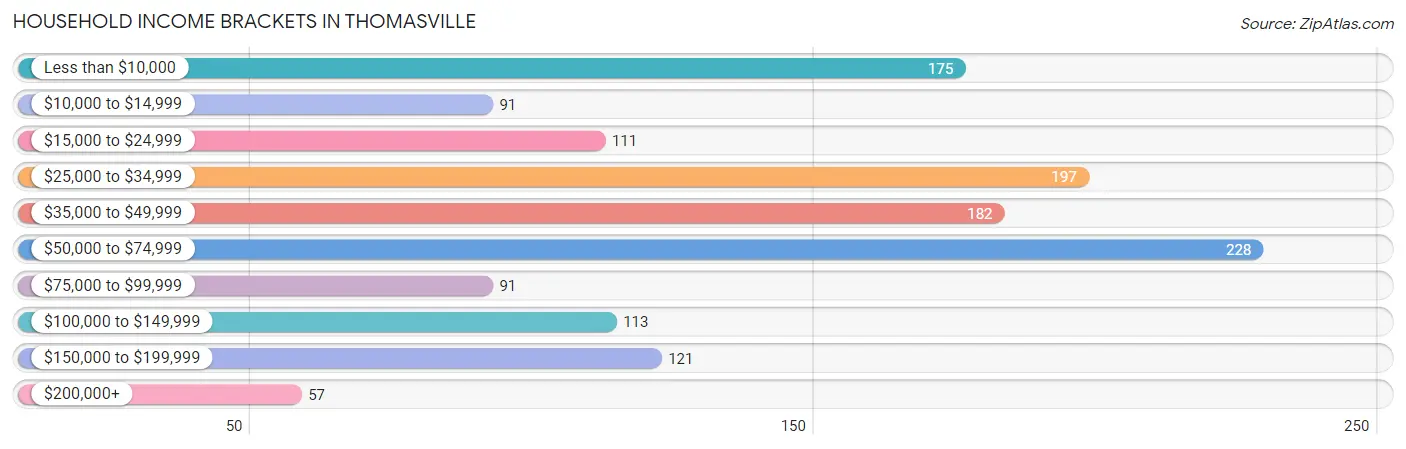
Household Income Brackets in Thomasville
With 228 households falling in the category, the $50,000 to $74,999 income range is the most frequent in Thomasville, accounting for 16.7% of all households. In contrast, only 57 households (4.2%) fall into the $200,000+ income bracket, making it the least populous group.
| Income Bracket | # Households | % Households |
| Less than $10,000 | 175 | 12.8% |
| $10,000 to $14,999 | 91 | 6.7% |
| $15,000 to $24,999 | 111 | 8.1% |
| $25,000 to $34,999 | 197 | 14.4% |
| $35,000 to $49,999 | 182 | 13.3% |
| $50,000 to $74,999 | 228 | 16.7% |
| $75,000 to $99,999 | 91 | 6.7% |
| $100,000 to $149,999 | 113 | 8.3% |
| $150,000 to $199,999 | 121 | 8.9% |
| $200,000+ | 57 | 4.2% |
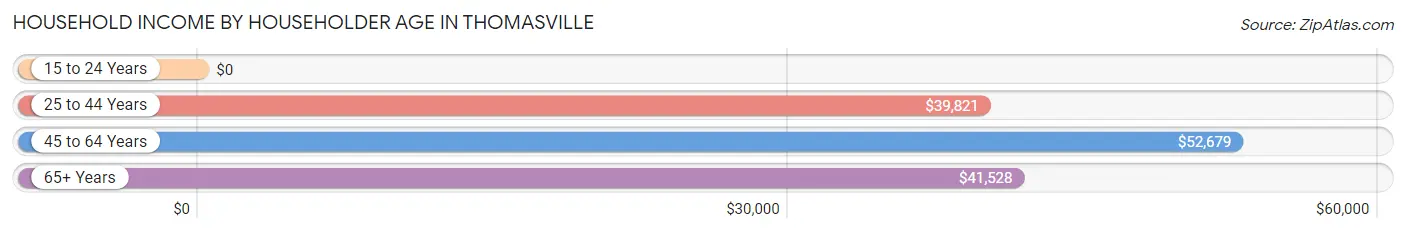
Household Income by Householder Age in Thomasville
The median household income in Thomasville is $45,429, with the highest median household income of $52,679 found in the 45 to 64 years age bracket for the primary householder. A total of 582 households (42.6%) fall into this category. Meanwhile, the 15 to 24 years age bracket for the primary householder has the lowest median household income of $0, with 32 households (2.3%) in this group.
| Income Bracket | # Households | Median Income |
| 15 to 24 Years | 32 (2.3%) | $0 |
| 25 to 44 Years | 403 (29.5%) | $39,821 |
| 45 to 64 Years | 582 (42.6%) | $52,679 |
| 65+ Years | 348 (25.5%) | $41,528 |
| Total | 1,365 (100.0%) | $45,429 |
Poverty in Thomasville
Income Below Poverty by Sex and Age in Thomasville
With 6.0% poverty level for males and 22.7% for females among the residents of Thomasville, 12 to 14 year old males and 35 to 44 year old females are the most vulnerable to poverty, with 35 males (52.2%) and 68 females (63.0%) in their respective age groups living below the poverty level.
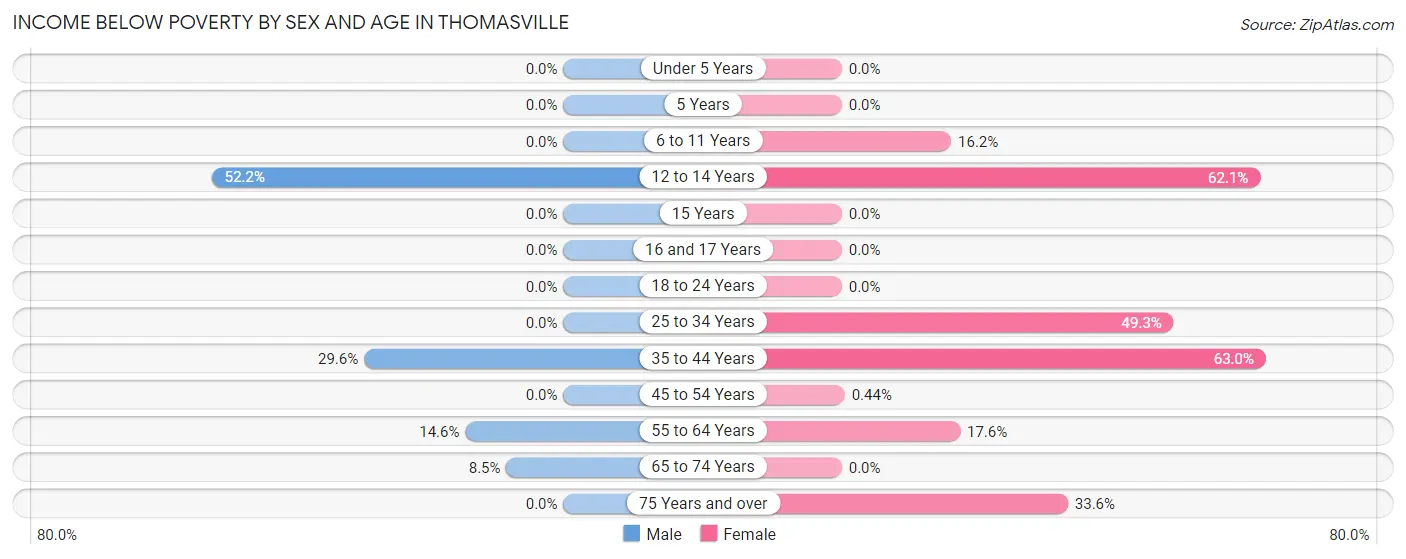
| Age Bracket | Male | Female |
| Under 5 Years | 0 (0.0%) | 0 (0.0%) |
| 5 Years | 0 (0.0%) | 0 (0.0%) |
| 6 to 11 Years | 0 (0.0%) | 25 (16.2%) |
| 12 to 14 Years | 35 (52.2%) | 82 (62.1%) |
| 15 Years | 0 (0.0%) | 0 (0.0%) |
| 16 and 17 Years | 0 (0.0%) | 0 (0.0%) |
| 18 to 24 Years | 0 (0.0%) | 0 (0.0%) |
| 25 to 34 Years | 0 (0.0%) | 203 (49.3%) |
| 35 to 44 Years | 29 (29.6%) | 68 (63.0%) |
| 45 to 54 Years | 0 (0.0%) | 2 (0.4%) |
| 55 to 64 Years | 15 (14.6%) | 36 (17.6%) |
| 65 to 74 Years | 11 (8.5%) | 0 (0.0%) |
| 75 Years and over | 0 (0.0%) | 48 (33.6%) |
| Total | 90 (6.0%) | 464 (22.7%) |
Income Above Poverty by Sex and Age in Thomasville
According to the poverty statistics in Thomasville, males aged under 5 years and females aged under 5 years are the age groups that are most secure financially, with 100.0% of males and 100.0% of females in these age groups living above the poverty line.
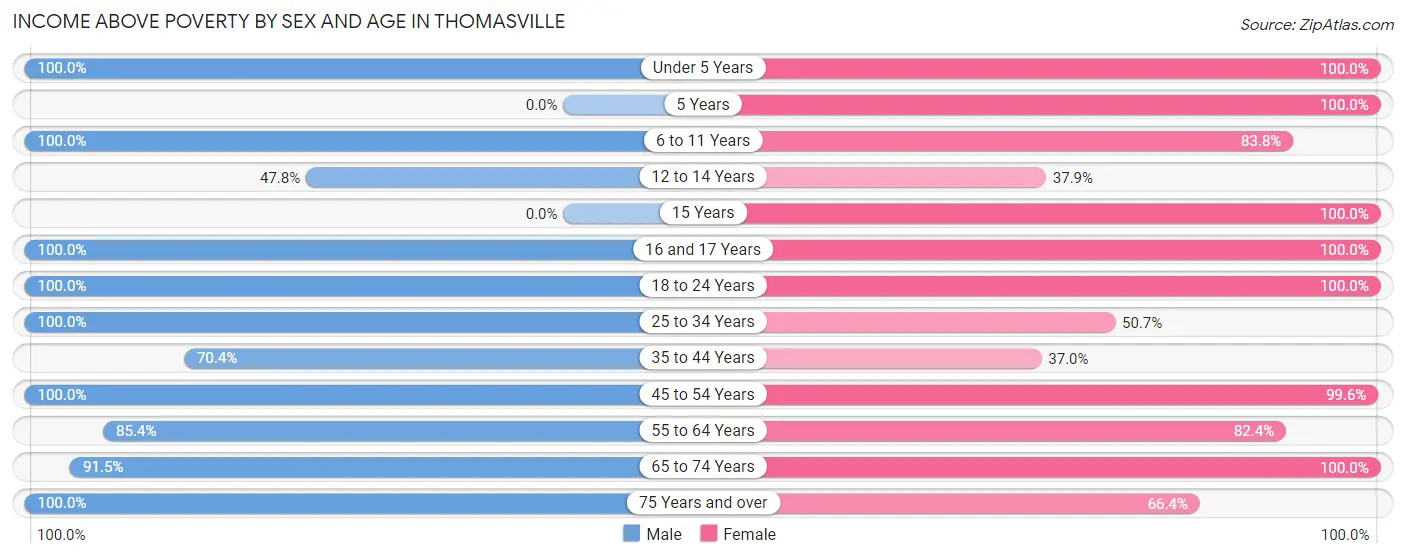
| Age Bracket | Male | Female |
| Under 5 Years | 109 (100.0%) | 65 (100.0%) |
| 5 Years | 0 (0.0%) | 10 (100.0%) |
| 6 to 11 Years | 276 (100.0%) | 129 (83.8%) |
| 12 to 14 Years | 32 (47.8%) | 50 (37.9%) |
| 15 Years | 0 (0.0%) | 8 (100.0%) |
| 16 and 17 Years | 137 (100.0%) | 54 (100.0%) |
| 18 to 24 Years | 22 (100.0%) | 126 (100.0%) |
| 25 to 34 Years | 170 (100.0%) | 209 (50.7%) |
| 35 to 44 Years | 69 (70.4%) | 40 (37.0%) |
| 45 to 54 Years | 344 (100.0%) | 450 (99.6%) |
| 55 to 64 Years | 88 (85.4%) | 169 (82.4%) |
| 65 to 74 Years | 119 (91.5%) | 173 (100.0%) |
| 75 Years and over | 55 (100.0%) | 95 (66.4%) |
| Total | 1,421 (94.0%) | 1,578 (77.3%) |
Income Below Poverty Among Married-Couple Families in Thomasville
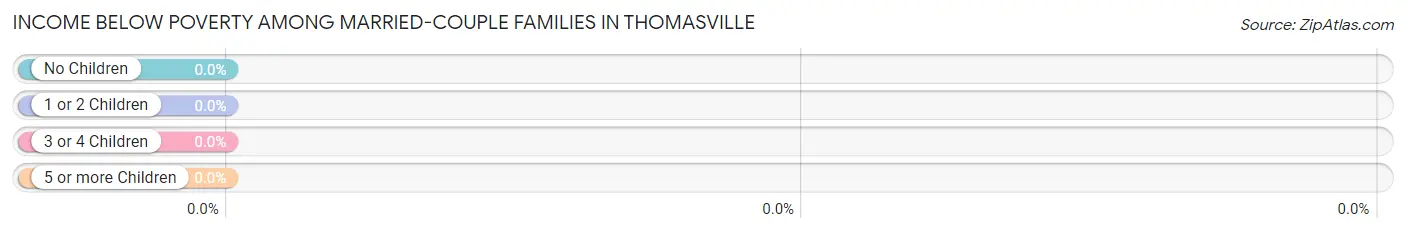
| Children | Above Poverty | Below Poverty |
| No Children | 180 (100.0%) | 0 (0.0%) |
| 1 or 2 Children | 158 (100.0%) | 0 (0.0%) |
| 3 or 4 Children | 0 (0.0%) | 0 (0.0%) |
| 5 or more Children | 0 (0.0%) | 0 (0.0%) |
| Total | 338 (100.0%) | 0 (0.0%) |
Income Below Poverty Among Single-Parent Households in Thomasville
According to the poverty data in Thomasville, 29.9% or 29 single-father households and 26.8% or 70 single-mother households are living below the poverty line. Among single-father households, those with 1 or 2 children have the highest poverty rate, with 29 households (29.9%) experiencing poverty. Likewise, among single-mother households, those with 1 or 2 children have the highest poverty rate, with 70 households (35.2%) falling below the poverty line.
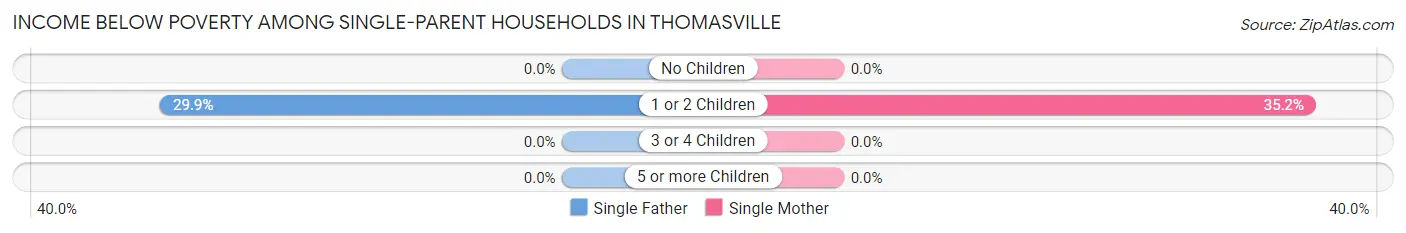
| Children | Single Father | Single Mother |
| No Children | 0 (0.0%) | 0 (0.0%) |
| 1 or 2 Children | 29 (29.9%) | 70 (35.2%) |
| 3 or 4 Children | 0 (0.0%) | 0 (0.0%) |
| 5 or more Children | 0 (0.0%) | 0 (0.0%) |
| Total | 29 (29.9%) | 70 (26.8%) |
Income Below Poverty Among Married-Couple vs Single-Parent Households in Thomasville
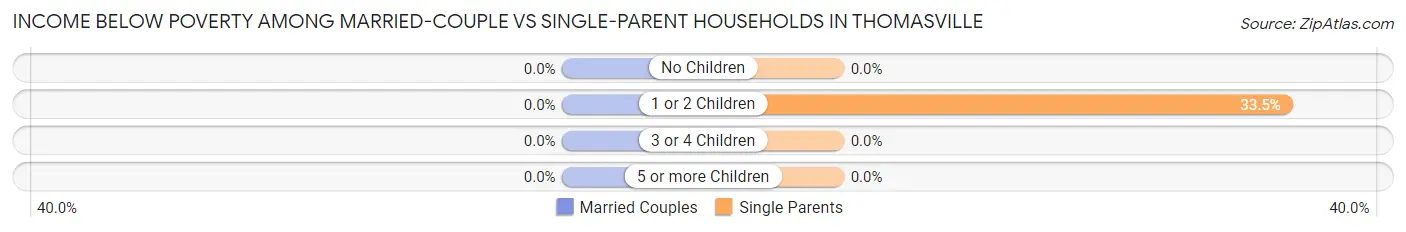
| Children | Married-Couple Families | Single-Parent Households |
| No Children | 0 (0.0%) | 0 (0.0%) |
| 1 or 2 Children | 0 (0.0%) | 99 (33.5%) |
| 3 or 4 Children | 0 (0.0%) | 0 (0.0%) |
| 5 or more Children | 0 (0.0%) | 0 (0.0%) |
| Total | 0 (0.0%) | 99 (27.7%) |
Employment Characteristics in Thomasville
Employment by Class of Employer in Thomasville
Among the 1,233 employed individuals in Thomasville, private company employees (895 | 72.6%), self-employed (not incorporated) (205 | 16.6%), and state government employees (51 | 4.1%) make up the most common classes of employment.
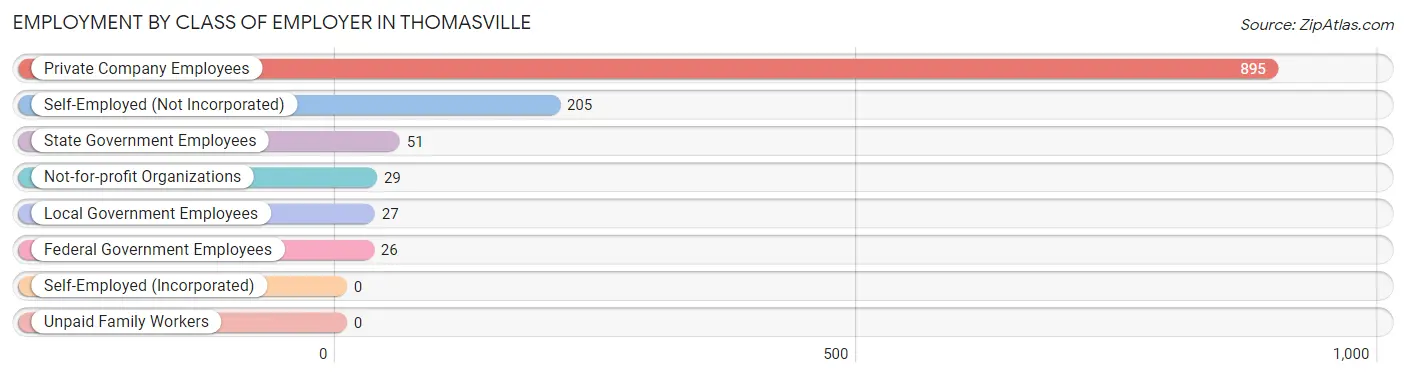
| Employer Class | # Employees | % Employees |
| Private Company Employees | 895 | 72.6% |
| Self-Employed (Incorporated) | 0 | 0.0% |
| Self-Employed (Not Incorporated) | 205 | 16.6% |
| Not-for-profit Organizations | 29 | 2.4% |
| Local Government Employees | 27 | 2.2% |
| State Government Employees | 51 | 4.1% |
| Federal Government Employees | 26 | 2.1% |
| Unpaid Family Workers | 0 | 0.0% |
| Total | 1,233 | 100.0% |
Employment Status by Age in Thomasville
According to the labor force statistics for Thomasville, out of the total population over 16 years of age (2,835), 50.2% or 1,423 individuals are in the labor force, with 9.8% or 139 of them unemployed. The age group with the highest labor force participation rate is 20 to 24 years, with 88.2% or 120 individuals in the labor force. Within the labor force, the 16 to 19 years age range has the highest percentage of unemployed individuals, with 100.0% or 27 of them being unemployed.
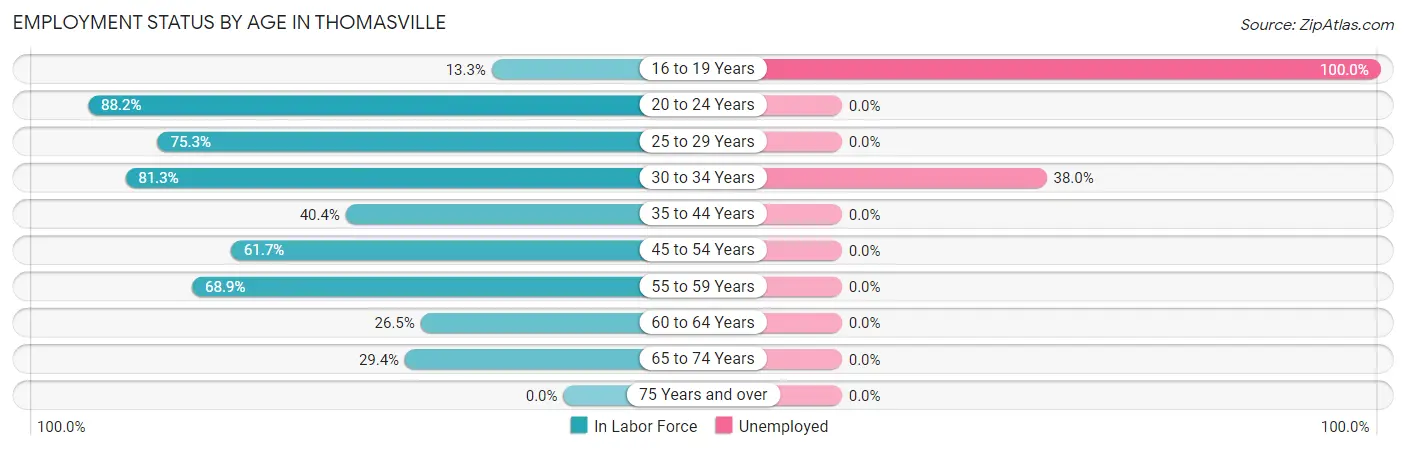
| Age Bracket | In Labor Force | Unemployed |
| 16 to 19 Years | 27 (13.3%) | 27 (100.0%) |
| 20 to 24 Years | 120 (88.2%) | 0 (0.0%) |
| 25 to 29 Years | 165 (75.3%) | 0 (0.0%) |
| 30 to 34 Years | 295 (81.3%) | 112 (38.0%) |
| 35 to 44 Years | 84 (40.4%) | 0 (0.0%) |
| 45 to 54 Years | 491 (61.7%) | 0 (0.0%) |
| 55 to 59 Years | 111 (68.9%) | 0 (0.0%) |
| 60 to 64 Years | 39 (26.5%) | 0 (0.0%) |
| 65 to 74 Years | 91 (29.4%) | 0 (0.0%) |
| 75 Years and over | 0 (0.0%) | 0 (0.0%) |
| Total | 1,423 (50.2%) | 139 (9.8%) |
Employment Status by Educational Attainment in Thomasville
According to labor force statistics for Thomasville, 62.6% of individuals (1,186) out of the total population between 25 and 64 years of age (1,894) are in the labor force, with 9.5% or 113 of them being unemployed. The group with the highest labor force participation rate are those with the educational attainment of bachelor's degree or higher, with 80.0% or 92 individuals in the labor force. Within the labor force, individuals with high school diploma education have the highest percentage of unemployment, with 11.2% or 60 of them being unemployed.
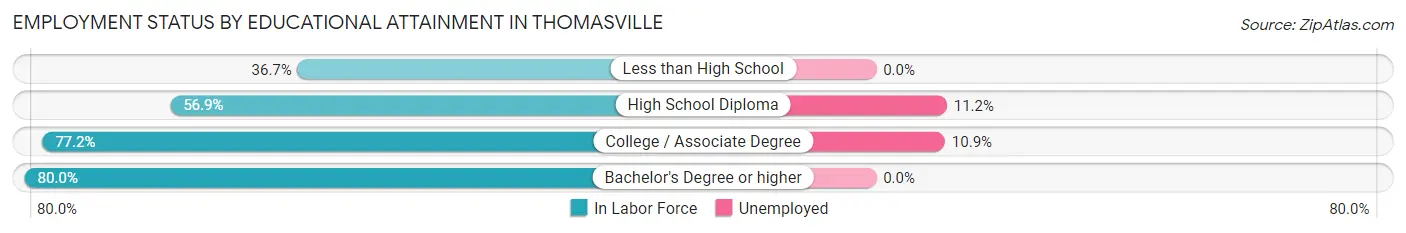
| Educational Attainment | In Labor Force | Unemployed |
| Less than High School | 81 (36.7%) | 0 (0.0%) |
| High School Diploma | 535 (56.9%) | 105 (11.2%) |
| College / Associate Degree | 477 (77.2%) | 67 (10.9%) |
| Bachelor's Degree or higher | 92 (80.0%) | 0 (0.0%) |
| Total | 1,186 (62.6%) | 180 (9.5%) |
Employment Occupations by Sex in Thomasville
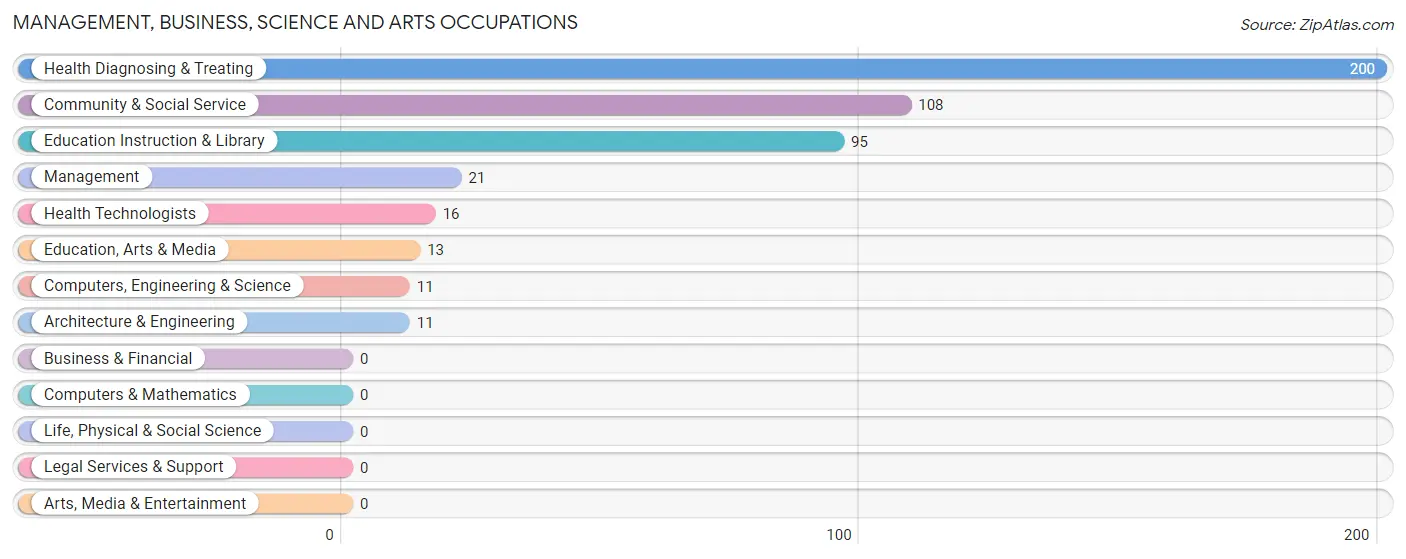
Management, Business, Science and Arts Occupations
The most common Management, Business, Science and Arts occupations in Thomasville are Health Diagnosing & Treating (200 | 15.6%), Community & Social Service (108 | 8.4%), Education Instruction & Library (95 | 7.4%), Management (21 | 1.6%), and Health Technologists (16 | 1.3%).
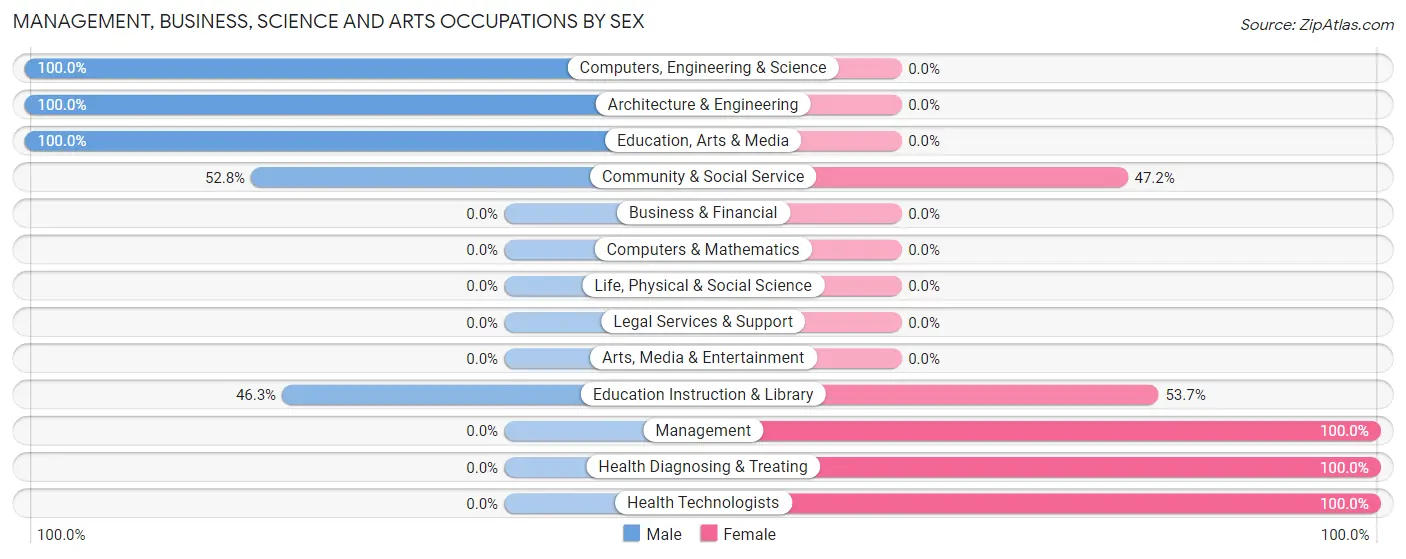
Management, Business, Science and Arts Occupations by Sex
Within the Management, Business, Science and Arts occupations in Thomasville, the most male-oriented occupations are Computers, Engineering & Science (100.0%), Architecture & Engineering (100.0%), and Education, Arts & Media (100.0%), while the most female-oriented occupations are Management (100.0%), Health Diagnosing & Treating (100.0%), and Health Technologists (100.0%).
| Occupation | Male | Female |
| Management | 0 (0.0%) | 21 (100.0%) |
| Business & Financial | 0 (0.0%) | 0 (0.0%) |
| Computers, Engineering & Science | 11 (100.0%) | 0 (0.0%) |
| Computers & Mathematics | 0 (0.0%) | 0 (0.0%) |
| Architecture & Engineering | 11 (100.0%) | 0 (0.0%) |
| Life, Physical & Social Science | 0 (0.0%) | 0 (0.0%) |
| Community & Social Service | 57 (52.8%) | 51 (47.2%) |
| Education, Arts & Media | 13 (100.0%) | 0 (0.0%) |
| Legal Services & Support | 0 (0.0%) | 0 (0.0%) |
| Education Instruction & Library | 44 (46.3%) | 51 (53.7%) |
| Arts, Media & Entertainment | 0 (0.0%) | 0 (0.0%) |
| Health Diagnosing & Treating | 0 (0.0%) | 200 (100.0%) |
| Health Technologists | 0 (0.0%) | 16 (100.0%) |
| Total (Category) | 68 (20.0%) | 272 (80.0%) |
| Total (Overall) | 587 (45.7%) | 697 (54.3%) |
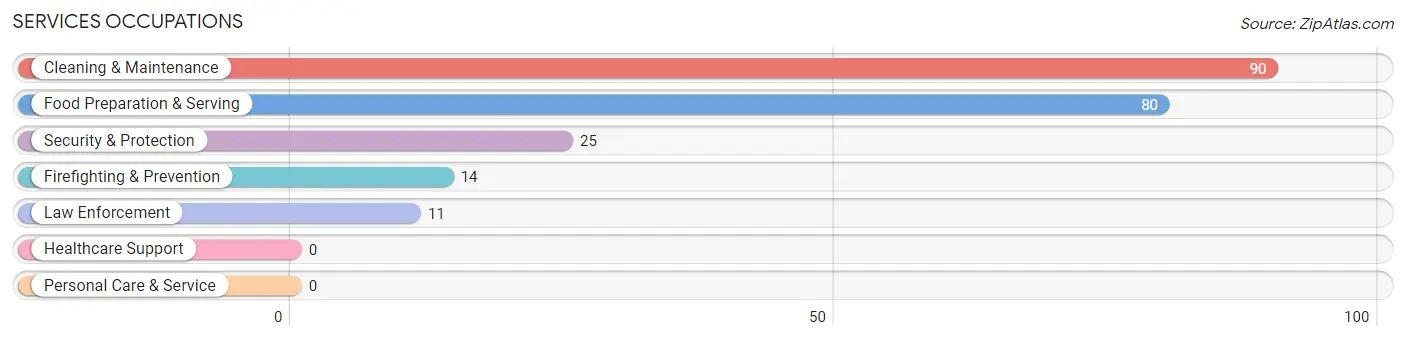
Services Occupations
The most common Services occupations in Thomasville are Cleaning & Maintenance (90 | 7.0%), Food Preparation & Serving (80 | 6.2%), Security & Protection (25 | 1.9%), Firefighting & Prevention (14 | 1.1%), and Law Enforcement (11 | 0.9%).
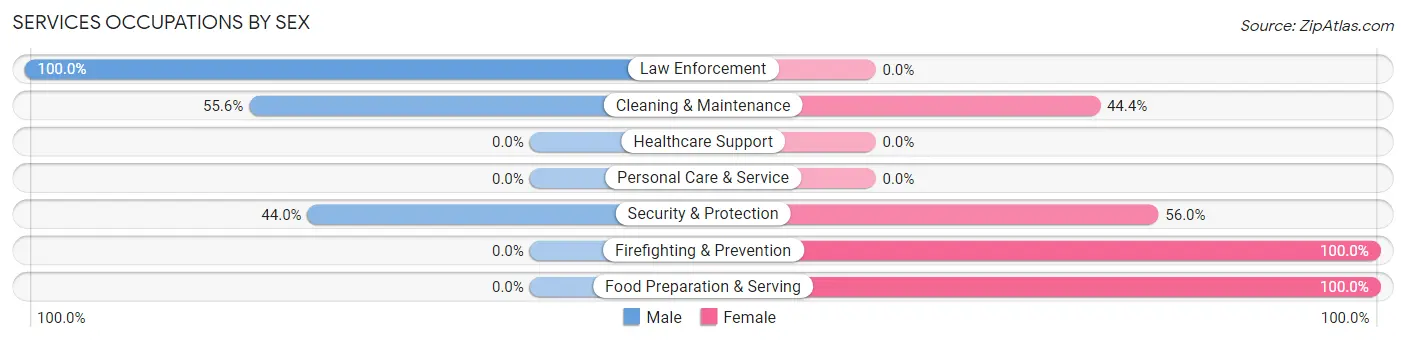
Services Occupations by Sex
Within the Services occupations in Thomasville, the most male-oriented occupations are Law Enforcement (100.0%), Cleaning & Maintenance (55.6%), and Security & Protection (44.0%), while the most female-oriented occupations are Firefighting & Prevention (100.0%), Food Preparation & Serving (100.0%), and Security & Protection (56.0%).
| Occupation | Male | Female |
| Healthcare Support | 0 (0.0%) | 0 (0.0%) |
| Security & Protection | 11 (44.0%) | 14 (56.0%) |
| Firefighting & Prevention | 0 (0.0%) | 14 (100.0%) |
| Law Enforcement | 11 (100.0%) | 0 (0.0%) |
| Food Preparation & Serving | 0 (0.0%) | 80 (100.0%) |
| Cleaning & Maintenance | 50 (55.6%) | 40 (44.4%) |
| Personal Care & Service | 0 (0.0%) | 0 (0.0%) |
| Total (Category) | 61 (31.3%) | 134 (68.7%) |
| Total (Overall) | 587 (45.7%) | 697 (54.3%) |
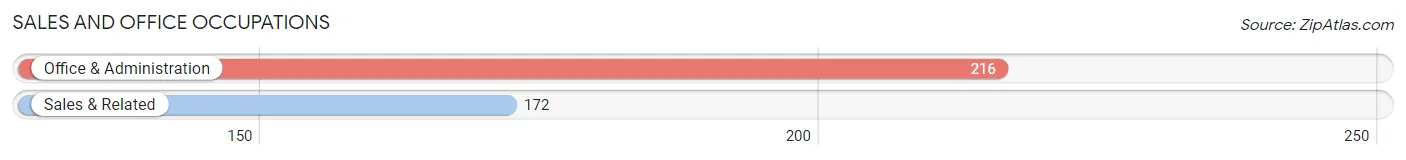
Sales and Office Occupations
The most common Sales and Office occupations in Thomasville are Office & Administration (216 | 16.8%), and Sales & Related (172 | 13.4%).
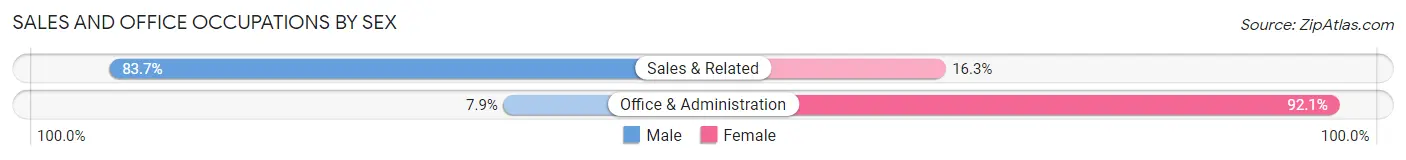
Sales and Office Occupations by Sex
| Occupation | Male | Female |
| Sales & Related | 144 (83.7%) | 28 (16.3%) |
| Office & Administration | 17 (7.9%) | 199 (92.1%) |
| Total (Category) | 161 (41.5%) | 227 (58.5%) |
| Total (Overall) | 587 (45.7%) | 697 (54.3%) |
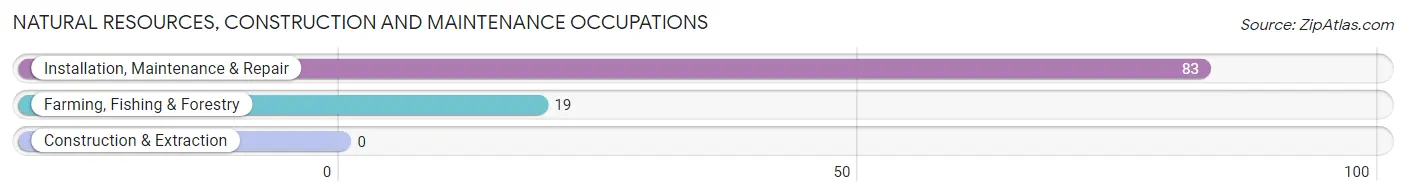
Natural Resources, Construction and Maintenance Occupations
The most common Natural Resources, Construction and Maintenance occupations in Thomasville are Installation, Maintenance & Repair (83 | 6.5%), and Farming, Fishing & Forestry (19 | 1.5%).
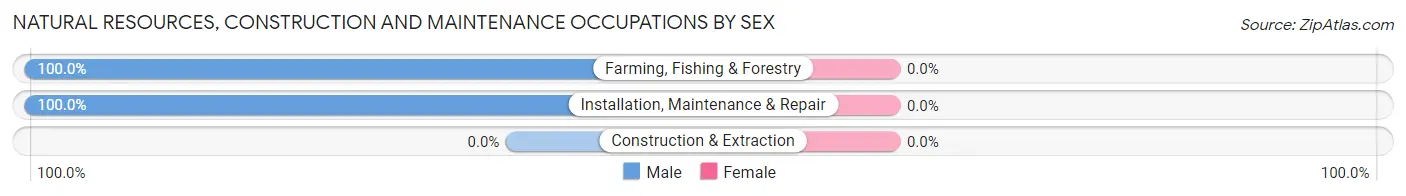
Natural Resources, Construction and Maintenance Occupations by Sex
| Occupation | Male | Female |
| Farming, Fishing & Forestry | 19 (100.0%) | 0 (0.0%) |
| Construction & Extraction | 0 (0.0%) | 0 (0.0%) |
| Installation, Maintenance & Repair | 83 (100.0%) | 0 (0.0%) |
| Total (Category) | 102 (100.0%) | 0 (0.0%) |
| Total (Overall) | 587 (45.7%) | 697 (54.3%) |
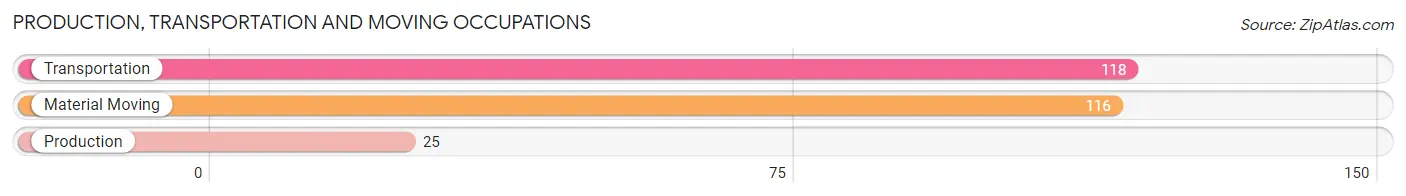
Production, Transportation and Moving Occupations
The most common Production, Transportation and Moving occupations in Thomasville are Transportation (118 | 9.2%), Material Moving (116 | 9.0%), and Production (25 | 1.9%).
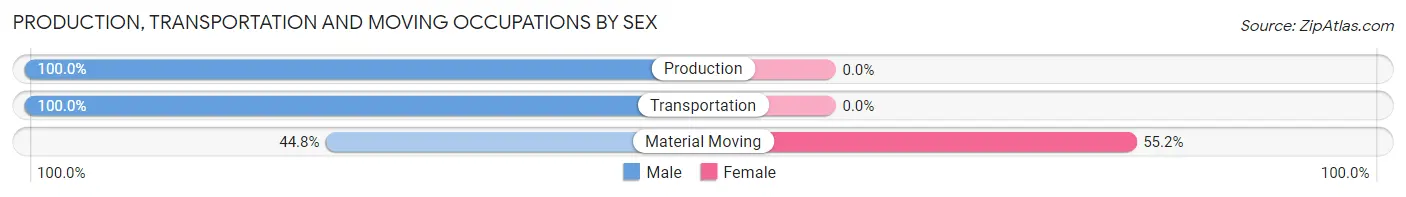
Production, Transportation and Moving Occupations by Sex
| Occupation | Male | Female |
| Production | 25 (100.0%) | 0 (0.0%) |
| Transportation | 118 (100.0%) | 0 (0.0%) |
| Material Moving | 52 (44.8%) | 64 (55.2%) |
| Total (Category) | 195 (75.3%) | 64 (24.7%) |
| Total (Overall) | 587 (45.7%) | 697 (54.3%) |
Employment Industries by Sex in Thomasville
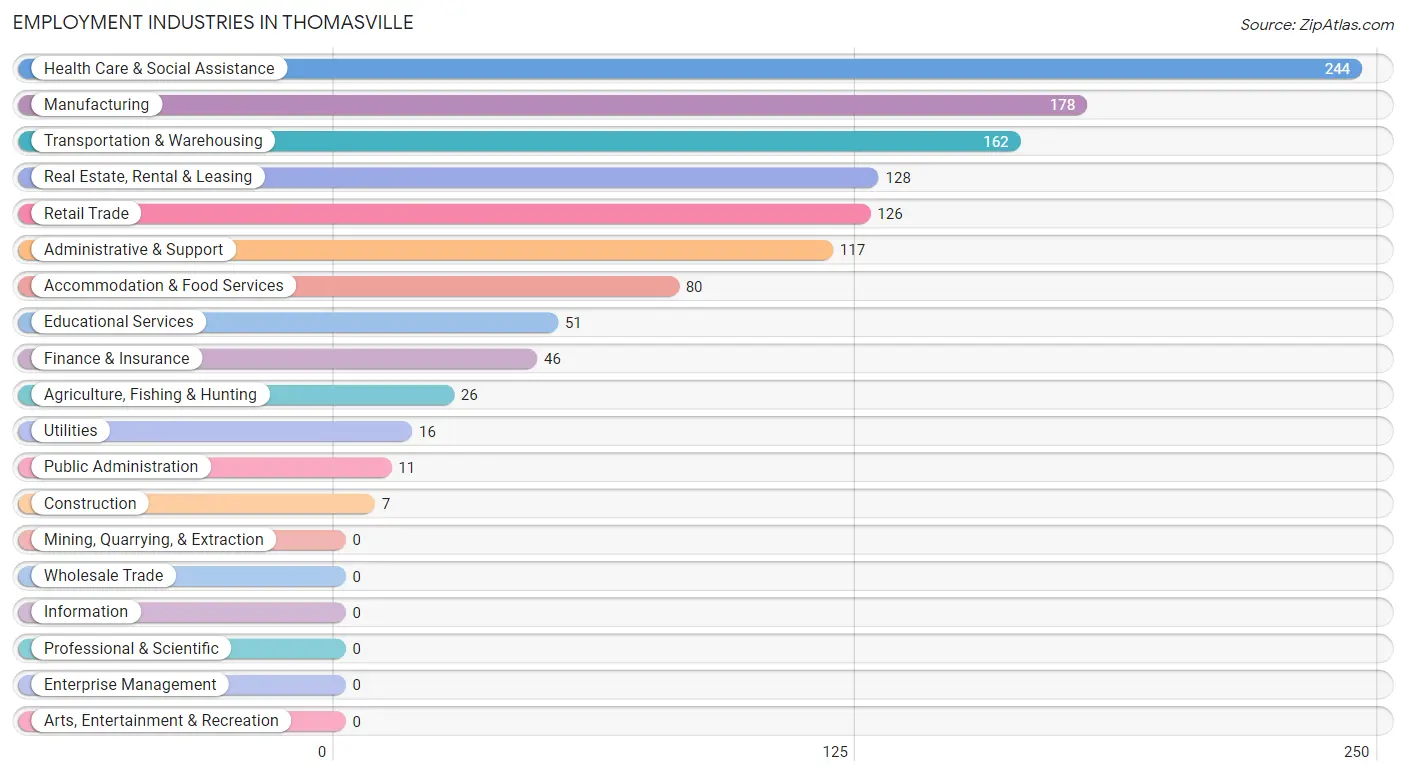
Employment Industries in Thomasville
The major employment industries in Thomasville include Health Care & Social Assistance (244 | 19.0%), Manufacturing (178 | 13.9%), Transportation & Warehousing (162 | 12.6%), Real Estate, Rental & Leasing (128 | 10.0%), and Retail Trade (126 | 9.8%).
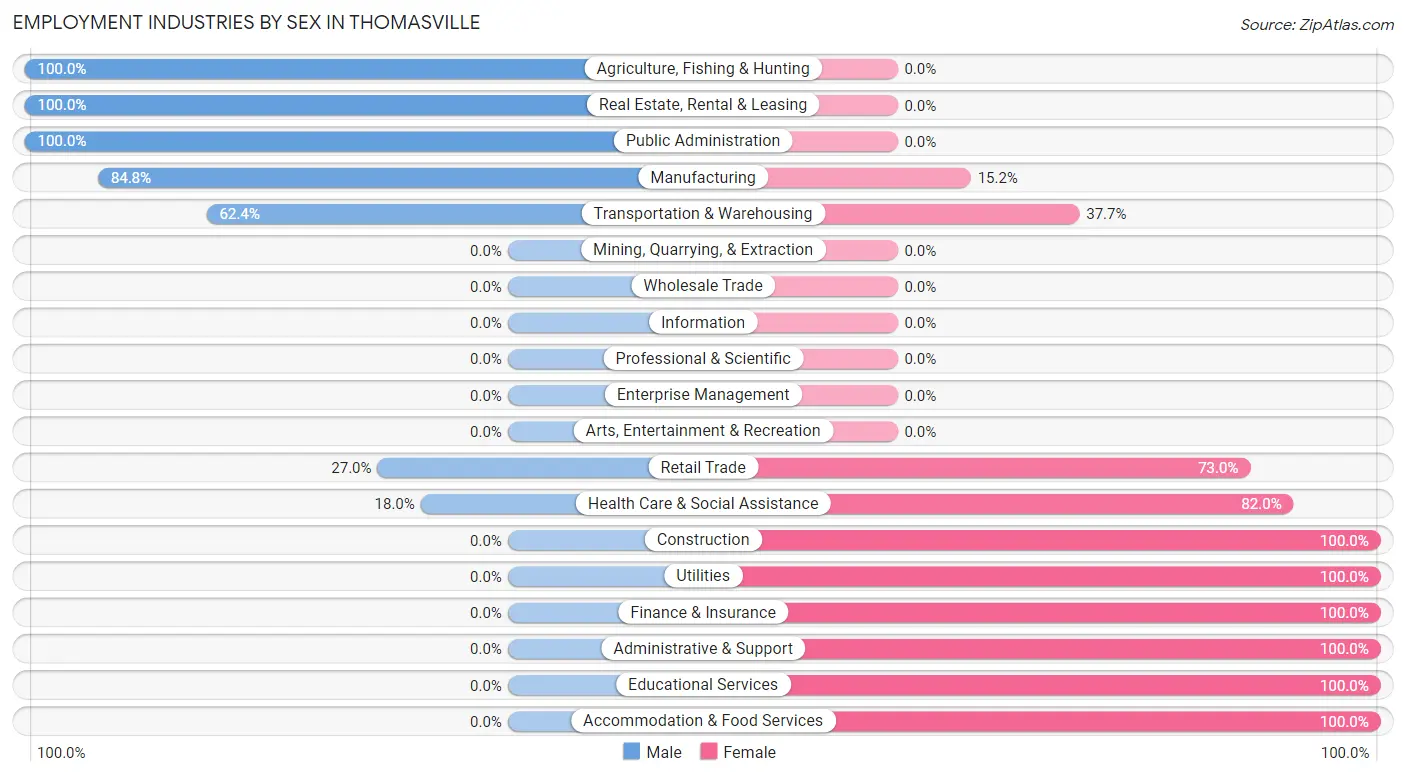
Employment Industries by Sex in Thomasville
The Thomasville industries that see more men than women are Agriculture, Fishing & Hunting (100.0%), Real Estate, Rental & Leasing (100.0%), and Public Administration (100.0%), whereas the industries that tend to have a higher number of women are Construction (100.0%), Utilities (100.0%), and Finance & Insurance (100.0%).
| Industry | Male | Female |
| Agriculture, Fishing & Hunting | 26 (100.0%) | 0 (0.0%) |
| Mining, Quarrying, & Extraction | 0 (0.0%) | 0 (0.0%) |
| Construction | 0 (0.0%) | 7 (100.0%) |
| Manufacturing | 151 (84.8%) | 27 (15.2%) |
| Wholesale Trade | 0 (0.0%) | 0 (0.0%) |
| Retail Trade | 34 (27.0%) | 92 (73.0%) |
| Transportation & Warehousing | 101 (62.4%) | 61 (37.7%) |
| Utilities | 0 (0.0%) | 16 (100.0%) |
| Information | 0 (0.0%) | 0 (0.0%) |
| Finance & Insurance | 0 (0.0%) | 46 (100.0%) |
| Real Estate, Rental & Leasing | 128 (100.0%) | 0 (0.0%) |
| Professional & Scientific | 0 (0.0%) | 0 (0.0%) |
| Enterprise Management | 0 (0.0%) | 0 (0.0%) |
| Administrative & Support | 0 (0.0%) | 117 (100.0%) |
| Educational Services | 0 (0.0%) | 51 (100.0%) |
| Health Care & Social Assistance | 44 (18.0%) | 200 (82.0%) |
| Arts, Entertainment & Recreation | 0 (0.0%) | 0 (0.0%) |
| Accommodation & Food Services | 0 (0.0%) | 80 (100.0%) |
| Public Administration | 11 (100.0%) | 0 (0.0%) |
| Total | 587 (45.7%) | 697 (54.3%) |
Education in Thomasville
School Enrollment in Thomasville
The most common levels of schooling among the 824 students in Thomasville are middle school (348 | 42.2%), high school (211 | 25.6%), and elementary school (136 | 16.5%).
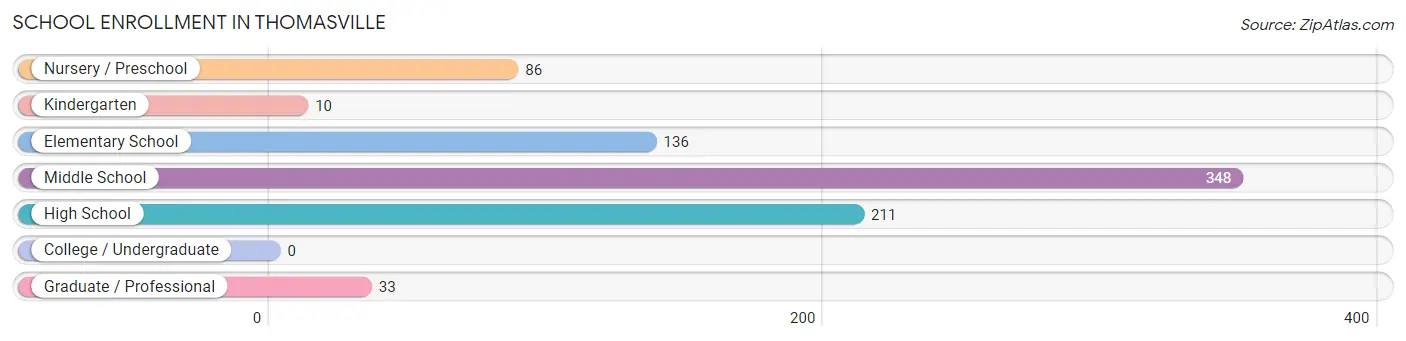
| School Level | # Students | % Students |
| Nursery / Preschool | 86 | 10.4% |
| Kindergarten | 10 | 1.2% |
| Elementary School | 136 | 16.5% |
| Middle School | 348 | 42.2% |
| High School | 211 | 25.6% |
| College / Undergraduate | 0 | 0.0% |
| Graduate / Professional | 33 | 4.0% |
| Total | 824 | 100.0% |
School Enrollment by Age by Funding Source in Thomasville
Out of a total of 824 students who are enrolled in schools in Thomasville, 69 (8.4%) attend a private institution, while the remaining 755 (91.6%) are enrolled in public schools. The age group of 5 to 9 year old has the highest likelihood of being enrolled in private schools, with 25 (30.1% in the age bracket) enrolled. Conversely, the age group of 3 to 4 year olds has the lowest likelihood of being enrolled in a private school, with 86 (100.0% in the age bracket) attending a public institution.
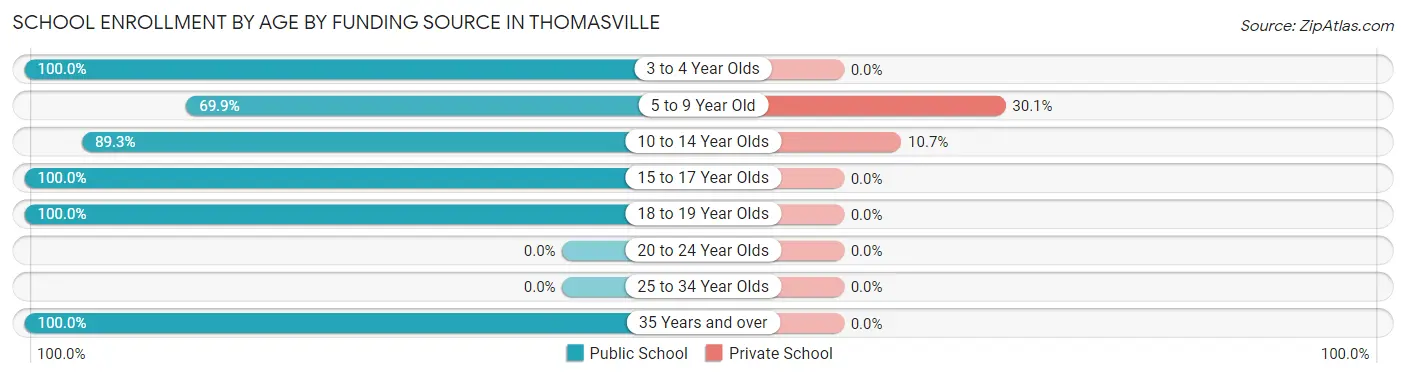
| Age Bracket | Public School | Private School |
| 3 to 4 Year Olds | 86 (100.0%) | 0 (0.0%) |
| 5 to 9 Year Old | 58 (69.9%) | 25 (30.1%) |
| 10 to 14 Year Olds | 367 (89.3%) | 44 (10.7%) |
| 15 to 17 Year Olds | 199 (100.0%) | 0 (0.0%) |
| 18 to 19 Year Olds | 12 (100.0%) | 0 (0.0%) |
| 20 to 24 Year Olds | 0 (0.0%) | 0 (0.0%) |
| 25 to 34 Year Olds | 0 (0.0%) | 0 (0.0%) |
| 35 Years and over | 33 (100.0%) | 0 (0.0%) |
| Total | 755 (91.6%) | 69 (8.4%) |
Educational Attainment by Field of Study in Thomasville
Business (75 | 37.1%), education (70 | 34.6%), computers & mathematics (22 | 10.9%), arts & humanities (15 | 7.4%), and communications (13 | 6.4%) are the most common fields of study among 202 individuals in Thomasville who have obtained a bachelor's degree or higher.
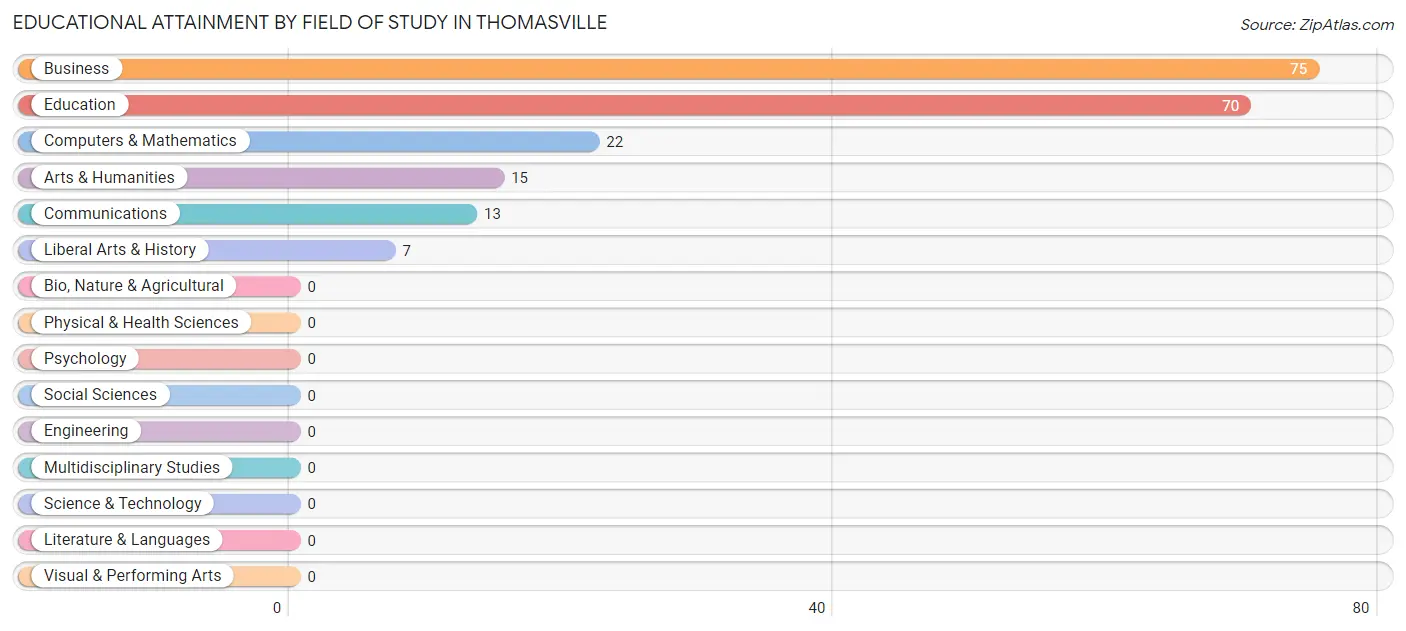
| Field of Study | # Graduates | % Graduates |
| Computers & Mathematics | 22 | 10.9% |
| Bio, Nature & Agricultural | 0 | 0.0% |
| Physical & Health Sciences | 0 | 0.0% |
| Psychology | 0 | 0.0% |
| Social Sciences | 0 | 0.0% |
| Engineering | 0 | 0.0% |
| Multidisciplinary Studies | 0 | 0.0% |
| Science & Technology | 0 | 0.0% |
| Business | 75 | 37.1% |
| Education | 70 | 34.6% |
| Literature & Languages | 0 | 0.0% |
| Liberal Arts & History | 7 | 3.5% |
| Visual & Performing Arts | 0 | 0.0% |
| Communications | 13 | 6.4% |
| Arts & Humanities | 15 | 7.4% |
| Total | 202 | 100.0% |
Transportation & Commute in Thomasville
Vehicle Availability by Sex in Thomasville
The most prevalent vehicle ownership categories in Thomasville are males with 1 vehicle (248, accounting for 42.2%) and females with 1 vehicle (120, making up 38.4%).
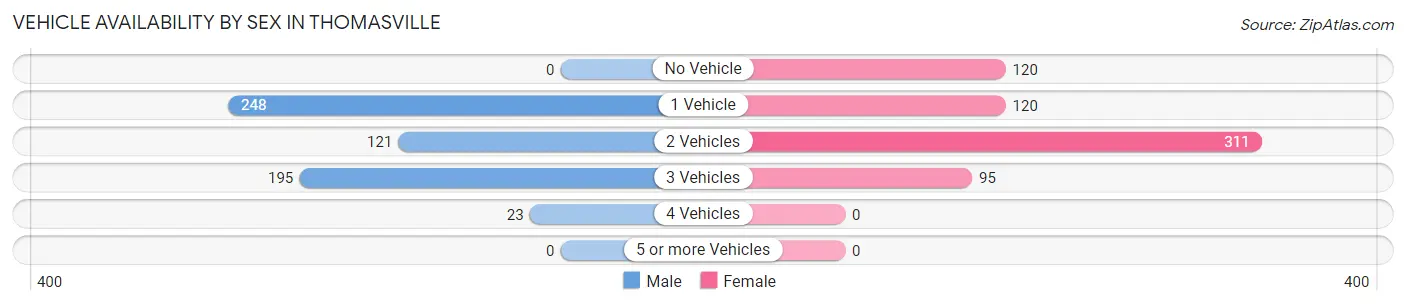
| Vehicles Available | Male | Female |
| No Vehicle | 0 (0.0%) | 120 (18.6%) |
| 1 Vehicle | 248 (42.2%) | 120 (18.6%) |
| 2 Vehicles | 121 (20.6%) | 311 (48.1%) |
| 3 Vehicles | 195 (33.2%) | 95 (14.7%) |
| 4 Vehicles | 23 (3.9%) | 0 (0.0%) |
| 5 or more Vehicles | 0 (0.0%) | 0 (0.0%) |
| Total | 587 (100.0%) | 646 (100.0%) |
Commute Time in Thomasville
The most frequently occuring commute durations in Thomasville are 60 to 89 minutes (229 commuters, 20.1%), 5 to 9 minutes (214 commuters, 18.8%), and 10 to 14 minutes (203 commuters, 17.8%).
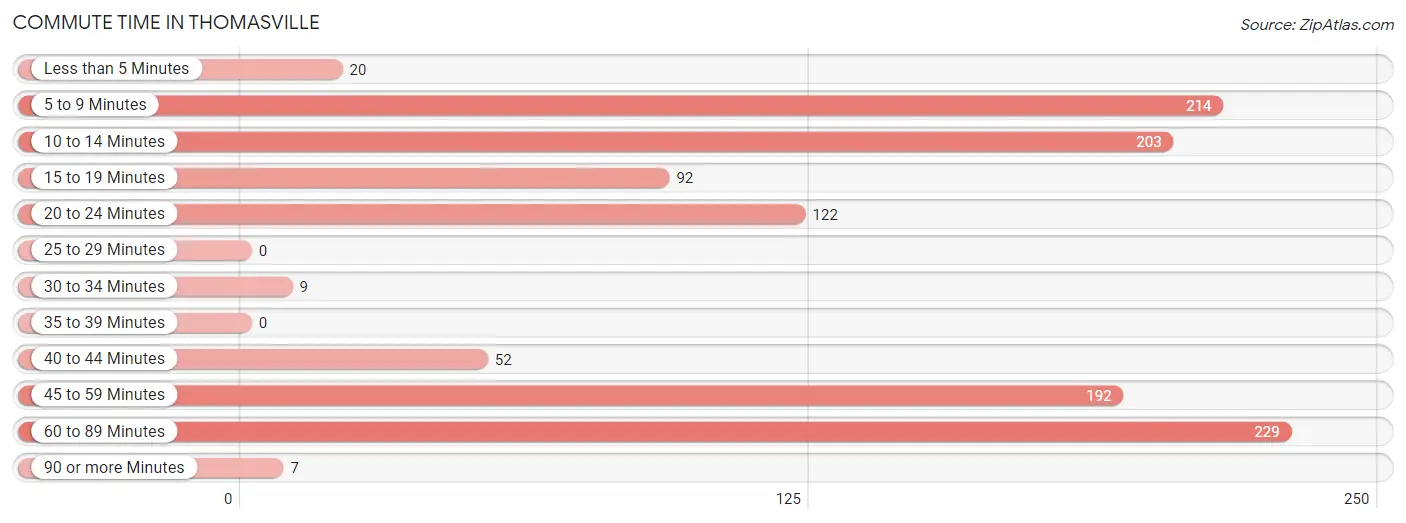
| Commute Time | # Commuters | % Commuters |
| Less than 5 Minutes | 20 | 1.8% |
| 5 to 9 Minutes | 214 | 18.8% |
| 10 to 14 Minutes | 203 | 17.8% |
| 15 to 19 Minutes | 92 | 8.1% |
| 20 to 24 Minutes | 122 | 10.7% |
| 25 to 29 Minutes | 0 | 0.0% |
| 30 to 34 Minutes | 9 | 0.8% |
| 35 to 39 Minutes | 0 | 0.0% |
| 40 to 44 Minutes | 52 | 4.6% |
| 45 to 59 Minutes | 192 | 16.8% |
| 60 to 89 Minutes | 229 | 20.1% |
| 90 or more Minutes | 7 | 0.6% |
Commute Time by Sex in Thomasville
The most common commute times in Thomasville are 60 to 89 minutes (215 commuters, 37.7%) for males and 5 to 9 minutes (159 commuters, 27.9%) for females.
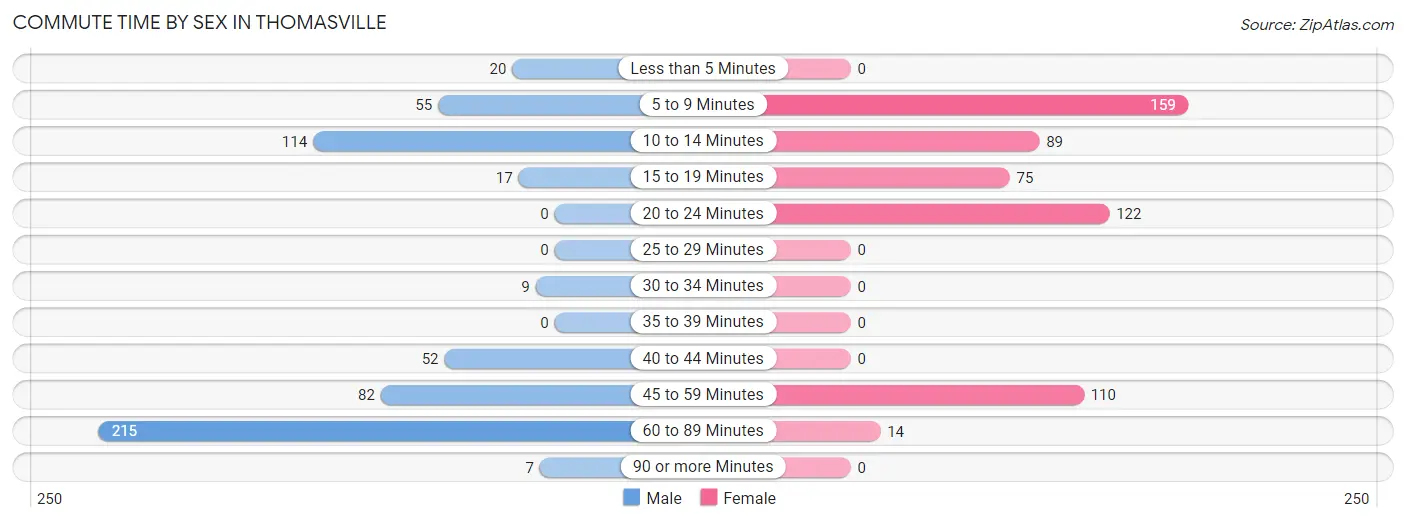
| Commute Time | Male | Female |
| Less than 5 Minutes | 20 (3.5%) | 0 (0.0%) |
| 5 to 9 Minutes | 55 (9.6%) | 159 (27.9%) |
| 10 to 14 Minutes | 114 (20.0%) | 89 (15.6%) |
| 15 to 19 Minutes | 17 (3.0%) | 75 (13.2%) |
| 20 to 24 Minutes | 0 (0.0%) | 122 (21.4%) |
| 25 to 29 Minutes | 0 (0.0%) | 0 (0.0%) |
| 30 to 34 Minutes | 9 (1.6%) | 0 (0.0%) |
| 35 to 39 Minutes | 0 (0.0%) | 0 (0.0%) |
| 40 to 44 Minutes | 52 (9.1%) | 0 (0.0%) |
| 45 to 59 Minutes | 82 (14.4%) | 110 (19.3%) |
| 60 to 89 Minutes | 215 (37.7%) | 14 (2.5%) |
| 90 or more Minutes | 7 (1.2%) | 0 (0.0%) |
Time of Departure to Work by Sex in Thomasville
The most frequent times of departure to work in Thomasville are 5:00 AM to 5:29 AM (234, 41.0%) for males and 8:00 AM to 8:29 AM (176, 30.9%) for females.
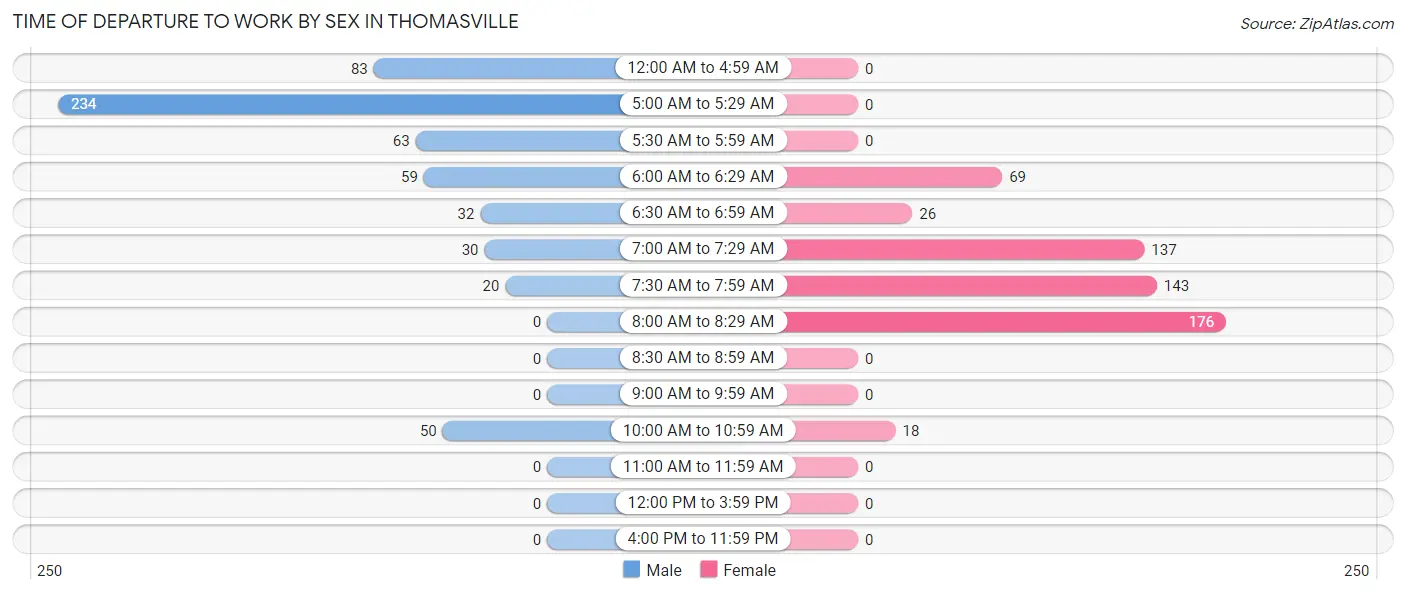
| Time of Departure | Male | Female |
| 12:00 AM to 4:59 AM | 83 (14.5%) | 0 (0.0%) |
| 5:00 AM to 5:29 AM | 234 (41.0%) | 0 (0.0%) |
| 5:30 AM to 5:59 AM | 63 (11.0%) | 0 (0.0%) |
| 6:00 AM to 6:29 AM | 59 (10.3%) | 69 (12.1%) |
| 6:30 AM to 6:59 AM | 32 (5.6%) | 26 (4.6%) |
| 7:00 AM to 7:29 AM | 30 (5.2%) | 137 (24.1%) |
| 7:30 AM to 7:59 AM | 20 (3.5%) | 143 (25.1%) |
| 8:00 AM to 8:29 AM | 0 (0.0%) | 176 (30.9%) |
| 8:30 AM to 8:59 AM | 0 (0.0%) | 0 (0.0%) |
| 9:00 AM to 9:59 AM | 0 (0.0%) | 0 (0.0%) |
| 10:00 AM to 10:59 AM | 50 (8.8%) | 18 (3.2%) |
| 11:00 AM to 11:59 AM | 0 (0.0%) | 0 (0.0%) |
| 12:00 PM to 3:59 PM | 0 (0.0%) | 0 (0.0%) |
| 4:00 PM to 11:59 PM | 0 (0.0%) | 0 (0.0%) |
| Total | 571 (100.0%) | 569 (100.0%) |
Housing Occupancy in Thomasville
Occupancy by Ownership in Thomasville
Of the total 1,365 dwellings in Thomasville, owner-occupied units account for 695 (50.9%), while renter-occupied units make up 670 (49.1%).
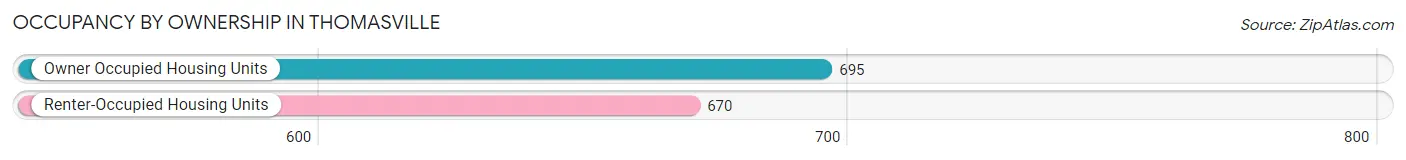
| Occupancy | # Housing Units | % Housing Units |
| Owner Occupied Housing Units | 695 | 50.9% |
| Renter-Occupied Housing Units | 670 | 49.1% |
| Total Occupied Housing Units | 1,365 | 100.0% |
Occupancy by Household Size in Thomasville
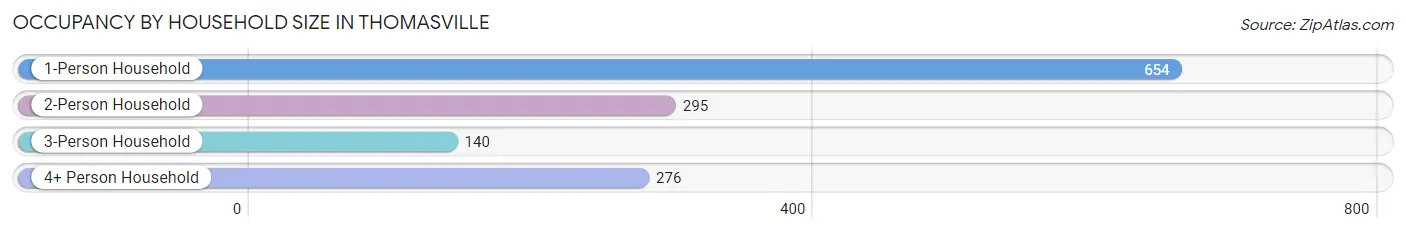
| Household Size | # Housing Units | % Housing Units |
| 1-Person Household | 654 | 47.9% |
| 2-Person Household | 295 | 21.6% |
| 3-Person Household | 140 | 10.3% |
| 4+ Person Household | 276 | 20.2% |
| Total Housing Units | 1,365 | 100.0% |
Occupancy by Ownership by Household Size in Thomasville
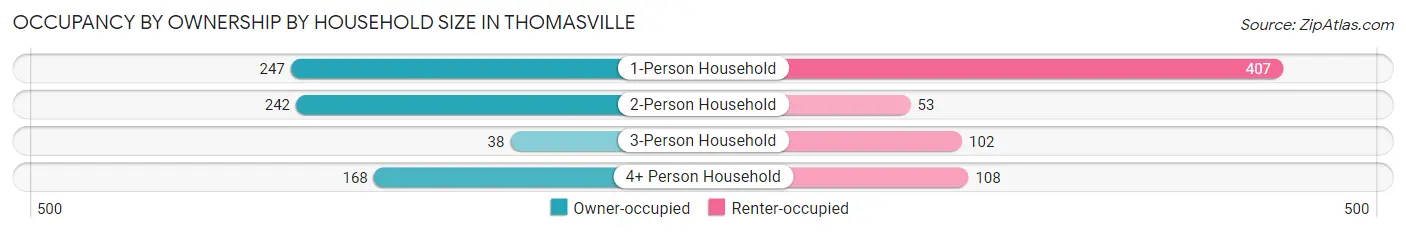
| Household Size | Owner-occupied | Renter-occupied |
| 1-Person Household | 247 (37.8%) | 407 (62.2%) |
| 2-Person Household | 242 (82.0%) | 53 (18.0%) |
| 3-Person Household | 38 (27.1%) | 102 (72.9%) |
| 4+ Person Household | 168 (60.9%) | 108 (39.1%) |
| Total Housing Units | 695 (50.9%) | 670 (49.1%) |
Occupancy by Educational Attainment in Thomasville
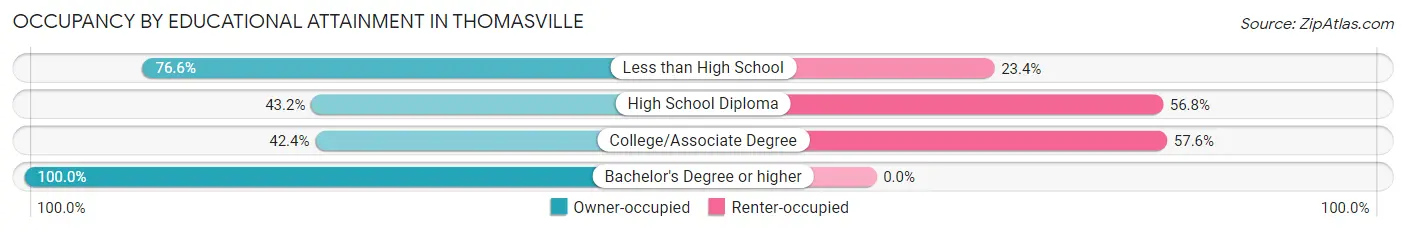
| Household Size | Owner-occupied | Renter-occupied |
| Less than High School | 36 (76.6%) | 11 (23.4%) |
| High School Diploma | 294 (43.2%) | 387 (56.8%) |
| College/Associate Degree | 200 (42.4%) | 272 (57.6%) |
| Bachelor's Degree or higher | 165 (100.0%) | 0 (0.0%) |
Occupancy by Age of Householder in Thomasville
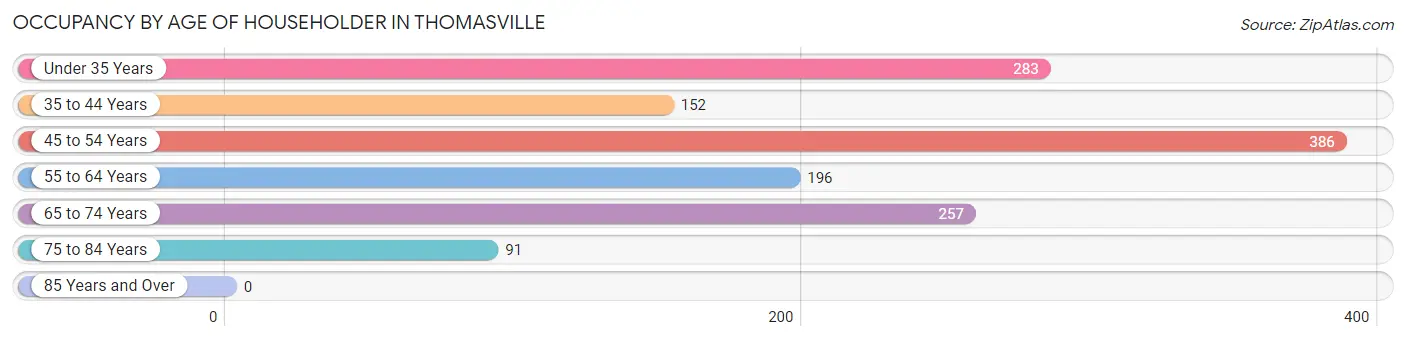
| Age Bracket | # Households | % Households |
| Under 35 Years | 283 | 20.7% |
| 35 to 44 Years | 152 | 11.1% |
| 45 to 54 Years | 386 | 28.3% |
| 55 to 64 Years | 196 | 14.4% |
| 65 to 74 Years | 257 | 18.8% |
| 75 to 84 Years | 91 | 6.7% |
| 85 Years and Over | 0 | 0.0% |
| Total | 1,365 | 100.0% |
Housing Finances in Thomasville
Median Income by Occupancy in Thomasville
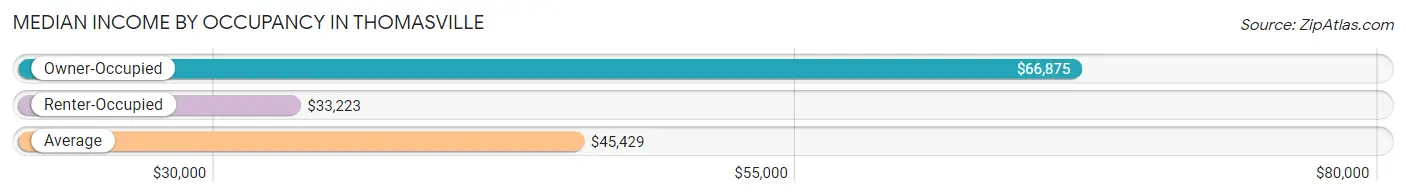
| Occupancy Type | # Households | Median Income |
| Owner-Occupied | 695 (50.9%) | $66,875 |
| Renter-Occupied | 670 (49.1%) | $33,223 |
| Average | 1,365 (100.0%) | $45,429 |
Occupancy by Householder Income Bracket in Thomasville
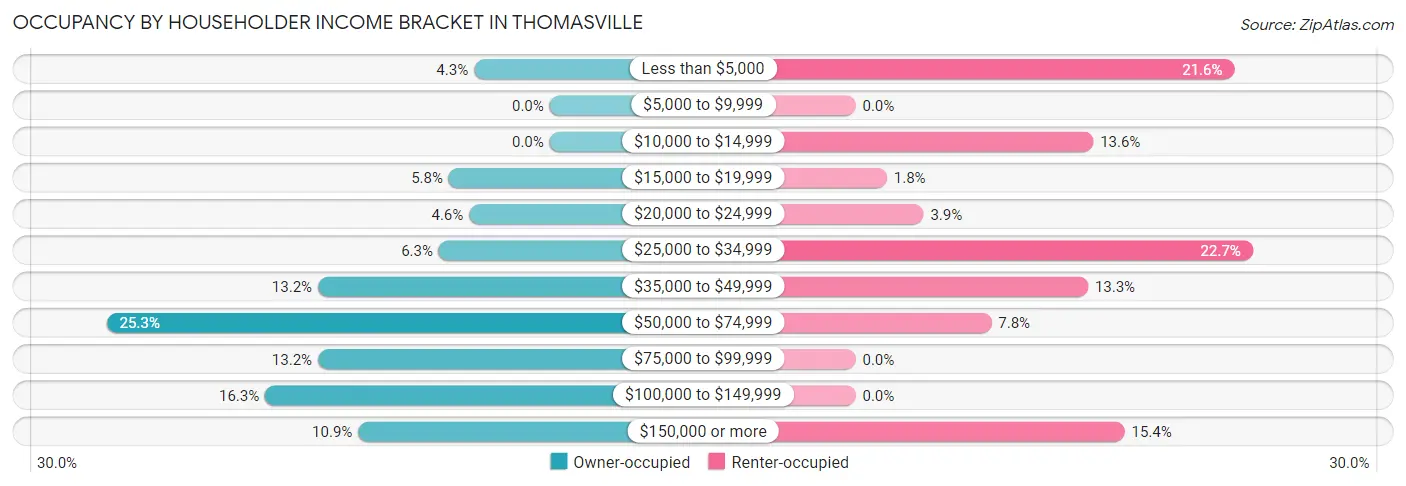
| Income Bracket | Owner-occupied | Renter-occupied |
| Less than $5,000 | 30 (4.3%) | 145 (21.6%) |
| $5,000 to $9,999 | 0 (0.0%) | 0 (0.0%) |
| $10,000 to $14,999 | 0 (0.0%) | 91 (13.6%) |
| $15,000 to $19,999 | 40 (5.8%) | 12 (1.8%) |
| $20,000 to $24,999 | 32 (4.6%) | 26 (3.9%) |
| $25,000 to $34,999 | 44 (6.3%) | 152 (22.7%) |
| $35,000 to $49,999 | 92 (13.2%) | 89 (13.3%) |
| $50,000 to $74,999 | 176 (25.3%) | 52 (7.8%) |
| $75,000 to $99,999 | 92 (13.2%) | 0 (0.0%) |
| $100,000 to $149,999 | 113 (16.3%) | 0 (0.0%) |
| $150,000 or more | 76 (10.9%) | 103 (15.4%) |
| Total | 695 (100.0%) | 670 (100.0%) |
Monthly Housing Cost Tiers in Thomasville
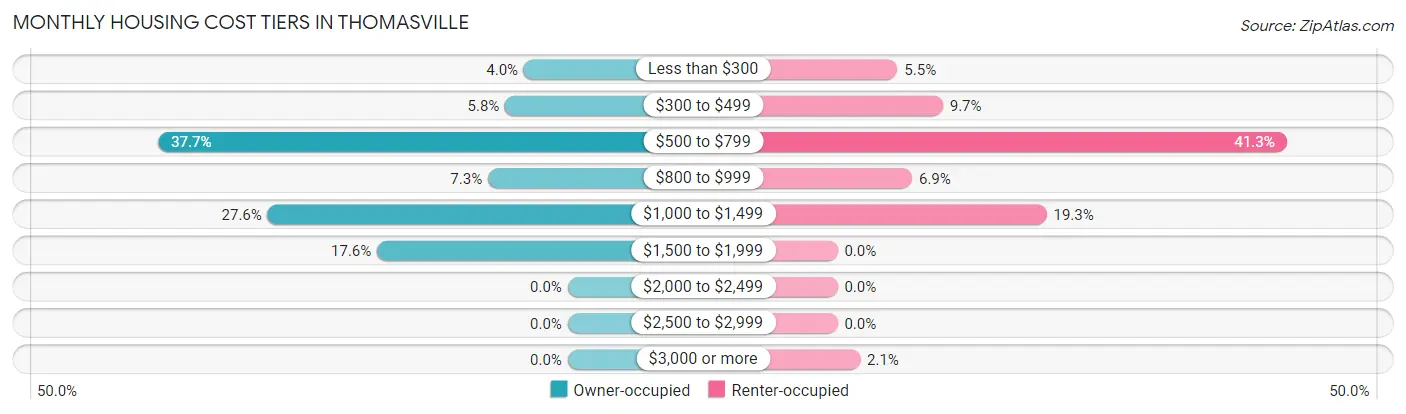
| Monthly Cost | Owner-occupied | Renter-occupied |
| Less than $300 | 28 (4.0%) | 37 (5.5%) |
| $300 to $499 | 40 (5.8%) | 65 (9.7%) |
| $500 to $799 | 262 (37.7%) | 277 (41.3%) |
| $800 to $999 | 51 (7.3%) | 46 (6.9%) |
| $1,000 to $1,499 | 192 (27.6%) | 129 (19.3%) |
| $1,500 to $1,999 | 122 (17.5%) | 0 (0.0%) |
| $2,000 to $2,499 | 0 (0.0%) | 0 (0.0%) |
| $2,500 to $2,999 | 0 (0.0%) | 0 (0.0%) |
| $3,000 or more | 0 (0.0%) | 14 (2.1%) |
| Total | 695 (100.0%) | 670 (100.0%) |
Physical Housing Characteristics in Thomasville
Housing Structures in Thomasville
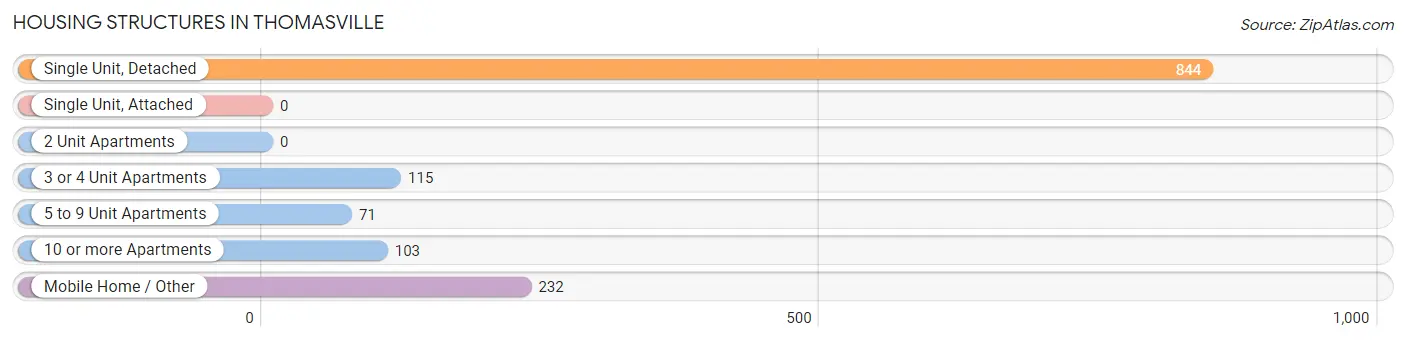
| Structure Type | # Housing Units | % Housing Units |
| Single Unit, Detached | 844 | 61.8% |
| Single Unit, Attached | 0 | 0.0% |
| 2 Unit Apartments | 0 | 0.0% |
| 3 or 4 Unit Apartments | 115 | 8.4% |
| 5 to 9 Unit Apartments | 71 | 5.2% |
| 10 or more Apartments | 103 | 7.5% |
| Mobile Home / Other | 232 | 17.0% |
| Total | 1,365 | 100.0% |
Housing Structures by Occupancy in Thomasville
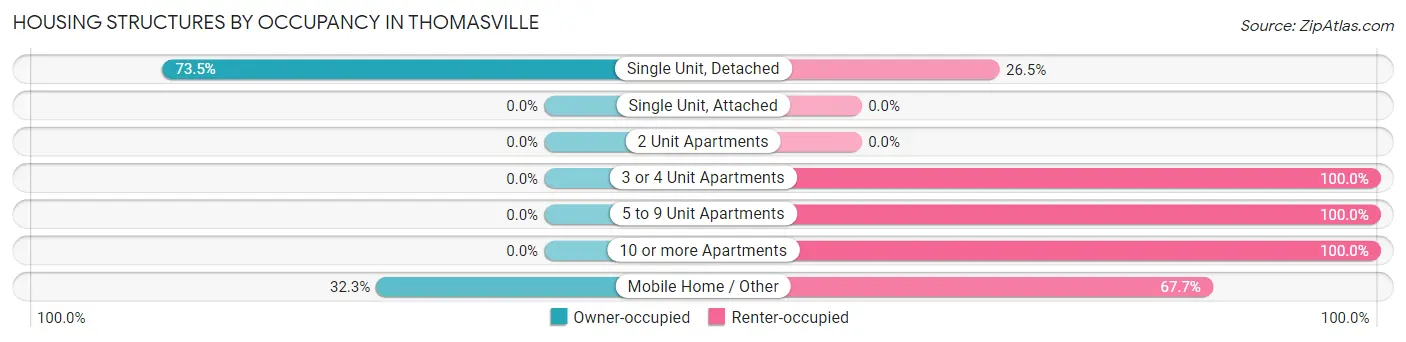
| Structure Type | Owner-occupied | Renter-occupied |
| Single Unit, Detached | 620 (73.5%) | 224 (26.5%) |
| Single Unit, Attached | 0 (0.0%) | 0 (0.0%) |
| 2 Unit Apartments | 0 (0.0%) | 0 (0.0%) |
| 3 or 4 Unit Apartments | 0 (0.0%) | 115 (100.0%) |
| 5 to 9 Unit Apartments | 0 (0.0%) | 71 (100.0%) |
| 10 or more Apartments | 0 (0.0%) | 103 (100.0%) |
| Mobile Home / Other | 75 (32.3%) | 157 (67.7%) |
| Total | 695 (50.9%) | 670 (49.1%) |
Housing Structures by Number of Rooms in Thomasville
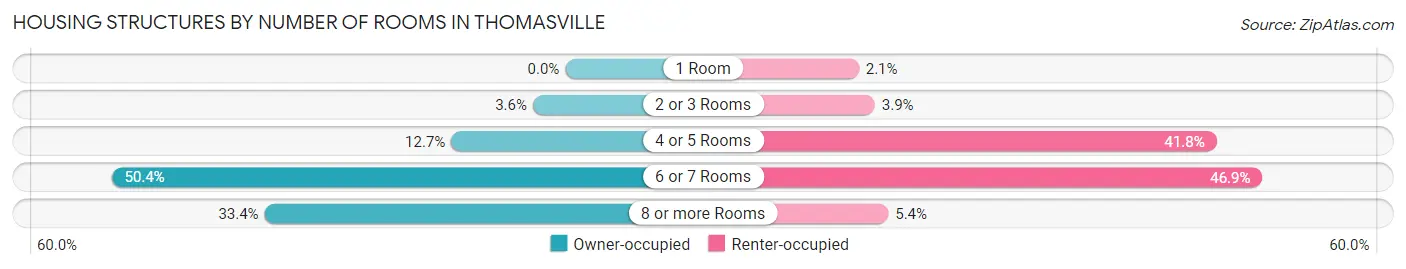
| Number of Rooms | Owner-occupied | Renter-occupied |
| 1 Room | 0 (0.0%) | 14 (2.1%) |
| 2 or 3 Rooms | 25 (3.6%) | 26 (3.9%) |
| 4 or 5 Rooms | 88 (12.7%) | 280 (41.8%) |
| 6 or 7 Rooms | 350 (50.4%) | 314 (46.9%) |
| 8 or more Rooms | 232 (33.4%) | 36 (5.4%) |
| Total | 695 (100.0%) | 670 (100.0%) |
Housing Structure by Heating Type in Thomasville
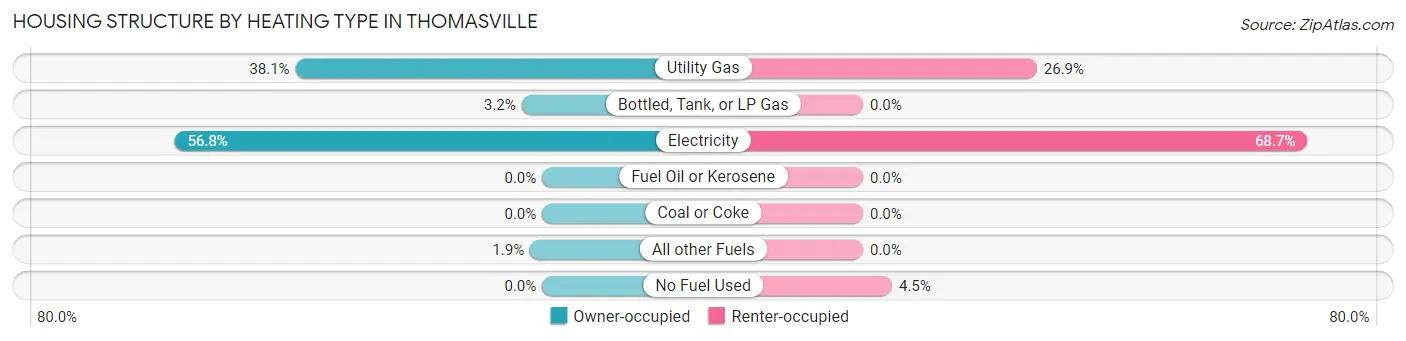
| Heating Type | Owner-occupied | Renter-occupied |
| Utility Gas | 265 (38.1%) | 180 (26.9%) |
| Bottled, Tank, or LP Gas | 22 (3.2%) | 0 (0.0%) |
| Electricity | 395 (56.8%) | 460 (68.7%) |
| Fuel Oil or Kerosene | 0 (0.0%) | 0 (0.0%) |
| Coal or Coke | 0 (0.0%) | 0 (0.0%) |
| All other Fuels | 13 (1.9%) | 0 (0.0%) |
| No Fuel Used | 0 (0.0%) | 30 (4.5%) |
| Total | 695 (100.0%) | 670 (100.0%) |
Household Vehicle Usage in Thomasville
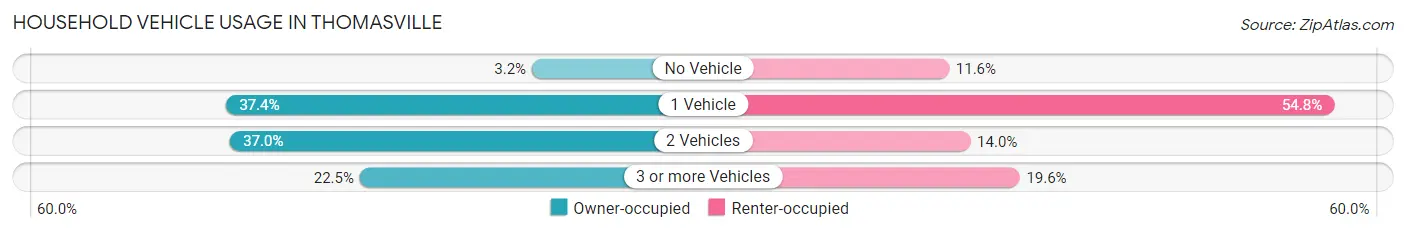
| Vehicles per Household | Owner-occupied | Renter-occupied |
| No Vehicle | 22 (3.2%) | 78 (11.6%) |
| 1 Vehicle | 260 (37.4%) | 367 (54.8%) |
| 2 Vehicles | 257 (37.0%) | 94 (14.0%) |
| 3 or more Vehicles | 156 (22.5%) | 131 (19.6%) |
| Total | 695 (100.0%) | 670 (100.0%) |
Real Estate & Mortgages in Thomasville
Real Estate and Mortgage Overview in Thomasville
| Characteristic | Without Mortgage | With Mortgage |
| Housing Units | 304 | 391 |
| Median Property Value | $204,200 | $185,700 |
| Median Household Income | $64,231 | $12 |
| Monthly Housing Costs | $609 | $0 |
| Real Estate Taxes | $361 | $41 |
Property Value by Mortgage Status in Thomasville
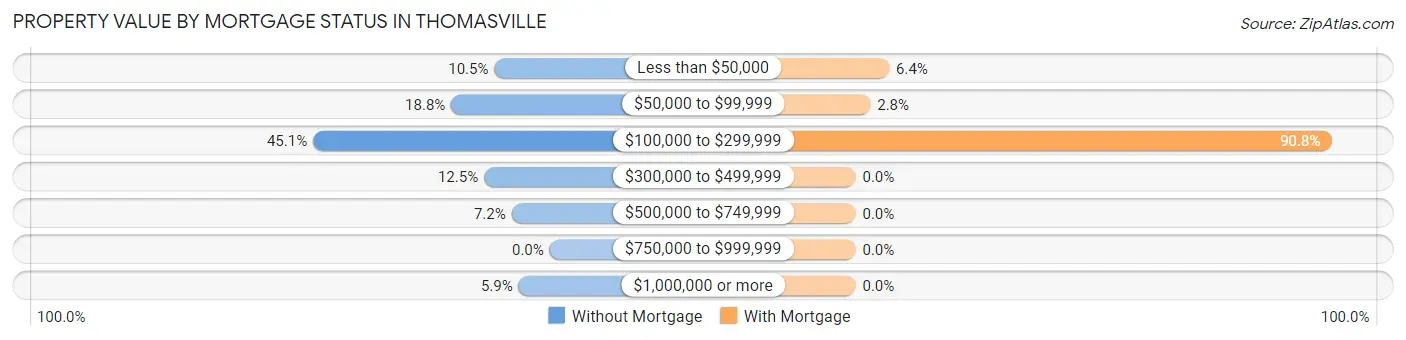
| Property Value | Without Mortgage | With Mortgage |
| Less than $50,000 | 32 (10.5%) | 25 (6.4%) |
| $50,000 to $99,999 | 57 (18.8%) | 11 (2.8%) |
| $100,000 to $299,999 | 137 (45.1%) | 355 (90.8%) |
| $300,000 to $499,999 | 38 (12.5%) | 0 (0.0%) |
| $500,000 to $749,999 | 22 (7.2%) | 0 (0.0%) |
| $750,000 to $999,999 | 0 (0.0%) | 0 (0.0%) |
| $1,000,000 or more | 18 (5.9%) | 0 (0.0%) |
| Total | 304 (100.0%) | 391 (100.0%) |
Household Income by Mortgage Status in Thomasville
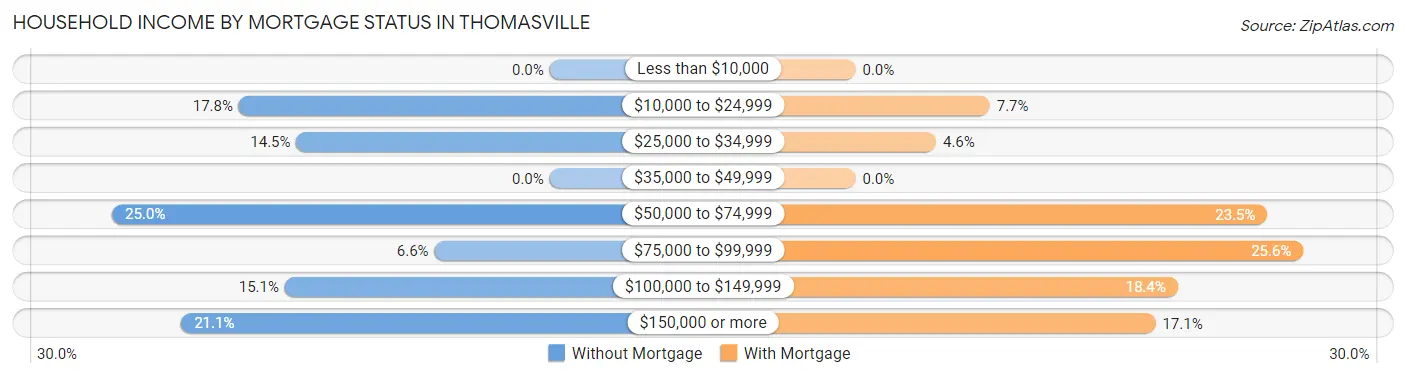
| Household Income | Without Mortgage | With Mortgage |
| Less than $10,000 | 0 (0.0%) | 0 (0.0%) |
| $10,000 to $24,999 | 54 (17.8%) | 30 (7.7%) |
| $25,000 to $34,999 | 44 (14.5%) | 18 (4.6%) |
| $35,000 to $49,999 | 0 (0.0%) | 0 (0.0%) |
| $50,000 to $74,999 | 76 (25.0%) | 92 (23.5%) |
| $75,000 to $99,999 | 20 (6.6%) | 100 (25.6%) |
| $100,000 to $149,999 | 46 (15.1%) | 72 (18.4%) |
| $150,000 or more | 64 (21.0%) | 67 (17.1%) |
| Total | 304 (100.0%) | 391 (100.0%) |
Property Value to Household Income Ratio in Thomasville
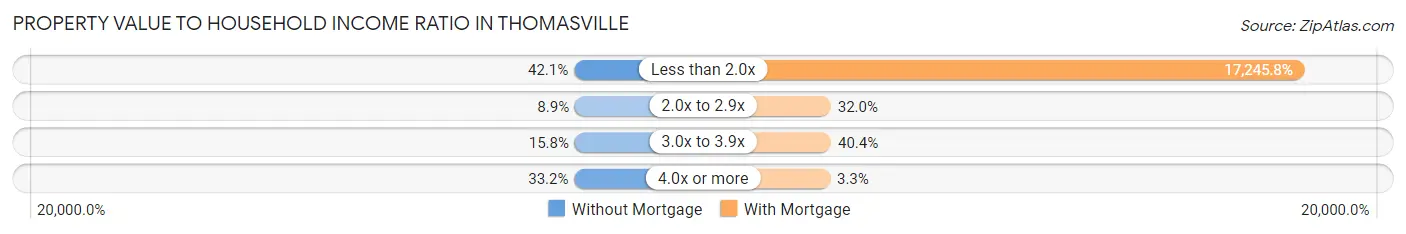
| Value-to-Income Ratio | Without Mortgage | With Mortgage |
| Less than 2.0x | 128 (42.1%) | 67,431 (17,245.8%) |
| 2.0x to 2.9x | 27 (8.9%) | 125 (32.0%) |
| 3.0x to 3.9x | 48 (15.8%) | 158 (40.4%) |
| 4.0x or more | 101 (33.2%) | 13 (3.3%) |
| Total | 304 (100.0%) | 391 (100.0%) |
Real Estate Taxes by Mortgage Status in Thomasville
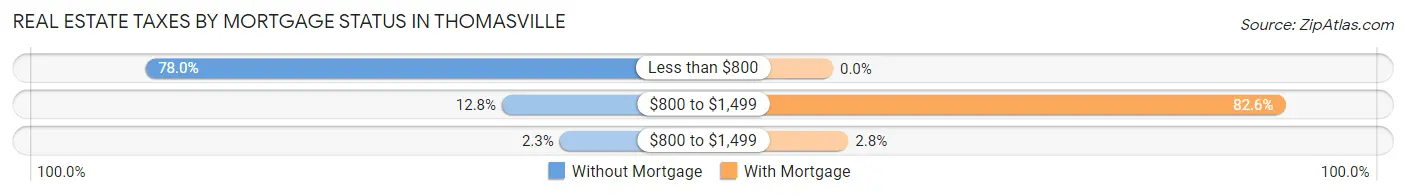
| Property Taxes | Without Mortgage | With Mortgage |
| Less than $800 | 237 (78.0%) | 0 (0.0%) |
| $800 to $1,499 | 39 (12.8%) | 323 (82.6%) |
| $800 to $1,499 | 7 (2.3%) | 11 (2.8%) |
| Total | 304 (100.0%) | 391 (100.0%) |
Health & Disability in Thomasville
Health Insurance Coverage by Age in Thomasville
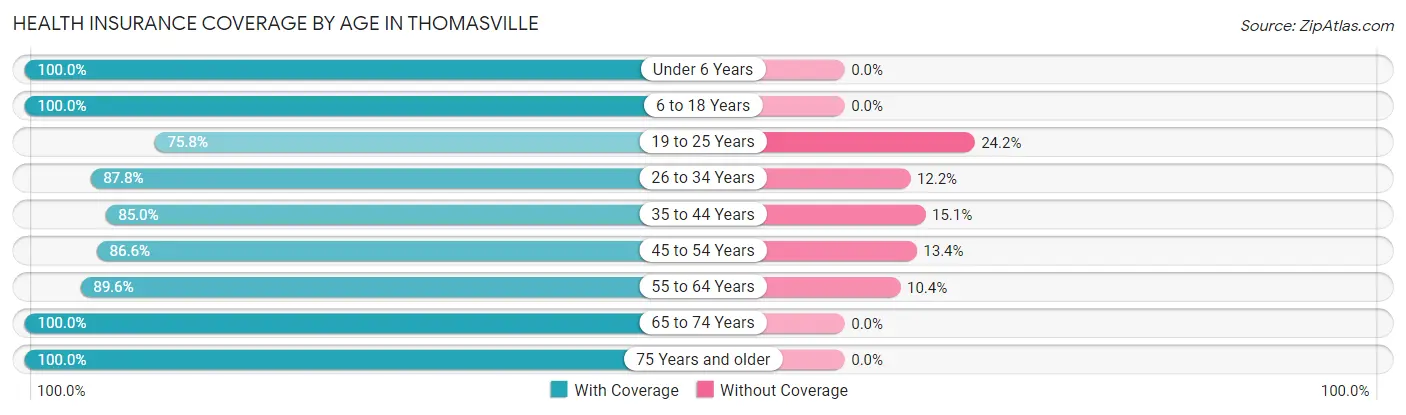
| Age Bracket | With Coverage | Without Coverage |
| Under 6 Years | 184 (100.0%) | 0 (0.0%) |
| 6 to 18 Years | 840 (100.0%) | 0 (0.0%) |
| 19 to 25 Years | 222 (75.8%) | 71 (24.2%) |
| 26 to 34 Years | 373 (87.8%) | 52 (12.2%) |
| 35 to 44 Years | 175 (85.0%) | 31 (15.0%) |
| 45 to 54 Years | 689 (86.6%) | 107 (13.4%) |
| 55 to 64 Years | 276 (89.6%) | 32 (10.4%) |
| 65 to 74 Years | 303 (100.0%) | 0 (0.0%) |
| 75 Years and older | 198 (100.0%) | 0 (0.0%) |
| Total | 3,260 (91.7%) | 293 (8.3%) |
Health Insurance Coverage by Citizenship Status in Thomasville
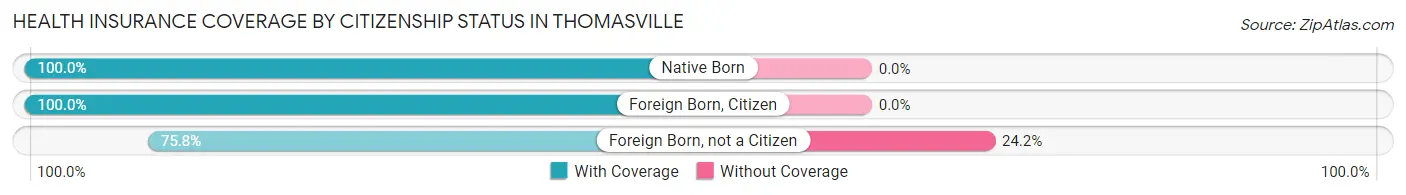
| Citizenship Status | With Coverage | Without Coverage |
| Native Born | 184 (100.0%) | 0 (0.0%) |
| Foreign Born, Citizen | 840 (100.0%) | 0 (0.0%) |
| Foreign Born, not a Citizen | 222 (75.8%) | 71 (24.2%) |
Health Insurance Coverage by Household Income in Thomasville
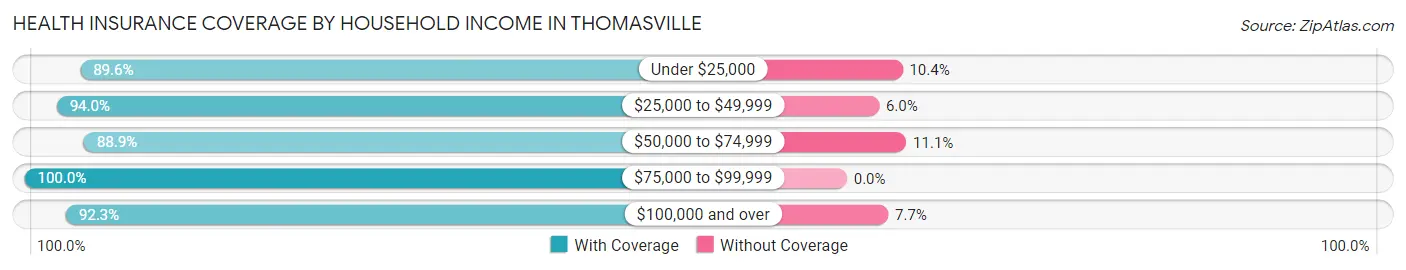
| Household Income | With Coverage | Without Coverage |
| Under $25,000 | 567 (89.6%) | 66 (10.4%) |
| $25,000 to $49,999 | 734 (94.0%) | 47 (6.0%) |
| $50,000 to $74,999 | 799 (88.9%) | 100 (11.1%) |
| $75,000 to $99,999 | 202 (100.0%) | 0 (0.0%) |
| $100,000 and over | 954 (92.3%) | 80 (7.7%) |
Public vs Private Health Insurance Coverage by Age in Thomasville
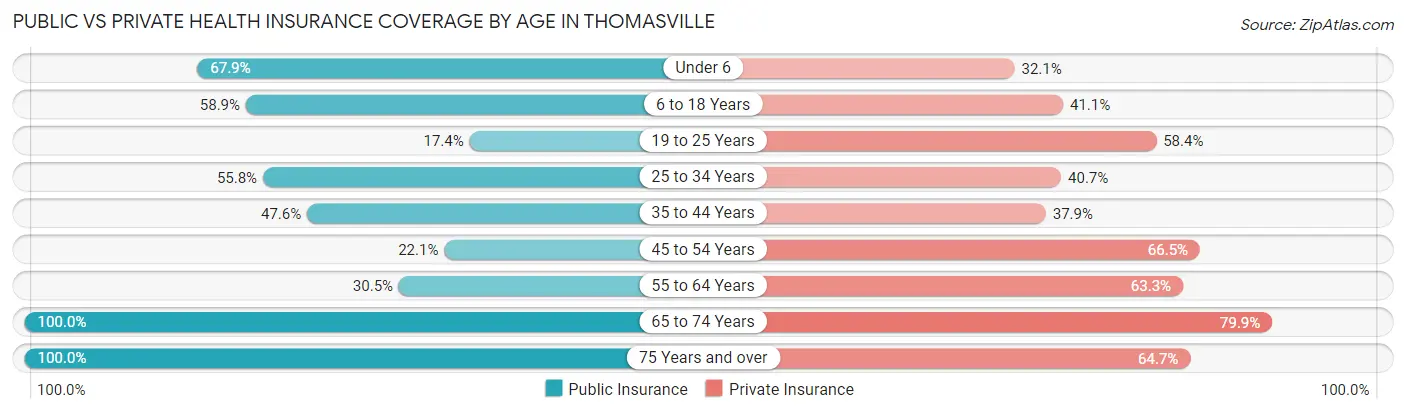
| Age Bracket | Public Insurance | Private Insurance |
| Under 6 | 125 (67.9%) | 59 (32.1%) |
| 6 to 18 Years | 495 (58.9%) | 345 (41.1%) |
| 19 to 25 Years | 51 (17.4%) | 171 (58.4%) |
| 25 to 34 Years | 237 (55.8%) | 173 (40.7%) |
| 35 to 44 Years | 98 (47.6%) | 78 (37.9%) |
| 45 to 54 Years | 176 (22.1%) | 529 (66.5%) |
| 55 to 64 Years | 94 (30.5%) | 195 (63.3%) |
| 65 to 74 Years | 303 (100.0%) | 242 (79.9%) |
| 75 Years and over | 198 (100.0%) | 128 (64.6%) |
| Total | 1,777 (50.0%) | 1,920 (54.0%) |
Disability Status by Sex by Age in Thomasville
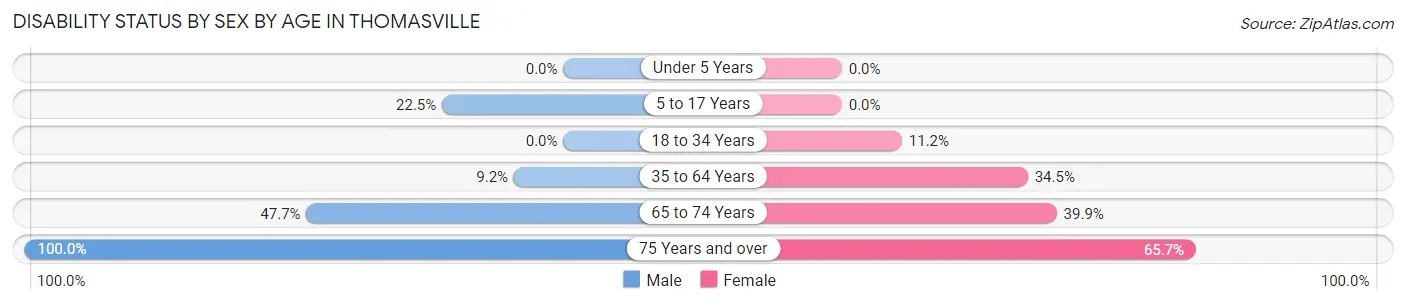
| Age Bracket | Male | Female |
| Under 5 Years | 0 (0.0%) | 0 (0.0%) |
| 5 to 17 Years | 108 (22.5%) | 0 (0.0%) |
| 18 to 34 Years | 0 (0.0%) | 60 (11.2%) |
| 35 to 64 Years | 50 (9.2%) | 264 (34.5%) |
| 65 to 74 Years | 62 (47.7%) | 69 (39.9%) |
| 75 Years and over | 55 (100.0%) | 94 (65.7%) |
Disability Class by Sex by Age in Thomasville
Disability Class: Hearing Difficulty
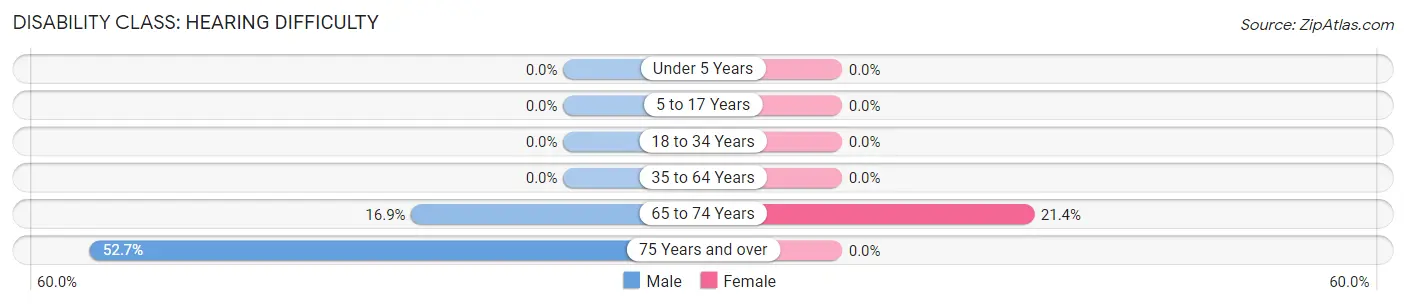
| Age Bracket | Male | Female |
| Under 5 Years | 0 (0.0%) | 0 (0.0%) |
| 5 to 17 Years | 0 (0.0%) | 0 (0.0%) |
| 18 to 34 Years | 0 (0.0%) | 0 (0.0%) |
| 35 to 64 Years | 0 (0.0%) | 0 (0.0%) |
| 65 to 74 Years | 22 (16.9%) | 37 (21.4%) |
| 75 Years and over | 29 (52.7%) | 0 (0.0%) |
Disability Class: Vision Difficulty
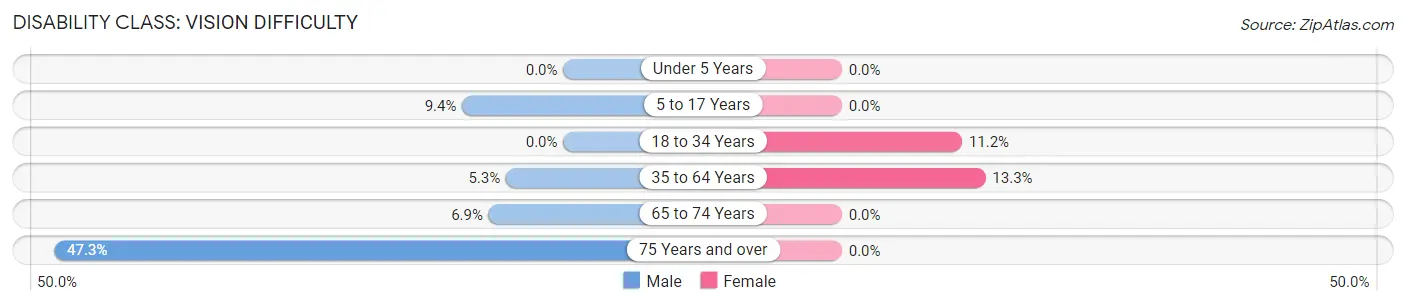
| Age Bracket | Male | Female |
| Under 5 Years | 0 (0.0%) | 0 (0.0%) |
| 5 to 17 Years | 45 (9.4%) | 0 (0.0%) |
| 18 to 34 Years | 0 (0.0%) | 60 (11.2%) |
| 35 to 64 Years | 29 (5.3%) | 102 (13.3%) |
| 65 to 74 Years | 9 (6.9%) | 0 (0.0%) |
| 75 Years and over | 26 (47.3%) | 0 (0.0%) |
Disability Class: Cognitive Difficulty
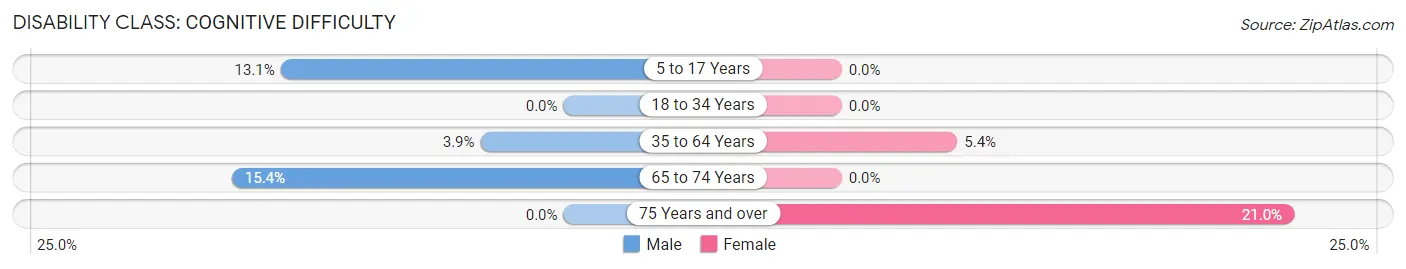
| Age Bracket | Male | Female |
| 5 to 17 Years | 63 (13.1%) | 0 (0.0%) |
| 18 to 34 Years | 0 (0.0%) | 0 (0.0%) |
| 35 to 64 Years | 21 (3.8%) | 41 (5.4%) |
| 65 to 74 Years | 20 (15.4%) | 0 (0.0%) |
| 75 Years and over | 0 (0.0%) | 30 (21.0%) |
Disability Class: Ambulatory Difficulty
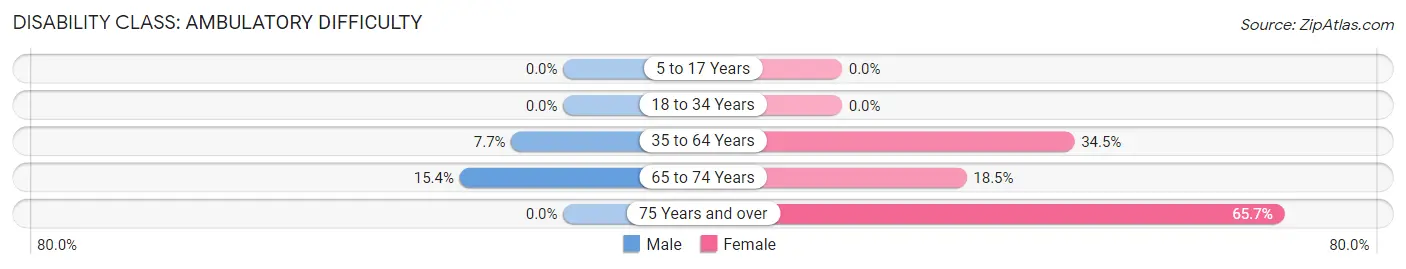
| Age Bracket | Male | Female |
| 5 to 17 Years | 0 (0.0%) | 0 (0.0%) |
| 18 to 34 Years | 0 (0.0%) | 0 (0.0%) |
| 35 to 64 Years | 42 (7.7%) | 264 (34.5%) |
| 65 to 74 Years | 20 (15.4%) | 32 (18.5%) |
| 75 Years and over | 0 (0.0%) | 94 (65.7%) |
Disability Class: Self-Care Difficulty
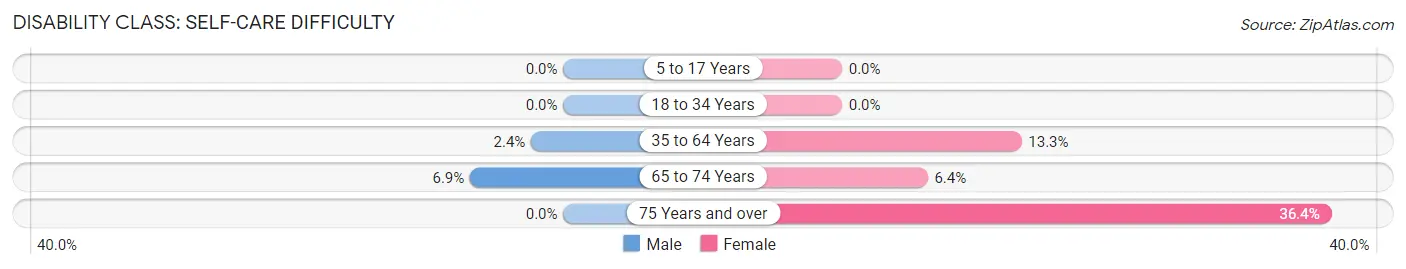
| Age Bracket | Male | Female |
| 5 to 17 Years | 0 (0.0%) | 0 (0.0%) |
| 18 to 34 Years | 0 (0.0%) | 0 (0.0%) |
| 35 to 64 Years | 13 (2.4%) | 102 (13.3%) |
| 65 to 74 Years | 9 (6.9%) | 11 (6.4%) |
| 75 Years and over | 0 (0.0%) | 52 (36.4%) |
Technology Access in Thomasville
Computing Device Access in Thomasville
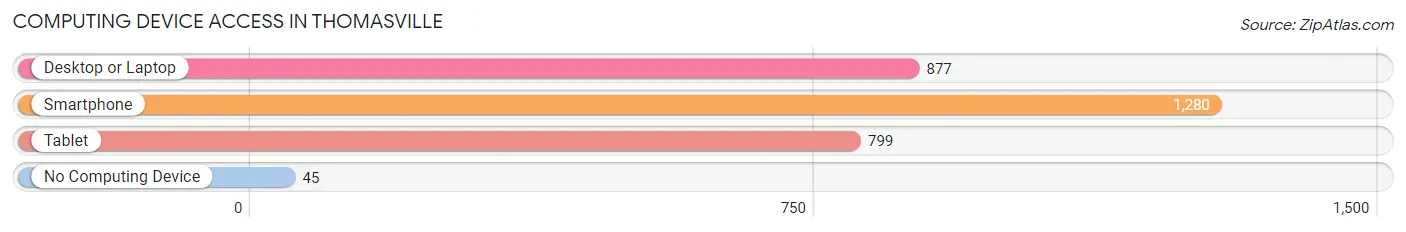
| Device Type | # Households | % Households |
| Desktop or Laptop | 877 | 64.2% |
| Smartphone | 1,280 | 93.8% |
| Tablet | 799 | 58.5% |
| No Computing Device | 45 | 3.3% |
| Total | 1,365 | 100.0% |
Internet Access in Thomasville
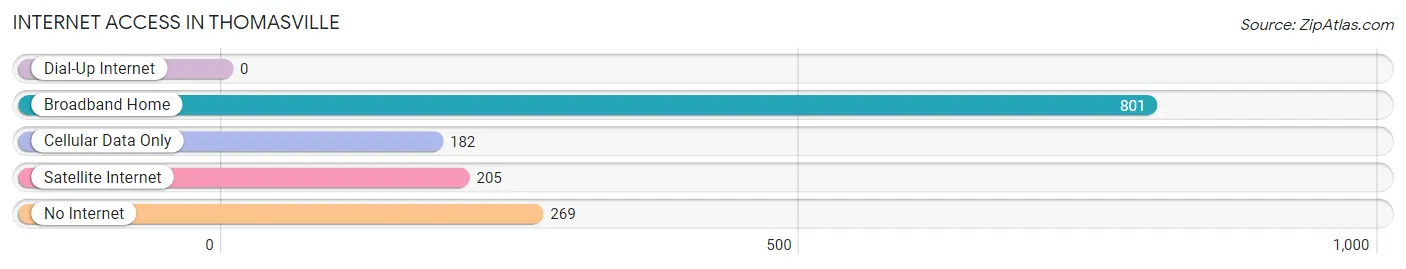
| Internet Type | # Households | % Households |
| Dial-Up Internet | 0 | 0.0% |
| Broadband Home | 801 | 58.7% |
| Cellular Data Only | 182 | 13.3% |
| Satellite Internet | 205 | 15.0% |
| No Internet | 269 | 19.7% |
| Total | 1,365 | 100.0% |
Thomasville Summary
Thomasville, Alabama is a small town located in Clarke County, Alabama. It is situated in the southwestern corner of the state, approximately 30 miles north of Mobile and 40 miles south of Montgomery. The town was founded in 1819 and is named after Thomasville, Georgia, which was named after Thomas Jefferson. The population of Thomasville was 2,845 at the 2010 census.
Geography
Thomasville is located at 31°51'25" North, 87°45'45" West (31.856944, -87.762500). It is situated in the southwestern corner of Clarke County, Alabama, approximately 30 miles north of Mobile and 40 miles south of Montgomery. The town is located on the banks of the Tombigbee River, which forms the border between Alabama and Mississippi. The town is surrounded by rolling hills and forests, and is home to several small lakes.
The climate in Thomasville is humid subtropical, with hot, humid summers and mild winters. The average annual temperature is around 68°F (20°C), with an average high of around 90°F (32°C) in the summer and an average low of around 40°F (4°C) in the winter. The average annual precipitation is around 50 inches (127 cm).
Economy
The economy of Thomasville is largely based on agriculture and forestry. The town is home to several large farms, as well as several small family-owned farms. The town is also home to several timber companies, which harvest timber from the surrounding forests.
The town is also home to several small businesses, including restaurants, retail stores, and service providers. The town is also home to several manufacturing companies, including a furniture factory and a paper mill.
Demographics
As of the 2010 census, the population of Thomasville was 2,845. The racial makeup of the town was 79.2% White, 18.2% African American, 0.3% Native American, 0.3% Asian, 0.1% Pacific Islander, 0.7% from other races, and 1.4% from two or more races. Hispanic or Latino of any race were 1.7% of the population.
The median income for a household in Thomasville was $30,938, and the median income for a family was $37,917. The per capita income for the town was $15,945. About 17.2% of families and 20.2% of the population were below the poverty line, including 28.3% of those under age 18 and 16.2% of those age 65 or over.
Education
Thomasville is served by the Clarke County School District. The town is home to two public schools: Thomasville High School and Thomasville Elementary School. The town is also home to several private schools, including Thomasville Christian Academy and Thomasville Academy.
Conclusion
Thomasville, Alabama is a small town located in Clarke County, Alabama. It is situated in the southwestern corner of the state, approximately 30 miles north of Mobile and 40 miles south of Montgomery. The town was founded in 1819 and is named after Thomasville, Georgia, which was named after Thomas Jefferson. The population of Thomasville was 2,845 at the 2010 census. The economy of Thomasville is largely based on agriculture and forestry, and the town is home to several small businesses, manufacturing companies, and private schools. The racial makeup of the town is 79.2% White, 18.2% African American, 0.3% Native American, 0.3% Asian, 0.1% Pacific Islander, 0.7% from other races, and 1.4% from two or more races. The median income for a household in Thomasville was $30,938, and the median income for a family was $37,917. The per capita income for the town was $15,945. About 17.2% of families and 20.2% of the population were below the poverty line. Thomasville is served by the Clarke County School District, and is home to two public schools and several private schools.
Common Questions
What is the Total Population of Thomasville?
Total Population of Thomasville is 3,656.
What is the Total Male Population of Thomasville?
Total Male Population of Thomasville is 1,519.
What is the Total Female Population of Thomasville?
Total Female Population of Thomasville is 2,137.
What is the Ratio of Males per 100 Females in Thomasville?
There are 71.08 Males per 100 Females in Thomasville.
What is the Ratio of Females per 100 Males in Thomasville?
There are 140.68 Females per 100 Males in Thomasville.
What is the Median Population Age in Thomasville?
Median Population Age in Thomasville is 37.9 Years.
What is the Average Family Size in Thomasville
Average Family Size in Thomasville is 4.0 People.
What is the Average Household Size in Thomasville
Average Household Size in Thomasville is 2.6 People.
What is Per Capita Income in Thomasville?
Per Capita income in Thomasville is $25,678.
What is the Median Family Income in Thomasville?
Median Family Income in Thomasville is $54,692.
What is the Median Household income in Thomasville?
Median Household Income in Thomasville is $45,429.
What is Income or Wage Gap in Thomasville?
Income or Wage Gap in Thomasville is 36.6%.
Women in Thomasville earn 63.4 cents for every dollar earned by a man.
What is Inequality or Gini Index in Thomasville?
Inequality or Gini Index in Thomasville is 0.50.
How Large is the Labor Force in Thomasville?
There are 1,423 People in the Labor Forcein in Thomasville.
What is the Percentage of People in the Labor Force in Thomasville?
50.2% of People are in the Labor Force in Thomasville.
What is the Unemployment Rate in Thomasville?
Unemployment Rate in Thomasville is 9.8%.