Shiloh, AL
Shiloh Map
Shiloh Overview
422
TOTAL POPULATION
177
MALE POPULATION
245
FEMALE POPULATION
72.24
MALES / 100 FEMALES
138.42
FEMALES / 100 MALES
38.2
MEDIAN AGE
3.1
AVG FAMILY SIZE
2.7
AVG HOUSEHOLD SIZE
$22,561
PER CAPITA INCOME
$72,917
AVG FAMILY INCOME
$59,375
AVG HOUSEHOLD INCOME
0.35
INEQUALITY / GINI INDEX
148
LABOR FORCE [ PEOPLE ]
46.4%
PERCENT IN LABOR FORCE
1.4%
UNEMPLOYMENT RATE
Shiloh Area Codes
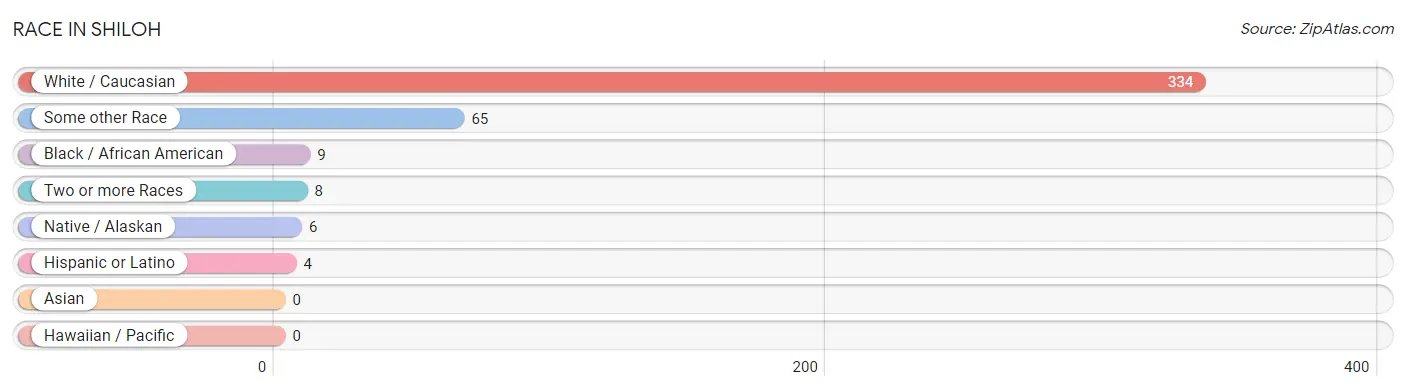
Race in Shiloh
The most populous races in Shiloh are White / Caucasian (334 | 79.1%), Some other Race (65 | 15.4%), and Black / African American (9 | 2.1%).
| Race | # Population | % Population |
| Asian | 0 | 0.0% |
| Black / African American | 9 | 2.1% |
| Hawaiian / Pacific | 0 | 0.0% |
| Hispanic or Latino | 4 | 0.9% |
| Native / Alaskan | 6 | 1.4% |
| White / Caucasian | 334 | 79.1% |
| Two or more Races | 8 | 1.9% |
| Some other Race | 65 | 15.4% |
| Total | 422 | 100.0% |
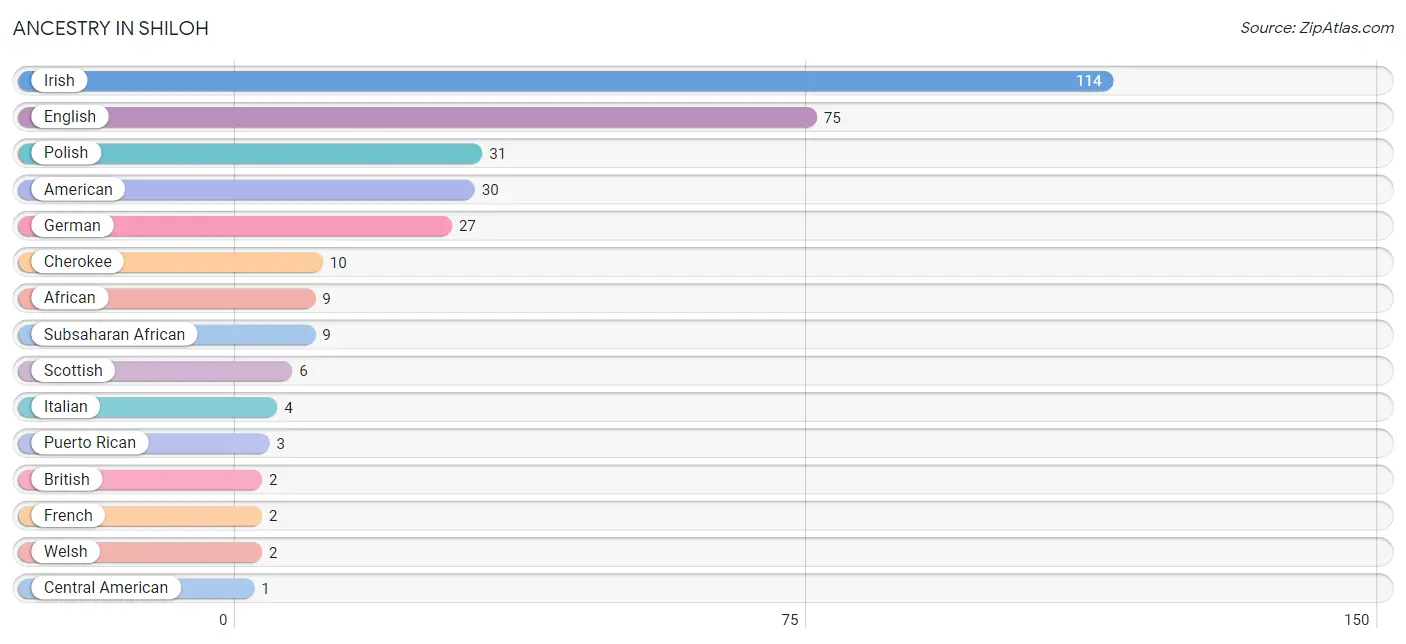
Ancestry in Shiloh
The most populous ancestries reported in Shiloh are Irish (114 | 27.0%), English (75 | 17.8%), Polish (31 | 7.3%), American (30 | 7.1%), and German (27 | 6.4%), together accounting for 65.6% of all Shiloh residents.
| Ancestry | # Population | % Population |
| African | 9 | 2.1% |
| American | 30 | 7.1% |
| British | 2 | 0.5% |
| Central American | 1 | 0.2% |
| Cherokee | 10 | 2.4% |
| English | 75 | 17.8% |
| French | 2 | 0.5% |
| German | 27 | 6.4% |
| Honduran | 1 | 0.2% |
| Irish | 114 | 27.0% |
| Italian | 4 | 0.9% |
| Norwegian | 1 | 0.2% |
| Polish | 31 | 7.3% |
| Puerto Rican | 3 | 0.7% |
| Scottish | 6 | 1.4% |
| Subsaharan African | 9 | 2.1% |
| Welsh | 2 | 0.5% | View All 17 Rows |
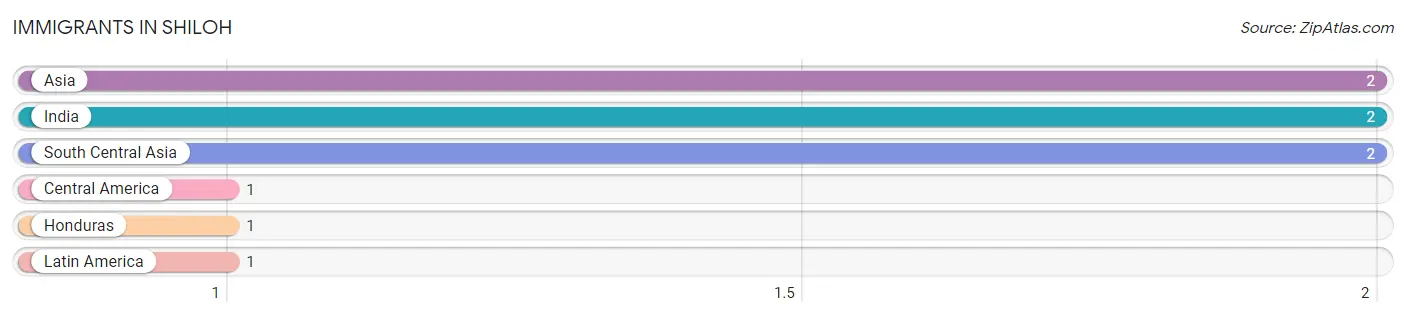
Immigrants in Shiloh
The most numerous immigrant groups reported in Shiloh came from Asia (2 | 0.5%), India (2 | 0.5%), South Central Asia (2 | 0.5%), Central America (1 | 0.2%), and Honduras (1 | 0.2%), together accounting for 1.9% of all Shiloh residents.
| Immigration Origin | # Population | % Population |
| Asia | 2 | 0.5% |
| Central America | 1 | 0.2% |
| Honduras | 1 | 0.2% |
| India | 2 | 0.5% |
| Latin America | 1 | 0.2% |
| South Central Asia | 2 | 0.5% | View All 6 Rows |
Sex and Age in Shiloh
Sex and Age in Shiloh
The most populous age groups in Shiloh are Under 5 Years (33 | 18.6%) for men and 50 to 54 Years (63 | 25.7%) for women.
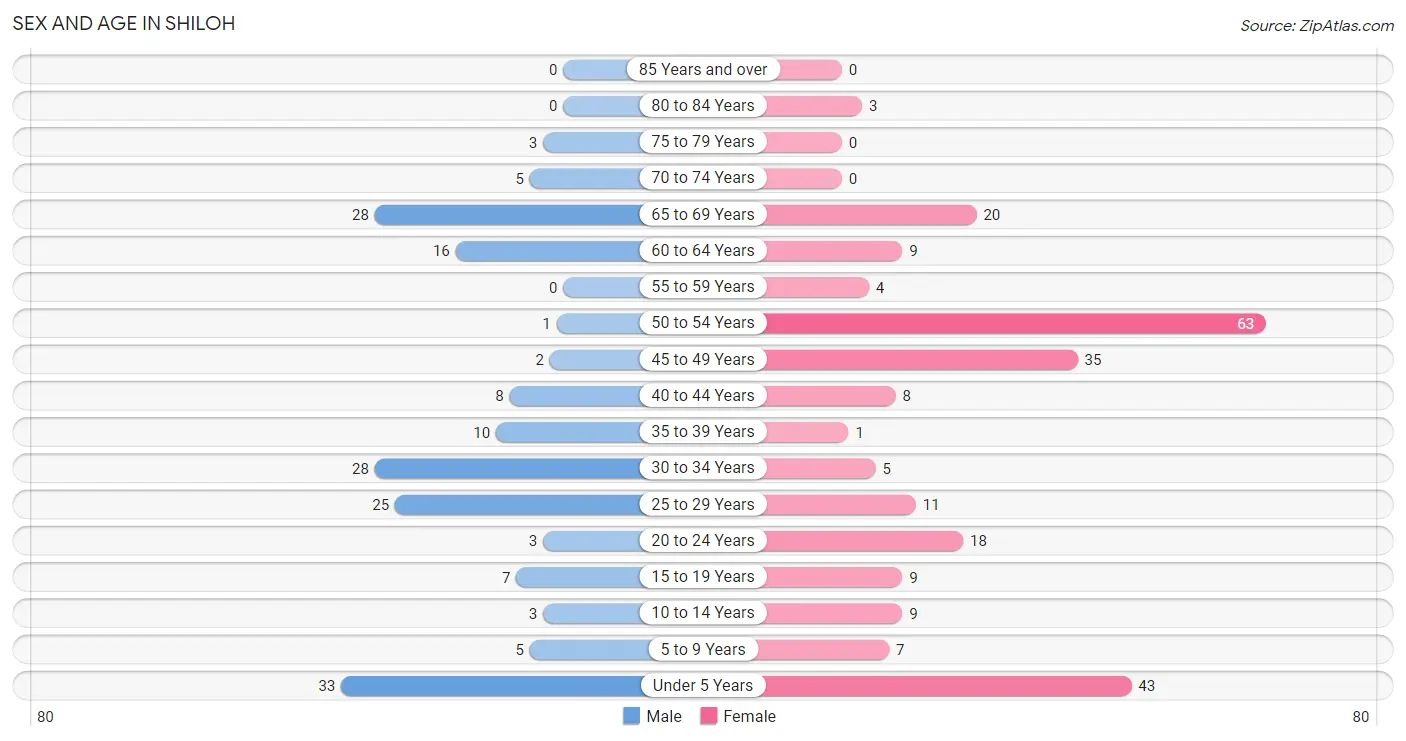
| Age Bracket | Male | Female |
| Under 5 Years | 33 (18.6%) | 43 (17.5%) |
| 5 to 9 Years | 5 (2.8%) | 7 (2.9%) |
| 10 to 14 Years | 3 (1.7%) | 9 (3.7%) |
| 15 to 19 Years | 7 (4.0%) | 9 (3.7%) |
| 20 to 24 Years | 3 (1.7%) | 18 (7.3%) |
| 25 to 29 Years | 25 (14.1%) | 11 (4.5%) |
| 30 to 34 Years | 28 (15.8%) | 5 (2.0%) |
| 35 to 39 Years | 10 (5.7%) | 1 (0.4%) |
| 40 to 44 Years | 8 (4.5%) | 8 (3.3%) |
| 45 to 49 Years | 2 (1.1%) | 35 (14.3%) |
| 50 to 54 Years | 1 (0.6%) | 63 (25.7%) |
| 55 to 59 Years | 0 (0.0%) | 4 (1.6%) |
| 60 to 64 Years | 16 (9.0%) | 9 (3.7%) |
| 65 to 69 Years | 28 (15.8%) | 20 (8.2%) |
| 70 to 74 Years | 5 (2.8%) | 0 (0.0%) |
| 75 to 79 Years | 3 (1.7%) | 0 (0.0%) |
| 80 to 84 Years | 0 (0.0%) | 3 (1.2%) |
| 85 Years and over | 0 (0.0%) | 0 (0.0%) |
| Total | 177 (100.0%) | 245 (100.0%) |
Families and Households in Shiloh
Median Family Size in Shiloh
The median family size in Shiloh is 3.12 persons per family, with single male/father families (5 | 4.3%) accounting for the largest median family size of 4.2 persons per family. On the other hand, single female/mother families (23 | 19.7%) represent the smallest median family size with 2.65 persons per family.
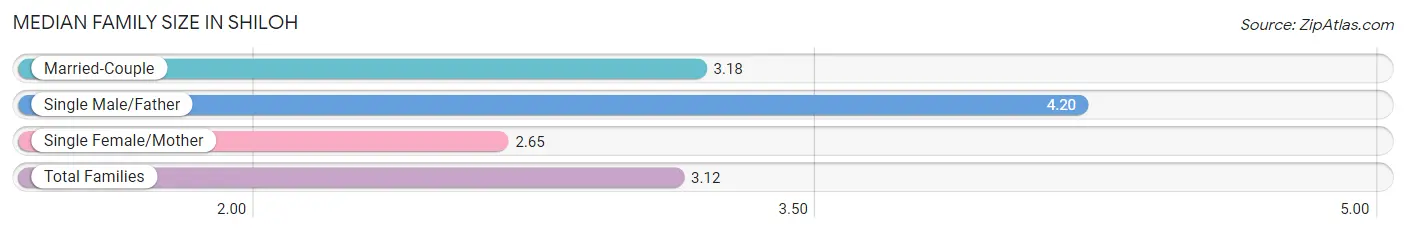
| Family Type | # Families | Family Size |
| Married-Couple | 89 (76.1%) | 3.18 |
| Single Male/Father | 5 (4.3%) | 4.20 |
| Single Female/Mother | 23 (19.7%) | 2.65 |
| Total Families | 117 (100.0%) | 3.12 |
Median Household Size in Shiloh
The median household size in Shiloh is 2.71 persons per household, with single male/father households (5 | 3.2%) accounting for the largest median household size of 4.2 persons per household. non-family households (39 | 25.0%) represent the smallest median household size with 1.44 persons per household.
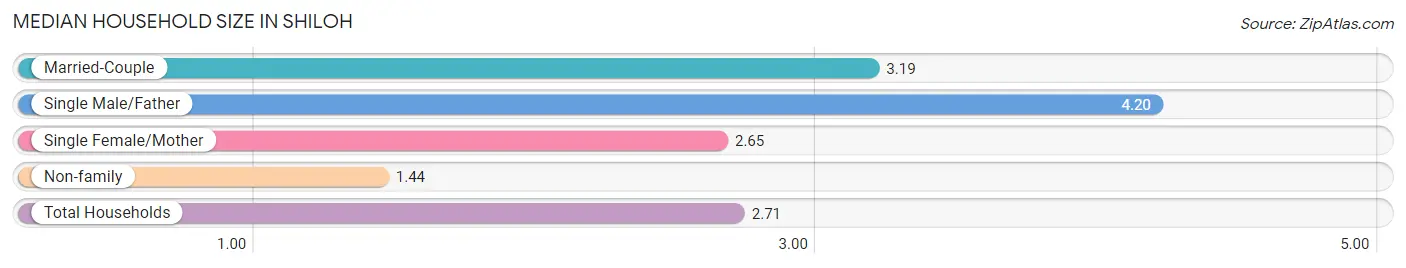
| Household Type | # Households | Household Size |
| Married-Couple | 89 (57.1%) | 3.19 |
| Single Male/Father | 5 (3.2%) | 4.20 |
| Single Female/Mother | 23 (14.7%) | 2.65 |
| Non-family | 39 (25.0%) | 1.44 |
| Total Households | 156 (100.0%) | 2.71 |
Household Size by Marriage Status in Shiloh
Out of a total of 156 households in Shiloh, 117 (75.0%) are family households, while 39 (25.0%) are nonfamily households. The most numerous type of family households are 2-person households, comprising 55, and the most common type of nonfamily households are 1-person households, comprising 27.
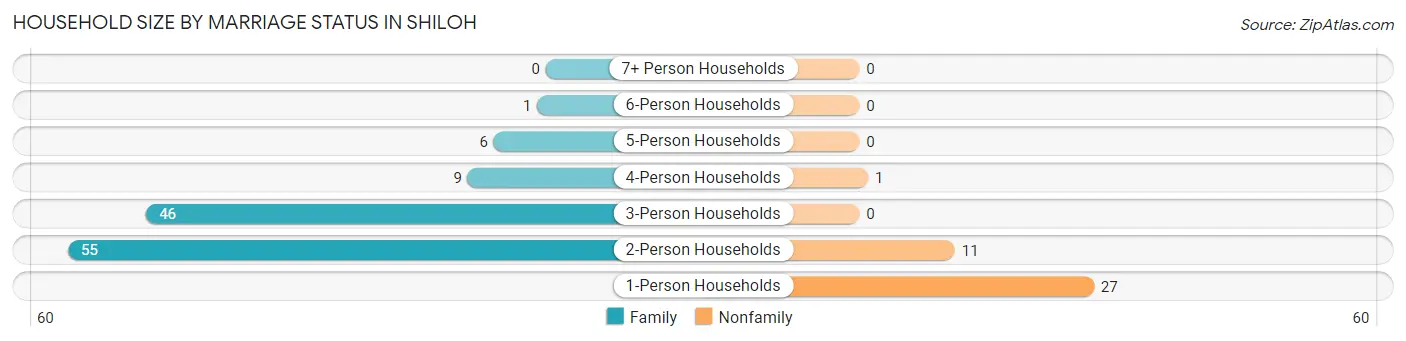
| Household Size | Family Households | Nonfamily Households |
| 1-Person Households | - | 27 (17.3%) |
| 2-Person Households | 55 (35.3%) | 11 (7.0%) |
| 3-Person Households | 46 (29.5%) | 0 (0.0%) |
| 4-Person Households | 9 (5.8%) | 1 (0.6%) |
| 5-Person Households | 6 (3.8%) | 0 (0.0%) |
| 6-Person Households | 1 (0.6%) | 0 (0.0%) |
| 7+ Person Households | 0 (0.0%) | 0 (0.0%) |
| Total | 117 (75.0%) | 39 (25.0%) |
Female Fertility in Shiloh
Fertility by Age in Shiloh
Average fertility rate in Shiloh is 31.0 births per 1,000 women. Women in the age bracket of 20 to 34 years have the highest fertility rate with 118.0 births per 1,000 women. Women in the age bracket of 20 to 34 years acount for 100.0% of all women with births.
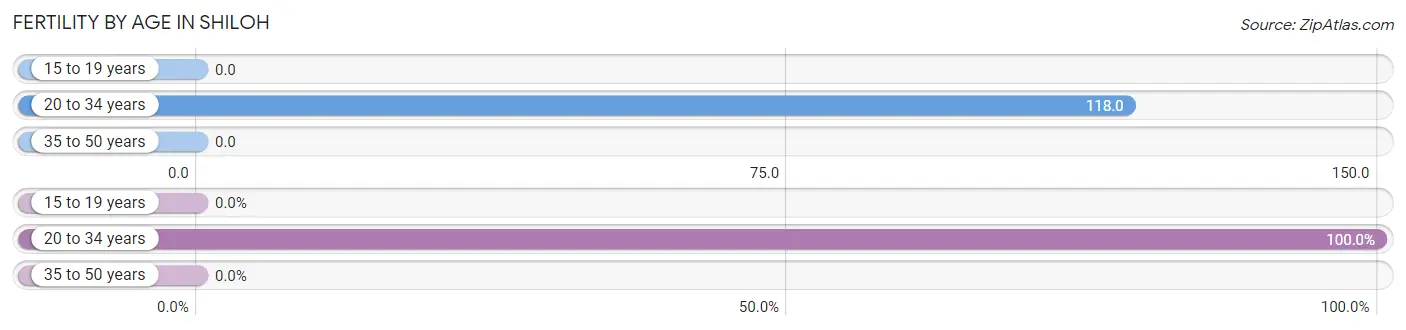
| Age Bracket | Women with Births | Births / 1,000 Women |
| 15 to 19 years | 0 (0.0%) | 0.0 |
| 20 to 34 years | 4 (100.0%) | 118.0 |
| 35 to 50 years | 0 (0.0%) | 0.0 |
| Total | 4 (100.0%) | 31.0 |
Fertility by Age by Marriage Status in Shiloh
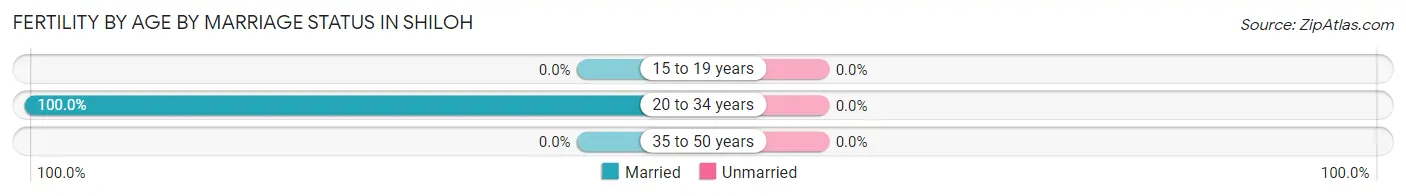
| Age Bracket | Married | Unmarried |
| 15 to 19 years | 0 (0.0%) | 0 (0.0%) |
| 20 to 34 years | 4 (100.0%) | 0 (0.0%) |
| 35 to 50 years | 0 (0.0%) | 0 (0.0%) |
| Total | 4 (100.0%) | 0 (0.0%) |
Fertility by Education in Shiloh
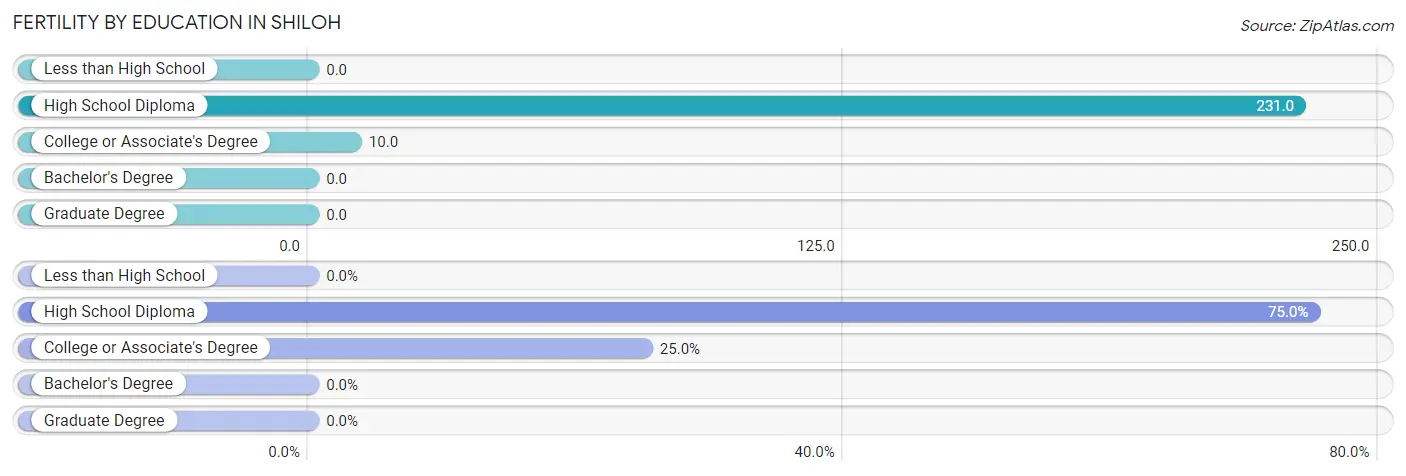
| Educational Attainment | Women with Births | Births / 1,000 Women |
| Less than High School | 0 (0.0%) | 0.0 |
| High School Diploma | 3 (75.0%) | 231.0 |
| College or Associate's Degree | 1 (25.0%) | 10.0 |
| Bachelor's Degree | 0 (0.0%) | 0.0 |
| Graduate Degree | 0 (0.0%) | 0.0 |
| Total | 4 (100.0%) | 31.0 |
Fertility by Education by Marriage Status in Shiloh
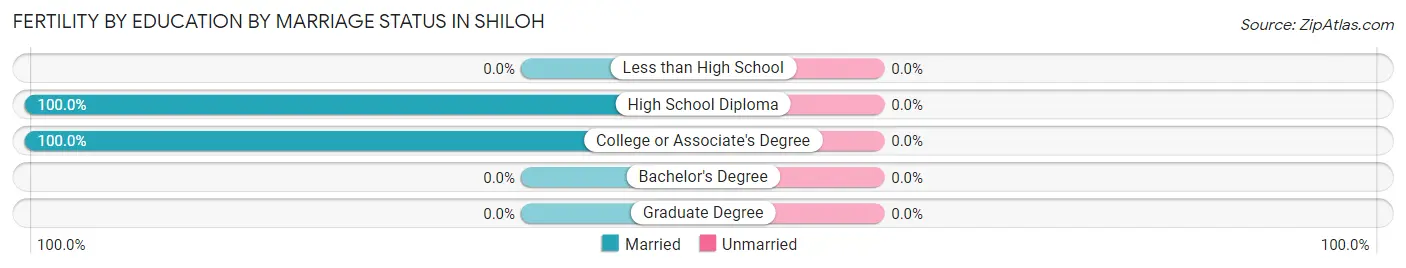
| Educational Attainment | Married | Unmarried |
| Less than High School | 0 (0.0%) | 0 (0.0%) |
| High School Diploma | 3 (100.0%) | 0 (0.0%) |
| College or Associate's Degree | 1 (100.0%) | 0 (0.0%) |
| Bachelor's Degree | 0 (0.0%) | 0 (0.0%) |
| Graduate Degree | 0 (0.0%) | 0 (0.0%) |
| Total | 4 (100.0%) | 0 (0.0%) |
Income in Shiloh
Income Overview in Shiloh
Per Capita Income in Shiloh is $22,561, while median incomes of families and households are $72,917 and $59,375 respectively.
| Characteristic | Number | Measure |
| Per Capita Income | 422 | $22,561 |
| Median Family Income | 117 | $72,917 |
| Mean Family Income | 117 | $65,353 |
| Median Household Income | 156 | $59,375 |
| Mean Household Income | 156 | $58,652 |
| Income Deficit | 117 | $0 |
| Wage / Income Gap (%) | 422 | 0.00% |
| Wage / Income Gap ($) | 422 | 100.00¢ per $1 |
| Gini / Inequality Index | 422 | 0.35 |
Earnings by Sex in Shiloh
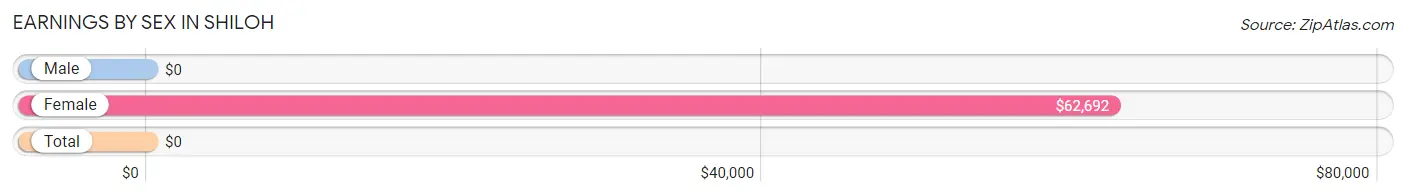
| Sex | Number | Average Earnings |
| Male | 73 (47.1%) | $0 |
| Female | 82 (52.9%) | $62,692 |
| Total | 155 (100.0%) | $0 |
Earnings by Sex by Income Bracket in Shiloh
The most common earnings brackets in Shiloh are $7,500 to $9,999 for men (26 | 35.6%) and $55,000 to $64,999 for women (41 | 50.0%).
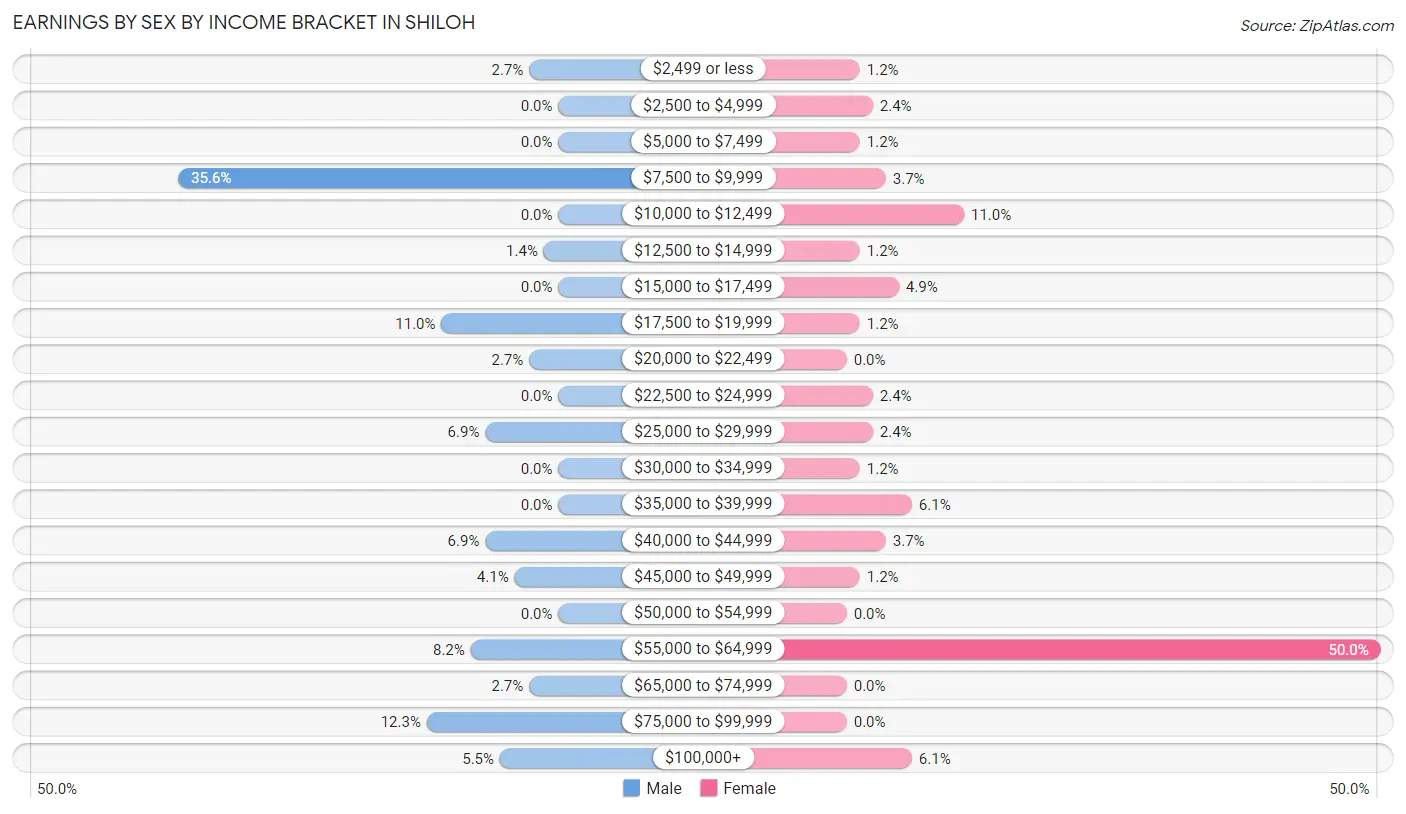
| Income | Male | Female |
| $2,499 or less | 2 (2.7%) | 1 (1.2%) |
| $2,500 to $4,999 | 0 (0.0%) | 2 (2.4%) |
| $5,000 to $7,499 | 0 (0.0%) | 1 (1.2%) |
| $7,500 to $9,999 | 26 (35.6%) | 3 (3.7%) |
| $10,000 to $12,499 | 0 (0.0%) | 9 (11.0%) |
| $12,500 to $14,999 | 1 (1.4%) | 1 (1.2%) |
| $15,000 to $17,499 | 0 (0.0%) | 4 (4.9%) |
| $17,500 to $19,999 | 8 (11.0%) | 1 (1.2%) |
| $20,000 to $22,499 | 2 (2.7%) | 0 (0.0%) |
| $22,500 to $24,999 | 0 (0.0%) | 2 (2.4%) |
| $25,000 to $29,999 | 5 (6.9%) | 2 (2.4%) |
| $30,000 to $34,999 | 0 (0.0%) | 1 (1.2%) |
| $35,000 to $39,999 | 0 (0.0%) | 5 (6.1%) |
| $40,000 to $44,999 | 5 (6.9%) | 3 (3.7%) |
| $45,000 to $49,999 | 3 (4.1%) | 1 (1.2%) |
| $50,000 to $54,999 | 0 (0.0%) | 0 (0.0%) |
| $55,000 to $64,999 | 6 (8.2%) | 41 (50.0%) |
| $65,000 to $74,999 | 2 (2.7%) | 0 (0.0%) |
| $75,000 to $99,999 | 9 (12.3%) | 0 (0.0%) |
| $100,000+ | 4 (5.5%) | 5 (6.1%) |
| Total | 73 (100.0%) | 82 (100.0%) |
Earnings by Sex by Educational Attainment in Shiloh
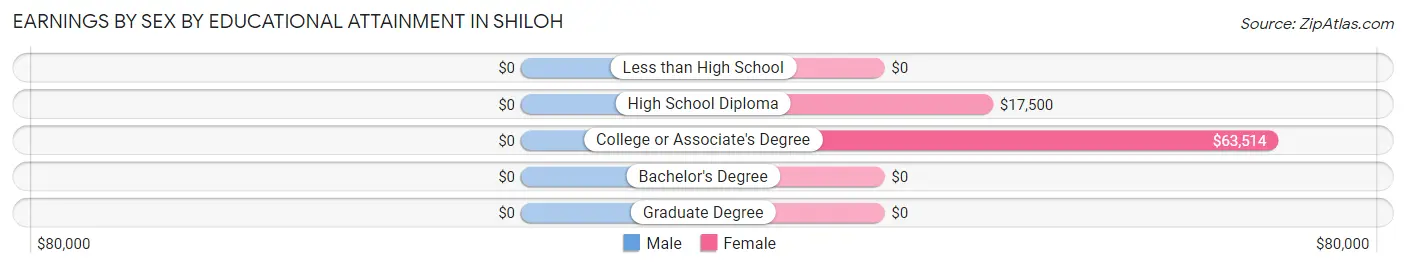
| Educational Attainment | Male Income | Female Income |
| Less than High School | - | - |
| High School Diploma | - | - |
| College or Associate's Degree | - | - |
| Bachelor's Degree | - | - |
| Graduate Degree | - | - |
| Total | - | - |
Family Income in Shiloh
Family Income Brackets in Shiloh
According to the Shiloh family income data, there are 42 families falling into the $75,000 to $99,999 income range, which is the most common income bracket and makes up 35.9% of all families. Conversely, the $15,000 to $24,999 income bracket is the least frequent group with only 2 families (1.7%) belonging to this category.
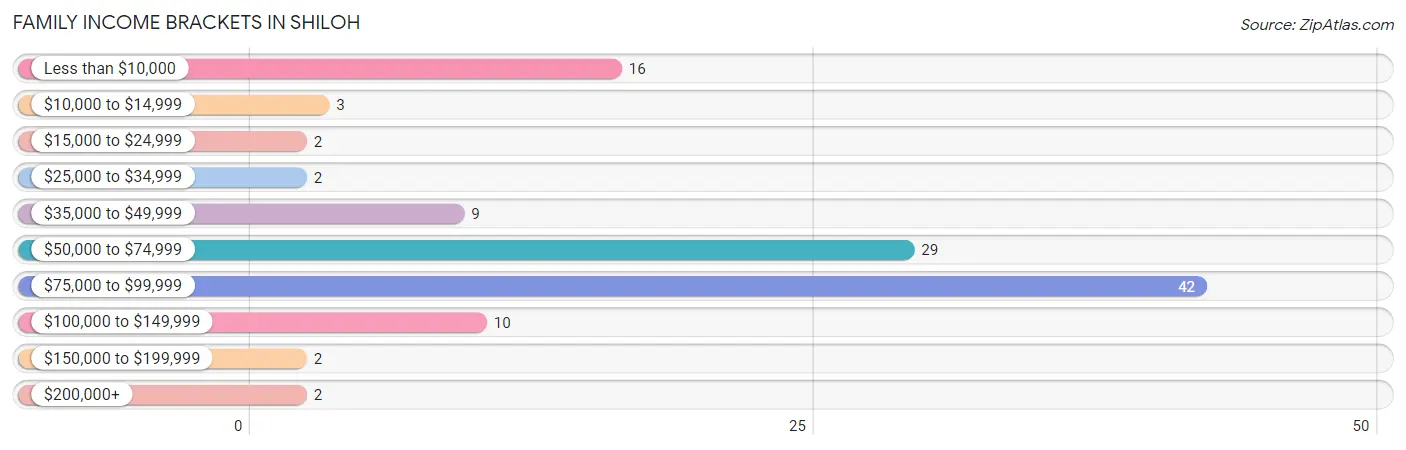
| Income Bracket | # Families | % Families |
| Less than $10,000 | 16 | 13.7% |
| $10,000 to $14,999 | 3 | 2.6% |
| $15,000 to $24,999 | 2 | 1.7% |
| $25,000 to $34,999 | 2 | 1.7% |
| $35,000 to $49,999 | 9 | 7.7% |
| $50,000 to $74,999 | 29 | 24.8% |
| $75,000 to $99,999 | 42 | 35.9% |
| $100,000 to $149,999 | 10 | 8.5% |
| $150,000 to $199,999 | 2 | 1.7% |
| $200,000+ | 2 | 1.7% |
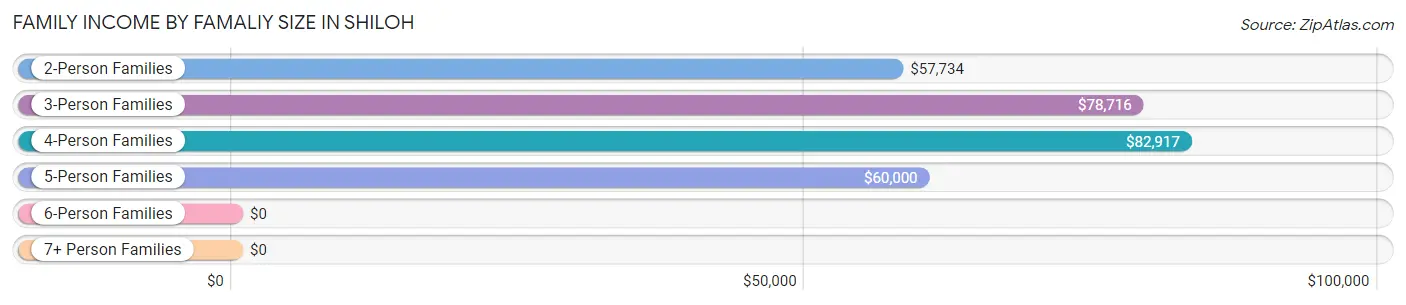
Family Income by Famaliy Size in Shiloh
4-person families (9 | 7.7%) account for the highest median family income in Shiloh with $82,917 per family, while 2-person families (57 | 48.7%) have the highest median income of $28,867 per family member.
| Income Bracket | # Families | Median Income |
| 2-Person Families | 57 (48.7%) | $57,734 |
| 3-Person Families | 44 (37.6%) | $78,716 |
| 4-Person Families | 9 (7.7%) | $82,917 |
| 5-Person Families | 6 (5.1%) | $60,000 |
| 6-Person Families | 1 (0.9%) | $0 |
| 7+ Person Families | 0 (0.0%) | $0 |
| Total | 117 (100.0%) | $72,917 |
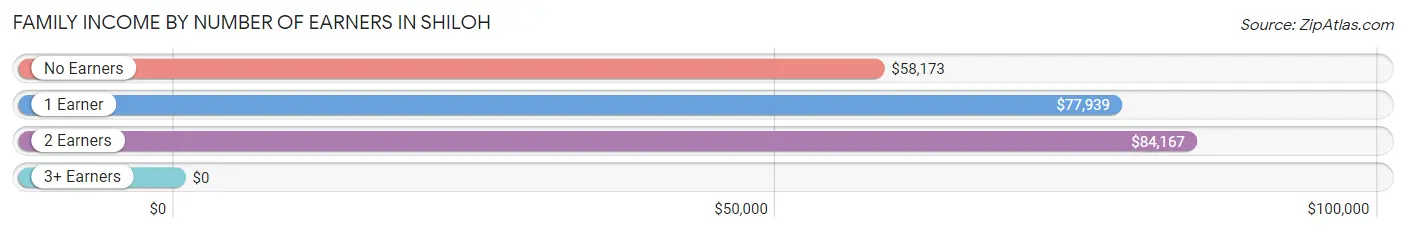
Family Income by Number of Earners in Shiloh
| Number of Earners | # Families | Median Income |
| No Earners | 25 (21.4%) | $58,173 |
| 1 Earner | 71 (60.7%) | $77,939 |
| 2 Earners | 18 (15.4%) | $84,167 |
| 3+ Earners | 3 (2.6%) | $0 |
| Total | 117 (100.0%) | $72,917 |
Household Income in Shiloh
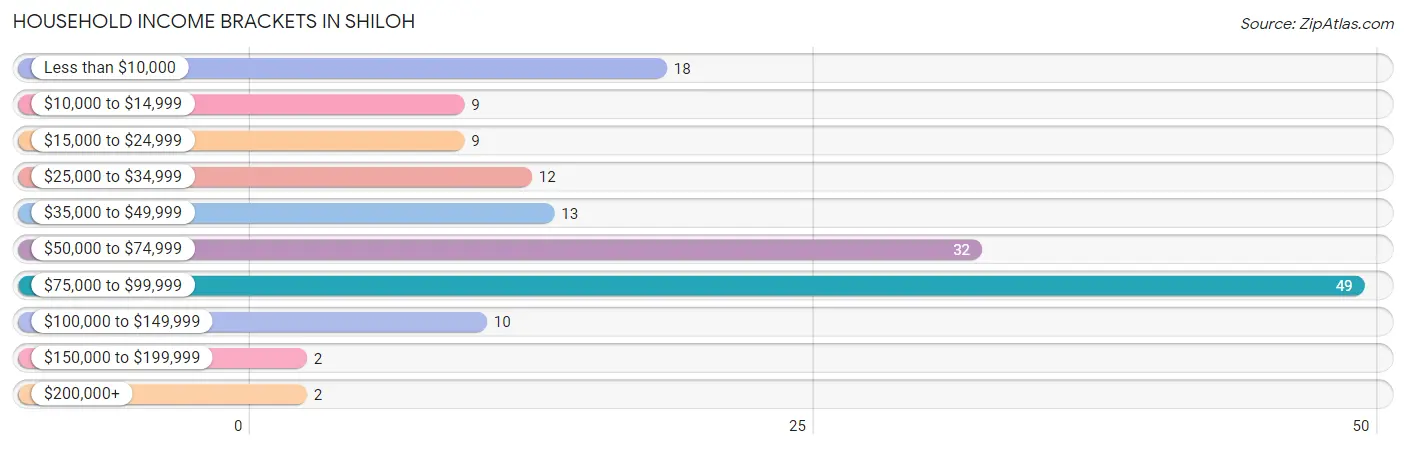
Household Income Brackets in Shiloh
With 49 households falling in the category, the $75,000 to $99,999 income range is the most frequent in Shiloh, accounting for 31.4% of all households. In contrast, only 2 households (1.3%) fall into the $150,000 to $199,999 income bracket, making it the least populous group.
| Income Bracket | # Households | % Households |
| Less than $10,000 | 18 | 11.5% |
| $10,000 to $14,999 | 9 | 5.8% |
| $15,000 to $24,999 | 9 | 5.8% |
| $25,000 to $34,999 | 12 | 7.7% |
| $35,000 to $49,999 | 13 | 8.3% |
| $50,000 to $74,999 | 32 | 20.5% |
| $75,000 to $99,999 | 49 | 31.4% |
| $100,000 to $149,999 | 10 | 6.4% |
| $150,000 to $199,999 | 2 | 1.3% |
| $200,000+ | 2 | 1.3% |
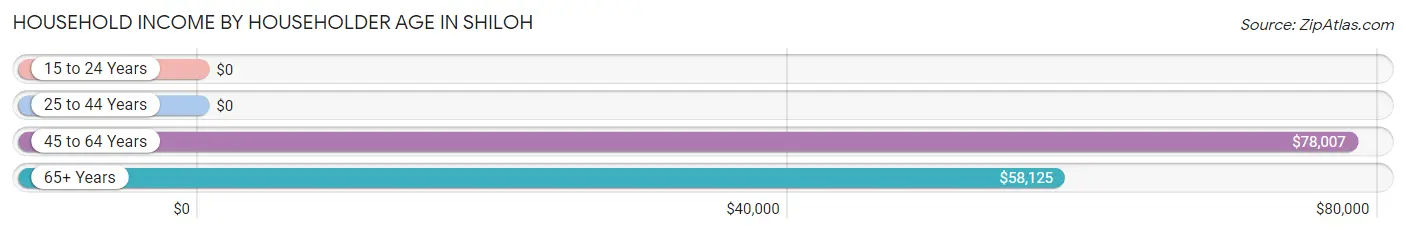
Household Income by Householder Age in Shiloh
The median household income in Shiloh is $59,375, with the highest median household income of $78,007 found in the 45 to 64 years age bracket for the primary householder. A total of 75 households (48.1%) fall into this category. Meanwhile, the 15 to 24 years age bracket for the primary householder has the lowest median household income of $0, with 6 households (3.8%) in this group.
| Income Bracket | # Households | Median Income |
| 15 to 24 Years | 6 (3.8%) | $0 |
| 25 to 44 Years | 39 (25.0%) | $0 |
| 45 to 64 Years | 75 (48.1%) | $78,007 |
| 65+ Years | 36 (23.1%) | $58,125 |
| Total | 156 (100.0%) | $59,375 |
Poverty in Shiloh
Income Below Poverty by Sex and Age in Shiloh
With 18.6% poverty level for males and 17.3% for females among the residents of Shiloh, 12 to 14 year old males and 18 to 24 year old females are the most vulnerable to poverty, with 3 males (100.0%) and 12 females (66.7%) in their respective age groups living below the poverty level.
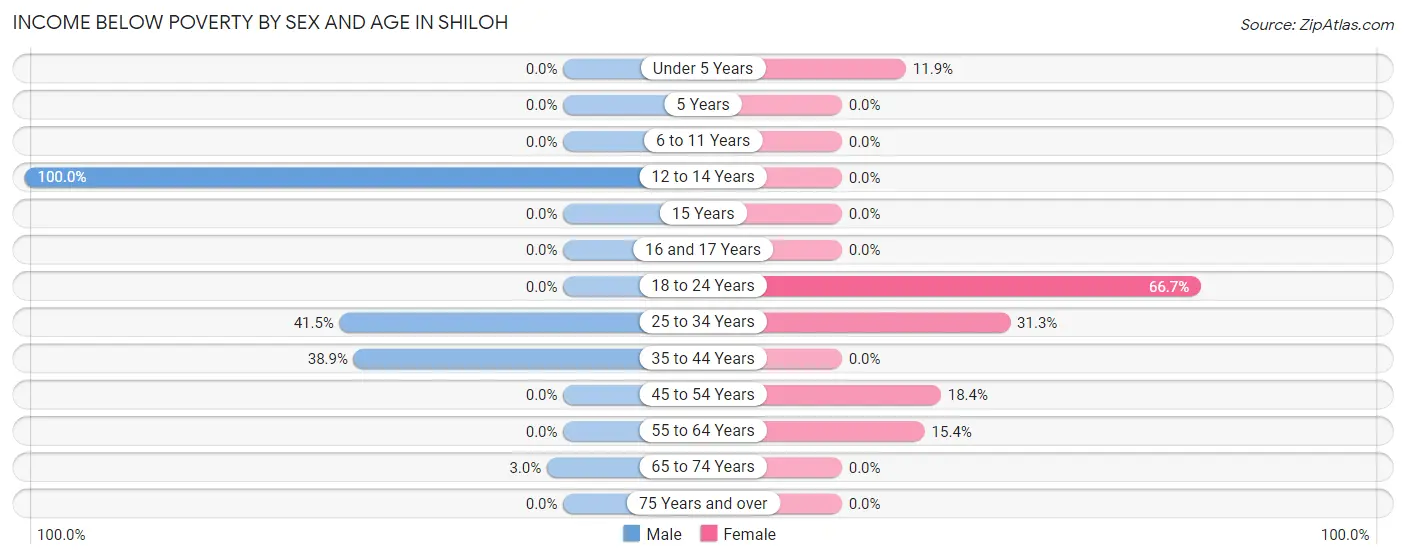
| Age Bracket | Male | Female |
| Under 5 Years | 0 (0.0%) | 5 (11.9%) |
| 5 Years | 0 (0.0%) | 0 (0.0%) |
| 6 to 11 Years | 0 (0.0%) | 0 (0.0%) |
| 12 to 14 Years | 3 (100.0%) | 0 (0.0%) |
| 15 Years | 0 (0.0%) | 0 (0.0%) |
| 16 and 17 Years | 0 (0.0%) | 0 (0.0%) |
| 18 to 24 Years | 0 (0.0%) | 12 (66.7%) |
| 25 to 34 Years | 22 (41.5%) | 5 (31.2%) |
| 35 to 44 Years | 7 (38.9%) | 0 (0.0%) |
| 45 to 54 Years | 0 (0.0%) | 18 (18.4%) |
| 55 to 64 Years | 0 (0.0%) | 2 (15.4%) |
| 65 to 74 Years | 1 (3.0%) | 0 (0.0%) |
| 75 Years and over | 0 (0.0%) | 0 (0.0%) |
| Total | 33 (18.6%) | 42 (17.3%) |
Income Above Poverty by Sex and Age in Shiloh
According to the poverty statistics in Shiloh, males aged under 5 years and females aged 5 years are the age groups that are most secure financially, with 100.0% of males and 100.0% of females in these age groups living above the poverty line.
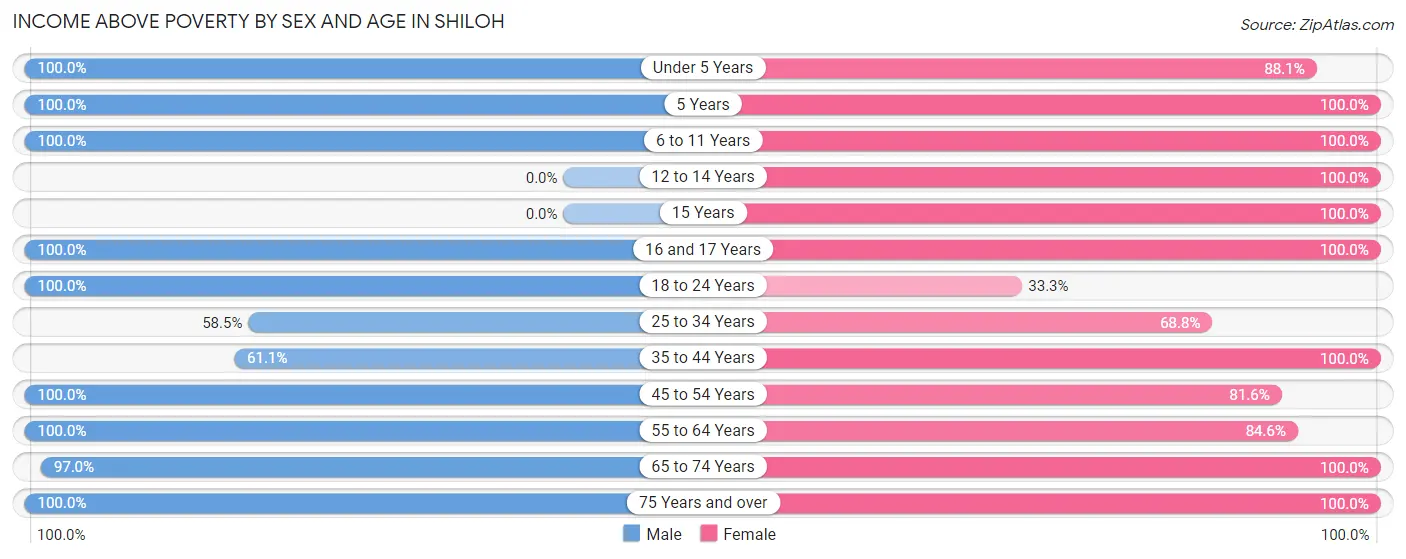
| Age Bracket | Male | Female |
| Under 5 Years | 33 (100.0%) | 37 (88.1%) |
| 5 Years | 4 (100.0%) | 3 (100.0%) |
| 6 to 11 Years | 1 (100.0%) | 10 (100.0%) |
| 12 to 14 Years | 0 (0.0%) | 2 (100.0%) |
| 15 Years | 0 (0.0%) | 3 (100.0%) |
| 16 and 17 Years | 1 (100.0%) | 6 (100.0%) |
| 18 to 24 Years | 9 (100.0%) | 6 (33.3%) |
| 25 to 34 Years | 31 (58.5%) | 11 (68.8%) |
| 35 to 44 Years | 11 (61.1%) | 9 (100.0%) |
| 45 to 54 Years | 3 (100.0%) | 80 (81.6%) |
| 55 to 64 Years | 16 (100.0%) | 11 (84.6%) |
| 65 to 74 Years | 32 (97.0%) | 20 (100.0%) |
| 75 Years and over | 3 (100.0%) | 3 (100.0%) |
| Total | 144 (81.4%) | 201 (82.7%) |
Income Below Poverty Among Married-Couple Families in Shiloh
The poverty statistics for married-couple families in Shiloh show that 6.7% or 6 of the total 89 families live below the poverty line. Families with 1 or 2 children have the highest poverty rate of 25.0%, comprising of 3 families. On the other hand, families with 3 or 4 children have the lowest poverty rate of 0.0%, which includes 0 families.
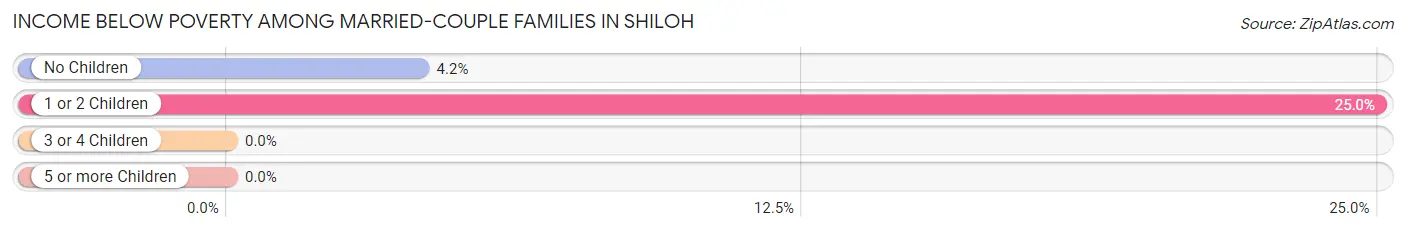
| Children | Above Poverty | Below Poverty |
| No Children | 69 (95.8%) | 3 (4.2%) |
| 1 or 2 Children | 9 (75.0%) | 3 (25.0%) |
| 3 or 4 Children | 5 (100.0%) | 0 (0.0%) |
| 5 or more Children | 0 (0.0%) | 0 (0.0%) |
| Total | 83 (93.3%) | 6 (6.7%) |
Income Below Poverty Among Single-Parent Households in Shiloh
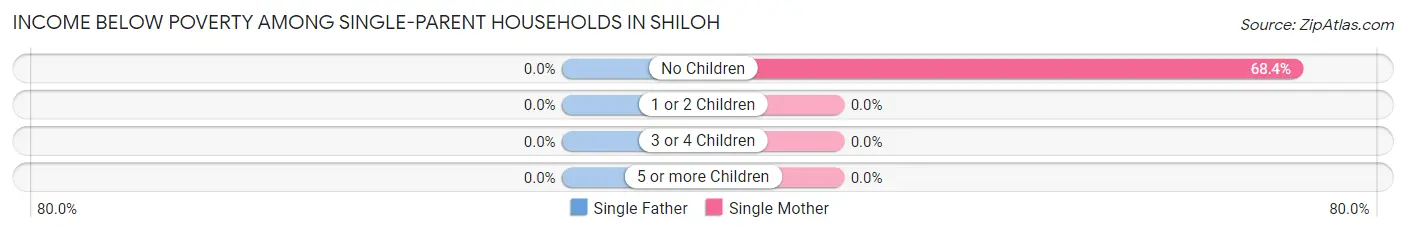
| Children | Single Father | Single Mother |
| No Children | 0 (0.0%) | 13 (68.4%) |
| 1 or 2 Children | 0 (0.0%) | 0 (0.0%) |
| 3 or 4 Children | 0 (0.0%) | 0 (0.0%) |
| 5 or more Children | 0 (0.0%) | 0 (0.0%) |
| Total | 0 (0.0%) | 13 (56.5%) |
Income Below Poverty Among Married-Couple vs Single-Parent Households in Shiloh
The poverty data for Shiloh shows that 6 of the married-couple family households (6.7%) and 13 of the single-parent households (46.4%) are living below the poverty level. Within the married-couple family households, those with 1 or 2 children have the highest poverty rate, with 3 households (25.0%) falling below the poverty line. Among the single-parent households, those with no children have the highest poverty rate, with 13 household (54.2%) living below poverty.
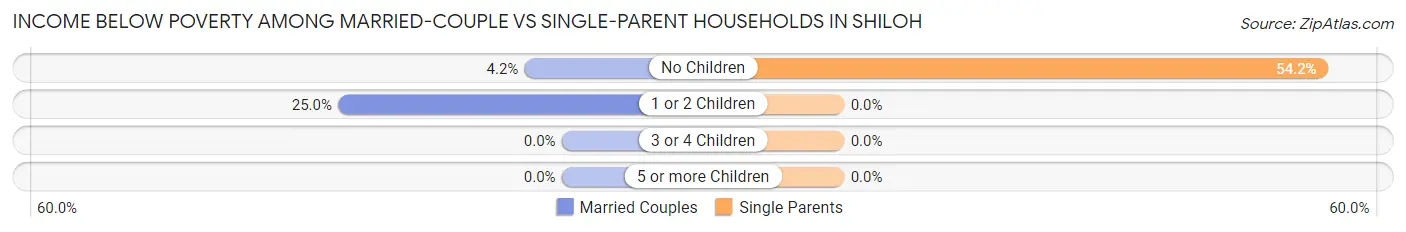
| Children | Married-Couple Families | Single-Parent Households |
| No Children | 3 (4.2%) | 13 (54.2%) |
| 1 or 2 Children | 3 (25.0%) | 0 (0.0%) |
| 3 or 4 Children | 0 (0.0%) | 0 (0.0%) |
| 5 or more Children | 0 (0.0%) | 0 (0.0%) |
| Total | 6 (6.7%) | 13 (46.4%) |
Employment Characteristics in Shiloh
Employment by Class of Employer in Shiloh
Among the 143 employed individuals in Shiloh, private company employees (117 | 81.8%), local government employees (8 | 5.6%), and federal government employees (7 | 4.9%) make up the most common classes of employment.
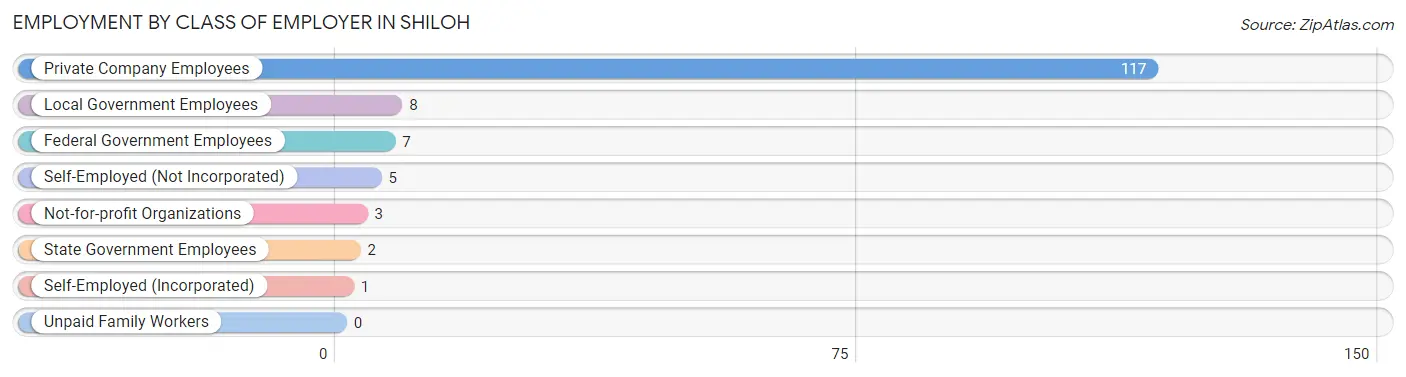
| Employer Class | # Employees | % Employees |
| Private Company Employees | 117 | 81.8% |
| Self-Employed (Incorporated) | 1 | 0.7% |
| Self-Employed (Not Incorporated) | 5 | 3.5% |
| Not-for-profit Organizations | 3 | 2.1% |
| Local Government Employees | 8 | 5.6% |
| State Government Employees | 2 | 1.4% |
| Federal Government Employees | 7 | 4.9% |
| Unpaid Family Workers | 0 | 0.0% |
| Total | 143 | 100.0% |
Employment Status by Age in Shiloh
According to the labor force statistics for Shiloh, out of the total population over 16 years of age (319), 46.4% or 148 individuals are in the labor force, with 1.4% or 2 of them unemployed. The age group with the highest labor force participation rate is 55 to 59 years, with 100.0% or 4 individuals in the labor force. Within the labor force, the 20 to 24 years age range has the highest percentage of unemployed individuals, with 6.3% or 1 of them being unemployed.
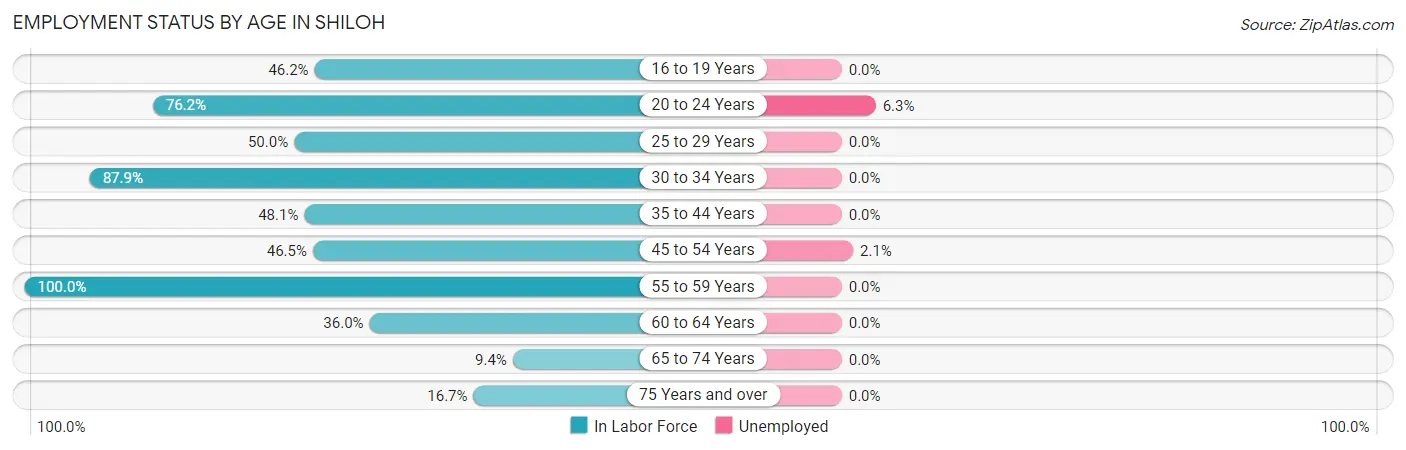
| Age Bracket | In Labor Force | Unemployed |
| 16 to 19 Years | 6 (46.2%) | 0 (0.0%) |
| 20 to 24 Years | 16 (76.2%) | 1 (6.3%) |
| 25 to 29 Years | 18 (50.0%) | 0 (0.0%) |
| 30 to 34 Years | 29 (87.9%) | 0 (0.0%) |
| 35 to 44 Years | 13 (48.1%) | 0 (0.0%) |
| 45 to 54 Years | 47 (46.5%) | 1 (2.1%) |
| 55 to 59 Years | 4 (100.0%) | 0 (0.0%) |
| 60 to 64 Years | 9 (36.0%) | 0 (0.0%) |
| 65 to 74 Years | 5 (9.4%) | 0 (0.0%) |
| 75 Years and over | 1 (16.7%) | 0 (0.0%) |
| Total | 148 (46.4%) | 2 (1.4%) |
Employment Status by Educational Attainment in Shiloh
According to labor force statistics for Shiloh, 53.1% of individuals (120) out of the total population between 25 and 64 years of age (226) are in the labor force, with 0.8% or 1 of them being unemployed. The group with the highest labor force participation rate are those with the educational attainment of less than high school, with 75.0% or 6 individuals in the labor force. Within the labor force, individuals with college / associate degree education have the highest percentage of unemployment, with 1.1% or 1 of them being unemployed.
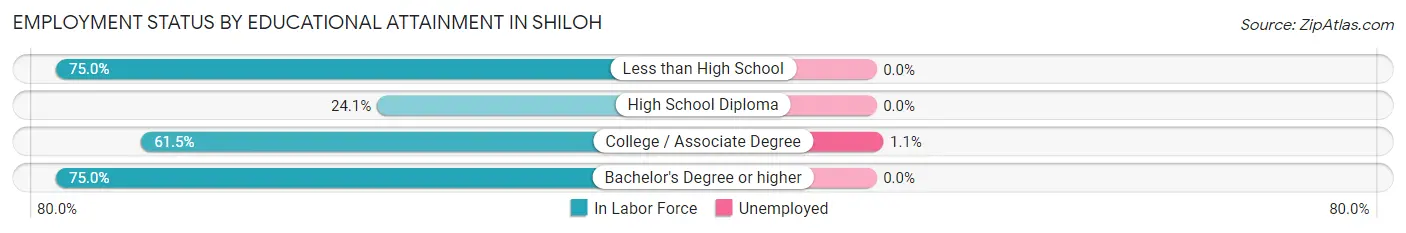
| Educational Attainment | In Labor Force | Unemployed |
| Less than High School | 6 (75.0%) | 0 (0.0%) |
| High School Diploma | 14 (24.1%) | 0 (0.0%) |
| College / Associate Degree | 91 (61.5%) | 2 (1.1%) |
| Bachelor's Degree or higher | 9 (75.0%) | 0 (0.0%) |
| Total | 120 (53.1%) | 2 (0.8%) |
Employment Occupations by Sex in Shiloh
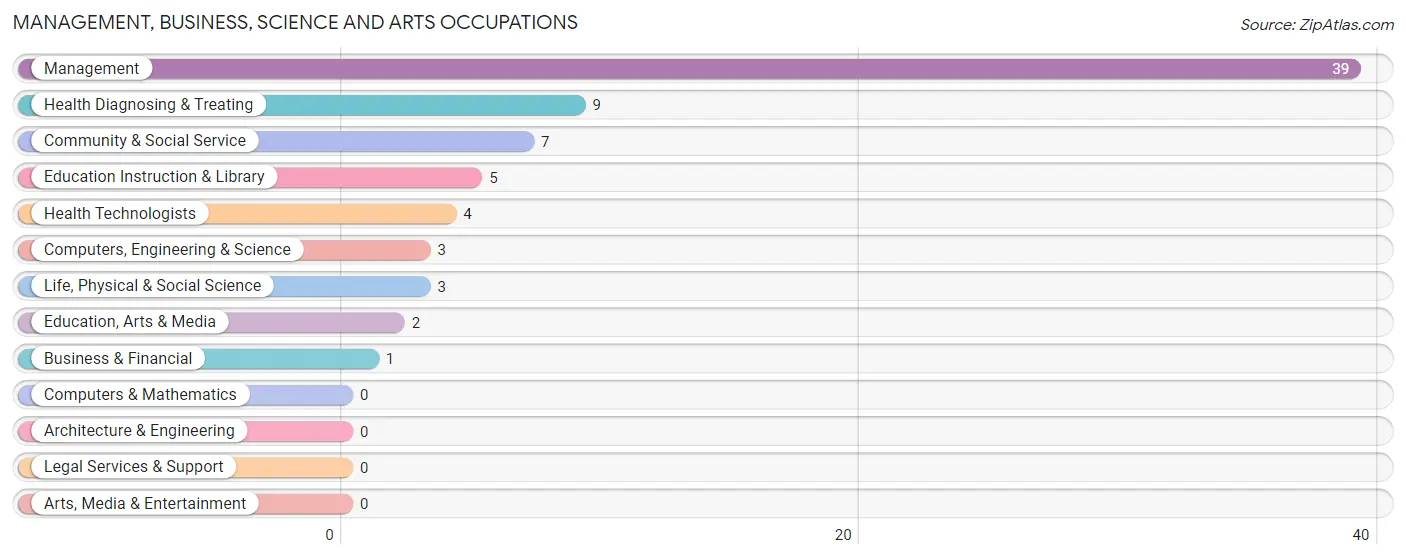
Management, Business, Science and Arts Occupations
The most common Management, Business, Science and Arts occupations in Shiloh are Management (39 | 26.7%), Health Diagnosing & Treating (9 | 6.2%), Community & Social Service (7 | 4.8%), Education Instruction & Library (5 | 3.4%), and Health Technologists (4 | 2.7%).
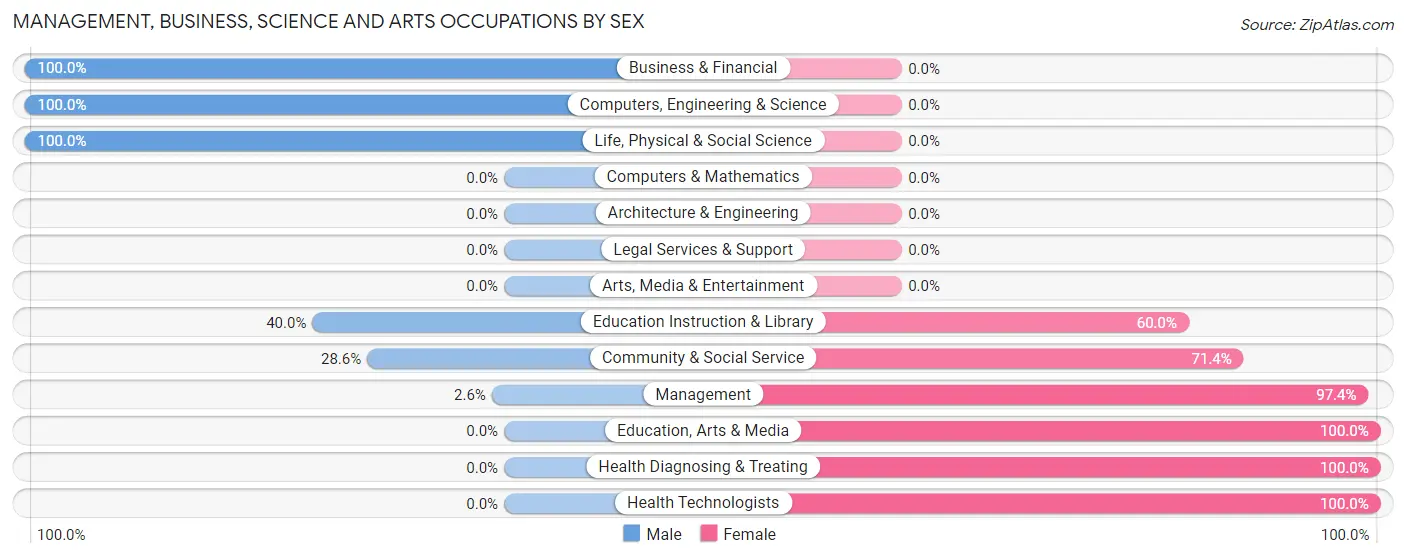
Management, Business, Science and Arts Occupations by Sex
Within the Management, Business, Science and Arts occupations in Shiloh, the most male-oriented occupations are Business & Financial (100.0%), Computers, Engineering & Science (100.0%), and Life, Physical & Social Science (100.0%), while the most female-oriented occupations are Education, Arts & Media (100.0%), Health Diagnosing & Treating (100.0%), and Health Technologists (100.0%).
| Occupation | Male | Female |
| Management | 1 (2.6%) | 38 (97.4%) |
| Business & Financial | 1 (100.0%) | 0 (0.0%) |
| Computers, Engineering & Science | 3 (100.0%) | 0 (0.0%) |
| Computers & Mathematics | 0 (0.0%) | 0 (0.0%) |
| Architecture & Engineering | 0 (0.0%) | 0 (0.0%) |
| Life, Physical & Social Science | 3 (100.0%) | 0 (0.0%) |
| Community & Social Service | 2 (28.6%) | 5 (71.4%) |
| Education, Arts & Media | 0 (0.0%) | 2 (100.0%) |
| Legal Services & Support | 0 (0.0%) | 0 (0.0%) |
| Education Instruction & Library | 2 (40.0%) | 3 (60.0%) |
| Arts, Media & Entertainment | 0 (0.0%) | 0 (0.0%) |
| Health Diagnosing & Treating | 0 (0.0%) | 9 (100.0%) |
| Health Technologists | 0 (0.0%) | 4 (100.0%) |
| Total (Category) | 7 (11.9%) | 52 (88.1%) |
| Total (Overall) | 67 (45.9%) | 79 (54.1%) |
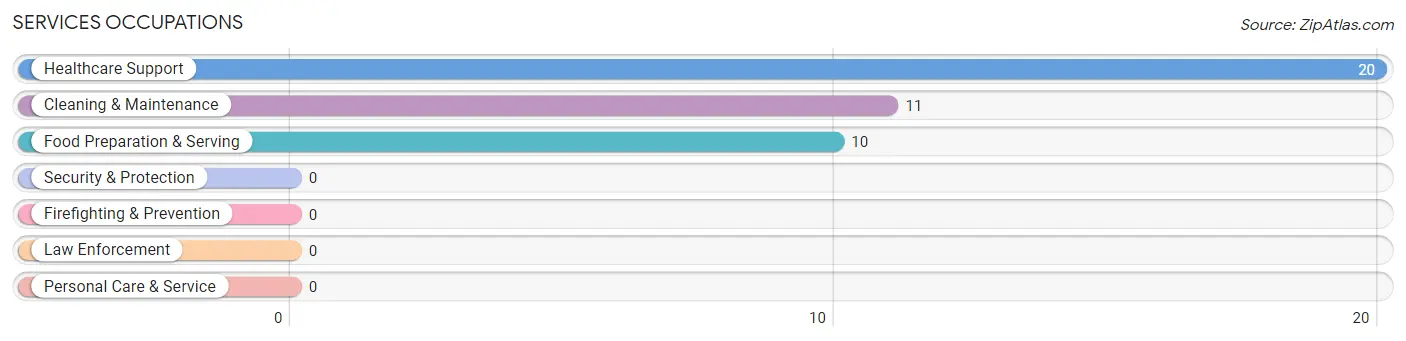
Services Occupations
The most common Services occupations in Shiloh are Healthcare Support (20 | 13.7%), Cleaning & Maintenance (11 | 7.5%), and Food Preparation & Serving (10 | 6.9%).
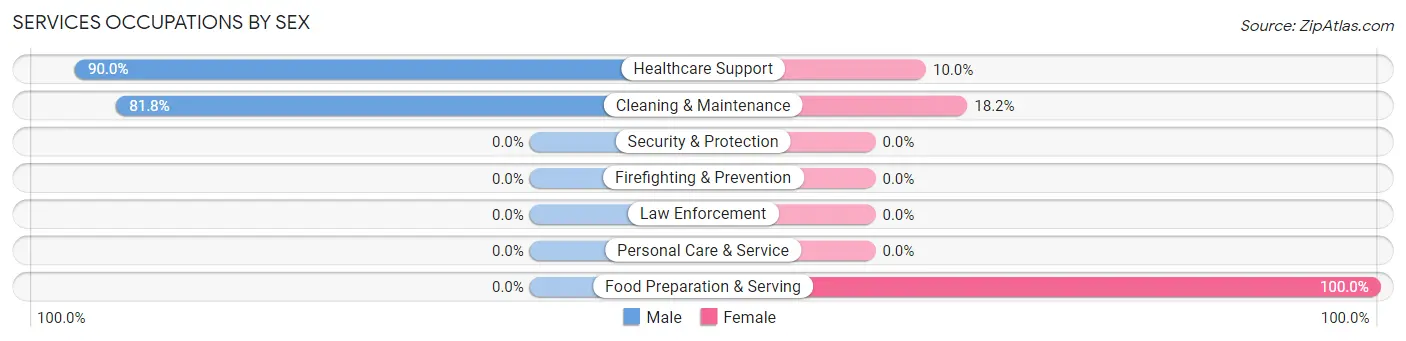
Services Occupations by Sex
Within the Services occupations in Shiloh, the most male-oriented occupations are Healthcare Support (90.0%), and Cleaning & Maintenance (81.8%), while the most female-oriented occupations are Food Preparation & Serving (100.0%), Cleaning & Maintenance (18.2%), and Healthcare Support (10.0%).
| Occupation | Male | Female |
| Healthcare Support | 18 (90.0%) | 2 (10.0%) |
| Security & Protection | 0 (0.0%) | 0 (0.0%) |
| Firefighting & Prevention | 0 (0.0%) | 0 (0.0%) |
| Law Enforcement | 0 (0.0%) | 0 (0.0%) |
| Food Preparation & Serving | 0 (0.0%) | 10 (100.0%) |
| Cleaning & Maintenance | 9 (81.8%) | 2 (18.2%) |
| Personal Care & Service | 0 (0.0%) | 0 (0.0%) |
| Total (Category) | 27 (65.8%) | 14 (34.2%) |
| Total (Overall) | 67 (45.9%) | 79 (54.1%) |
Sales and Office Occupations
The most common Sales and Office occupations in Shiloh are Sales & Related (15 | 10.3%), and Office & Administration (3 | 2.1%).
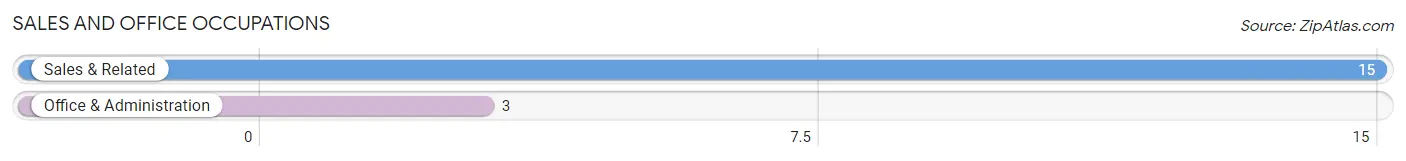
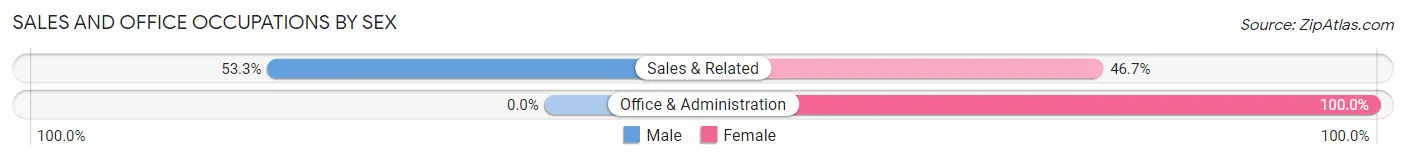
Sales and Office Occupations by Sex
| Occupation | Male | Female |
| Sales & Related | 8 (53.3%) | 7 (46.7%) |
| Office & Administration | 0 (0.0%) | 3 (100.0%) |
| Total (Category) | 8 (44.4%) | 10 (55.6%) |
| Total (Overall) | 67 (45.9%) | 79 (54.1%) |
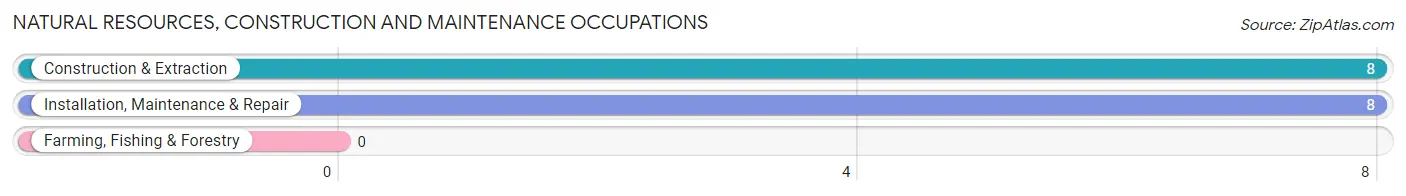
Natural Resources, Construction and Maintenance Occupations
The most common Natural Resources, Construction and Maintenance occupations in Shiloh are Construction & Extraction (8 | 5.5%), and Installation, Maintenance & Repair (8 | 5.5%).
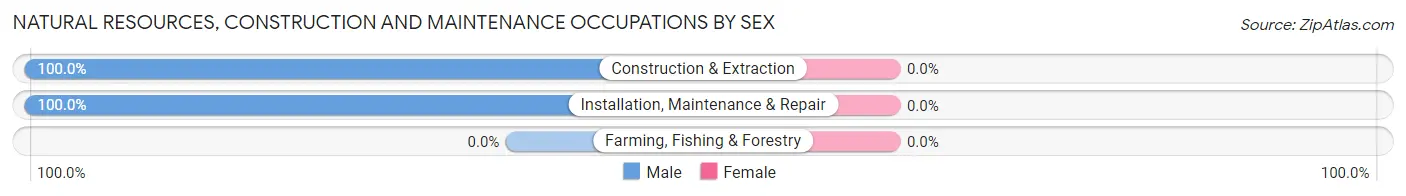
Natural Resources, Construction and Maintenance Occupations by Sex
| Occupation | Male | Female |
| Farming, Fishing & Forestry | 0 (0.0%) | 0 (0.0%) |
| Construction & Extraction | 8 (100.0%) | 0 (0.0%) |
| Installation, Maintenance & Repair | 8 (100.0%) | 0 (0.0%) |
| Total (Category) | 16 (100.0%) | 0 (0.0%) |
| Total (Overall) | 67 (45.9%) | 79 (54.1%) |
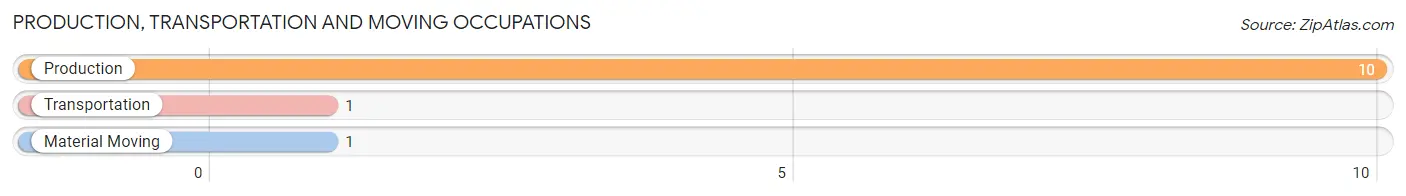
Production, Transportation and Moving Occupations
The most common Production, Transportation and Moving occupations in Shiloh are Production (10 | 6.9%), Transportation (1 | 0.7%), and Material Moving (1 | 0.7%).
Production, Transportation and Moving Occupations by Sex
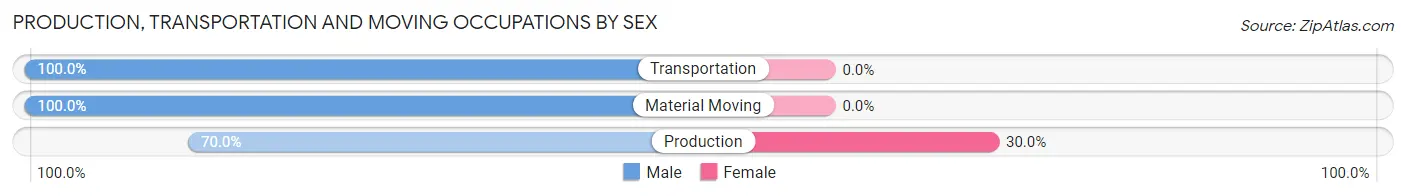
| Occupation | Male | Female |
| Production | 7 (70.0%) | 3 (30.0%) |
| Transportation | 1 (100.0%) | 0 (0.0%) |
| Material Moving | 1 (100.0%) | 0 (0.0%) |
| Total (Category) | 9 (75.0%) | 3 (25.0%) |
| Total (Overall) | 67 (45.9%) | 79 (54.1%) |
Employment Industries by Sex in Shiloh
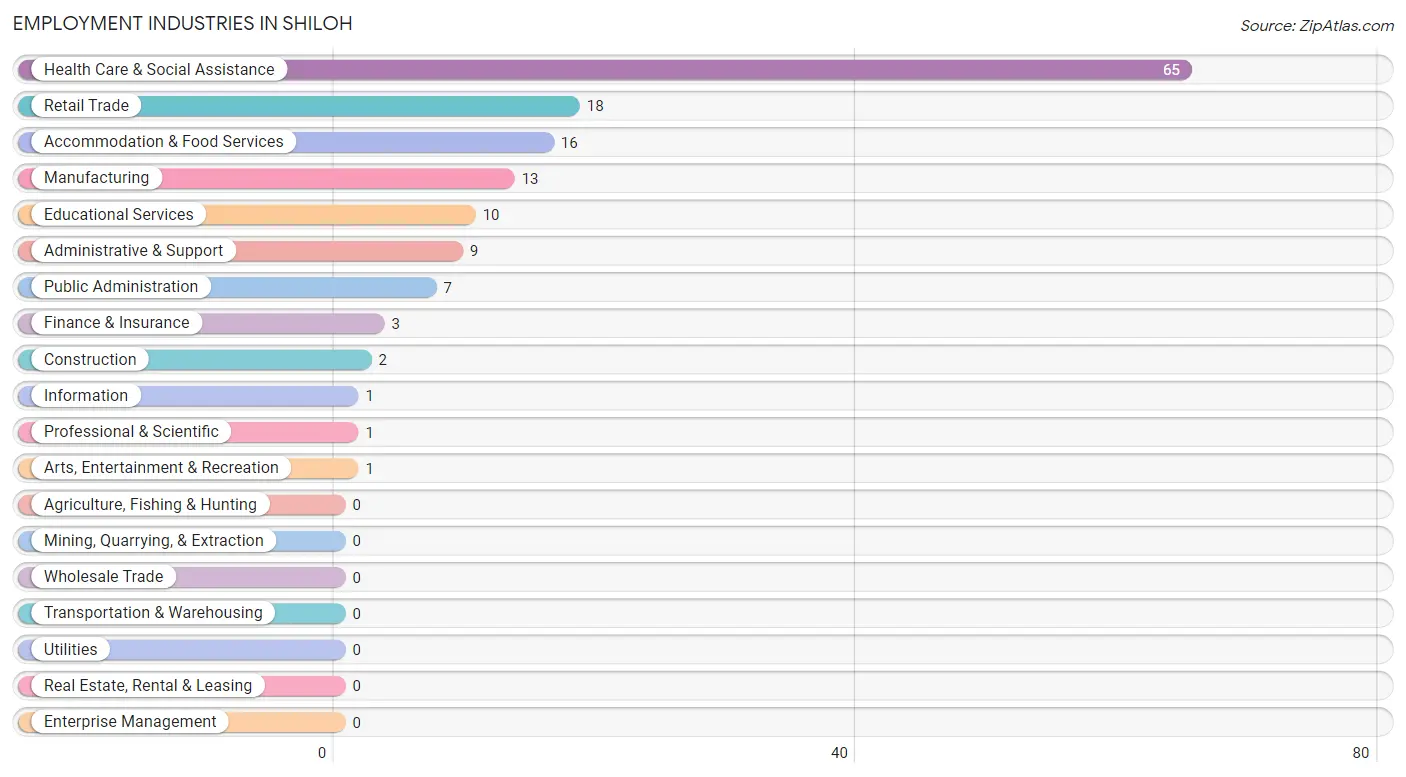
Employment Industries in Shiloh
The major employment industries in Shiloh include Health Care & Social Assistance (65 | 44.5%), Retail Trade (18 | 12.3%), Accommodation & Food Services (16 | 11.0%), Manufacturing (13 | 8.9%), and Educational Services (10 | 6.9%).
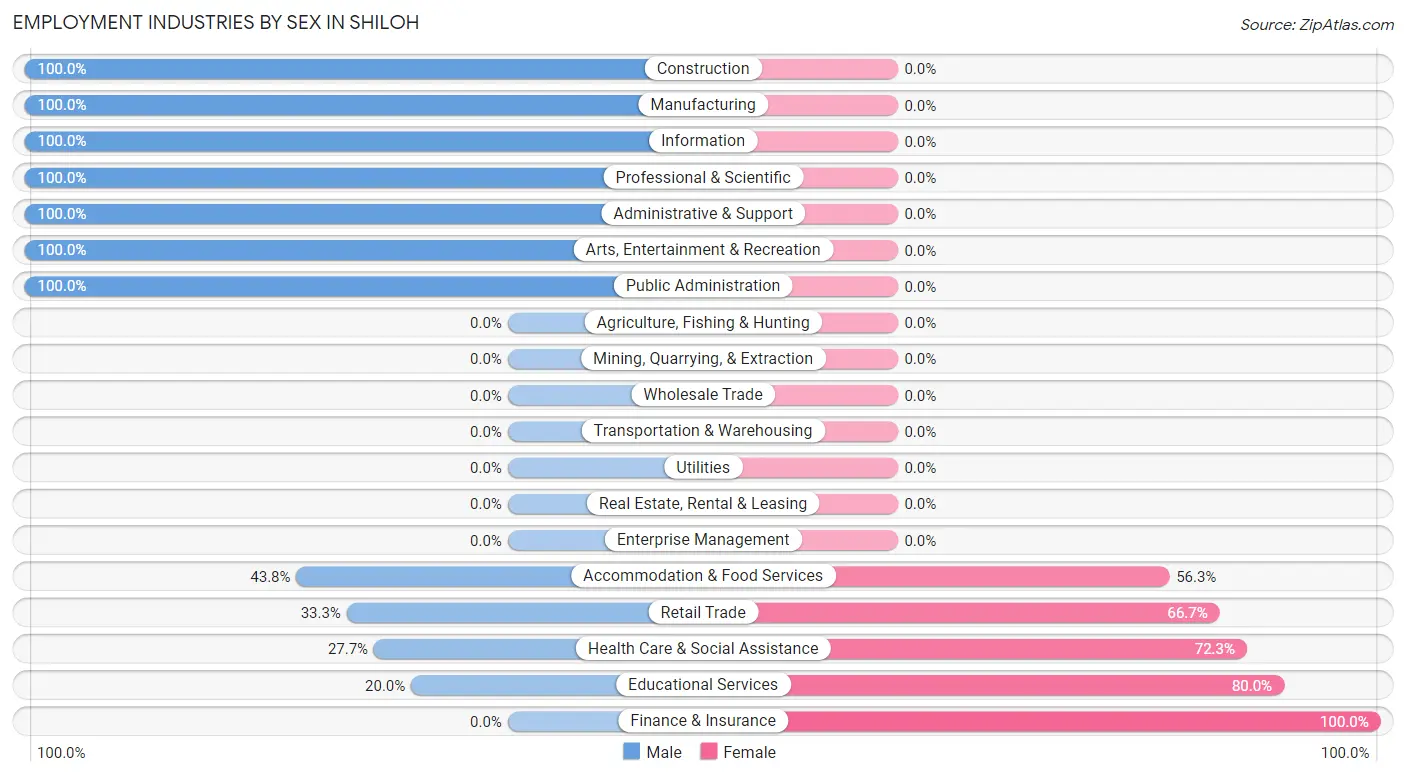
Employment Industries by Sex in Shiloh
The Shiloh industries that see more men than women are Construction (100.0%), Manufacturing (100.0%), and Information (100.0%), whereas the industries that tend to have a higher number of women are Finance & Insurance (100.0%), Educational Services (80.0%), and Health Care & Social Assistance (72.3%).
| Industry | Male | Female |
| Agriculture, Fishing & Hunting | 0 (0.0%) | 0 (0.0%) |
| Mining, Quarrying, & Extraction | 0 (0.0%) | 0 (0.0%) |
| Construction | 2 (100.0%) | 0 (0.0%) |
| Manufacturing | 13 (100.0%) | 0 (0.0%) |
| Wholesale Trade | 0 (0.0%) | 0 (0.0%) |
| Retail Trade | 6 (33.3%) | 12 (66.7%) |
| Transportation & Warehousing | 0 (0.0%) | 0 (0.0%) |
| Utilities | 0 (0.0%) | 0 (0.0%) |
| Information | 1 (100.0%) | 0 (0.0%) |
| Finance & Insurance | 0 (0.0%) | 3 (100.0%) |
| Real Estate, Rental & Leasing | 0 (0.0%) | 0 (0.0%) |
| Professional & Scientific | 1 (100.0%) | 0 (0.0%) |
| Enterprise Management | 0 (0.0%) | 0 (0.0%) |
| Administrative & Support | 9 (100.0%) | 0 (0.0%) |
| Educational Services | 2 (20.0%) | 8 (80.0%) |
| Health Care & Social Assistance | 18 (27.7%) | 47 (72.3%) |
| Arts, Entertainment & Recreation | 1 (100.0%) | 0 (0.0%) |
| Accommodation & Food Services | 7 (43.8%) | 9 (56.2%) |
| Public Administration | 7 (100.0%) | 0 (0.0%) |
| Total | 67 (45.9%) | 79 (54.1%) |
Education in Shiloh
School Enrollment in Shiloh
The most common levels of schooling among the 60 students in Shiloh are college / undergraduate (25 | 41.7%), high school (10 | 16.7%), and middle school (9 | 15.0%).
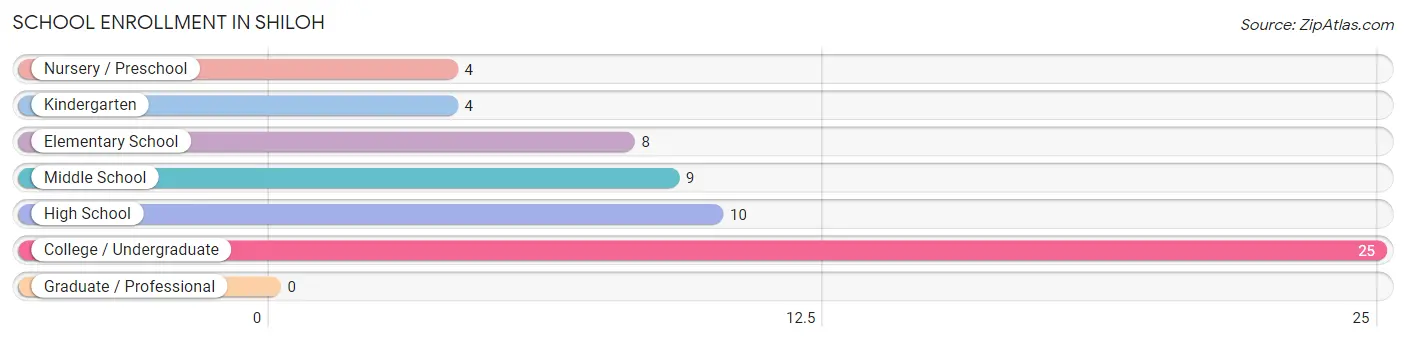
| School Level | # Students | % Students |
| Nursery / Preschool | 4 | 6.7% |
| Kindergarten | 4 | 6.7% |
| Elementary School | 8 | 13.3% |
| Middle School | 9 | 15.0% |
| High School | 10 | 16.7% |
| College / Undergraduate | 25 | 41.7% |
| Graduate / Professional | 0 | 0.0% |
| Total | 60 | 100.0% |
School Enrollment by Age by Funding Source in Shiloh
Out of a total of 60 students who are enrolled in schools in Shiloh, 3 (5.0%) attend a private institution, while the remaining 57 (95.0%) are enrolled in public schools. The age group of 10 to 14 year olds has the highest likelihood of being enrolled in private schools, with 2 (16.7% in the age bracket) enrolled. Conversely, the age group of 3 to 4 year olds has the lowest likelihood of being enrolled in a private school, with 2 (100.0% in the age bracket) attending a public institution.
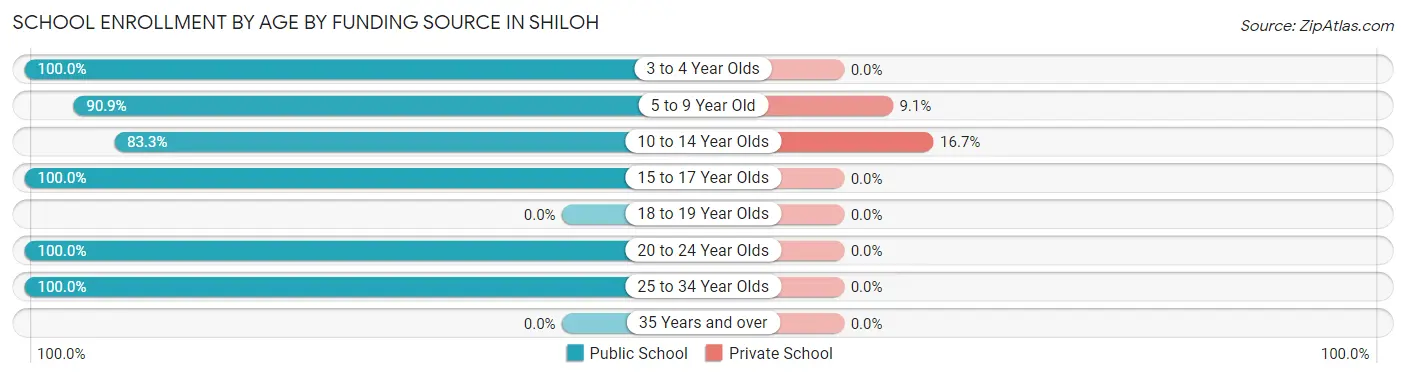
| Age Bracket | Public School | Private School |
| 3 to 4 Year Olds | 2 (100.0%) | 0 (0.0%) |
| 5 to 9 Year Old | 10 (90.9%) | 1 (9.1%) |
| 10 to 14 Year Olds | 10 (83.3%) | 2 (16.7%) |
| 15 to 17 Year Olds | 10 (100.0%) | 0 (0.0%) |
| 18 to 19 Year Olds | 0 (0.0%) | 0 (0.0%) |
| 20 to 24 Year Olds | 7 (100.0%) | 0 (0.0%) |
| 25 to 34 Year Olds | 18 (100.0%) | 0 (0.0%) |
| 35 Years and over | 0 (0.0%) | 0 (0.0%) |
| Total | 57 (95.0%) | 3 (5.0%) |
Educational Attainment by Field of Study in Shiloh
Science & technology (3 | 21.4%), education (3 | 21.4%), social sciences (2 | 14.3%), liberal arts & history (2 | 14.3%), and computers & mathematics (1 | 7.1%) are the most common fields of study among 14 individuals in Shiloh who have obtained a bachelor's degree or higher.
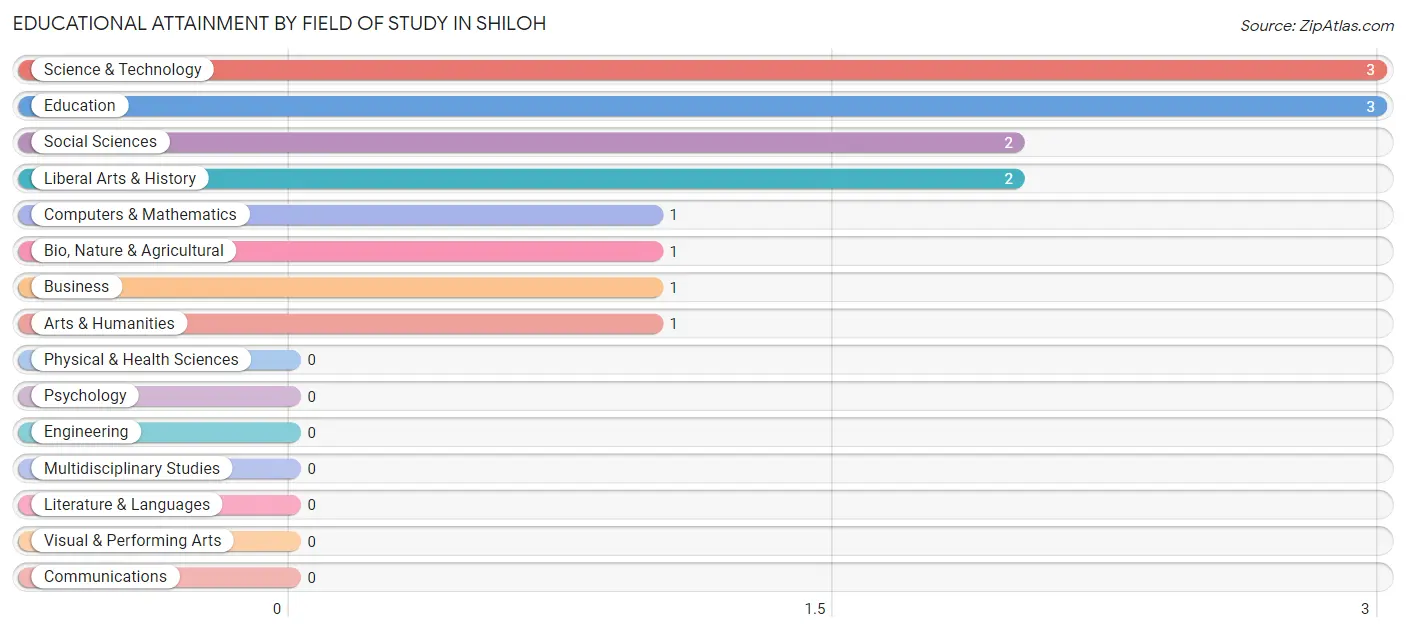
| Field of Study | # Graduates | % Graduates |
| Computers & Mathematics | 1 | 7.1% |
| Bio, Nature & Agricultural | 1 | 7.1% |
| Physical & Health Sciences | 0 | 0.0% |
| Psychology | 0 | 0.0% |
| Social Sciences | 2 | 14.3% |
| Engineering | 0 | 0.0% |
| Multidisciplinary Studies | 0 | 0.0% |
| Science & Technology | 3 | 21.4% |
| Business | 1 | 7.1% |
| Education | 3 | 21.4% |
| Literature & Languages | 0 | 0.0% |
| Liberal Arts & History | 2 | 14.3% |
| Visual & Performing Arts | 0 | 0.0% |
| Communications | 0 | 0.0% |
| Arts & Humanities | 1 | 7.1% |
| Total | 14 | 100.0% |
Transportation & Commute in Shiloh
Vehicle Availability by Sex in Shiloh
The most prevalent vehicle ownership categories in Shiloh are males with 2 vehicles (53, accounting for 81.5%) and females with 2 vehicles (58, making up 67.9%).
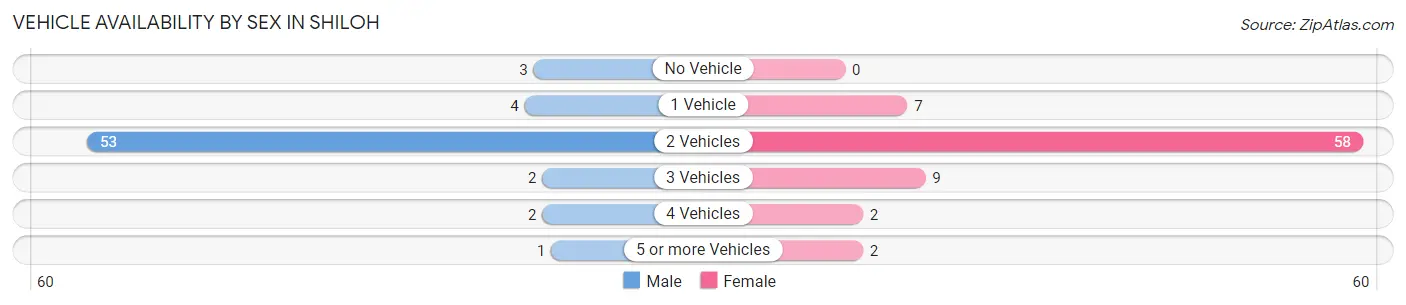
| Vehicles Available | Male | Female |
| No Vehicle | 3 (4.6%) | 0 (0.0%) |
| 1 Vehicle | 4 (6.1%) | 7 (9.0%) |
| 2 Vehicles | 53 (81.5%) | 58 (74.4%) |
| 3 Vehicles | 2 (3.1%) | 9 (11.5%) |
| 4 Vehicles | 2 (3.1%) | 2 (2.6%) |
| 5 or more Vehicles | 1 (1.5%) | 2 (2.6%) |
| Total | 65 (100.0%) | 78 (100.0%) |
Commute Time in Shiloh
The most frequently occuring commute durations in Shiloh are 15 to 19 minutes (64 commuters, 44.8%), 5 to 9 minutes (27 commuters, 18.9%), and 20 to 24 minutes (18 commuters, 12.6%).
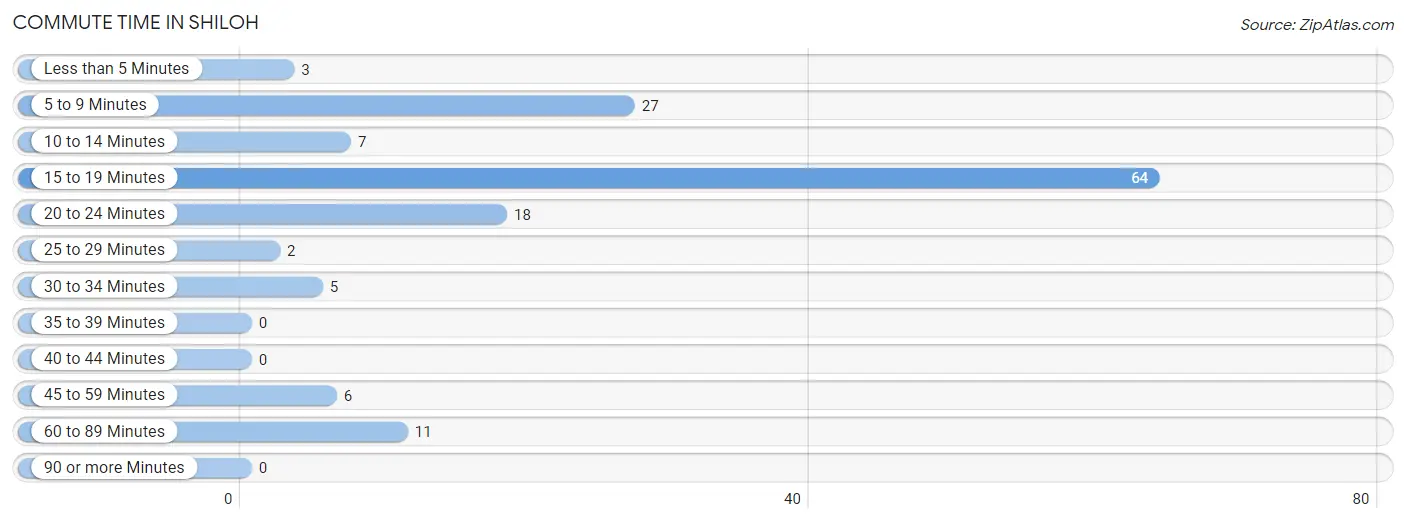
| Commute Time | # Commuters | % Commuters |
| Less than 5 Minutes | 3 | 2.1% |
| 5 to 9 Minutes | 27 | 18.9% |
| 10 to 14 Minutes | 7 | 4.9% |
| 15 to 19 Minutes | 64 | 44.8% |
| 20 to 24 Minutes | 18 | 12.6% |
| 25 to 29 Minutes | 2 | 1.4% |
| 30 to 34 Minutes | 5 | 3.5% |
| 35 to 39 Minutes | 0 | 0.0% |
| 40 to 44 Minutes | 0 | 0.0% |
| 45 to 59 Minutes | 6 | 4.2% |
| 60 to 89 Minutes | 11 | 7.7% |
| 90 or more Minutes | 0 | 0.0% |
Commute Time by Sex in Shiloh
The most common commute times in Shiloh are 15 to 19 minutes (20 commuters, 30.8%) for males and 15 to 19 minutes (44 commuters, 56.4%) for females.
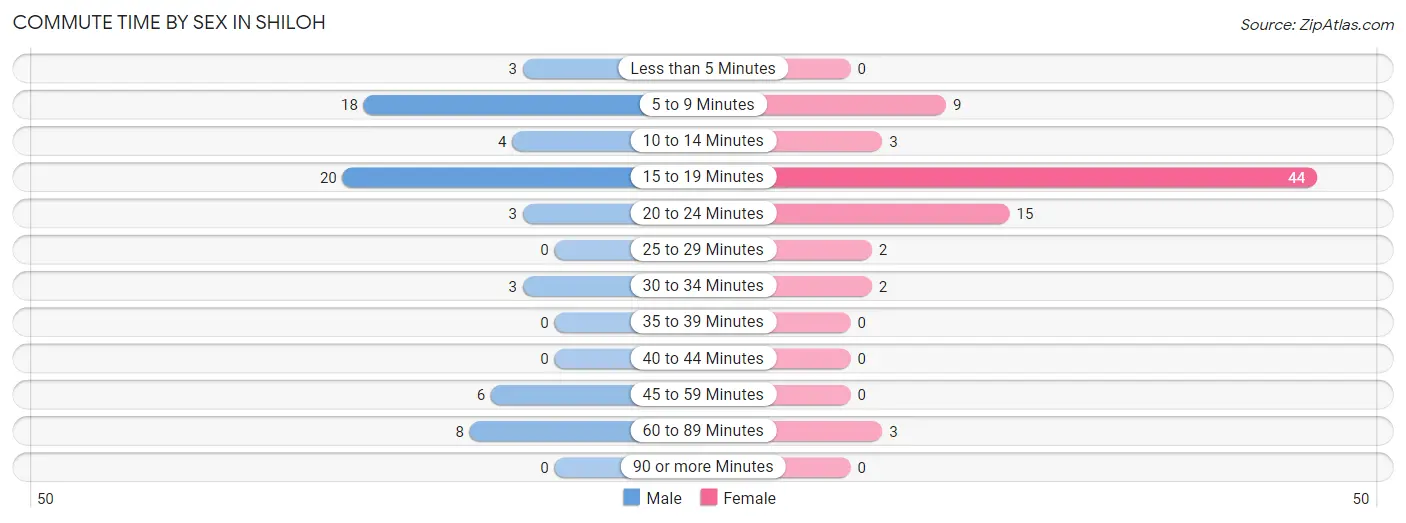
| Commute Time | Male | Female |
| Less than 5 Minutes | 3 (4.6%) | 0 (0.0%) |
| 5 to 9 Minutes | 18 (27.7%) | 9 (11.5%) |
| 10 to 14 Minutes | 4 (6.1%) | 3 (3.8%) |
| 15 to 19 Minutes | 20 (30.8%) | 44 (56.4%) |
| 20 to 24 Minutes | 3 (4.6%) | 15 (19.2%) |
| 25 to 29 Minutes | 0 (0.0%) | 2 (2.6%) |
| 30 to 34 Minutes | 3 (4.6%) | 2 (2.6%) |
| 35 to 39 Minutes | 0 (0.0%) | 0 (0.0%) |
| 40 to 44 Minutes | 0 (0.0%) | 0 (0.0%) |
| 45 to 59 Minutes | 6 (9.2%) | 0 (0.0%) |
| 60 to 89 Minutes | 8 (12.3%) | 3 (3.8%) |
| 90 or more Minutes | 0 (0.0%) | 0 (0.0%) |
Time of Departure to Work by Sex in Shiloh
The most frequent times of departure to work in Shiloh are 12:00 PM to 3:59 PM (25, 38.5%) for males and 7:00 AM to 7:29 AM (58, 74.4%) for females.
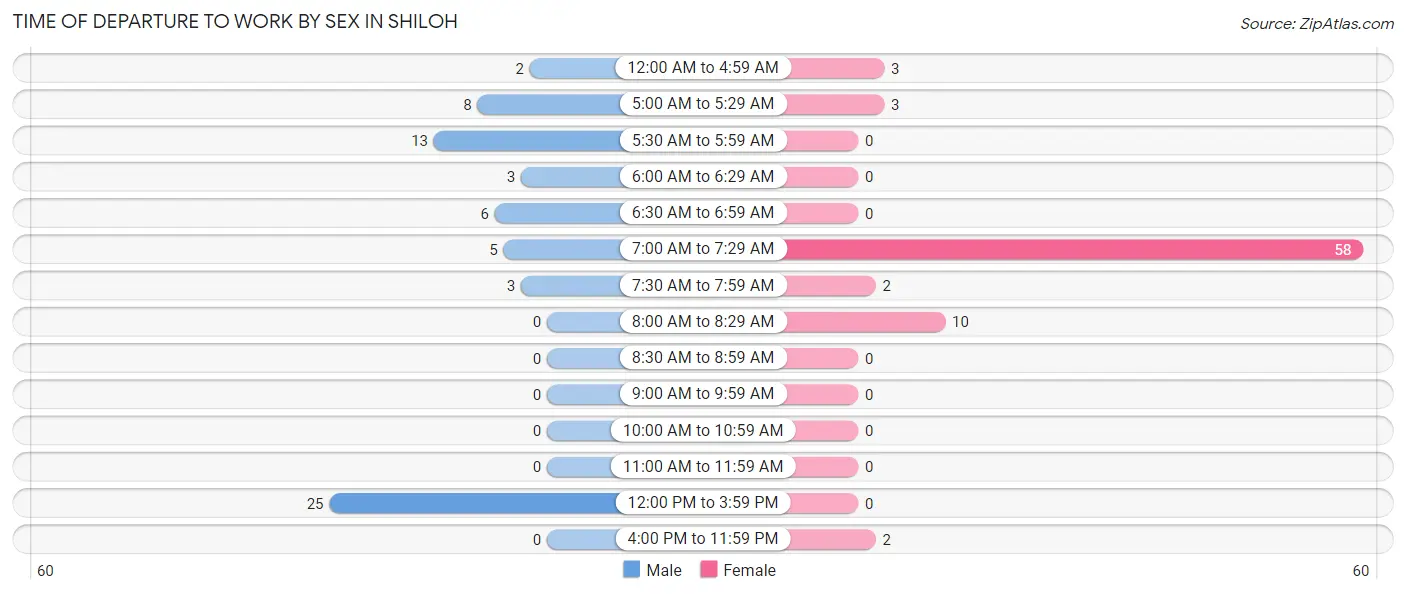
| Time of Departure | Male | Female |
| 12:00 AM to 4:59 AM | 2 (3.1%) | 3 (3.8%) |
| 5:00 AM to 5:29 AM | 8 (12.3%) | 3 (3.8%) |
| 5:30 AM to 5:59 AM | 13 (20.0%) | 0 (0.0%) |
| 6:00 AM to 6:29 AM | 3 (4.6%) | 0 (0.0%) |
| 6:30 AM to 6:59 AM | 6 (9.2%) | 0 (0.0%) |
| 7:00 AM to 7:29 AM | 5 (7.7%) | 58 (74.4%) |
| 7:30 AM to 7:59 AM | 3 (4.6%) | 2 (2.6%) |
| 8:00 AM to 8:29 AM | 0 (0.0%) | 10 (12.8%) |
| 8:30 AM to 8:59 AM | 0 (0.0%) | 0 (0.0%) |
| 9:00 AM to 9:59 AM | 0 (0.0%) | 0 (0.0%) |
| 10:00 AM to 10:59 AM | 0 (0.0%) | 0 (0.0%) |
| 11:00 AM to 11:59 AM | 0 (0.0%) | 0 (0.0%) |
| 12:00 PM to 3:59 PM | 25 (38.5%) | 0 (0.0%) |
| 4:00 PM to 11:59 PM | 0 (0.0%) | 2 (2.6%) |
| Total | 65 (100.0%) | 78 (100.0%) |
Housing Occupancy in Shiloh
Occupancy by Ownership in Shiloh
Of the total 156 dwellings in Shiloh, owner-occupied units account for 97 (62.2%), while renter-occupied units make up 59 (37.8%).
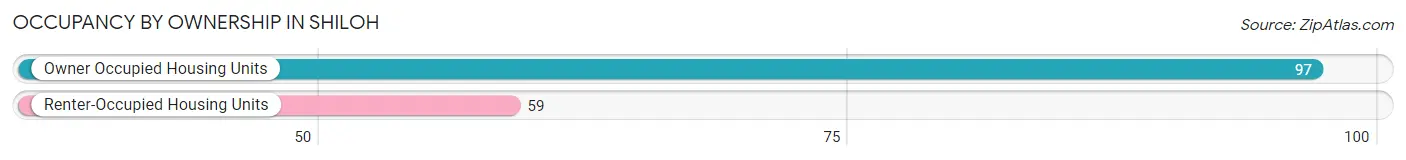
| Occupancy | # Housing Units | % Housing Units |
| Owner Occupied Housing Units | 97 | 62.2% |
| Renter-Occupied Housing Units | 59 | 37.8% |
| Total Occupied Housing Units | 156 | 100.0% |
Occupancy by Household Size in Shiloh
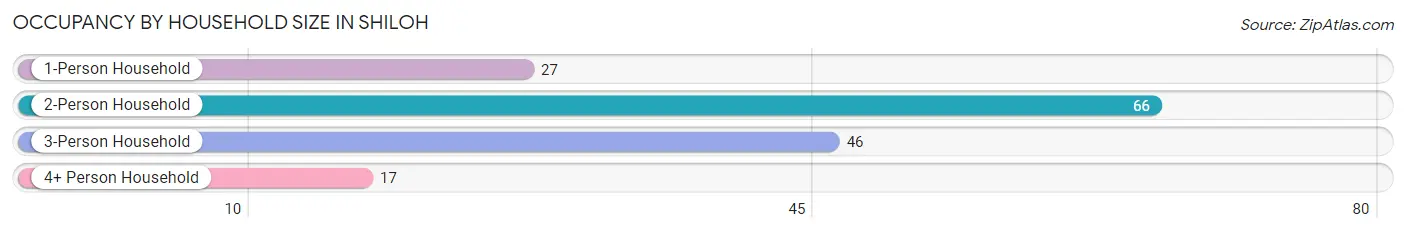
| Household Size | # Housing Units | % Housing Units |
| 1-Person Household | 27 | 17.3% |
| 2-Person Household | 66 | 42.3% |
| 3-Person Household | 46 | 29.5% |
| 4+ Person Household | 17 | 10.9% |
| Total Housing Units | 156 | 100.0% |
Occupancy by Ownership by Household Size in Shiloh
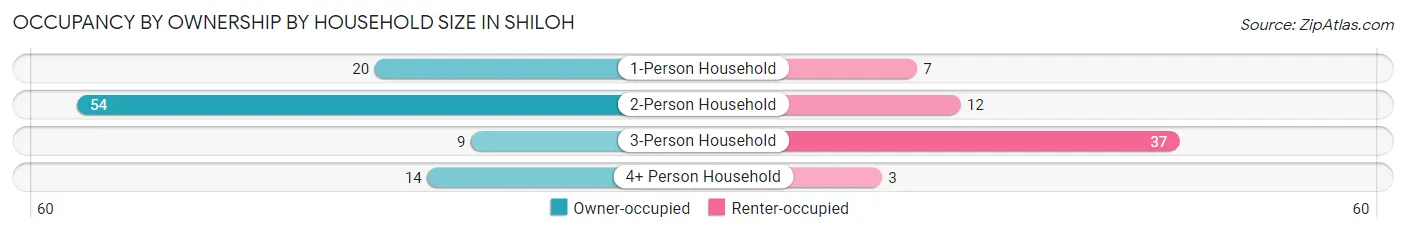
| Household Size | Owner-occupied | Renter-occupied |
| 1-Person Household | 20 (74.1%) | 7 (25.9%) |
| 2-Person Household | 54 (81.8%) | 12 (18.2%) |
| 3-Person Household | 9 (19.6%) | 37 (80.4%) |
| 4+ Person Household | 14 (82.4%) | 3 (17.6%) |
| Total Housing Units | 97 (62.2%) | 59 (37.8%) |
Occupancy by Educational Attainment in Shiloh
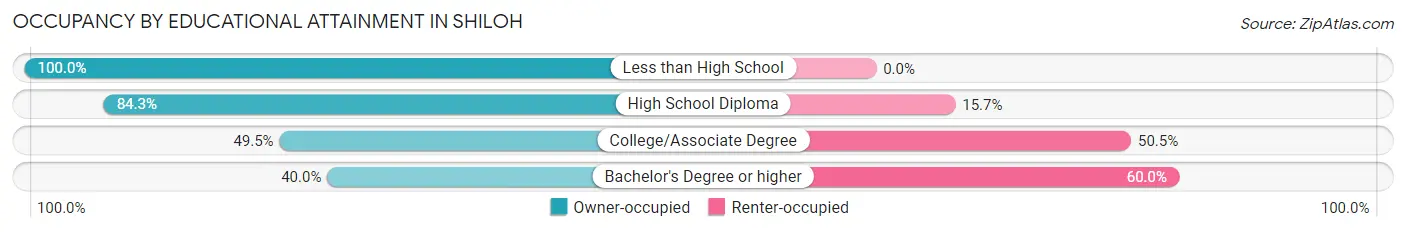
| Household Size | Owner-occupied | Renter-occupied |
| Less than High School | 5 (100.0%) | 0 (0.0%) |
| High School Diploma | 43 (84.3%) | 8 (15.7%) |
| College/Associate Degree | 47 (49.5%) | 48 (50.5%) |
| Bachelor's Degree or higher | 2 (40.0%) | 3 (60.0%) |
Occupancy by Age of Householder in Shiloh
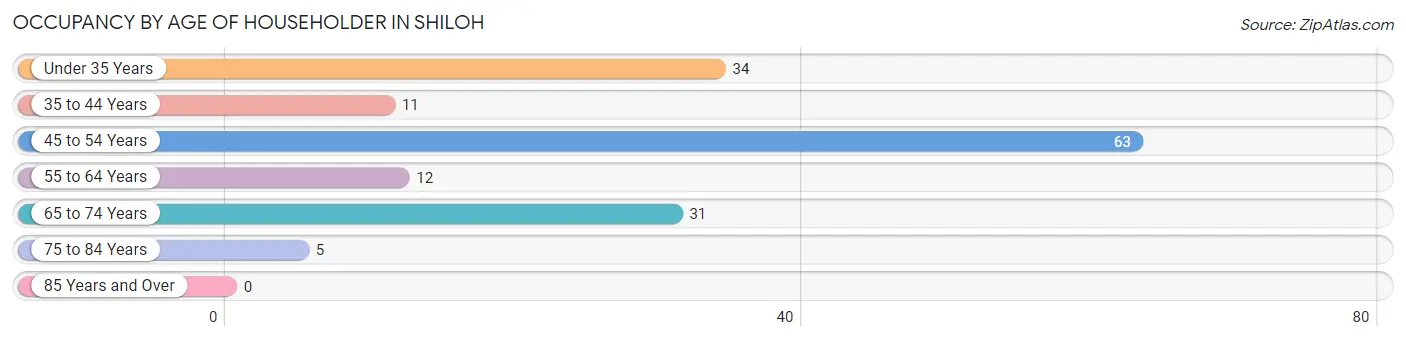
| Age Bracket | # Households | % Households |
| Under 35 Years | 34 | 21.8% |
| 35 to 44 Years | 11 | 7.0% |
| 45 to 54 Years | 63 | 40.4% |
| 55 to 64 Years | 12 | 7.7% |
| 65 to 74 Years | 31 | 19.9% |
| 75 to 84 Years | 5 | 3.2% |
| 85 Years and Over | 0 | 0.0% |
| Total | 156 | 100.0% |
Housing Finances in Shiloh
Median Income by Occupancy in Shiloh
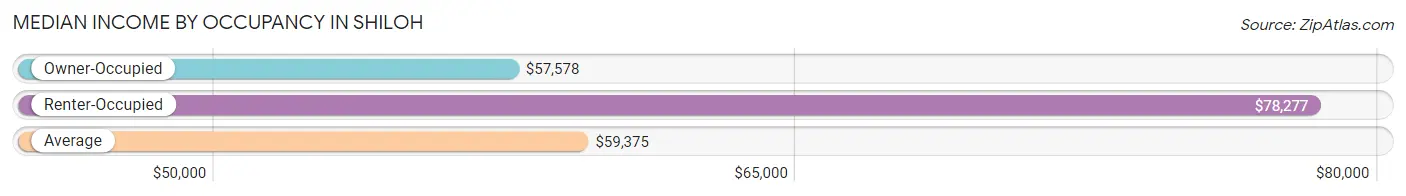
| Occupancy Type | # Households | Median Income |
| Owner-Occupied | 97 (62.2%) | $57,578 |
| Renter-Occupied | 59 (37.8%) | $78,277 |
| Average | 156 (100.0%) | $59,375 |
Occupancy by Householder Income Bracket in Shiloh
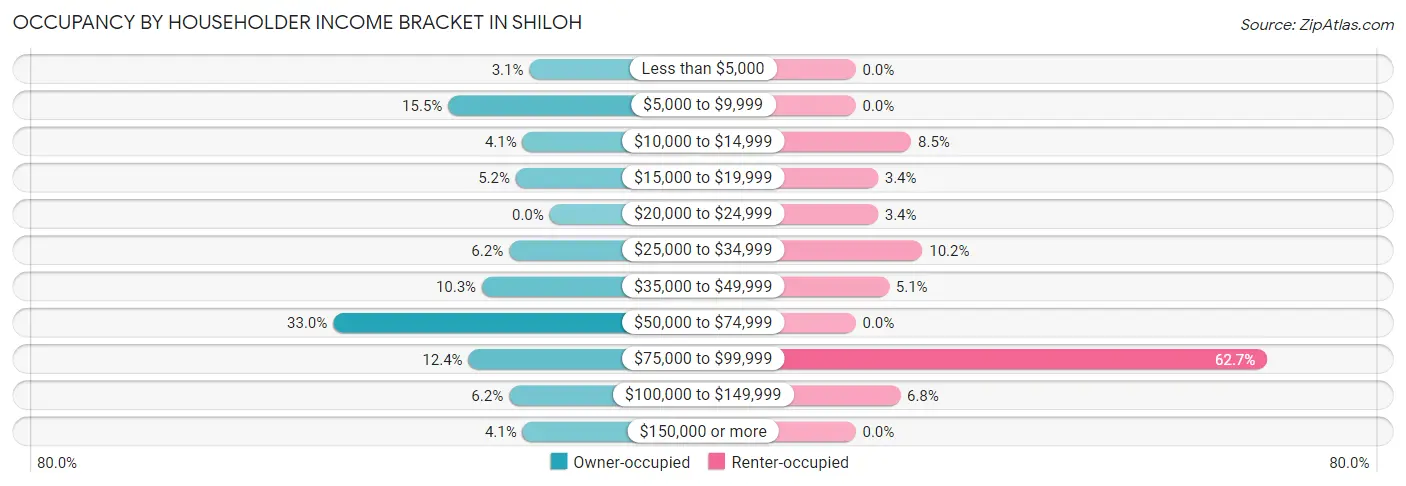
| Income Bracket | Owner-occupied | Renter-occupied |
| Less than $5,000 | 3 (3.1%) | 0 (0.0%) |
| $5,000 to $9,999 | 15 (15.5%) | 0 (0.0%) |
| $10,000 to $14,999 | 4 (4.1%) | 5 (8.5%) |
| $15,000 to $19,999 | 5 (5.1%) | 2 (3.4%) |
| $20,000 to $24,999 | 0 (0.0%) | 2 (3.4%) |
| $25,000 to $34,999 | 6 (6.2%) | 6 (10.2%) |
| $35,000 to $49,999 | 10 (10.3%) | 3 (5.1%) |
| $50,000 to $74,999 | 32 (33.0%) | 0 (0.0%) |
| $75,000 to $99,999 | 12 (12.4%) | 37 (62.7%) |
| $100,000 to $149,999 | 6 (6.2%) | 4 (6.8%) |
| $150,000 or more | 4 (4.1%) | 0 (0.0%) |
| Total | 97 (100.0%) | 59 (100.0%) |
Monthly Housing Cost Tiers in Shiloh
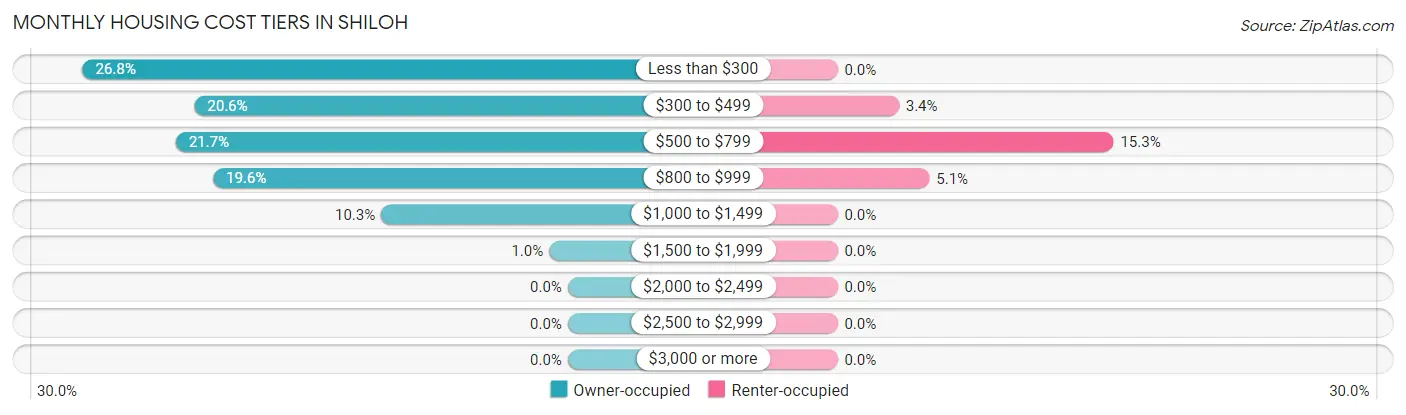
| Monthly Cost | Owner-occupied | Renter-occupied |
| Less than $300 | 26 (26.8%) | 0 (0.0%) |
| $300 to $499 | 20 (20.6%) | 2 (3.4%) |
| $500 to $799 | 21 (21.6%) | 9 (15.2%) |
| $800 to $999 | 19 (19.6%) | 3 (5.1%) |
| $1,000 to $1,499 | 10 (10.3%) | 0 (0.0%) |
| $1,500 to $1,999 | 1 (1.0%) | 0 (0.0%) |
| $2,000 to $2,499 | 0 (0.0%) | 0 (0.0%) |
| $2,500 to $2,999 | 0 (0.0%) | 0 (0.0%) |
| $3,000 or more | 0 (0.0%) | 0 (0.0%) |
| Total | 97 (100.0%) | 59 (100.0%) |
Physical Housing Characteristics in Shiloh
Housing Structures in Shiloh
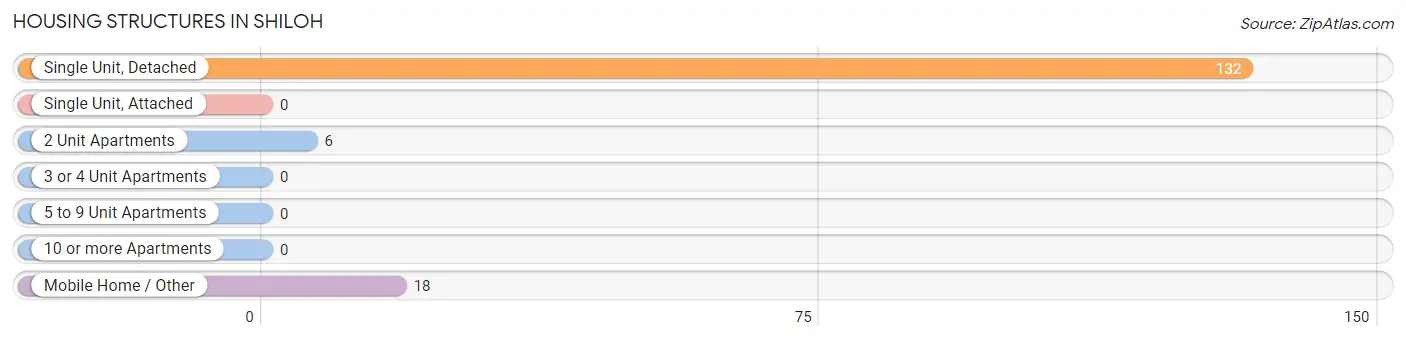
| Structure Type | # Housing Units | % Housing Units |
| Single Unit, Detached | 132 | 84.6% |
| Single Unit, Attached | 0 | 0.0% |
| 2 Unit Apartments | 6 | 3.8% |
| 3 or 4 Unit Apartments | 0 | 0.0% |
| 5 to 9 Unit Apartments | 0 | 0.0% |
| 10 or more Apartments | 0 | 0.0% |
| Mobile Home / Other | 18 | 11.5% |
| Total | 156 | 100.0% |
Housing Structures by Occupancy in Shiloh
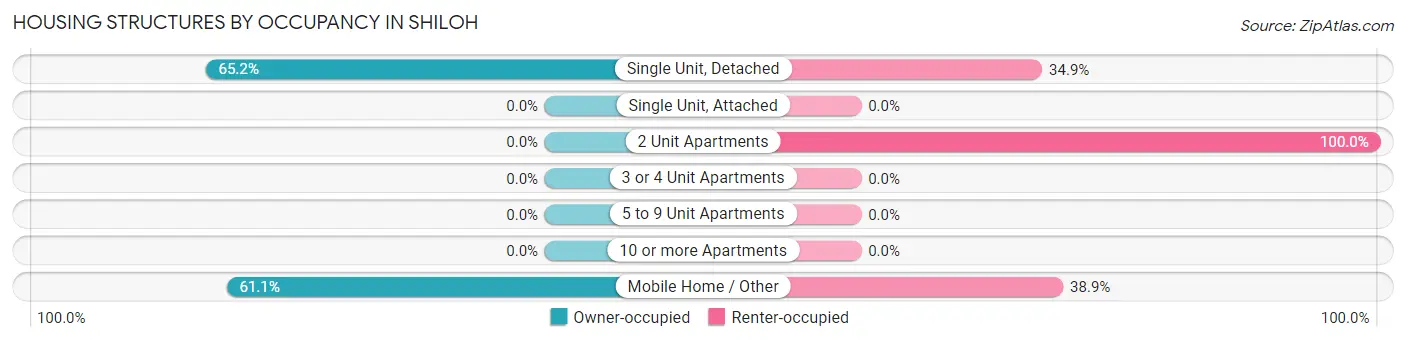
| Structure Type | Owner-occupied | Renter-occupied |
| Single Unit, Detached | 86 (65.1%) | 46 (34.8%) |
| Single Unit, Attached | 0 (0.0%) | 0 (0.0%) |
| 2 Unit Apartments | 0 (0.0%) | 6 (100.0%) |
| 3 or 4 Unit Apartments | 0 (0.0%) | 0 (0.0%) |
| 5 to 9 Unit Apartments | 0 (0.0%) | 0 (0.0%) |
| 10 or more Apartments | 0 (0.0%) | 0 (0.0%) |
| Mobile Home / Other | 11 (61.1%) | 7 (38.9%) |
| Total | 97 (62.2%) | 59 (37.8%) |
Housing Structures by Number of Rooms in Shiloh
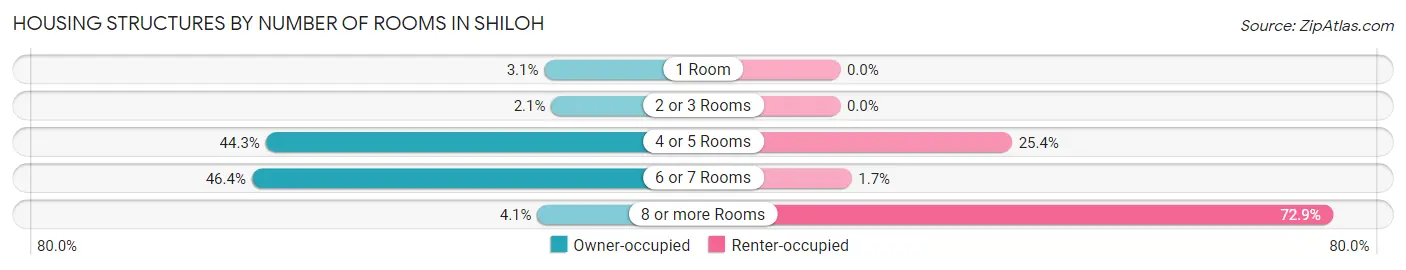
| Number of Rooms | Owner-occupied | Renter-occupied |
| 1 Room | 3 (3.1%) | 0 (0.0%) |
| 2 or 3 Rooms | 2 (2.1%) | 0 (0.0%) |
| 4 or 5 Rooms | 43 (44.3%) | 15 (25.4%) |
| 6 or 7 Rooms | 45 (46.4%) | 1 (1.7%) |
| 8 or more Rooms | 4 (4.1%) | 43 (72.9%) |
| Total | 97 (100.0%) | 59 (100.0%) |
Housing Structure by Heating Type in Shiloh
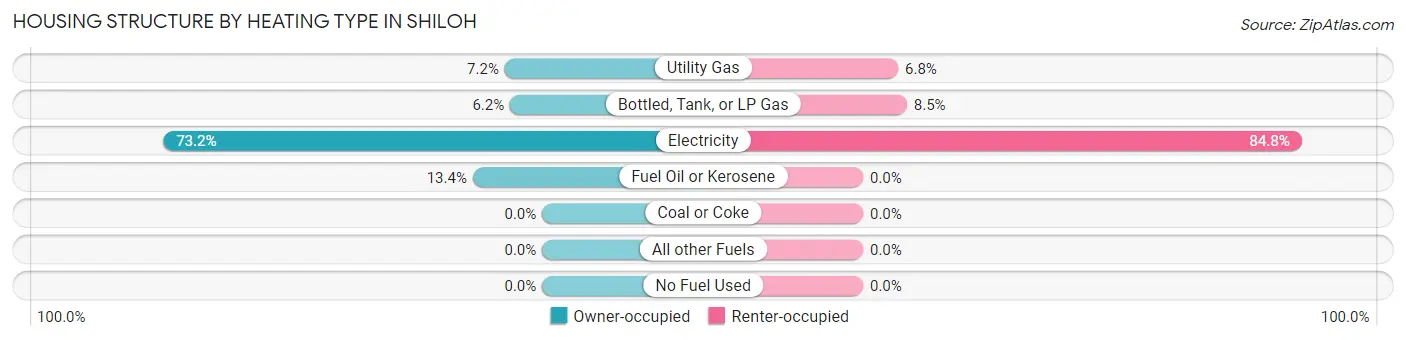
| Heating Type | Owner-occupied | Renter-occupied |
| Utility Gas | 7 (7.2%) | 4 (6.8%) |
| Bottled, Tank, or LP Gas | 6 (6.2%) | 5 (8.5%) |
| Electricity | 71 (73.2%) | 50 (84.8%) |
| Fuel Oil or Kerosene | 13 (13.4%) | 0 (0.0%) |
| Coal or Coke | 0 (0.0%) | 0 (0.0%) |
| All other Fuels | 0 (0.0%) | 0 (0.0%) |
| No Fuel Used | 0 (0.0%) | 0 (0.0%) |
| Total | 97 (100.0%) | 59 (100.0%) |
Household Vehicle Usage in Shiloh
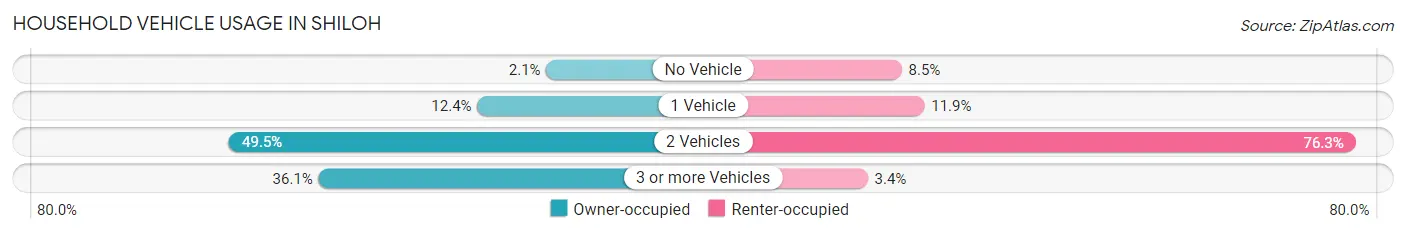
| Vehicles per Household | Owner-occupied | Renter-occupied |
| No Vehicle | 2 (2.1%) | 5 (8.5%) |
| 1 Vehicle | 12 (12.4%) | 7 (11.9%) |
| 2 Vehicles | 48 (49.5%) | 45 (76.3%) |
| 3 or more Vehicles | 35 (36.1%) | 2 (3.4%) |
| Total | 97 (100.0%) | 59 (100.0%) |
Real Estate & Mortgages in Shiloh
Real Estate and Mortgage Overview in Shiloh
| Characteristic | Without Mortgage | With Mortgage |
| Housing Units | 52 | 45 |
| Median Property Value | $70,000 | $103,100 |
| Median Household Income | - | - |
| Monthly Housing Costs | $300 | $0 |
| Real Estate Taxes | $368 | $9 |
Property Value by Mortgage Status in Shiloh
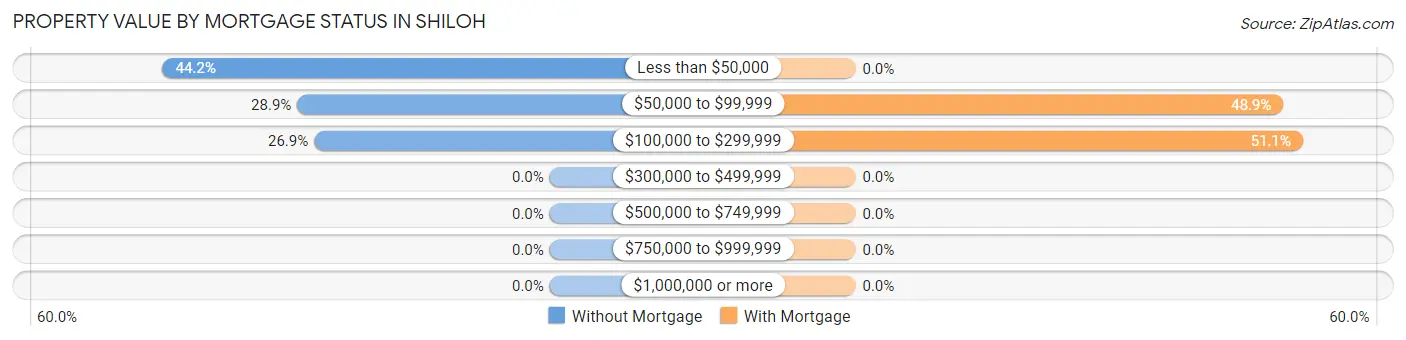
| Property Value | Without Mortgage | With Mortgage |
| Less than $50,000 | 23 (44.2%) | 0 (0.0%) |
| $50,000 to $99,999 | 15 (28.8%) | 22 (48.9%) |
| $100,000 to $299,999 | 14 (26.9%) | 23 (51.1%) |
| $300,000 to $499,999 | 0 (0.0%) | 0 (0.0%) |
| $500,000 to $749,999 | 0 (0.0%) | 0 (0.0%) |
| $750,000 to $999,999 | 0 (0.0%) | 0 (0.0%) |
| $1,000,000 or more | 0 (0.0%) | 0 (0.0%) |
| Total | 52 (100.0%) | 45 (100.0%) |
Household Income by Mortgage Status in Shiloh
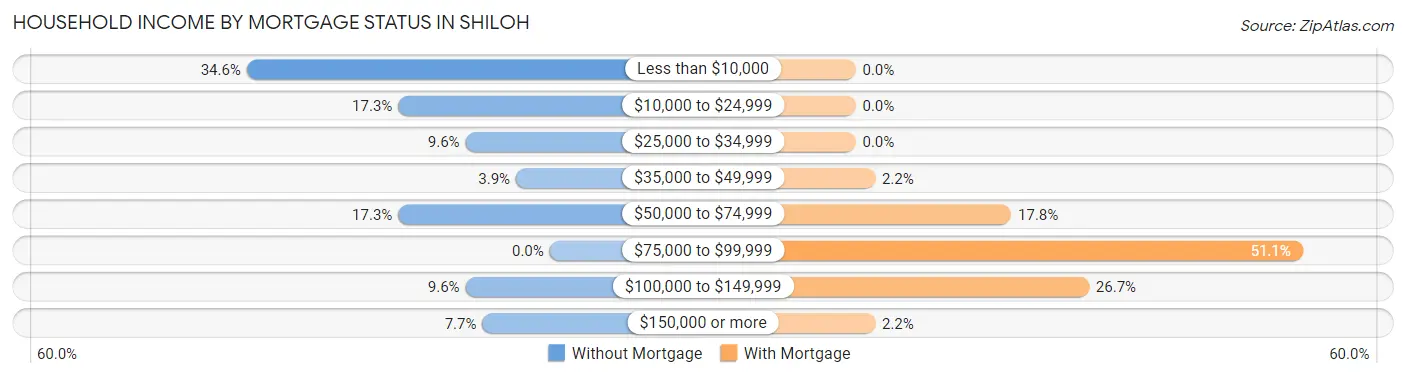
| Household Income | Without Mortgage | With Mortgage |
| Less than $10,000 | 18 (34.6%) | 0 (0.0%) |
| $10,000 to $24,999 | 9 (17.3%) | 0 (0.0%) |
| $25,000 to $34,999 | 5 (9.6%) | 0 (0.0%) |
| $35,000 to $49,999 | 2 (3.8%) | 1 (2.2%) |
| $50,000 to $74,999 | 9 (17.3%) | 8 (17.8%) |
| $75,000 to $99,999 | 0 (0.0%) | 23 (51.1%) |
| $100,000 to $149,999 | 5 (9.6%) | 12 (26.7%) |
| $150,000 or more | 4 (7.7%) | 1 (2.2%) |
| Total | 52 (100.0%) | 45 (100.0%) |
Property Value to Household Income Ratio in Shiloh
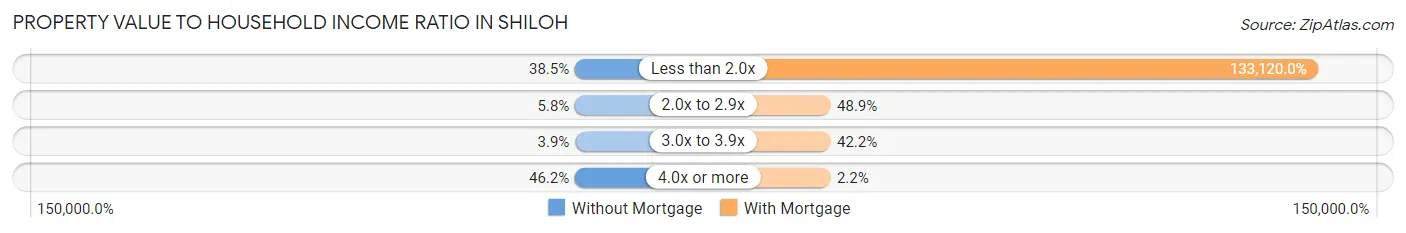
| Value-to-Income Ratio | Without Mortgage | With Mortgage |
| Less than 2.0x | 20 (38.5%) | 59,904 (133,120.0%) |
| 2.0x to 2.9x | 3 (5.8%) | 22 (48.9%) |
| 3.0x to 3.9x | 2 (3.8%) | 19 (42.2%) |
| 4.0x or more | 24 (46.2%) | 1 (2.2%) |
| Total | 52 (100.0%) | 45 (100.0%) |
Real Estate Taxes by Mortgage Status in Shiloh
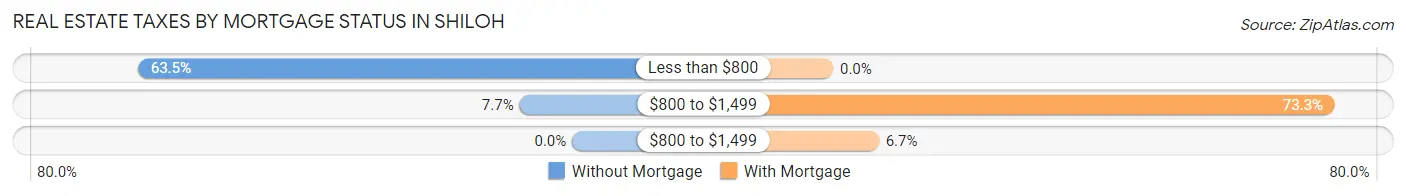
| Property Taxes | Without Mortgage | With Mortgage |
| Less than $800 | 33 (63.5%) | 0 (0.0%) |
| $800 to $1,499 | 4 (7.7%) | 33 (73.3%) |
| $800 to $1,499 | 0 (0.0%) | 3 (6.7%) |
| Total | 52 (100.0%) | 45 (100.0%) |
Health & Disability in Shiloh
Health Insurance Coverage by Age in Shiloh
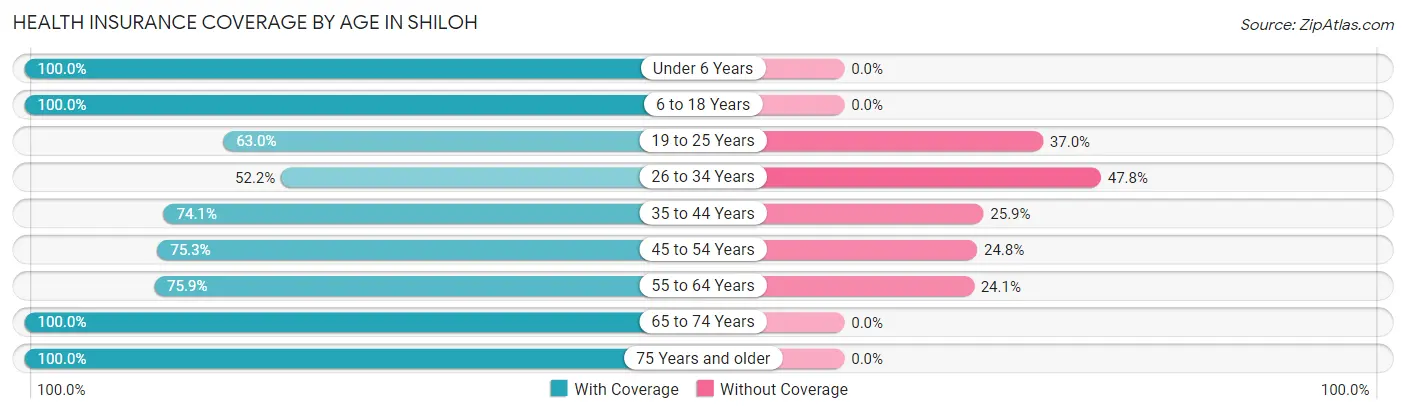
| Age Bracket | With Coverage | Without Coverage |
| Under 6 Years | 83 (100.0%) | 0 (0.0%) |
| 6 to 18 Years | 27 (100.0%) | 0 (0.0%) |
| 19 to 25 Years | 17 (63.0%) | 10 (37.0%) |
| 26 to 34 Years | 36 (52.2%) | 33 (47.8%) |
| 35 to 44 Years | 20 (74.1%) | 7 (25.9%) |
| 45 to 54 Years | 76 (75.2%) | 25 (24.7%) |
| 55 to 64 Years | 22 (75.9%) | 7 (24.1%) |
| 65 to 74 Years | 53 (100.0%) | 0 (0.0%) |
| 75 Years and older | 6 (100.0%) | 0 (0.0%) |
| Total | 340 (80.6%) | 82 (19.4%) |
Health Insurance Coverage by Citizenship Status in Shiloh
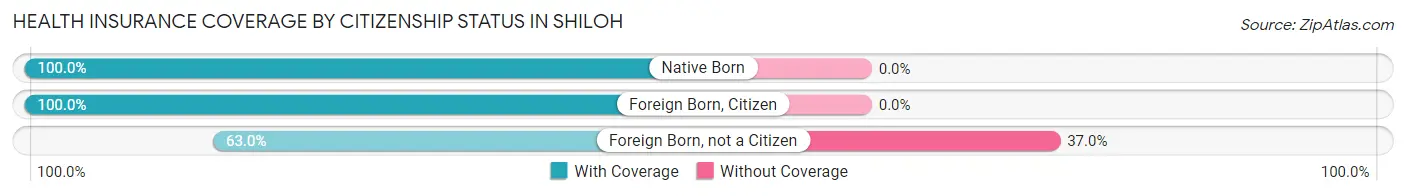
| Citizenship Status | With Coverage | Without Coverage |
| Native Born | 83 (100.0%) | 0 (0.0%) |
| Foreign Born, Citizen | 27 (100.0%) | 0 (0.0%) |
| Foreign Born, not a Citizen | 17 (63.0%) | 10 (37.0%) |
Health Insurance Coverage by Household Income in Shiloh
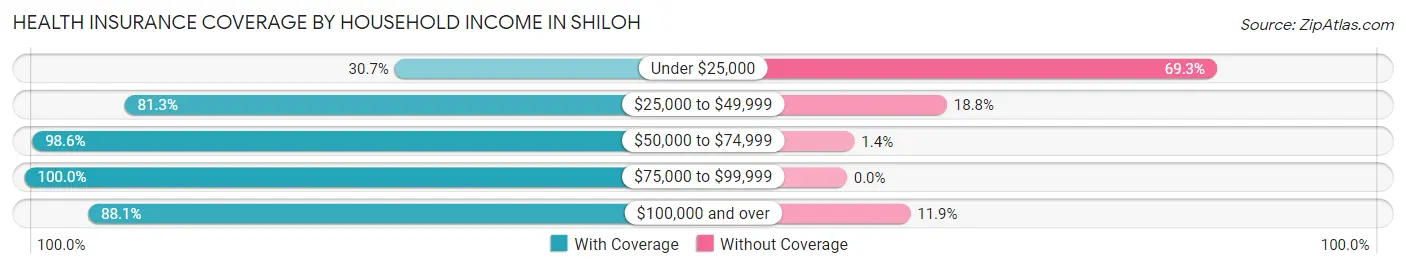
| Household Income | With Coverage | Without Coverage |
| Under $25,000 | 23 (30.7%) | 52 (69.3%) |
| $25,000 to $49,999 | 104 (81.2%) | 24 (18.8%) |
| $50,000 to $74,999 | 69 (98.6%) | 1 (1.4%) |
| $75,000 to $99,999 | 107 (100.0%) | 0 (0.0%) |
| $100,000 and over | 37 (88.1%) | 5 (11.9%) |
Public vs Private Health Insurance Coverage by Age in Shiloh
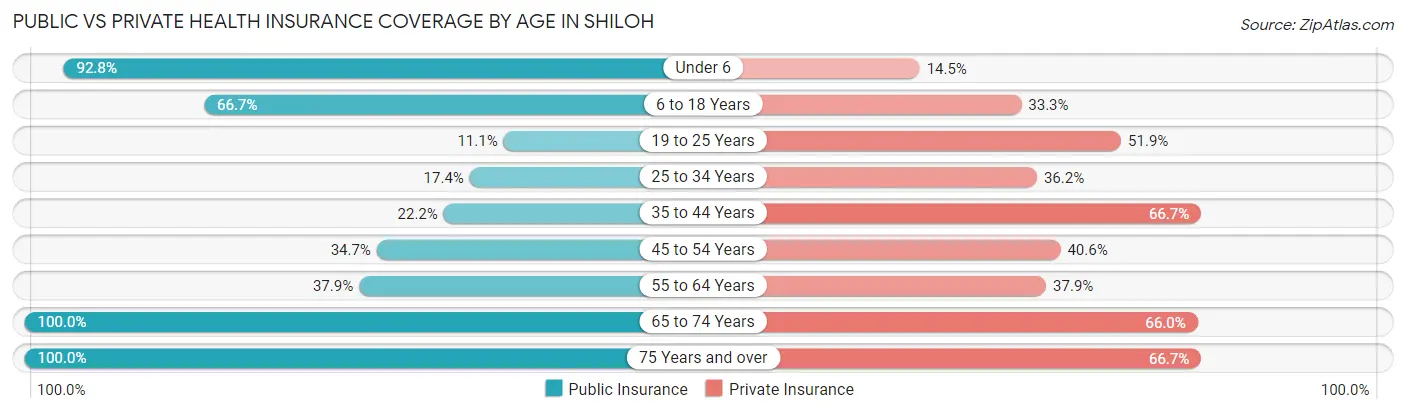
| Age Bracket | Public Insurance | Private Insurance |
| Under 6 | 77 (92.8%) | 12 (14.5%) |
| 6 to 18 Years | 18 (66.7%) | 9 (33.3%) |
| 19 to 25 Years | 3 (11.1%) | 14 (51.8%) |
| 25 to 34 Years | 12 (17.4%) | 25 (36.2%) |
| 35 to 44 Years | 6 (22.2%) | 18 (66.7%) |
| 45 to 54 Years | 35 (34.6%) | 41 (40.6%) |
| 55 to 64 Years | 11 (37.9%) | 11 (37.9%) |
| 65 to 74 Years | 53 (100.0%) | 35 (66.0%) |
| 75 Years and over | 6 (100.0%) | 4 (66.7%) |
| Total | 221 (52.4%) | 169 (40.1%) |
Disability Status by Sex by Age in Shiloh
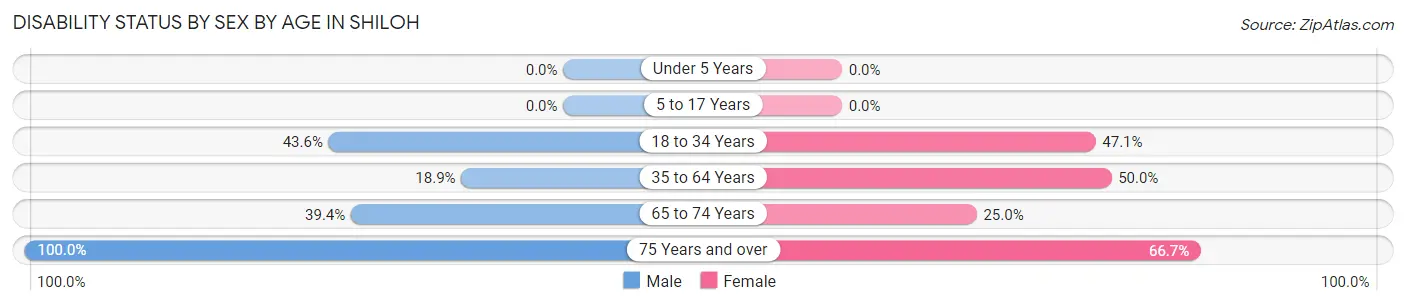
| Age Bracket | Male | Female |
| Under 5 Years | 0 (0.0%) | 0 (0.0%) |
| 5 to 17 Years | 0 (0.0%) | 0 (0.0%) |
| 18 to 34 Years | 27 (43.5%) | 16 (47.1%) |
| 35 to 64 Years | 7 (18.9%) | 60 (50.0%) |
| 65 to 74 Years | 13 (39.4%) | 5 (25.0%) |
| 75 Years and over | 3 (100.0%) | 2 (66.7%) |
Disability Class by Sex by Age in Shiloh
Disability Class: Hearing Difficulty
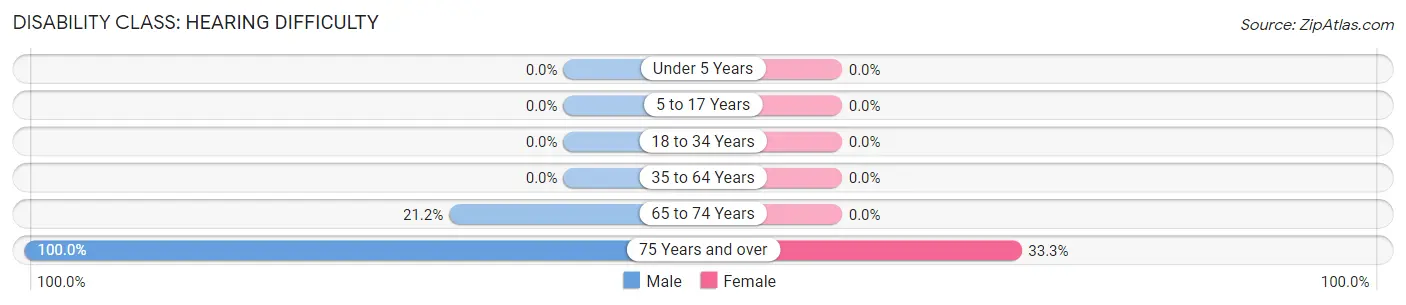
| Age Bracket | Male | Female |
| Under 5 Years | 0 (0.0%) | 0 (0.0%) |
| 5 to 17 Years | 0 (0.0%) | 0 (0.0%) |
| 18 to 34 Years | 0 (0.0%) | 0 (0.0%) |
| 35 to 64 Years | 0 (0.0%) | 0 (0.0%) |
| 65 to 74 Years | 7 (21.2%) | 0 (0.0%) |
| 75 Years and over | 3 (100.0%) | 1 (33.3%) |
Disability Class: Vision Difficulty
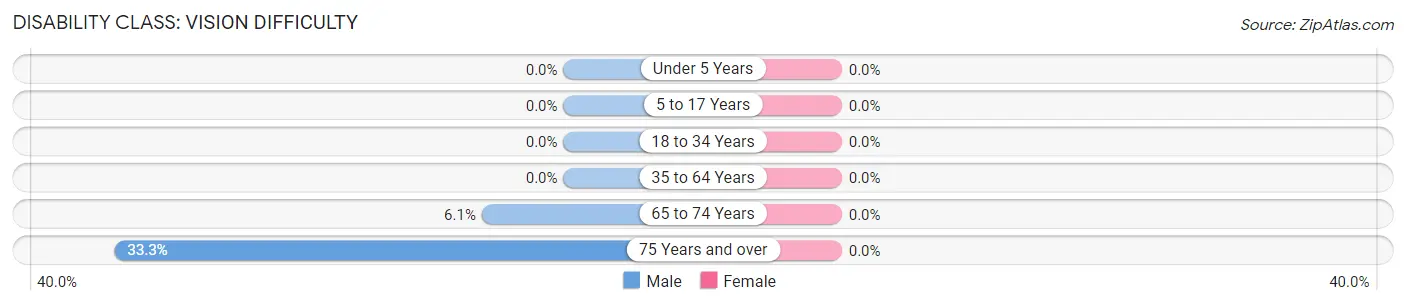
| Age Bracket | Male | Female |
| Under 5 Years | 0 (0.0%) | 0 (0.0%) |
| 5 to 17 Years | 0 (0.0%) | 0 (0.0%) |
| 18 to 34 Years | 0 (0.0%) | 0 (0.0%) |
| 35 to 64 Years | 0 (0.0%) | 0 (0.0%) |
| 65 to 74 Years | 2 (6.1%) | 0 (0.0%) |
| 75 Years and over | 1 (33.3%) | 0 (0.0%) |
Disability Class: Cognitive Difficulty
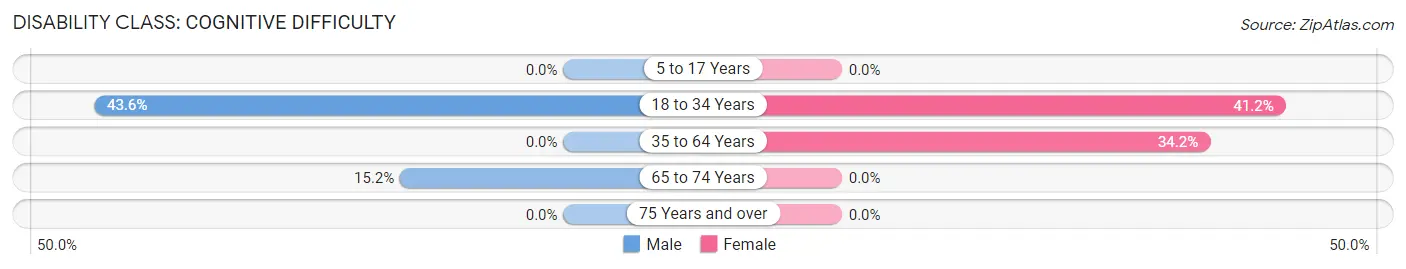
| Age Bracket | Male | Female |
| 5 to 17 Years | 0 (0.0%) | 0 (0.0%) |
| 18 to 34 Years | 27 (43.5%) | 14 (41.2%) |
| 35 to 64 Years | 0 (0.0%) | 41 (34.2%) |
| 65 to 74 Years | 5 (15.1%) | 0 (0.0%) |
| 75 Years and over | 0 (0.0%) | 0 (0.0%) |
Disability Class: Ambulatory Difficulty
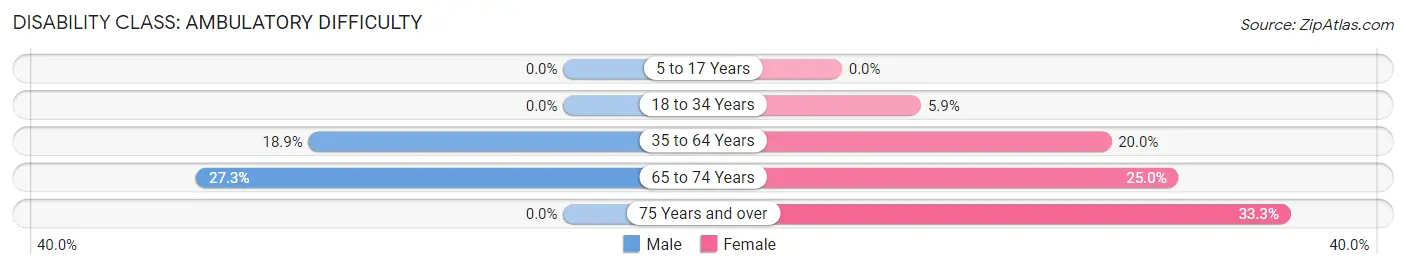
| Age Bracket | Male | Female |
| 5 to 17 Years | 0 (0.0%) | 0 (0.0%) |
| 18 to 34 Years | 0 (0.0%) | 2 (5.9%) |
| 35 to 64 Years | 7 (18.9%) | 24 (20.0%) |
| 65 to 74 Years | 9 (27.3%) | 5 (25.0%) |
| 75 Years and over | 0 (0.0%) | 1 (33.3%) |
Disability Class: Self-Care Difficulty
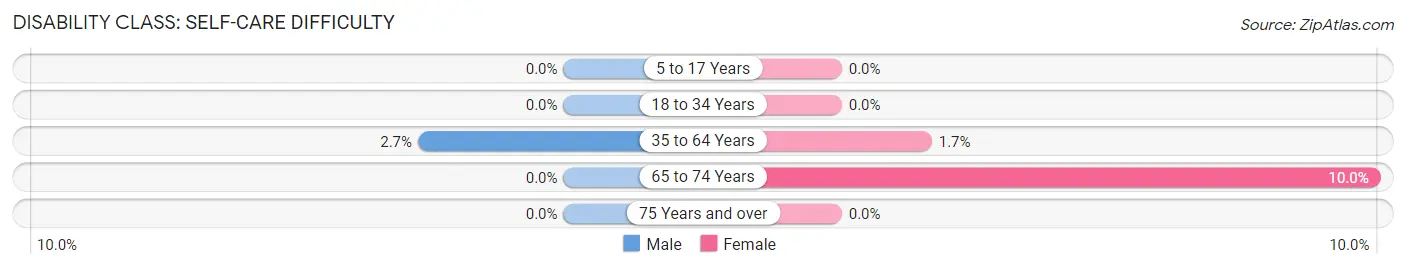
| Age Bracket | Male | Female |
| 5 to 17 Years | 0 (0.0%) | 0 (0.0%) |
| 18 to 34 Years | 0 (0.0%) | 0 (0.0%) |
| 35 to 64 Years | 1 (2.7%) | 2 (1.7%) |
| 65 to 74 Years | 0 (0.0%) | 2 (10.0%) |
| 75 Years and over | 0 (0.0%) | 0 (0.0%) |
Technology Access in Shiloh
Computing Device Access in Shiloh
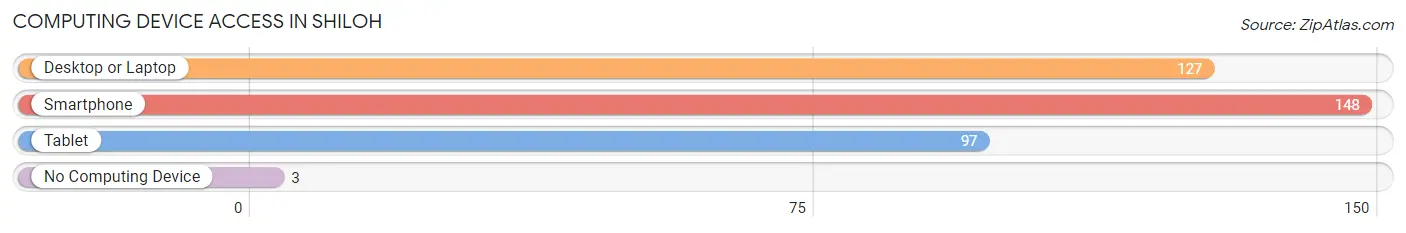
| Device Type | # Households | % Households |
| Desktop or Laptop | 127 | 81.4% |
| Smartphone | 148 | 94.9% |
| Tablet | 97 | 62.2% |
| No Computing Device | 3 | 1.9% |
| Total | 156 | 100.0% |
Internet Access in Shiloh
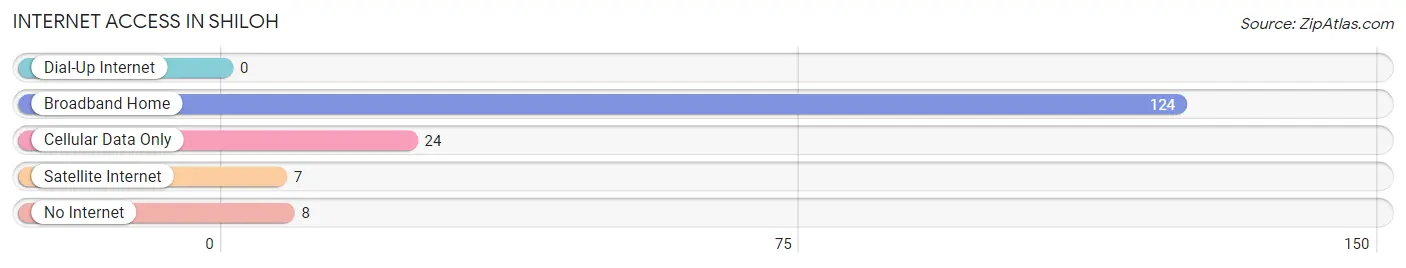
| Internet Type | # Households | % Households |
| Dial-Up Internet | 0 | 0.0% |
| Broadband Home | 124 | 79.5% |
| Cellular Data Only | 24 | 15.4% |
| Satellite Internet | 7 | 4.5% |
| No Internet | 8 | 5.1% |
| Total | 156 | 100.0% |
Shiloh Summary
Shiloh, Alabama is a small town located in the northwest corner of the state, near the Tennessee border. It is part of the Florence-Muscle Shoals Metropolitan Statistical Area and is home to approximately 1,000 people. The town was founded in 1819 and is named after the biblical city of Shiloh.
Geography
Shiloh is located in the northwest corner of Alabama, near the Tennessee border. It is situated in Lauderdale County, and is part of the Florence-Muscle Shoals Metropolitan Statistical Area. The town is located on the banks of the Tennessee River, and is surrounded by rolling hills and forests. The climate is humid subtropical, with hot summers and mild winters.
Economy
Shiloh’s economy is largely based on agriculture and manufacturing. The town is home to several small businesses, including a feed mill, a sawmill, and a furniture factory. The town also has a few retail stores, including a grocery store and a hardware store.
Demographics
As of the 2010 census, Shiloh had a population of 1,000 people. The racial makeup of the town was 97.2% White, 0.7% African American, 0.3% Native American, 0.2% Asian, 0.1% Pacific Islander, 0.7% from other races, and 0.9% from two or more races. Hispanic or Latino of any race were 1.2% of the population.
The median income for a household in Shiloh was $30,000, and the median income for a family was $35,000. The per capita income for the town was $15,000. About 15.7% of families and 18.2% of the population were below the poverty line, including 25.3% of those under age 18 and 10.7% of those age 65 or over.
History
Shiloh was founded in 1819 by settlers from North Carolina. The town was named after the biblical city of Shiloh, and was originally a farming community. In the late 19th century, the town began to grow as a result of the lumber industry. The town was incorporated in 1891, and the first mayor was elected in 1892.
In the early 20th century, Shiloh began to experience a period of growth and prosperity. The town was home to several factories, including a furniture factory and a sawmill. The town also had a number of retail stores, including a grocery store and a hardware store.
In the late 20th century, Shiloh began to experience a period of decline. The factories and stores began to close, and the population began to decline. In recent years, the town has begun to experience a resurgence, with new businesses opening and the population beginning to grow again.
Common Questions
What is the Total Population of Shiloh?
Total Population of Shiloh is 422.
What is the Total Male Population of Shiloh?
Total Male Population of Shiloh is 177.
What is the Total Female Population of Shiloh?
Total Female Population of Shiloh is 245.
What is the Ratio of Males per 100 Females in Shiloh?
There are 72.24 Males per 100 Females in Shiloh.
What is the Ratio of Females per 100 Males in Shiloh?
There are 138.42 Females per 100 Males in Shiloh.
What is the Median Population Age in Shiloh?
Median Population Age in Shiloh is 38.2 Years.
What is the Average Family Size in Shiloh
Average Family Size in Shiloh is 3.1 People.
What is the Average Household Size in Shiloh
Average Household Size in Shiloh is 2.7 People.
What is Per Capita Income in Shiloh?
Per Capita income in Shiloh is $22,561.
What is the Median Family Income in Shiloh?
Median Family Income in Shiloh is $72,917.
What is the Median Household income in Shiloh?
Median Household Income in Shiloh is $59,375.
What is Inequality or Gini Index in Shiloh?
Inequality or Gini Index in Shiloh is 0.35.
How Large is the Labor Force in Shiloh?
There are 148 People in the Labor Forcein in Shiloh.
What is the Percentage of People in the Labor Force in Shiloh?
46.4% of People are in the Labor Force in Shiloh.
What is the Unemployment Rate in Shiloh?
Unemployment Rate in Shiloh is 1.4%.