Pickensville, AL
Pickensville Map
Pickensville Overview
706
TOTAL POPULATION
380
MALE POPULATION
326
FEMALE POPULATION
116.56
MALES / 100 FEMALES
85.79
FEMALES / 100 MALES
48.6
MEDIAN AGE
2.6
AVG FAMILY SIZE
2.2
AVG HOUSEHOLD SIZE
$29,239
PER CAPITA INCOME
$61,615
AVG FAMILY INCOME
$45,926
AVG HOUSEHOLD INCOME
0.43
INEQUALITY / GINI INDEX
312
LABOR FORCE [ PEOPLE ]
47.3%
PERCENT IN LABOR FORCE
4.2%
UNEMPLOYMENT RATE
Pickensville Area Codes
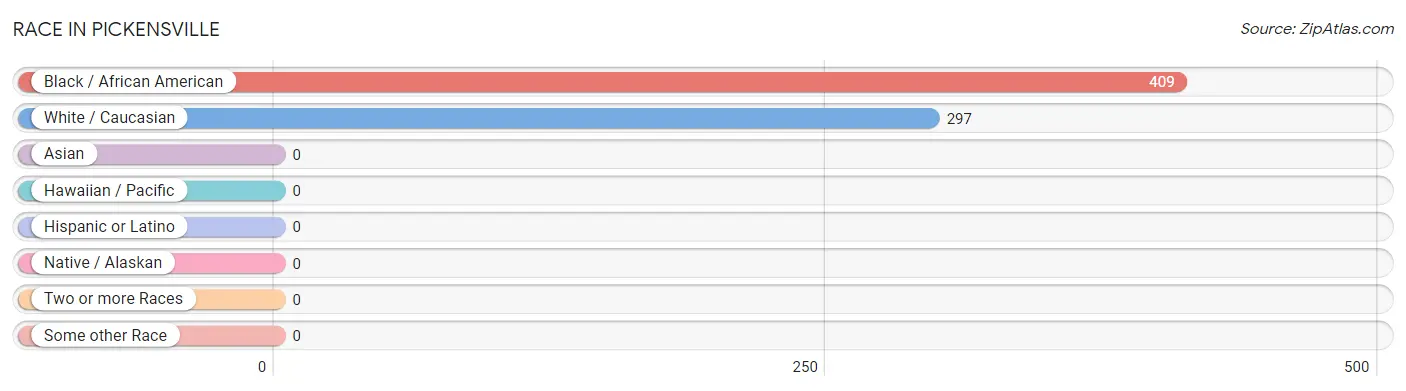
Race in Pickensville
The most populous races in Pickensville are Black / African American (409 | 57.9%), and White / Caucasian (297 | 42.1%).
| Race | # Population | % Population |
| Asian | 0 | 0.0% |
| Black / African American | 409 | 57.9% |
| Hawaiian / Pacific | 0 | 0.0% |
| Hispanic or Latino | 0 | 0.0% |
| Native / Alaskan | 0 | 0.0% |
| White / Caucasian | 297 | 42.1% |
| Two or more Races | 0 | 0.0% |
| Some other Race | 0 | 0.0% |
| Total | 706 | 100.0% |
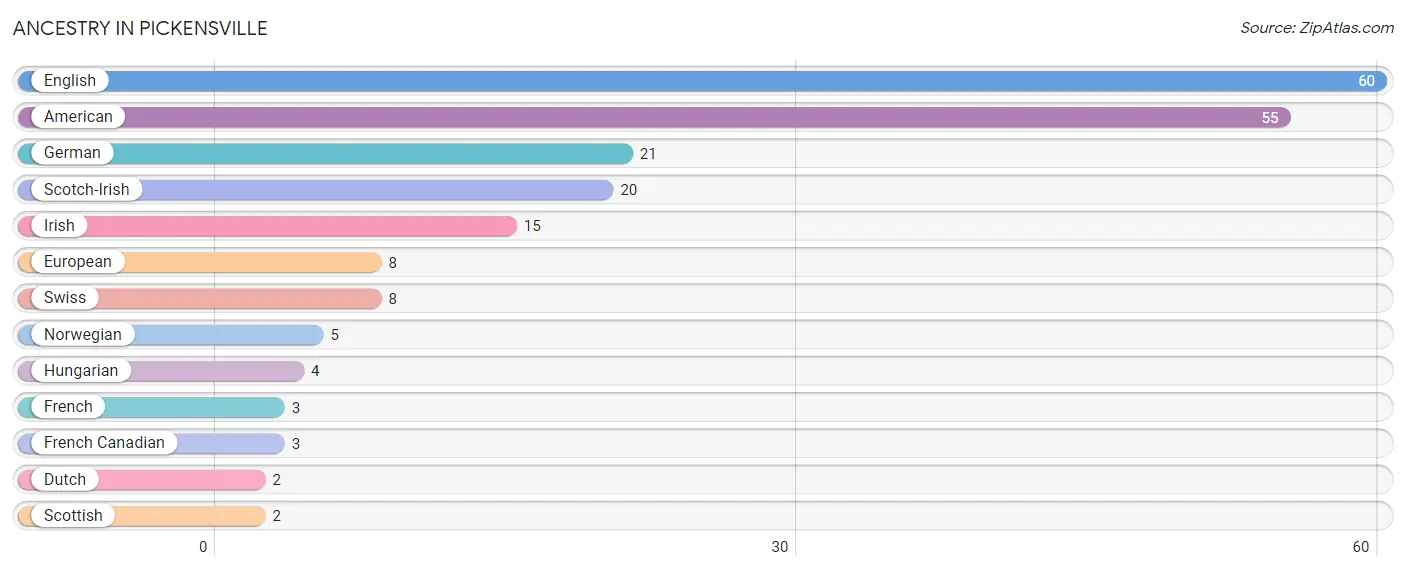
Ancestry in Pickensville
The most populous ancestries reported in Pickensville are English (60 | 8.5%), American (55 | 7.8%), German (21 | 3.0%), Scotch-Irish (20 | 2.8%), and Irish (15 | 2.1%), together accounting for 24.2% of all Pickensville residents.
| Ancestry | # Population | % Population |
| American | 55 | 7.8% |
| Dutch | 2 | 0.3% |
| English | 60 | 8.5% |
| European | 8 | 1.1% |
| French | 3 | 0.4% |
| French Canadian | 3 | 0.4% |
| German | 21 | 3.0% |
| Hungarian | 4 | 0.6% |
| Irish | 15 | 2.1% |
| Norwegian | 5 | 0.7% |
| Scotch-Irish | 20 | 2.8% |
| Scottish | 2 | 0.3% |
| Swiss | 8 | 1.1% | View All 13 Rows |
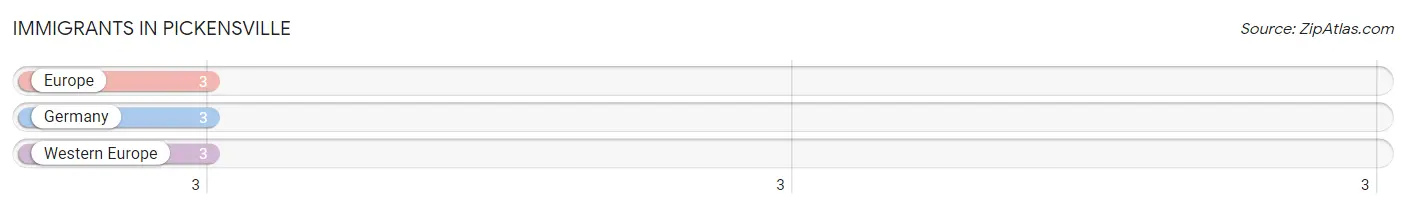
Immigrants in Pickensville
The most numerous immigrant groups reported in Pickensville came from Europe (3 | 0.4%), Germany (3 | 0.4%), and Western Europe (3 | 0.4%), together accounting for 1.3% of all Pickensville residents.
| Immigration Origin | # Population | % Population |
| Europe | 3 | 0.4% |
| Germany | 3 | 0.4% |
| Western Europe | 3 | 0.4% | View All 3 Rows |
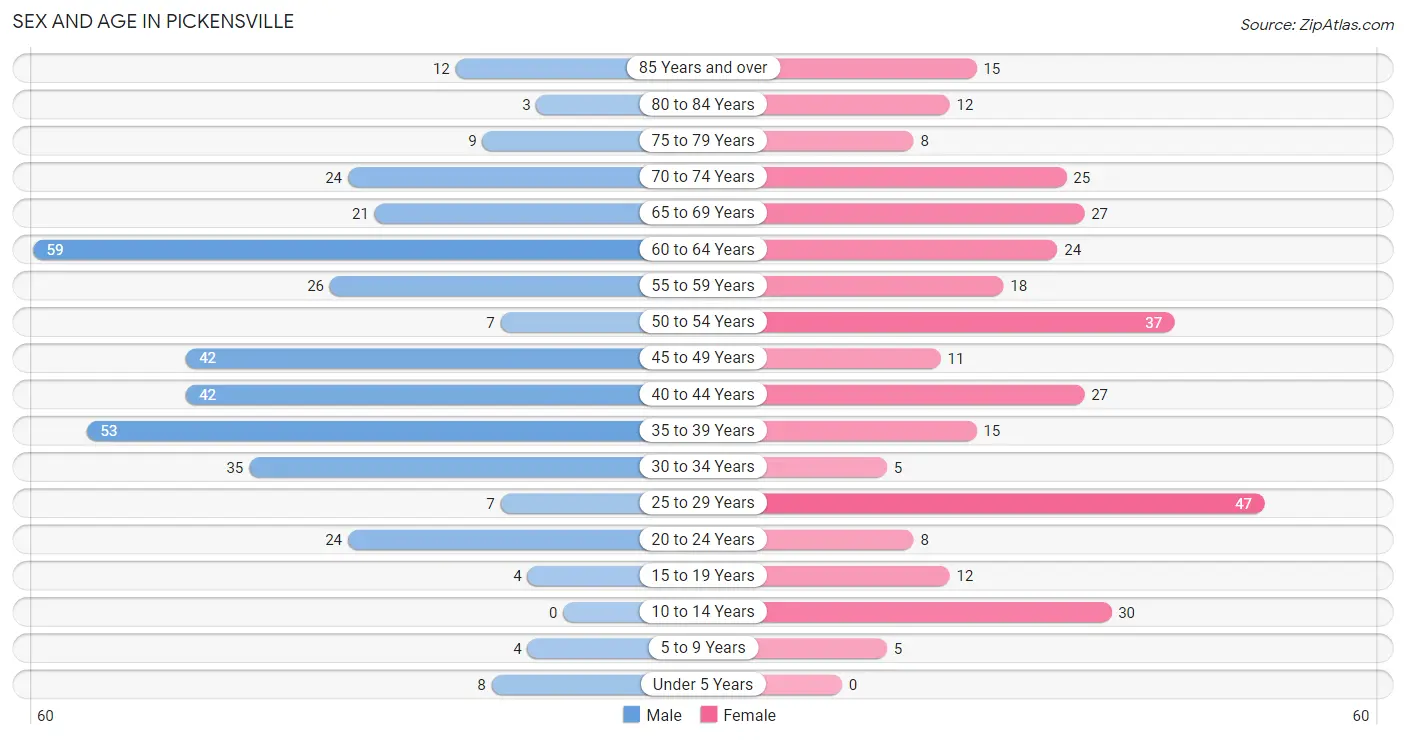
Sex and Age in Pickensville
Sex and Age in Pickensville
The most populous age groups in Pickensville are 60 to 64 Years (59 | 15.5%) for men and 25 to 29 Years (47 | 14.4%) for women.
| Age Bracket | Male | Female |
| Under 5 Years | 8 (2.1%) | 0 (0.0%) |
| 5 to 9 Years | 4 (1.1%) | 5 (1.5%) |
| 10 to 14 Years | 0 (0.0%) | 30 (9.2%) |
| 15 to 19 Years | 4 (1.1%) | 12 (3.7%) |
| 20 to 24 Years | 24 (6.3%) | 8 (2.5%) |
| 25 to 29 Years | 7 (1.8%) | 47 (14.4%) |
| 30 to 34 Years | 35 (9.2%) | 5 (1.5%) |
| 35 to 39 Years | 53 (14.0%) | 15 (4.6%) |
| 40 to 44 Years | 42 (11.1%) | 27 (8.3%) |
| 45 to 49 Years | 42 (11.1%) | 11 (3.4%) |
| 50 to 54 Years | 7 (1.8%) | 37 (11.4%) |
| 55 to 59 Years | 26 (6.8%) | 18 (5.5%) |
| 60 to 64 Years | 59 (15.5%) | 24 (7.4%) |
| 65 to 69 Years | 21 (5.5%) | 27 (8.3%) |
| 70 to 74 Years | 24 (6.3%) | 25 (7.7%) |
| 75 to 79 Years | 9 (2.4%) | 8 (2.5%) |
| 80 to 84 Years | 3 (0.8%) | 12 (3.7%) |
| 85 Years and over | 12 (3.2%) | 15 (4.6%) |
| Total | 380 (100.0%) | 326 (100.0%) |
Families and Households in Pickensville
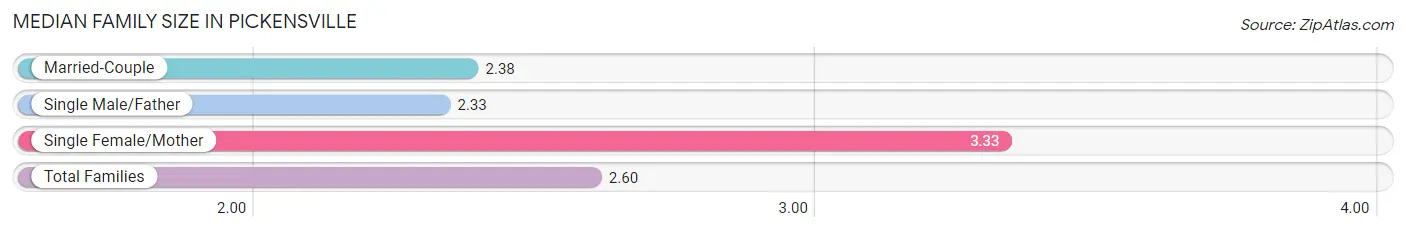
Median Family Size in Pickensville
The median family size in Pickensville is 2.60 persons per family, with single female/mother families (46 | 23.6%) accounting for the largest median family size of 3.33 persons per family. On the other hand, single male/father families (3 | 1.5%) represent the smallest median family size with 2.33 persons per family.
| Family Type | # Families | Family Size |
| Married-Couple | 146 (74.9%) | 2.38 |
| Single Male/Father | 3 (1.5%) | 2.33 |
| Single Female/Mother | 46 (23.6%) | 3.33 |
| Total Families | 195 (100.0%) | 2.60 |
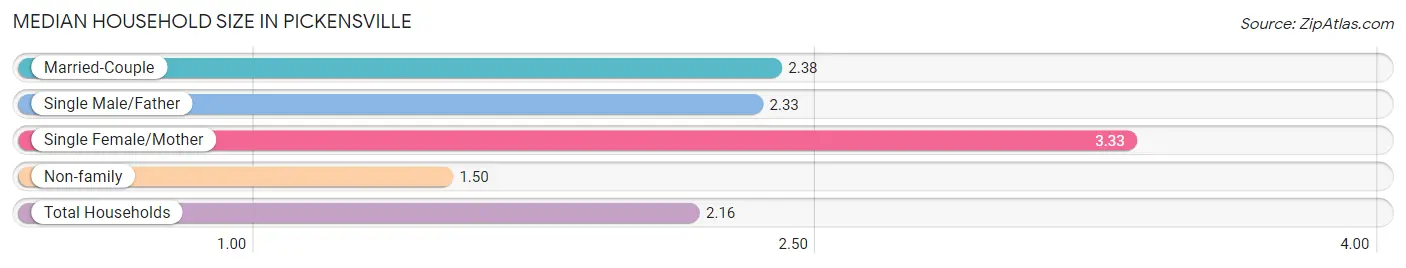
Median Household Size in Pickensville
The median household size in Pickensville is 2.16 persons per household, with single female/mother households (46 | 14.1%) accounting for the largest median household size of 3.33 persons per household. non-family households (131 | 40.2%) represent the smallest median household size with 1.50 persons per household.
| Household Type | # Households | Household Size |
| Married-Couple | 146 (44.8%) | 2.38 |
| Single Male/Father | 3 (0.9%) | 2.33 |
| Single Female/Mother | 46 (14.1%) | 3.33 |
| Non-family | 131 (40.2%) | 1.50 |
| Total Households | 326 (100.0%) | 2.16 |
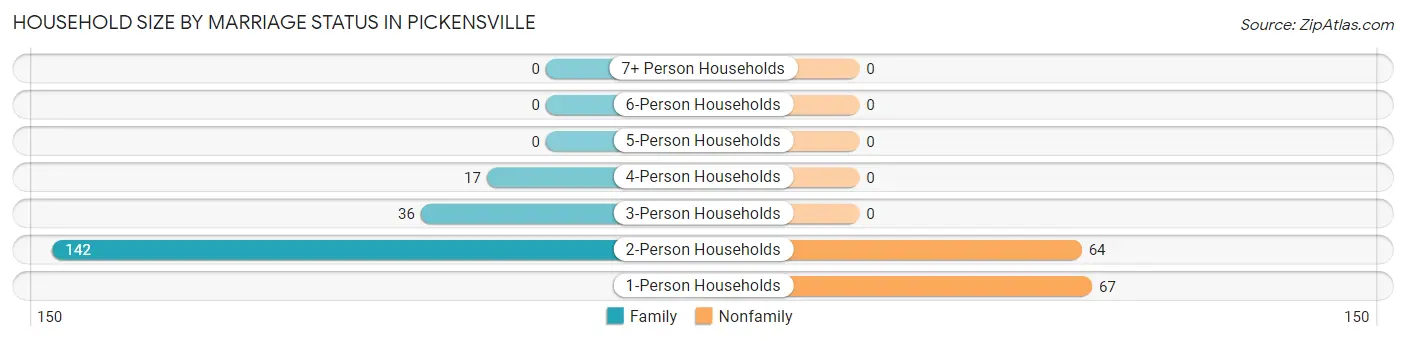
Household Size by Marriage Status in Pickensville
Out of a total of 326 households in Pickensville, 195 (59.8%) are family households, while 131 (40.2%) are nonfamily households. The most numerous type of family households are 2-person households, comprising 142, and the most common type of nonfamily households are 1-person households, comprising 67.
| Household Size | Family Households | Nonfamily Households |
| 1-Person Households | - | 67 (20.5%) |
| 2-Person Households | 142 (43.6%) | 64 (19.6%) |
| 3-Person Households | 36 (11.0%) | 0 (0.0%) |
| 4-Person Households | 17 (5.2%) | 0 (0.0%) |
| 5-Person Households | 0 (0.0%) | 0 (0.0%) |
| 6-Person Households | 0 (0.0%) | 0 (0.0%) |
| 7+ Person Households | 0 (0.0%) | 0 (0.0%) |
| Total | 195 (59.8%) | 131 (40.2%) |
Female Fertility in Pickensville
Fertility by Age in Pickensville
| Age Bracket | Women with Births | Births / 1,000 Women |
| 15 to 19 years | 0 (0.0%) | 0.0 |
| 20 to 34 years | 0 (0.0%) | 0.0 |
| 35 to 50 years | 0 (0.0%) | 0.0 |
| Total | 0 (0.0%) | 0.0 |
Fertility by Age by Marriage Status in Pickensville
| Age Bracket | Married | Unmarried |
| 15 to 19 years | 0 (0.0%) | 0 (0.0%) |
| 20 to 34 years | 0 (0.0%) | 0 (0.0%) |
| 35 to 50 years | 0 (0.0%) | 0 (0.0%) |
| Total | 0 (0.0%) | 0 (0.0%) |
Fertility by Education in Pickensville
| Educational Attainment | Women with Births | Births / 1,000 Women |
| Less than High School | 0 (0.0%) | 0.0 |
| High School Diploma | 0 (0.0%) | 0.0 |
| College or Associate's Degree | 0 (0.0%) | 0.0 |
| Bachelor's Degree | 0 (0.0%) | 0.0 |
| Graduate Degree | 0 (0.0%) | 0.0 |
| Total | 0 (0.0%) | 0.0 |
Fertility by Education by Marriage Status in Pickensville
| Educational Attainment | Married | Unmarried |
| Less than High School | 0 (0.0%) | 0 (0.0%) |
| High School Diploma | 0 (0.0%) | 0 (0.0%) |
| College or Associate's Degree | 0 (0.0%) | 0 (0.0%) |
| Bachelor's Degree | 0 (0.0%) | 0 (0.0%) |
| Graduate Degree | 0 (0.0%) | 0 (0.0%) |
| Total | 0 (0.0%) | 0 (0.0%) |
Income in Pickensville
Income Overview in Pickensville
Per Capita Income in Pickensville is $29,239, while median incomes of families and households are $61,615 and $45,926 respectively.
| Characteristic | Number | Measure |
| Per Capita Income | 706 | $29,239 |
| Median Family Income | 195 | $61,615 |
| Mean Family Income | 195 | $79,983 |
| Median Household Income | 326 | $45,926 |
| Mean Household Income | 326 | $59,023 |
| Income Deficit | 195 | $0 |
| Wage / Income Gap (%) | 706 | 0.00% |
| Wage / Income Gap ($) | 706 | 100.00¢ per $1 |
| Gini / Inequality Index | 706 | 0.43 |
Earnings by Sex in Pickensville
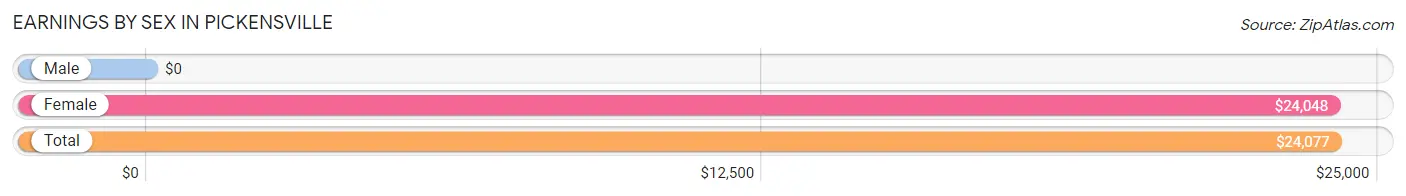
| Sex | Number | Average Earnings |
| Male | 215 (58.6%) | $0 |
| Female | 152 (41.4%) | $24,048 |
| Total | 367 (100.0%) | $24,077 |
Earnings by Sex by Income Bracket in Pickensville
The most common earnings brackets in Pickensville are $100,000+ for men (62 | 28.8%) and $22,500 to $24,999 for women (42 | 27.6%).
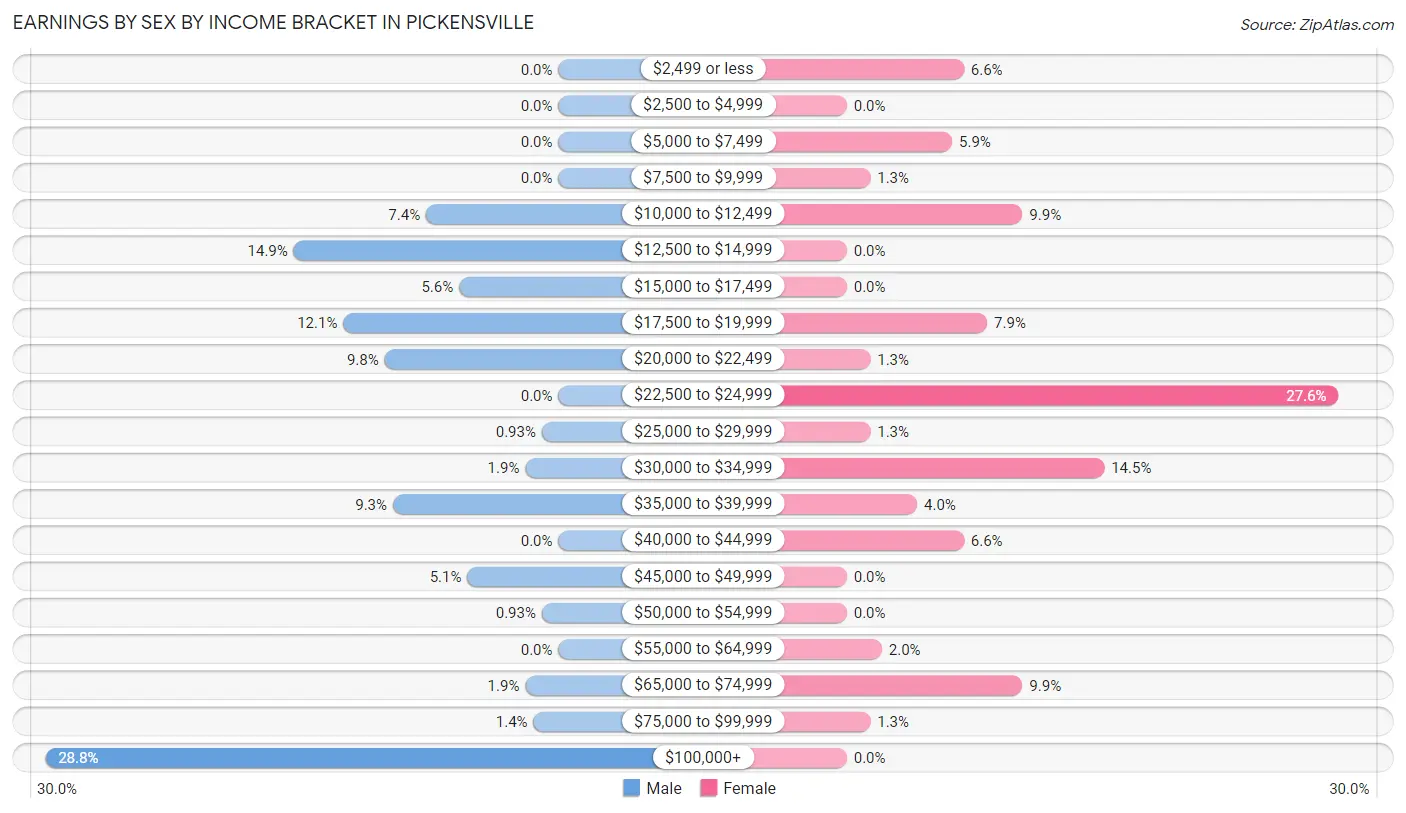
| Income | Male | Female |
| $2,499 or less | 0 (0.0%) | 10 (6.6%) |
| $2,500 to $4,999 | 0 (0.0%) | 0 (0.0%) |
| $5,000 to $7,499 | 0 (0.0%) | 9 (5.9%) |
| $7,500 to $9,999 | 0 (0.0%) | 2 (1.3%) |
| $10,000 to $12,499 | 16 (7.4%) | 15 (9.9%) |
| $12,500 to $14,999 | 32 (14.9%) | 0 (0.0%) |
| $15,000 to $17,499 | 12 (5.6%) | 0 (0.0%) |
| $17,500 to $19,999 | 26 (12.1%) | 12 (7.9%) |
| $20,000 to $22,499 | 21 (9.8%) | 2 (1.3%) |
| $22,500 to $24,999 | 0 (0.0%) | 42 (27.6%) |
| $25,000 to $29,999 | 2 (0.9%) | 2 (1.3%) |
| $30,000 to $34,999 | 4 (1.9%) | 22 (14.5%) |
| $35,000 to $39,999 | 20 (9.3%) | 6 (4.0%) |
| $40,000 to $44,999 | 0 (0.0%) | 10 (6.6%) |
| $45,000 to $49,999 | 11 (5.1%) | 0 (0.0%) |
| $50,000 to $54,999 | 2 (0.9%) | 0 (0.0%) |
| $55,000 to $64,999 | 0 (0.0%) | 3 (2.0%) |
| $65,000 to $74,999 | 4 (1.9%) | 15 (9.9%) |
| $75,000 to $99,999 | 3 (1.4%) | 2 (1.3%) |
| $100,000+ | 62 (28.8%) | 0 (0.0%) |
| Total | 215 (100.0%) | 152 (100.0%) |
Earnings by Sex by Educational Attainment in Pickensville
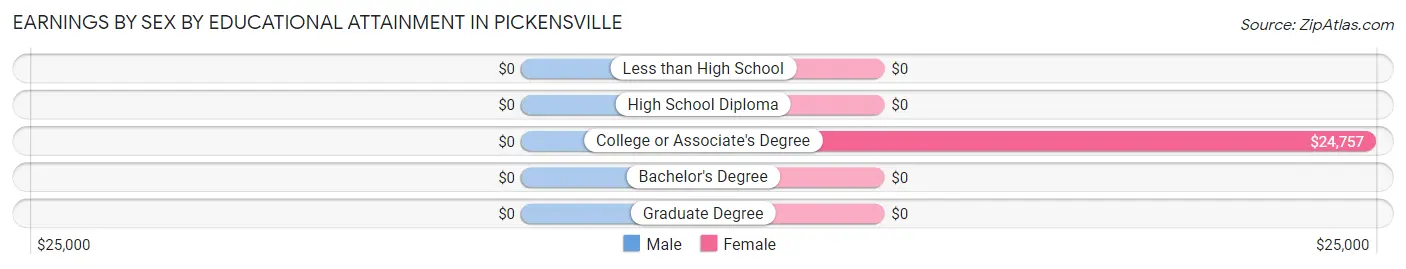
| Educational Attainment | Male Income | Female Income |
| Less than High School | - | - |
| High School Diploma | - | - |
| College or Associate's Degree | - | - |
| Bachelor's Degree | - | - |
| Graduate Degree | - | - |
| Total | $38,313 | $24,286 |
Family Income in Pickensville
Family Income Brackets in Pickensville
According to the Pickensville family income data, there are 45 families falling into the $50,000 to $74,999 income range, which is the most common income bracket and makes up 23.1% of all families.
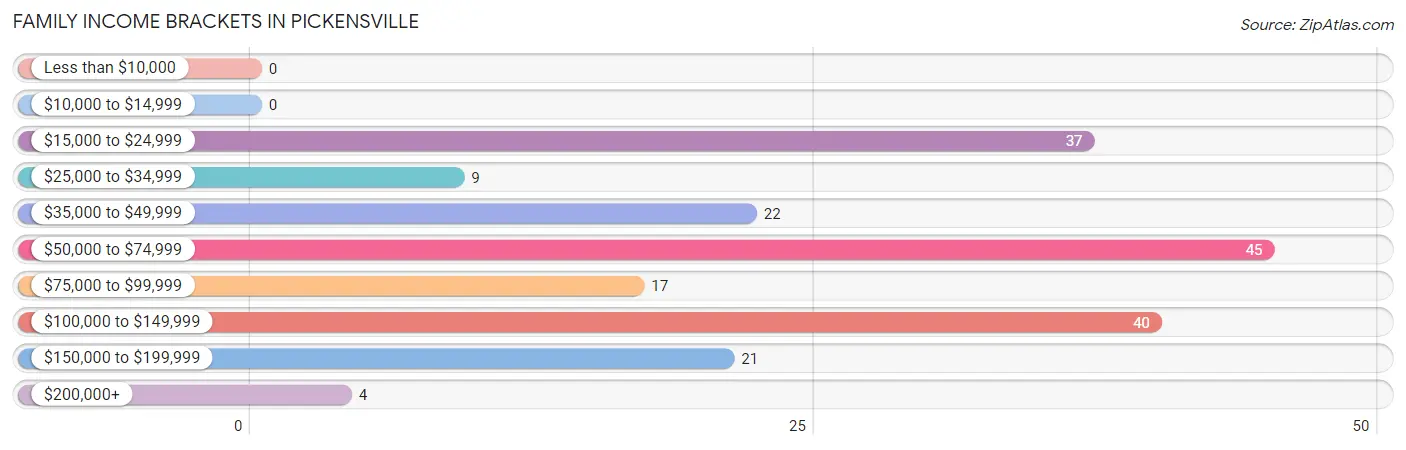
| Income Bracket | # Families | % Families |
| Less than $10,000 | 0 | 0.0% |
| $10,000 to $14,999 | 0 | 0.0% |
| $15,000 to $24,999 | 37 | 19.0% |
| $25,000 to $34,999 | 9 | 4.6% |
| $35,000 to $49,999 | 22 | 11.3% |
| $50,000 to $74,999 | 45 | 23.1% |
| $75,000 to $99,999 | 17 | 8.7% |
| $100,000 to $149,999 | 40 | 20.5% |
| $150,000 to $199,999 | 21 | 10.8% |
| $200,000+ | 4 | 2.1% |
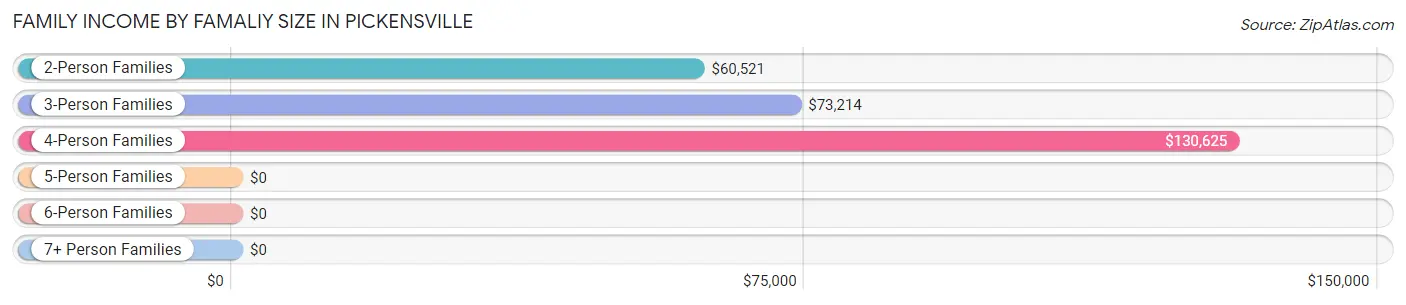
Family Income by Famaliy Size in Pickensville
4-person families (17 | 8.7%) account for the highest median family income in Pickensville with $130,625 per family, while 4-person families (17 | 8.7%) have the highest median income of $32,656 per family member.
| Income Bracket | # Families | Median Income |
| 2-Person Families | 142 (72.8%) | $60,521 |
| 3-Person Families | 36 (18.5%) | $73,214 |
| 4-Person Families | 17 (8.7%) | $130,625 |
| 5-Person Families | 0 (0.0%) | $0 |
| 6-Person Families | 0 (0.0%) | $0 |
| 7+ Person Families | 0 (0.0%) | $0 |
| Total | 195 (100.0%) | $61,615 |
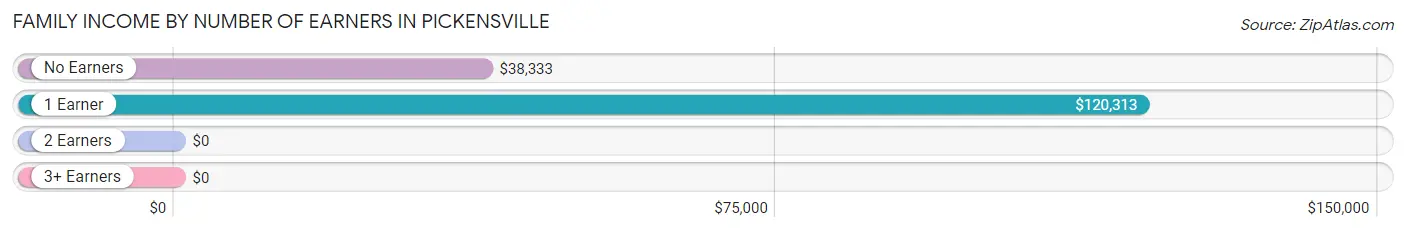
Family Income by Number of Earners in Pickensville
| Number of Earners | # Families | Median Income |
| No Earners | 60 (30.8%) | $38,333 |
| 1 Earner | 31 (15.9%) | $120,313 |
| 2 Earners | 101 (51.8%) | $0 |
| 3+ Earners | 3 (1.5%) | $0 |
| Total | 195 (100.0%) | $61,615 |
Household Income in Pickensville
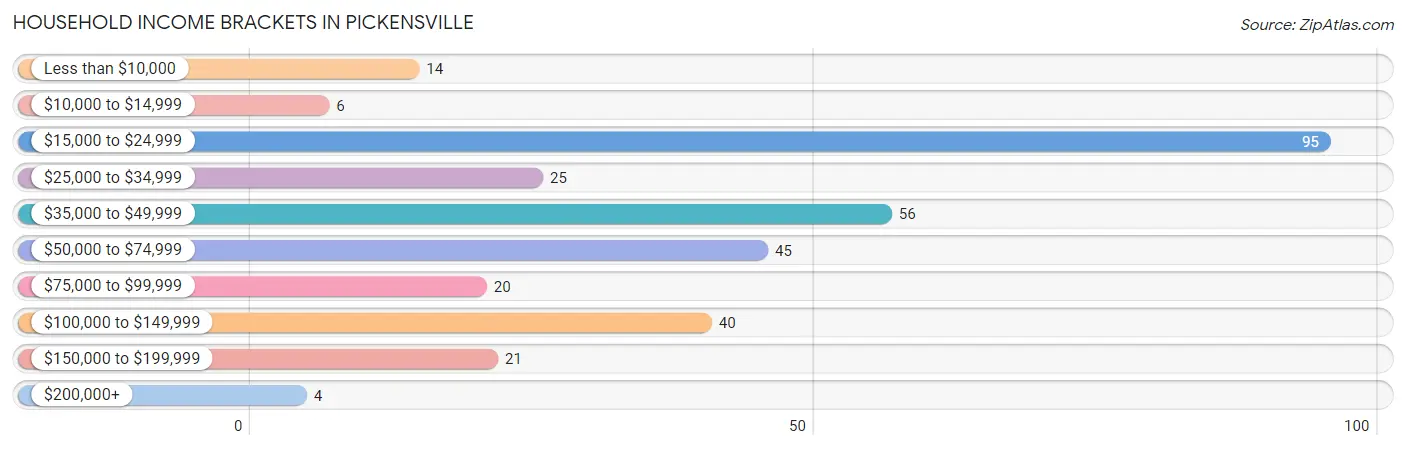
Household Income Brackets in Pickensville
With 95 households falling in the category, the $15,000 to $24,999 income range is the most frequent in Pickensville, accounting for 29.1% of all households. In contrast, only 4 households (1.2%) fall into the $200,000+ income bracket, making it the least populous group.
| Income Bracket | # Households | % Households |
| Less than $10,000 | 14 | 4.3% |
| $10,000 to $14,999 | 6 | 1.8% |
| $15,000 to $24,999 | 95 | 29.1% |
| $25,000 to $34,999 | 25 | 7.7% |
| $35,000 to $49,999 | 56 | 17.2% |
| $50,000 to $74,999 | 45 | 13.8% |
| $75,000 to $99,999 | 20 | 6.1% |
| $100,000 to $149,999 | 40 | 12.3% |
| $150,000 to $199,999 | 21 | 6.4% |
| $200,000+ | 4 | 1.2% |
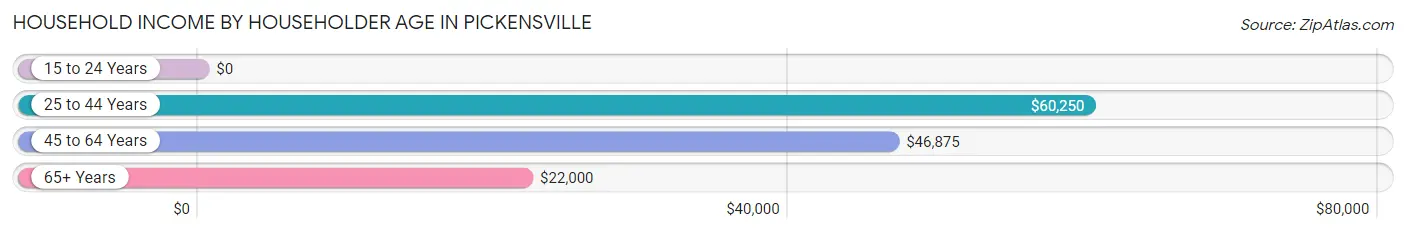
Household Income by Householder Age in Pickensville
The median household income in Pickensville is $45,926, with the highest median household income of $60,250 found in the 25 to 44 years age bracket for the primary householder. A total of 104 households (31.9%) fall into this category. Meanwhile, the 15 to 24 years age bracket for the primary householder has the lowest median household income of $0, with 3 households (0.9%) in this group.
| Income Bracket | # Households | Median Income |
| 15 to 24 Years | 3 (0.9%) | $0 |
| 25 to 44 Years | 104 (31.9%) | $60,250 |
| 45 to 64 Years | 121 (37.1%) | $46,875 |
| 65+ Years | 98 (30.1%) | $22,000 |
| Total | 326 (100.0%) | $45,926 |
Poverty in Pickensville
Income Below Poverty by Sex and Age in Pickensville
With 26.8% poverty level for males and 14.8% for females among the residents of Pickensville, 35 to 44 year old males and 18 to 24 year old females are the most vulnerable to poverty, with 78 males (82.1%) and 12 females (60.0%) in their respective age groups living below the poverty level.
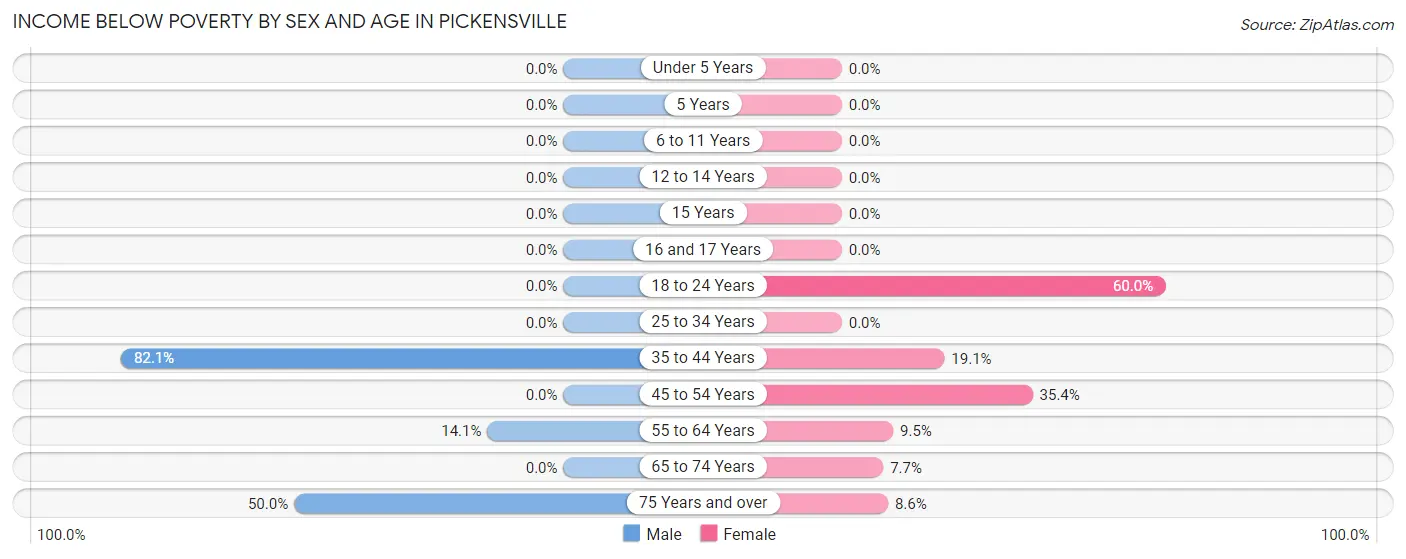
| Age Bracket | Male | Female |
| Under 5 Years | 0 (0.0%) | 0 (0.0%) |
| 5 Years | 0 (0.0%) | 0 (0.0%) |
| 6 to 11 Years | 0 (0.0%) | 0 (0.0%) |
| 12 to 14 Years | 0 (0.0%) | 0 (0.0%) |
| 15 Years | 0 (0.0%) | 0 (0.0%) |
| 16 and 17 Years | 0 (0.0%) | 0 (0.0%) |
| 18 to 24 Years | 0 (0.0%) | 12 (60.0%) |
| 25 to 34 Years | 0 (0.0%) | 0 (0.0%) |
| 35 to 44 Years | 78 (82.1%) | 8 (19.1%) |
| 45 to 54 Years | 0 (0.0%) | 17 (35.4%) |
| 55 to 64 Years | 12 (14.1%) | 4 (9.5%) |
| 65 to 74 Years | 0 (0.0%) | 4 (7.7%) |
| 75 Years and over | 12 (50.0%) | 3 (8.6%) |
| Total | 102 (26.8%) | 48 (14.8%) |
Income Above Poverty by Sex and Age in Pickensville
According to the poverty statistics in Pickensville, males aged under 5 years and females aged 6 to 11 years are the age groups that are most secure financially, with 100.0% of males and 100.0% of females in these age groups living above the poverty line.
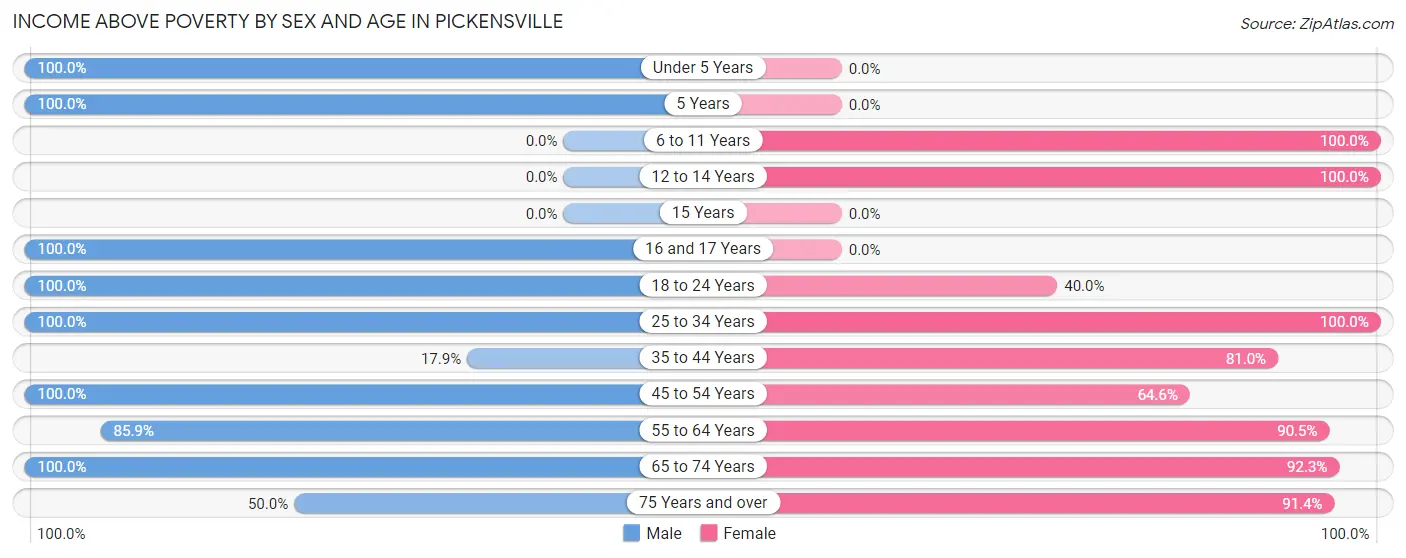
| Age Bracket | Male | Female |
| Under 5 Years | 8 (100.0%) | 0 (0.0%) |
| 5 Years | 4 (100.0%) | 0 (0.0%) |
| 6 to 11 Years | 0 (0.0%) | 12 (100.0%) |
| 12 to 14 Years | 0 (0.0%) | 23 (100.0%) |
| 15 Years | 0 (0.0%) | 0 (0.0%) |
| 16 and 17 Years | 3 (100.0%) | 0 (0.0%) |
| 18 to 24 Years | 25 (100.0%) | 8 (40.0%) |
| 25 to 34 Years | 42 (100.0%) | 50 (100.0%) |
| 35 to 44 Years | 17 (17.9%) | 34 (80.9%) |
| 45 to 54 Years | 49 (100.0%) | 31 (64.6%) |
| 55 to 64 Years | 73 (85.9%) | 38 (90.5%) |
| 65 to 74 Years | 45 (100.0%) | 48 (92.3%) |
| 75 Years and over | 12 (50.0%) | 32 (91.4%) |
| Total | 278 (73.2%) | 276 (85.2%) |
Income Below Poverty Among Married-Couple Families in Pickensville
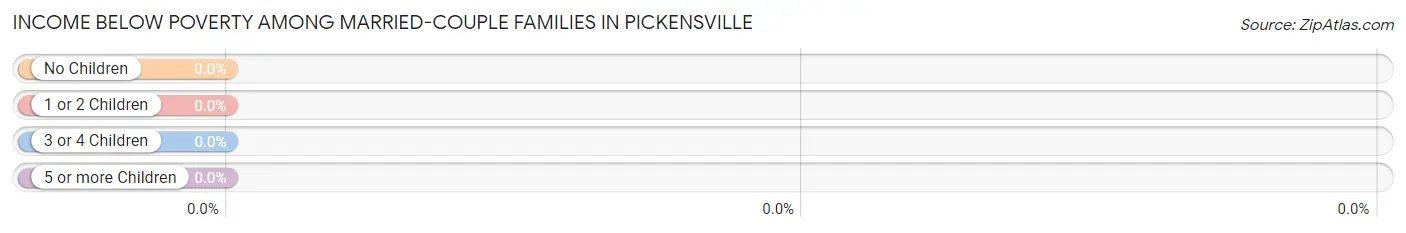
| Children | Above Poverty | Below Poverty |
| No Children | 130 (100.0%) | 0 (0.0%) |
| 1 or 2 Children | 16 (100.0%) | 0 (0.0%) |
| 3 or 4 Children | 0 (0.0%) | 0 (0.0%) |
| 5 or more Children | 0 (0.0%) | 0 (0.0%) |
| Total | 146 (100.0%) | 0 (0.0%) |
Income Below Poverty Among Single-Parent Households in Pickensville
According to the poverty data in Pickensville, 100.0% or 3 single-father households and 37.0% or 17 single-mother households are living below the poverty line. Among single-father households, those with no children have the highest poverty rate, with 3 households (100.0%) experiencing poverty. Likewise, among single-mother households, those with no children have the highest poverty rate, with 17 households (43.6%) falling below the poverty line.
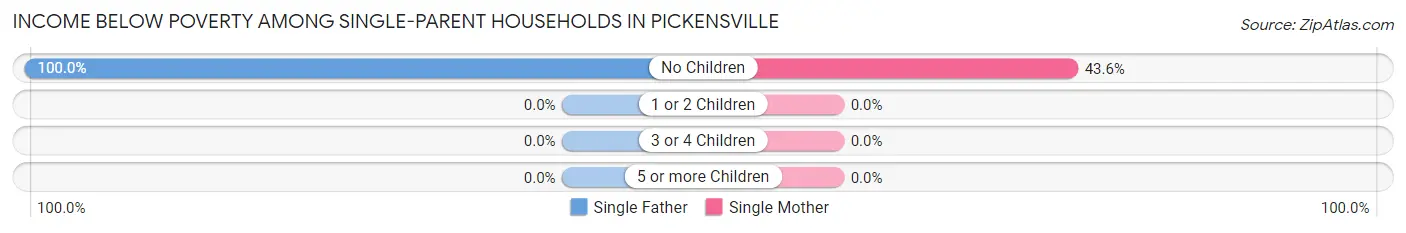
| Children | Single Father | Single Mother |
| No Children | 3 (100.0%) | 17 (43.6%) |
| 1 or 2 Children | 0 (0.0%) | 0 (0.0%) |
| 3 or 4 Children | 0 (0.0%) | 0 (0.0%) |
| 5 or more Children | 0 (0.0%) | 0 (0.0%) |
| Total | 3 (100.0%) | 17 (37.0%) |
Income Below Poverty Among Married-Couple vs Single-Parent Households in Pickensville
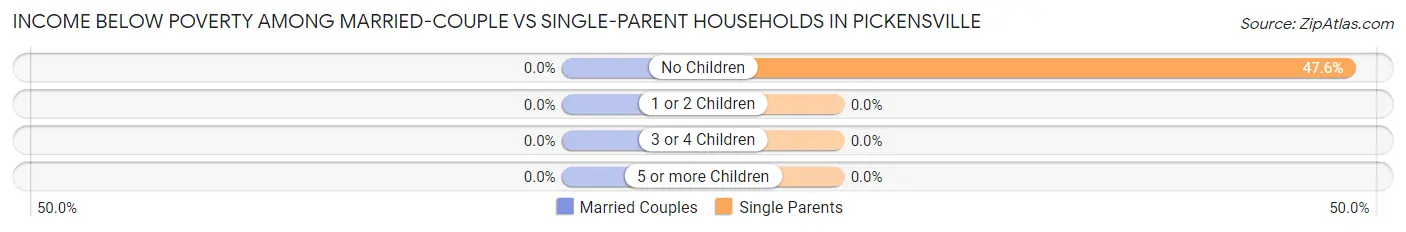
| Children | Married-Couple Families | Single-Parent Households |
| No Children | 0 (0.0%) | 20 (47.6%) |
| 1 or 2 Children | 0 (0.0%) | 0 (0.0%) |
| 3 or 4 Children | 0 (0.0%) | 0 (0.0%) |
| 5 or more Children | 0 (0.0%) | 0 (0.0%) |
| Total | 0 (0.0%) | 20 (40.8%) |
Employment Characteristics in Pickensville
Employment by Class of Employer in Pickensville
Among the 299 employed individuals in Pickensville, private company employees (194 | 64.9%), state government employees (37 | 12.4%), and federal government employees (27 | 9.0%) make up the most common classes of employment.
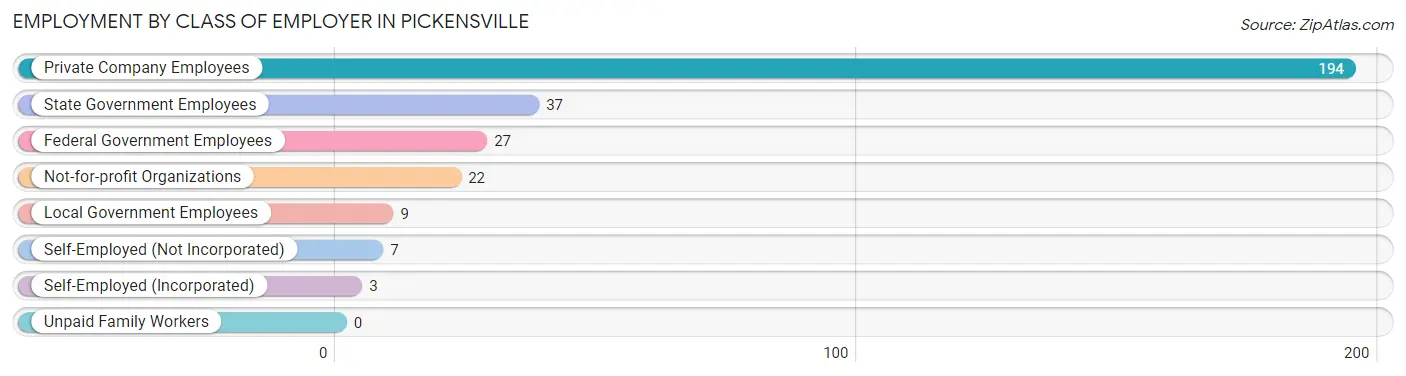
| Employer Class | # Employees | % Employees |
| Private Company Employees | 194 | 64.9% |
| Self-Employed (Incorporated) | 3 | 1.0% |
| Self-Employed (Not Incorporated) | 7 | 2.3% |
| Not-for-profit Organizations | 22 | 7.4% |
| Local Government Employees | 9 | 3.0% |
| State Government Employees | 37 | 12.4% |
| Federal Government Employees | 27 | 9.0% |
| Unpaid Family Workers | 0 | 0.0% |
| Total | 299 | 100.0% |
Employment Status by Age in Pickensville
According to the labor force statistics for Pickensville, out of the total population over 16 years of age (659), 47.3% or 312 individuals are in the labor force, with 4.2% or 13 of them unemployed. The age group with the highest labor force participation rate is 20 to 24 years, with 100.0% or 32 individuals in the labor force. Within the labor force, the 20 to 24 years age range has the highest percentage of unemployed individuals, with 40.6% or 13 of them being unemployed.
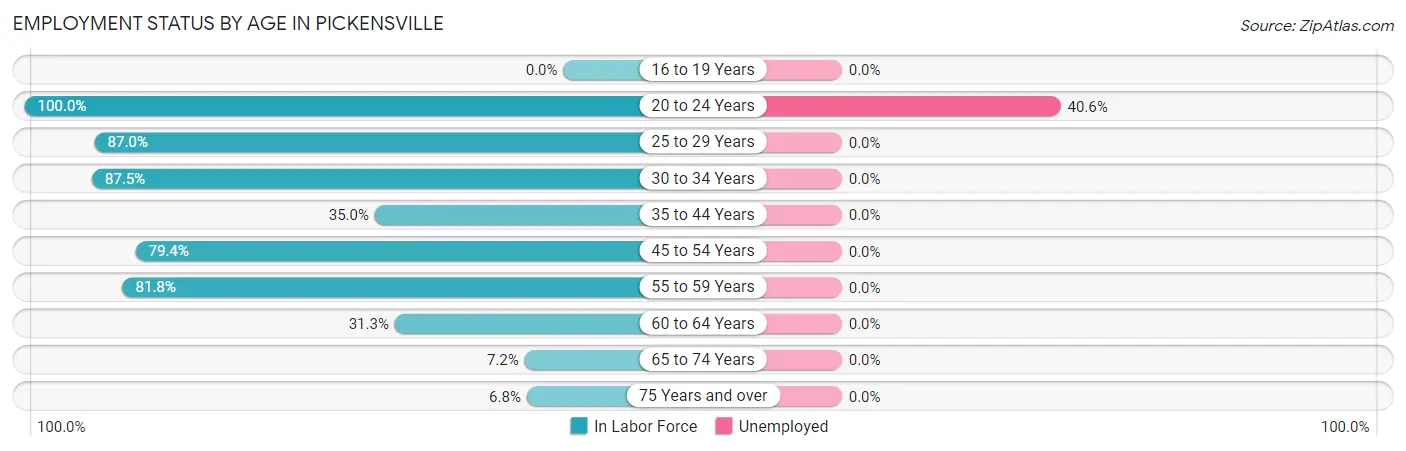
| Age Bracket | In Labor Force | Unemployed |
| 16 to 19 Years | 0 (0.0%) | 0 (0.0%) |
| 20 to 24 Years | 32 (100.0%) | 13 (40.6%) |
| 25 to 29 Years | 47 (87.0%) | 0 (0.0%) |
| 30 to 34 Years | 35 (87.5%) | 0 (0.0%) |
| 35 to 44 Years | 48 (35.0%) | 0 (0.0%) |
| 45 to 54 Years | 77 (79.4%) | 0 (0.0%) |
| 55 to 59 Years | 36 (81.8%) | 0 (0.0%) |
| 60 to 64 Years | 26 (31.3%) | 0 (0.0%) |
| 65 to 74 Years | 7 (7.2%) | 0 (0.0%) |
| 75 Years and over | 4 (6.8%) | 0 (0.0%) |
| Total | 312 (47.3%) | 13 (4.2%) |
Employment Status by Educational Attainment in Pickensville
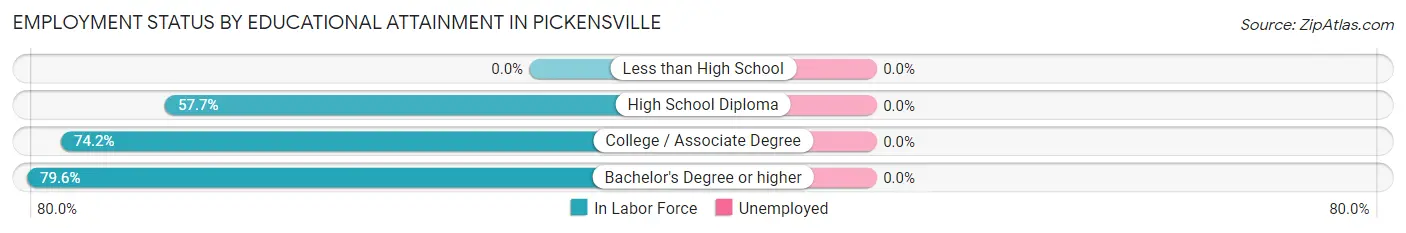
| Educational Attainment | In Labor Force | Unemployed |
| Less than High School | 0 (0.0%) | 0 (0.0%) |
| High School Diploma | 109 (57.7%) | 0 (0.0%) |
| College / Associate Degree | 121 (74.2%) | 0 (0.0%) |
| Bachelor's Degree or higher | 39 (79.6%) | 0 (0.0%) |
| Total | 269 (59.1%) | 0 (0.0%) |
Employment Occupations by Sex in Pickensville
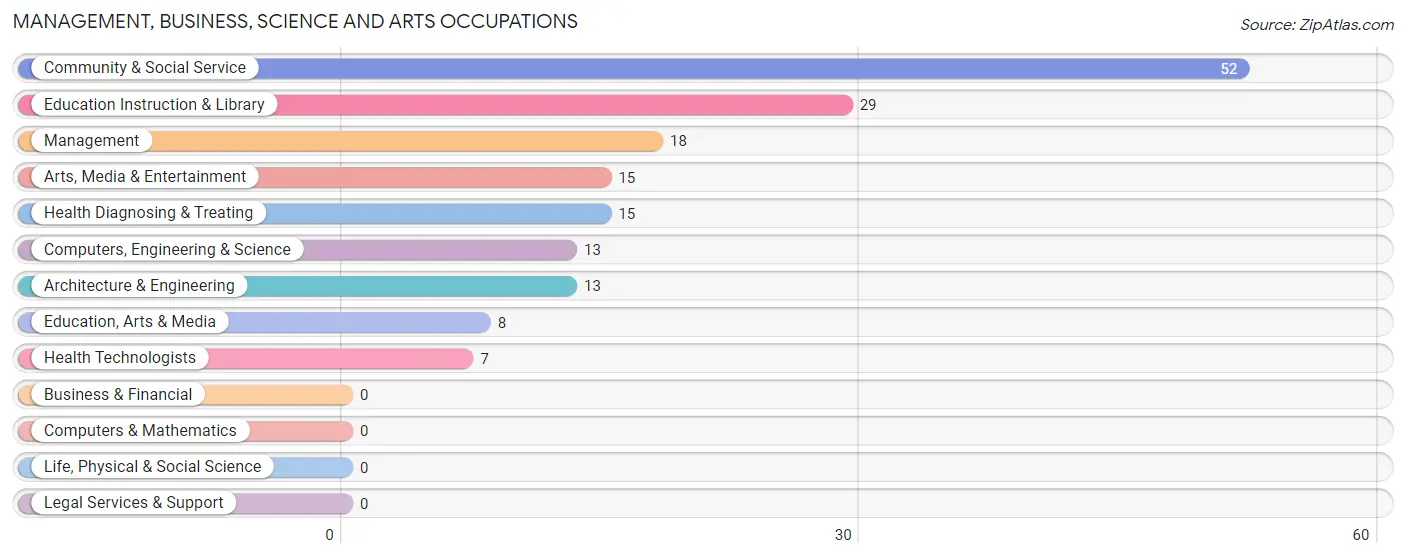
Management, Business, Science and Arts Occupations
The most common Management, Business, Science and Arts occupations in Pickensville are Community & Social Service (52 | 17.6%), Education Instruction & Library (29 | 9.8%), Management (18 | 6.1%), Arts, Media & Entertainment (15 | 5.1%), and Health Diagnosing & Treating (15 | 5.1%).
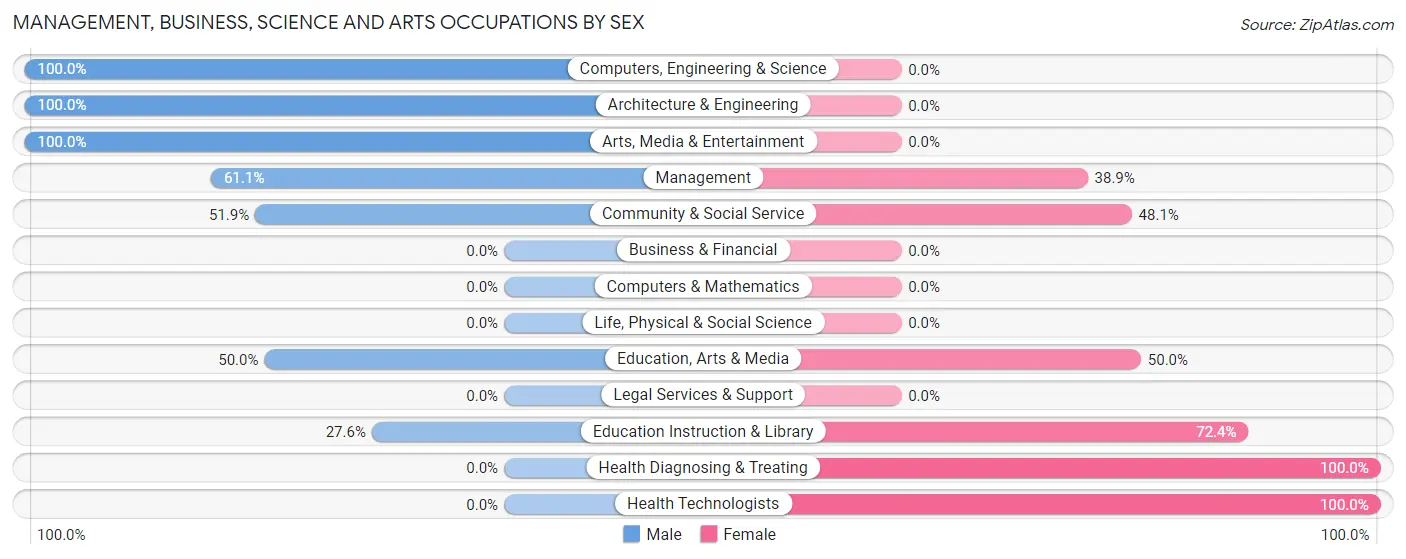
Management, Business, Science and Arts Occupations by Sex
Within the Management, Business, Science and Arts occupations in Pickensville, the most male-oriented occupations are Computers, Engineering & Science (100.0%), Architecture & Engineering (100.0%), and Arts, Media & Entertainment (100.0%), while the most female-oriented occupations are Health Diagnosing & Treating (100.0%), Health Technologists (100.0%), and Education Instruction & Library (72.4%).
| Occupation | Male | Female |
| Management | 11 (61.1%) | 7 (38.9%) |
| Business & Financial | 0 (0.0%) | 0 (0.0%) |
| Computers, Engineering & Science | 13 (100.0%) | 0 (0.0%) |
| Computers & Mathematics | 0 (0.0%) | 0 (0.0%) |
| Architecture & Engineering | 13 (100.0%) | 0 (0.0%) |
| Life, Physical & Social Science | 0 (0.0%) | 0 (0.0%) |
| Community & Social Service | 27 (51.9%) | 25 (48.1%) |
| Education, Arts & Media | 4 (50.0%) | 4 (50.0%) |
| Legal Services & Support | 0 (0.0%) | 0 (0.0%) |
| Education Instruction & Library | 8 (27.6%) | 21 (72.4%) |
| Arts, Media & Entertainment | 15 (100.0%) | 0 (0.0%) |
| Health Diagnosing & Treating | 0 (0.0%) | 15 (100.0%) |
| Health Technologists | 0 (0.0%) | 7 (100.0%) |
| Total (Category) | 51 (52.0%) | 47 (48.0%) |
| Total (Overall) | 154 (52.2%) | 141 (47.8%) |
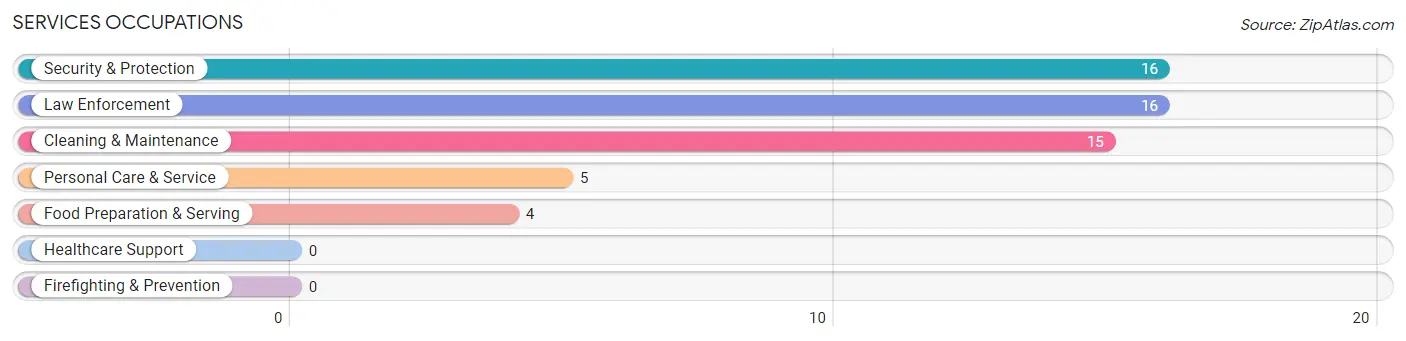
Services Occupations
The most common Services occupations in Pickensville are Security & Protection (16 | 5.4%), Law Enforcement (16 | 5.4%), Cleaning & Maintenance (15 | 5.1%), Personal Care & Service (5 | 1.7%), and Food Preparation & Serving (4 | 1.4%).
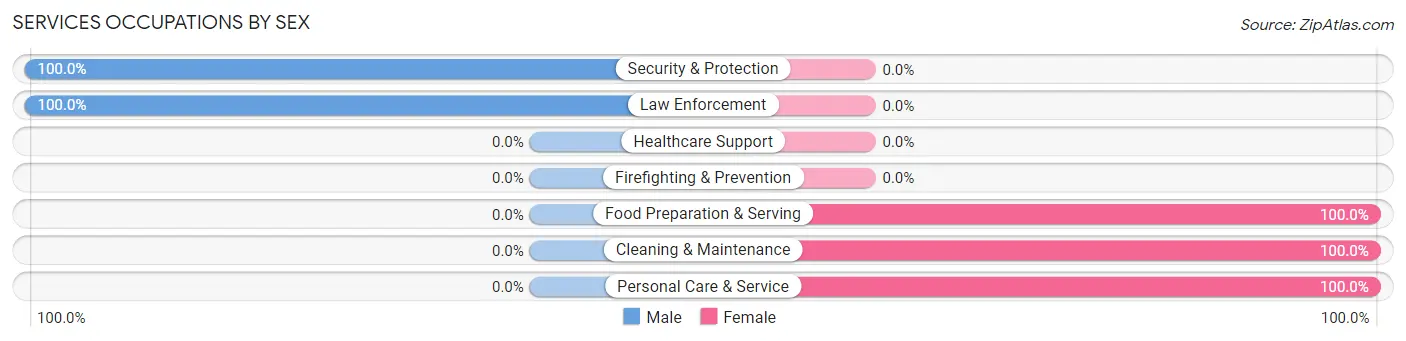
Services Occupations by Sex
Within the Services occupations in Pickensville, the most male-oriented occupations are Security & Protection (100.0%), and Law Enforcement (100.0%), while the most female-oriented occupations are Food Preparation & Serving (100.0%), Cleaning & Maintenance (100.0%), and Personal Care & Service (100.0%).
| Occupation | Male | Female |
| Healthcare Support | 0 (0.0%) | 0 (0.0%) |
| Security & Protection | 16 (100.0%) | 0 (0.0%) |
| Firefighting & Prevention | 0 (0.0%) | 0 (0.0%) |
| Law Enforcement | 16 (100.0%) | 0 (0.0%) |
| Food Preparation & Serving | 0 (0.0%) | 4 (100.0%) |
| Cleaning & Maintenance | 0 (0.0%) | 15 (100.0%) |
| Personal Care & Service | 0 (0.0%) | 5 (100.0%) |
| Total (Category) | 16 (40.0%) | 24 (60.0%) |
| Total (Overall) | 154 (52.2%) | 141 (47.8%) |
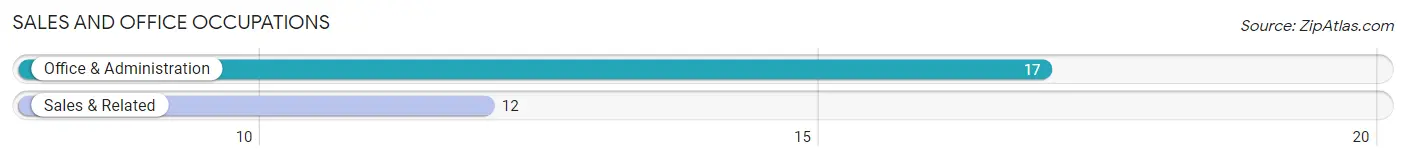
Sales and Office Occupations
The most common Sales and Office occupations in Pickensville are Office & Administration (17 | 5.8%), and Sales & Related (12 | 4.1%).
Sales and Office Occupations by Sex
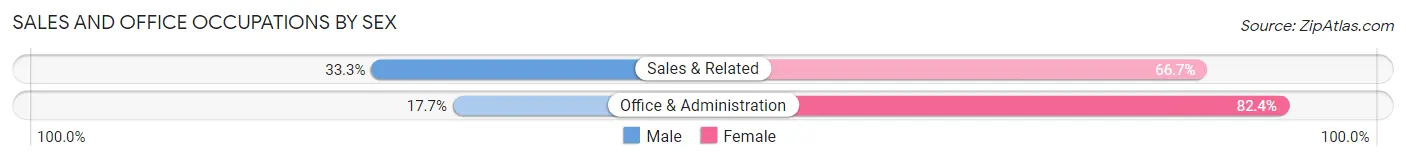
| Occupation | Male | Female |
| Sales & Related | 4 (33.3%) | 8 (66.7%) |
| Office & Administration | 3 (17.6%) | 14 (82.4%) |
| Total (Category) | 7 (24.1%) | 22 (75.9%) |
| Total (Overall) | 154 (52.2%) | 141 (47.8%) |
Natural Resources, Construction and Maintenance Occupations
The most common Natural Resources, Construction and Maintenance occupations in Pickensville are Installation, Maintenance & Repair (21 | 7.1%), and Construction & Extraction (2 | 0.7%).

Natural Resources, Construction and Maintenance Occupations by Sex

| Occupation | Male | Female |
| Farming, Fishing & Forestry | 0 (0.0%) | 0 (0.0%) |
| Construction & Extraction | 2 (100.0%) | 0 (0.0%) |
| Installation, Maintenance & Repair | 21 (100.0%) | 0 (0.0%) |
| Total (Category) | 23 (100.0%) | 0 (0.0%) |
| Total (Overall) | 154 (52.2%) | 141 (47.8%) |
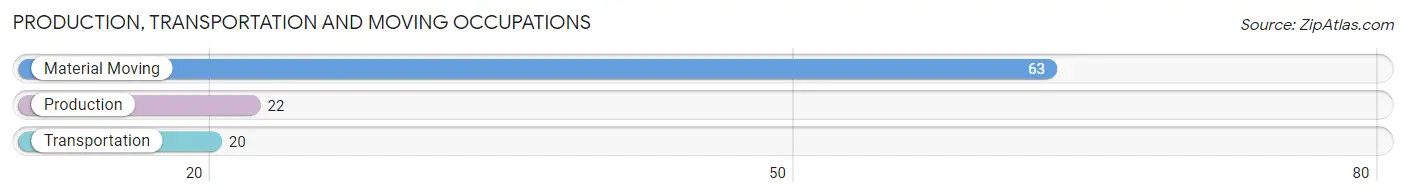
Production, Transportation and Moving Occupations
The most common Production, Transportation and Moving occupations in Pickensville are Material Moving (63 | 21.4%), Production (22 | 7.5%), and Transportation (20 | 6.8%).
Production, Transportation and Moving Occupations by Sex
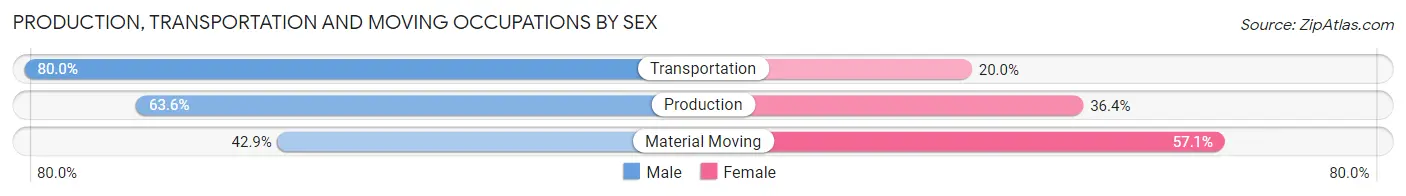
| Occupation | Male | Female |
| Production | 14 (63.6%) | 8 (36.4%) |
| Transportation | 16 (80.0%) | 4 (20.0%) |
| Material Moving | 27 (42.9%) | 36 (57.1%) |
| Total (Category) | 57 (54.3%) | 48 (45.7%) |
| Total (Overall) | 154 (52.2%) | 141 (47.8%) |
Employment Industries by Sex in Pickensville
Employment Industries in Pickensville
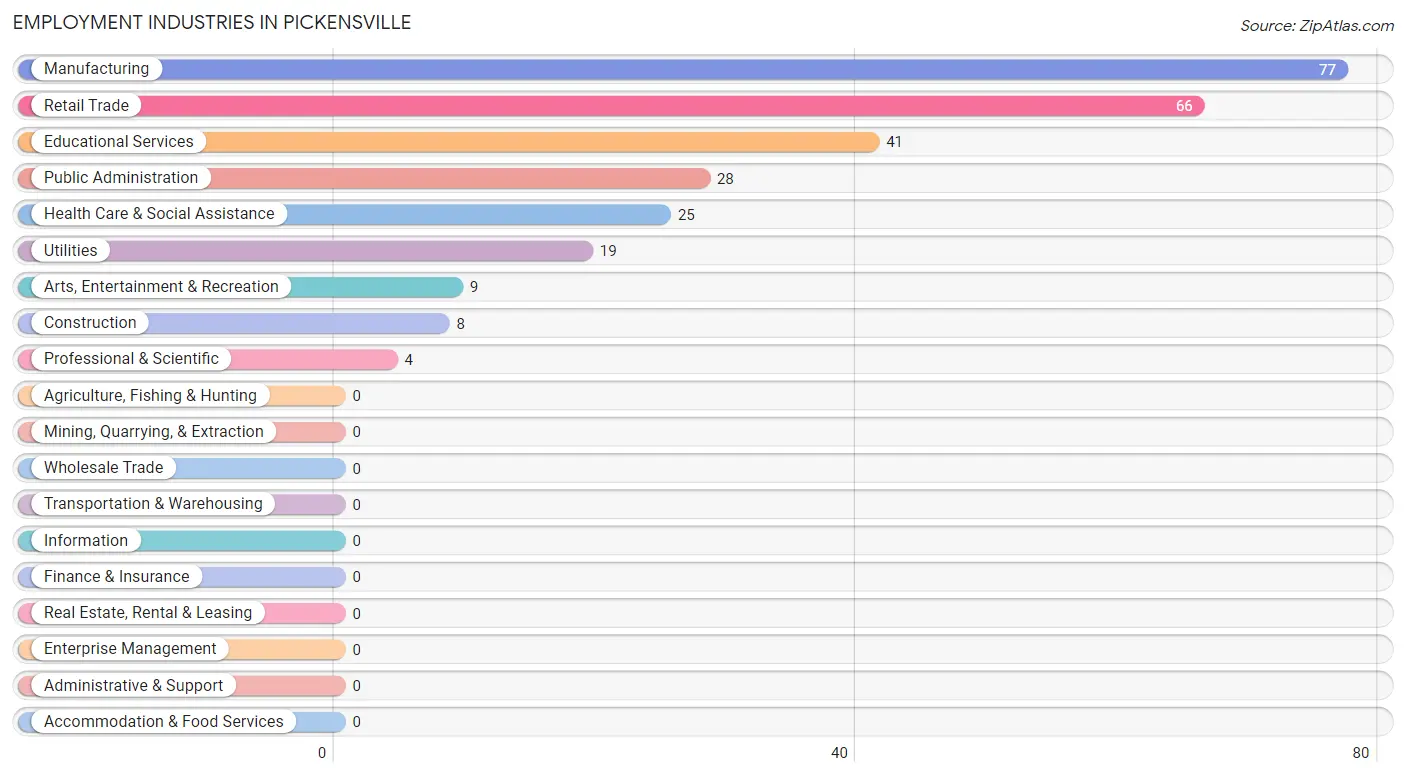
The major employment industries in Pickensville include Manufacturing (77 | 26.1%), Retail Trade (66 | 22.4%), Educational Services (41 | 13.9%), Public Administration (28 | 9.5%), and Health Care & Social Assistance (25 | 8.5%).
Employment Industries by Sex in Pickensville
The Pickensville industries that see more men than women are Construction (100.0%), Public Administration (89.3%), and Manufacturing (88.3%), whereas the industries that tend to have a higher number of women are Professional & Scientific (100.0%), Health Care & Social Assistance (100.0%), and Retail Trade (83.3%).
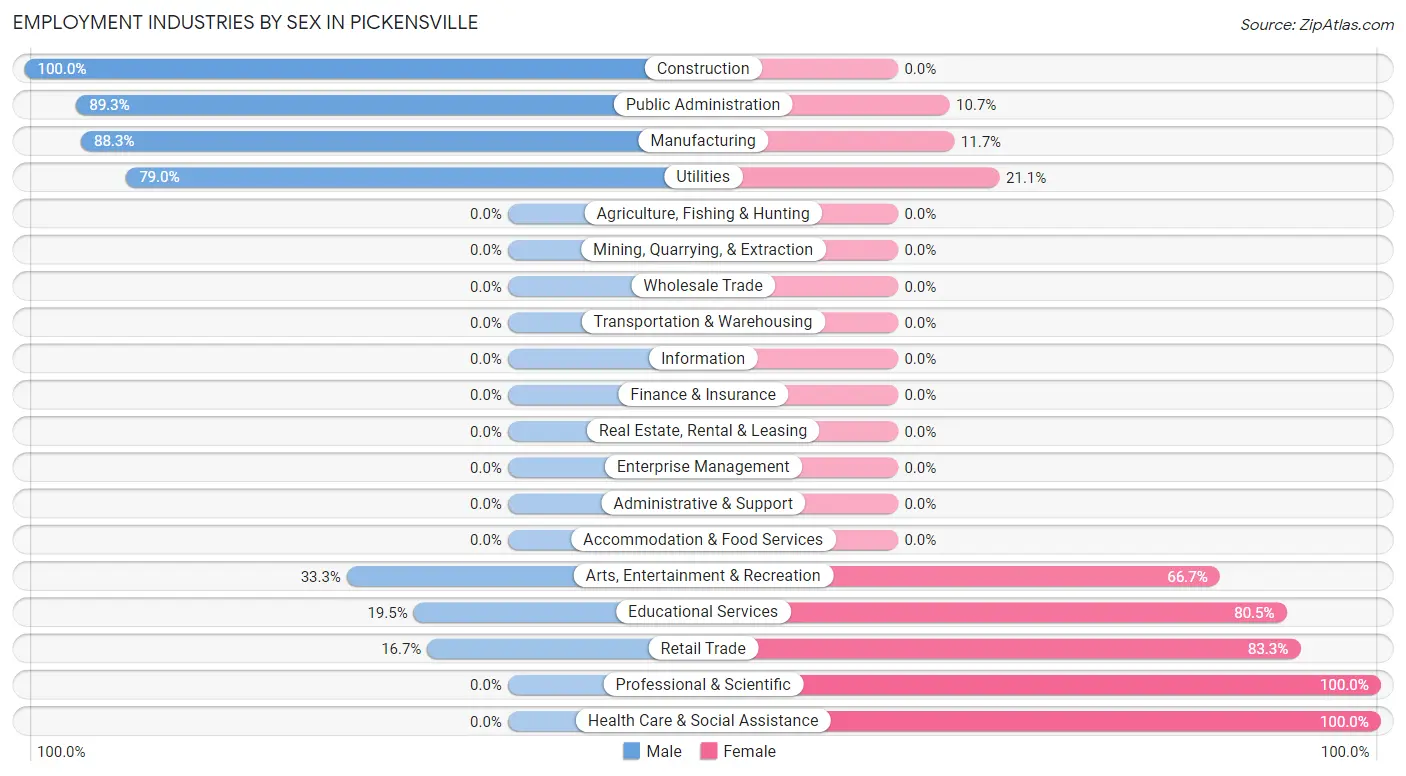
| Industry | Male | Female |
| Agriculture, Fishing & Hunting | 0 (0.0%) | 0 (0.0%) |
| Mining, Quarrying, & Extraction | 0 (0.0%) | 0 (0.0%) |
| Construction | 8 (100.0%) | 0 (0.0%) |
| Manufacturing | 68 (88.3%) | 9 (11.7%) |
| Wholesale Trade | 0 (0.0%) | 0 (0.0%) |
| Retail Trade | 11 (16.7%) | 55 (83.3%) |
| Transportation & Warehousing | 0 (0.0%) | 0 (0.0%) |
| Utilities | 15 (78.9%) | 4 (21.0%) |
| Information | 0 (0.0%) | 0 (0.0%) |
| Finance & Insurance | 0 (0.0%) | 0 (0.0%) |
| Real Estate, Rental & Leasing | 0 (0.0%) | 0 (0.0%) |
| Professional & Scientific | 0 (0.0%) | 4 (100.0%) |
| Enterprise Management | 0 (0.0%) | 0 (0.0%) |
| Administrative & Support | 0 (0.0%) | 0 (0.0%) |
| Educational Services | 8 (19.5%) | 33 (80.5%) |
| Health Care & Social Assistance | 0 (0.0%) | 25 (100.0%) |
| Arts, Entertainment & Recreation | 3 (33.3%) | 6 (66.7%) |
| Accommodation & Food Services | 0 (0.0%) | 0 (0.0%) |
| Public Administration | 25 (89.3%) | 3 (10.7%) |
| Total | 154 (52.2%) | 141 (47.8%) |
Education in Pickensville
School Enrollment in Pickensville
The most common levels of schooling among the 89 students in Pickensville are college / undergraduate (39 | 43.8%), middle school (23 | 25.8%), and elementary school (12 | 13.5%).
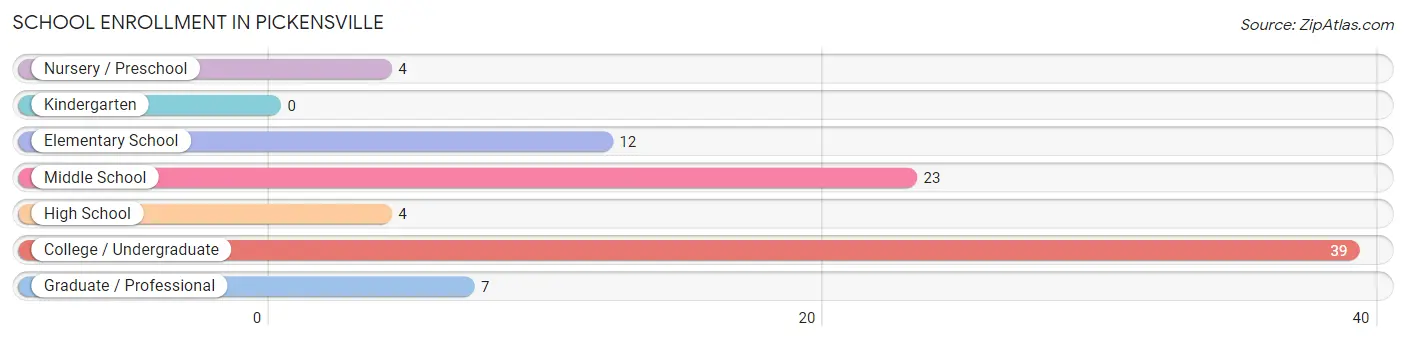
| School Level | # Students | % Students |
| Nursery / Preschool | 4 | 4.5% |
| Kindergarten | 0 | 0.0% |
| Elementary School | 12 | 13.5% |
| Middle School | 23 | 25.8% |
| High School | 4 | 4.5% |
| College / Undergraduate | 39 | 43.8% |
| Graduate / Professional | 7 | 7.9% |
| Total | 89 | 100.0% |
School Enrollment by Age by Funding Source in Pickensville
Out of a total of 89 students who are enrolled in schools in Pickensville, 16 (18.0%) attend a private institution, while the remaining 73 (82.0%) are enrolled in public schools. The age group of 15 to 17 year olds has the highest likelihood of being enrolled in private schools, with 3 (100.0% in the age bracket) enrolled. Conversely, the age group of 20 to 24 year olds has the lowest likelihood of being enrolled in a private school, with 18 (100.0% in the age bracket) attending a public institution.
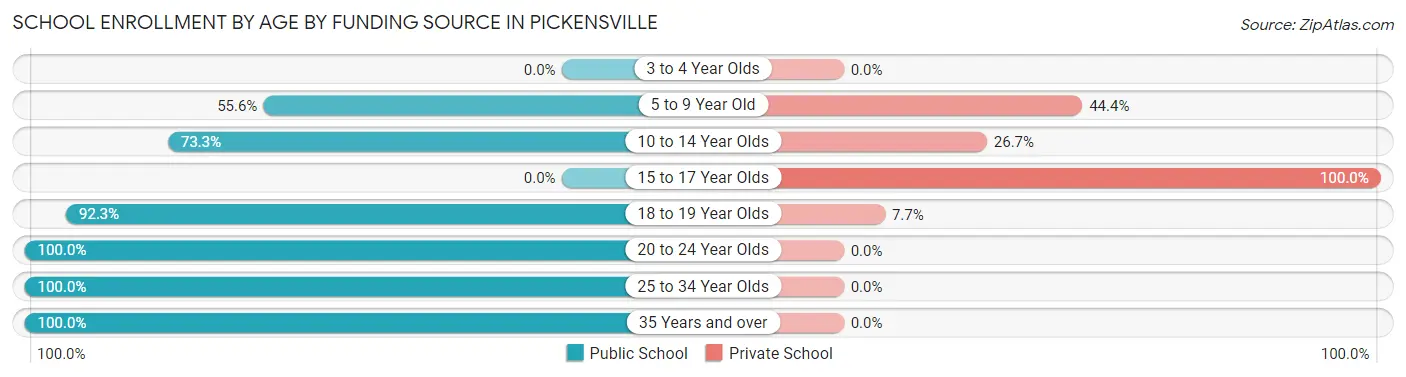
| Age Bracket | Public School | Private School |
| 3 to 4 Year Olds | 0 (0.0%) | 0 (0.0%) |
| 5 to 9 Year Old | 5 (55.6%) | 4 (44.4%) |
| 10 to 14 Year Olds | 22 (73.3%) | 8 (26.7%) |
| 15 to 17 Year Olds | 0 (0.0%) | 3 (100.0%) |
| 18 to 19 Year Olds | 12 (92.3%) | 1 (7.7%) |
| 20 to 24 Year Olds | 18 (100.0%) | 0 (0.0%) |
| 25 to 34 Year Olds | 7 (100.0%) | 0 (0.0%) |
| 35 Years and over | 9 (100.0%) | 0 (0.0%) |
| Total | 73 (82.0%) | 16 (18.0%) |
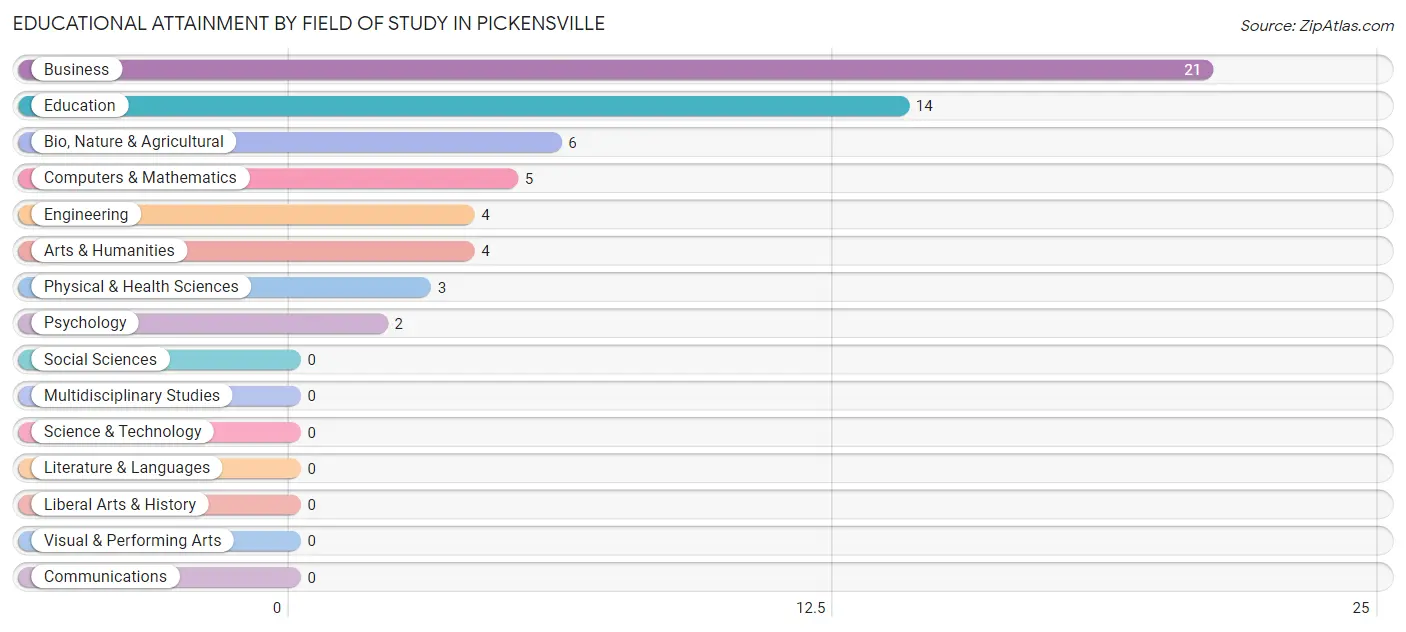
Educational Attainment by Field of Study in Pickensville
Business (21 | 35.6%), education (14 | 23.7%), bio, nature & agricultural (6 | 10.2%), computers & mathematics (5 | 8.5%), and engineering (4 | 6.8%) are the most common fields of study among 59 individuals in Pickensville who have obtained a bachelor's degree or higher.
| Field of Study | # Graduates | % Graduates |
| Computers & Mathematics | 5 | 8.5% |
| Bio, Nature & Agricultural | 6 | 10.2% |
| Physical & Health Sciences | 3 | 5.1% |
| Psychology | 2 | 3.4% |
| Social Sciences | 0 | 0.0% |
| Engineering | 4 | 6.8% |
| Multidisciplinary Studies | 0 | 0.0% |
| Science & Technology | 0 | 0.0% |
| Business | 21 | 35.6% |
| Education | 14 | 23.7% |
| Literature & Languages | 0 | 0.0% |
| Liberal Arts & History | 0 | 0.0% |
| Visual & Performing Arts | 0 | 0.0% |
| Communications | 0 | 0.0% |
| Arts & Humanities | 4 | 6.8% |
| Total | 59 | 100.0% |
Transportation & Commute in Pickensville
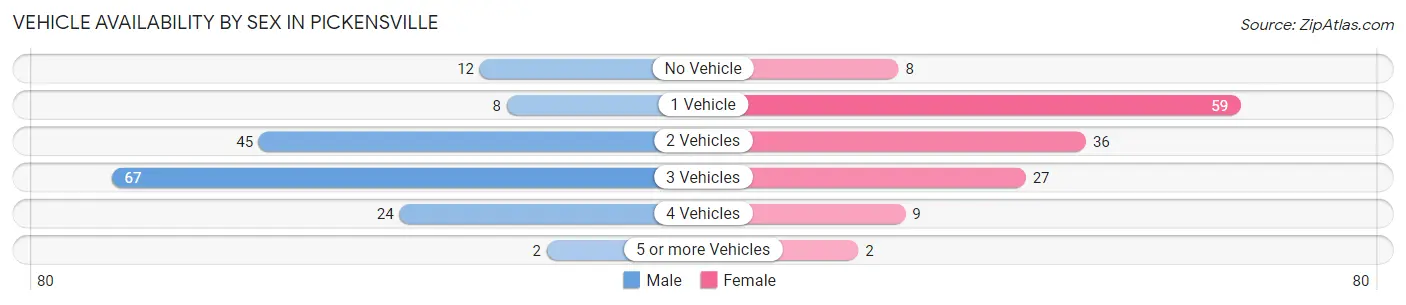
Vehicle Availability by Sex in Pickensville
The most prevalent vehicle ownership categories in Pickensville are males with 3 vehicles (67, accounting for 42.4%) and females with 3 vehicles (27, making up 47.5%).
| Vehicles Available | Male | Female |
| No Vehicle | 12 (7.6%) | 8 (5.7%) |
| 1 Vehicle | 8 (5.1%) | 59 (41.8%) |
| 2 Vehicles | 45 (28.5%) | 36 (25.5%) |
| 3 Vehicles | 67 (42.4%) | 27 (19.2%) |
| 4 Vehicles | 24 (15.2%) | 9 (6.4%) |
| 5 or more Vehicles | 2 (1.3%) | 2 (1.4%) |
| Total | 158 (100.0%) | 141 (100.0%) |
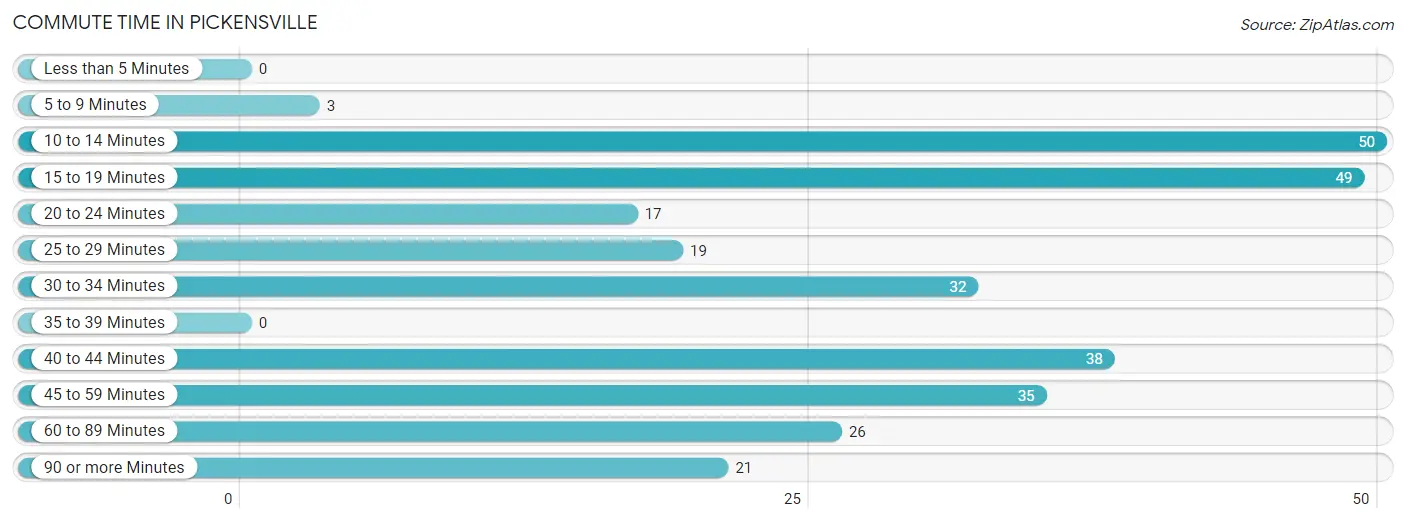
Commute Time in Pickensville
The most frequently occuring commute durations in Pickensville are 10 to 14 minutes (50 commuters, 17.2%), 15 to 19 minutes (49 commuters, 16.9%), and 40 to 44 minutes (38 commuters, 13.1%).
| Commute Time | # Commuters | % Commuters |
| Less than 5 Minutes | 0 | 0.0% |
| 5 to 9 Minutes | 3 | 1.0% |
| 10 to 14 Minutes | 50 | 17.2% |
| 15 to 19 Minutes | 49 | 16.9% |
| 20 to 24 Minutes | 17 | 5.9% |
| 25 to 29 Minutes | 19 | 6.6% |
| 30 to 34 Minutes | 32 | 11.0% |
| 35 to 39 Minutes | 0 | 0.0% |
| 40 to 44 Minutes | 38 | 13.1% |
| 45 to 59 Minutes | 35 | 12.1% |
| 60 to 89 Minutes | 26 | 9.0% |
| 90 or more Minutes | 21 | 7.2% |
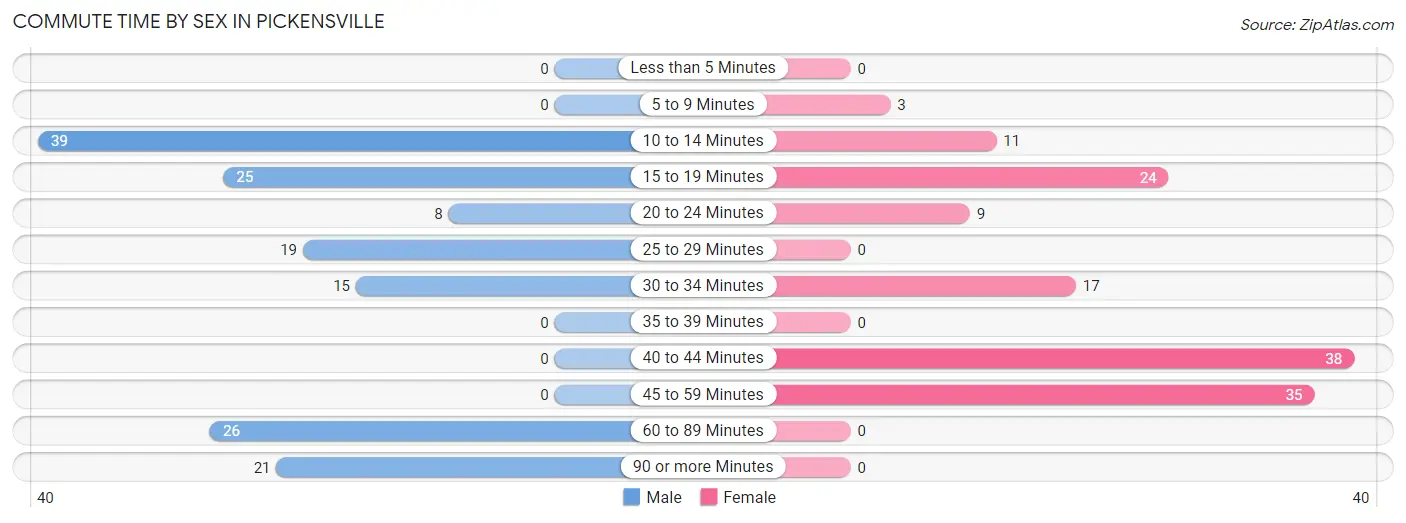
Commute Time by Sex in Pickensville
The most common commute times in Pickensville are 10 to 14 minutes (39 commuters, 25.5%) for males and 40 to 44 minutes (38 commuters, 27.7%) for females.
| Commute Time | Male | Female |
| Less than 5 Minutes | 0 (0.0%) | 0 (0.0%) |
| 5 to 9 Minutes | 0 (0.0%) | 3 (2.2%) |
| 10 to 14 Minutes | 39 (25.5%) | 11 (8.0%) |
| 15 to 19 Minutes | 25 (16.3%) | 24 (17.5%) |
| 20 to 24 Minutes | 8 (5.2%) | 9 (6.6%) |
| 25 to 29 Minutes | 19 (12.4%) | 0 (0.0%) |
| 30 to 34 Minutes | 15 (9.8%) | 17 (12.4%) |
| 35 to 39 Minutes | 0 (0.0%) | 0 (0.0%) |
| 40 to 44 Minutes | 0 (0.0%) | 38 (27.7%) |
| 45 to 59 Minutes | 0 (0.0%) | 35 (25.6%) |
| 60 to 89 Minutes | 26 (17.0%) | 0 (0.0%) |
| 90 or more Minutes | 21 (13.7%) | 0 (0.0%) |
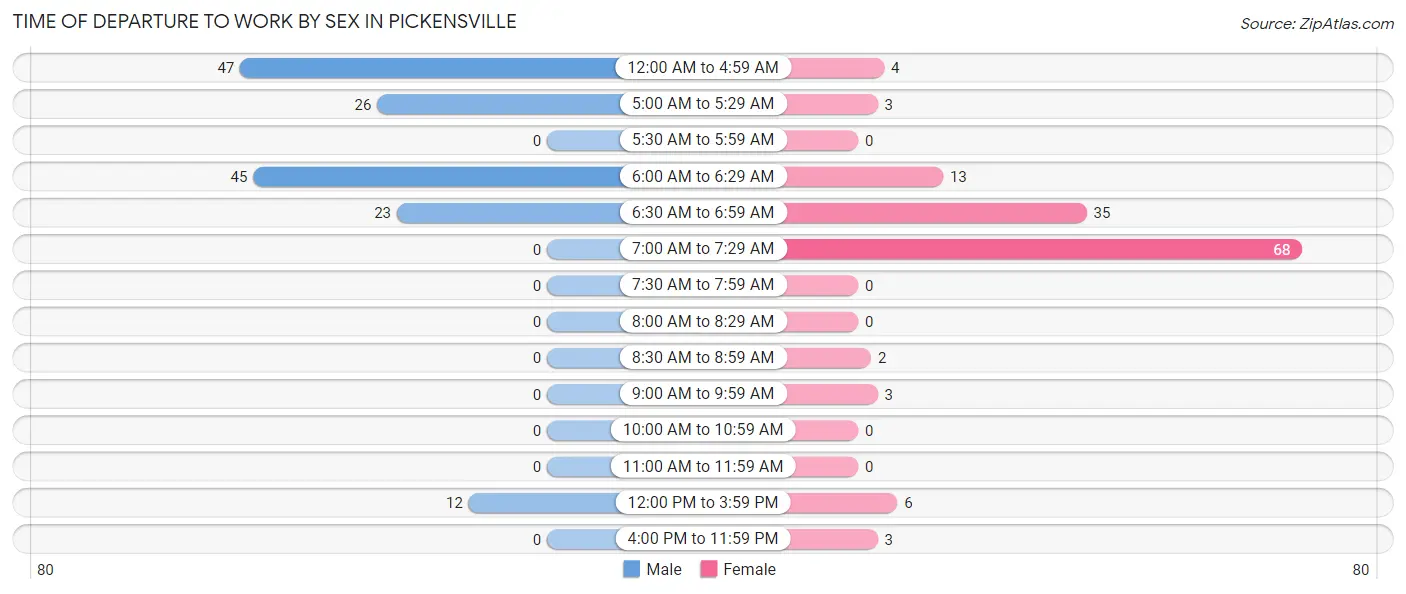
Time of Departure to Work by Sex in Pickensville
The most frequent times of departure to work in Pickensville are 12:00 AM to 4:59 AM (47, 30.7%) for males and 7:00 AM to 7:29 AM (68, 49.6%) for females.
| Time of Departure | Male | Female |
| 12:00 AM to 4:59 AM | 47 (30.7%) | 4 (2.9%) |
| 5:00 AM to 5:29 AM | 26 (17.0%) | 3 (2.2%) |
| 5:30 AM to 5:59 AM | 0 (0.0%) | 0 (0.0%) |
| 6:00 AM to 6:29 AM | 45 (29.4%) | 13 (9.5%) |
| 6:30 AM to 6:59 AM | 23 (15.0%) | 35 (25.6%) |
| 7:00 AM to 7:29 AM | 0 (0.0%) | 68 (49.6%) |
| 7:30 AM to 7:59 AM | 0 (0.0%) | 0 (0.0%) |
| 8:00 AM to 8:29 AM | 0 (0.0%) | 0 (0.0%) |
| 8:30 AM to 8:59 AM | 0 (0.0%) | 2 (1.5%) |
| 9:00 AM to 9:59 AM | 0 (0.0%) | 3 (2.2%) |
| 10:00 AM to 10:59 AM | 0 (0.0%) | 0 (0.0%) |
| 11:00 AM to 11:59 AM | 0 (0.0%) | 0 (0.0%) |
| 12:00 PM to 3:59 PM | 12 (7.8%) | 6 (4.4%) |
| 4:00 PM to 11:59 PM | 0 (0.0%) | 3 (2.2%) |
| Total | 153 (100.0%) | 137 (100.0%) |
Housing Occupancy in Pickensville
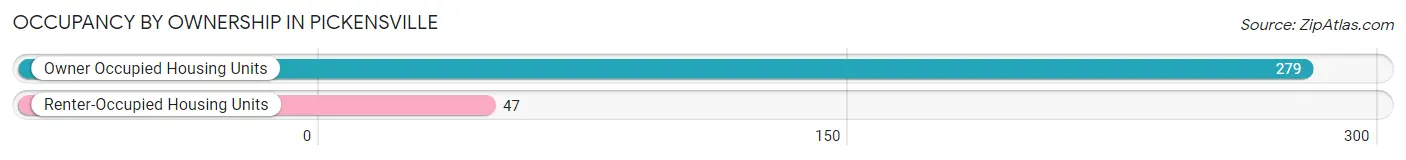
Occupancy by Ownership in Pickensville
Of the total 326 dwellings in Pickensville, owner-occupied units account for 279 (85.6%), while renter-occupied units make up 47 (14.4%).
| Occupancy | # Housing Units | % Housing Units |
| Owner Occupied Housing Units | 279 | 85.6% |
| Renter-Occupied Housing Units | 47 | 14.4% |
| Total Occupied Housing Units | 326 | 100.0% |
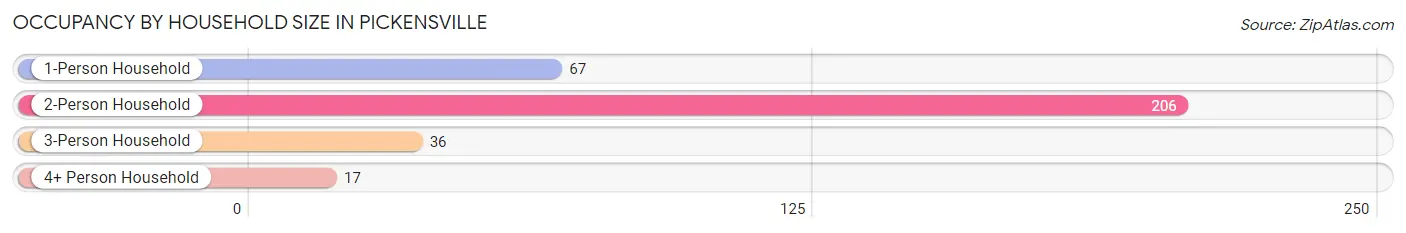
Occupancy by Household Size in Pickensville
| Household Size | # Housing Units | % Housing Units |
| 1-Person Household | 67 | 20.5% |
| 2-Person Household | 206 | 63.2% |
| 3-Person Household | 36 | 11.0% |
| 4+ Person Household | 17 | 5.2% |
| Total Housing Units | 326 | 100.0% |
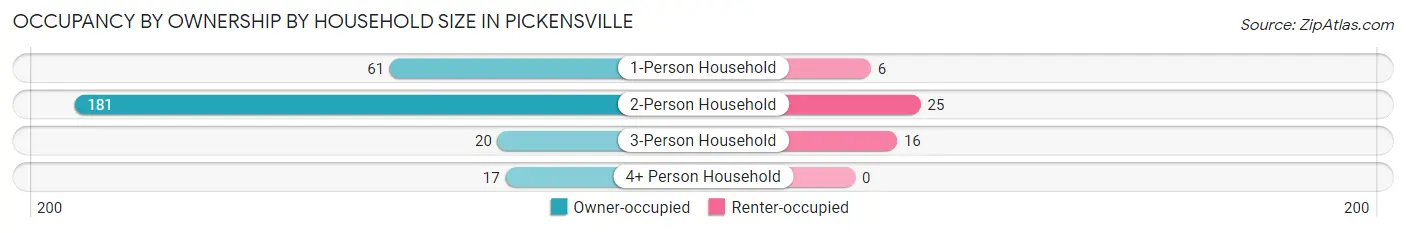
Occupancy by Ownership by Household Size in Pickensville
| Household Size | Owner-occupied | Renter-occupied |
| 1-Person Household | 61 (91.0%) | 6 (9.0%) |
| 2-Person Household | 181 (87.9%) | 25 (12.1%) |
| 3-Person Household | 20 (55.6%) | 16 (44.4%) |
| 4+ Person Household | 17 (100.0%) | 0 (0.0%) |
| Total Housing Units | 279 (85.6%) | 47 (14.4%) |
Occupancy by Educational Attainment in Pickensville
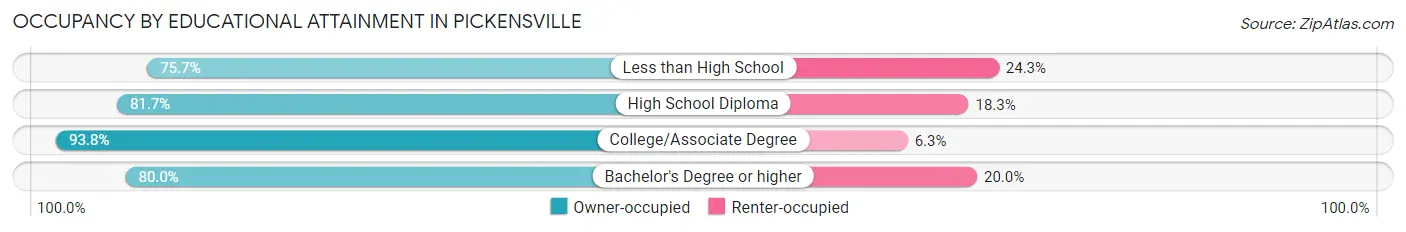
| Household Size | Owner-occupied | Renter-occupied |
| Less than High School | 28 (75.7%) | 9 (24.3%) |
| High School Diploma | 107 (81.7%) | 24 (18.3%) |
| College/Associate Degree | 120 (93.8%) | 8 (6.2%) |
| Bachelor's Degree or higher | 24 (80.0%) | 6 (20.0%) |
Occupancy by Age of Householder in Pickensville
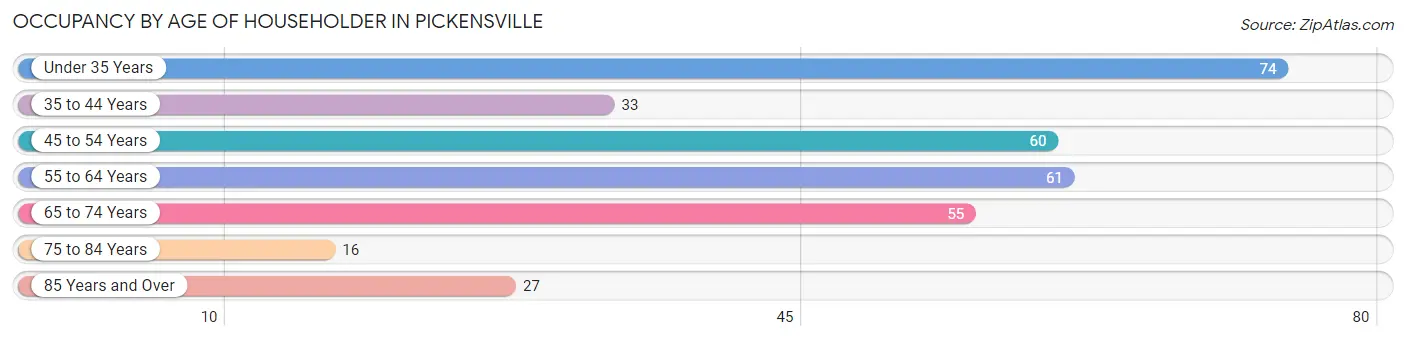
| Age Bracket | # Households | % Households |
| Under 35 Years | 74 | 22.7% |
| 35 to 44 Years | 33 | 10.1% |
| 45 to 54 Years | 60 | 18.4% |
| 55 to 64 Years | 61 | 18.7% |
| 65 to 74 Years | 55 | 16.9% |
| 75 to 84 Years | 16 | 4.9% |
| 85 Years and Over | 27 | 8.3% |
| Total | 326 | 100.0% |
Housing Finances in Pickensville
Median Income by Occupancy in Pickensville
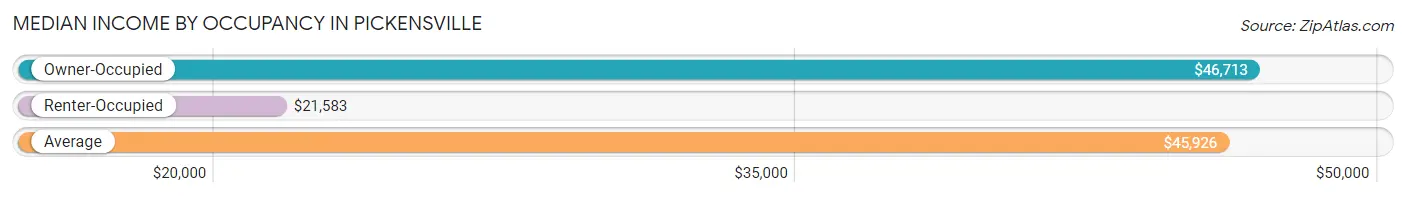
| Occupancy Type | # Households | Median Income |
| Owner-Occupied | 279 (85.6%) | $46,713 |
| Renter-Occupied | 47 (14.4%) | $21,583 |
| Average | 326 (100.0%) | $45,926 |
Occupancy by Householder Income Bracket in Pickensville
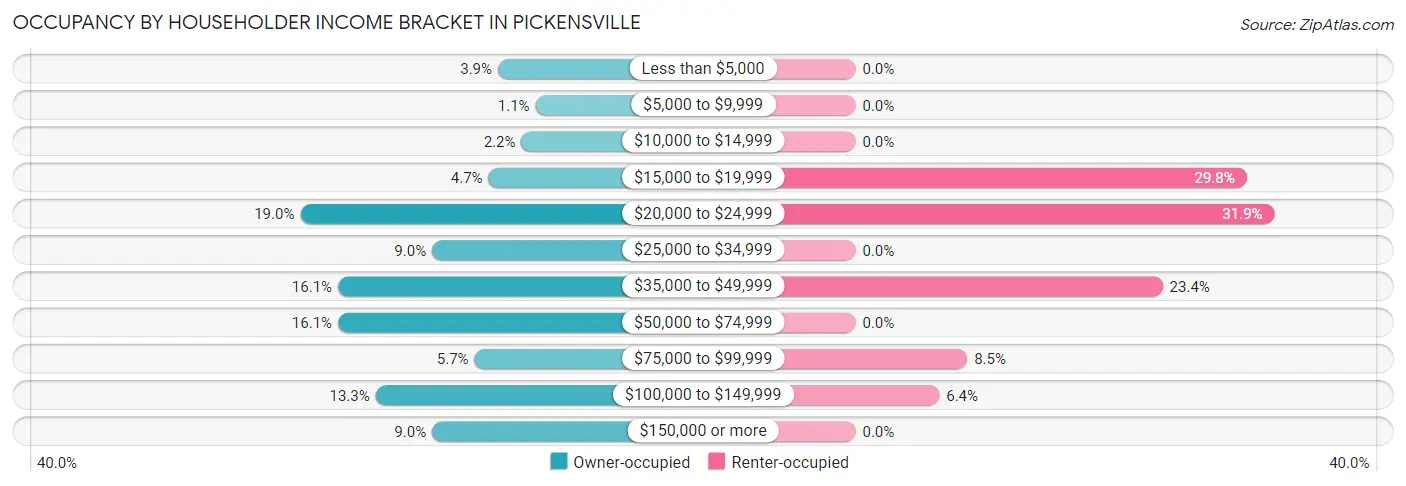
| Income Bracket | Owner-occupied | Renter-occupied |
| Less than $5,000 | 11 (3.9%) | 0 (0.0%) |
| $5,000 to $9,999 | 3 (1.1%) | 0 (0.0%) |
| $10,000 to $14,999 | 6 (2.1%) | 0 (0.0%) |
| $15,000 to $19,999 | 13 (4.7%) | 14 (29.8%) |
| $20,000 to $24,999 | 53 (19.0%) | 15 (31.9%) |
| $25,000 to $34,999 | 25 (9.0%) | 0 (0.0%) |
| $35,000 to $49,999 | 45 (16.1%) | 11 (23.4%) |
| $50,000 to $74,999 | 45 (16.1%) | 0 (0.0%) |
| $75,000 to $99,999 | 16 (5.7%) | 4 (8.5%) |
| $100,000 to $149,999 | 37 (13.3%) | 3 (6.4%) |
| $150,000 or more | 25 (9.0%) | 0 (0.0%) |
| Total | 279 (100.0%) | 47 (100.0%) |
Monthly Housing Cost Tiers in Pickensville
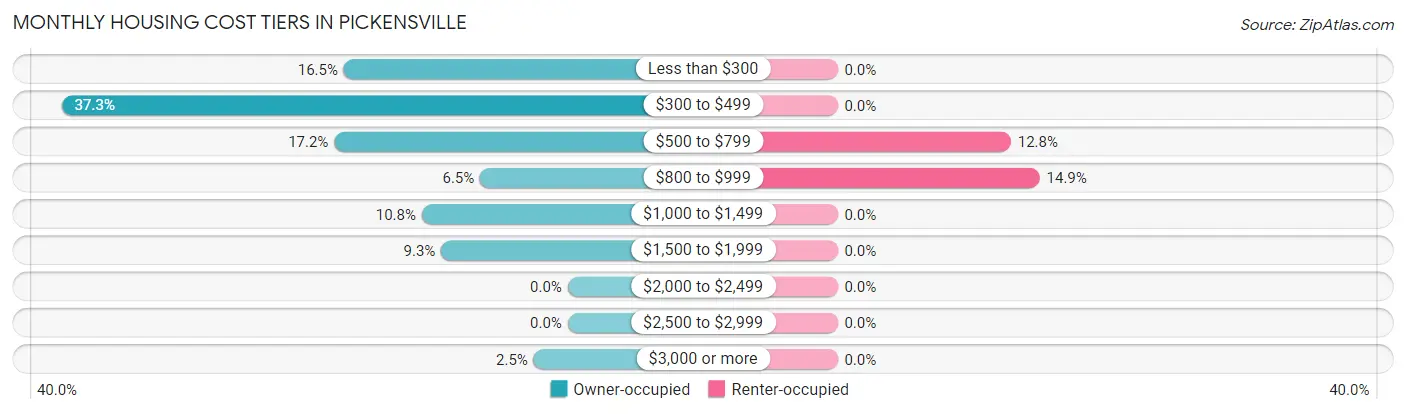
| Monthly Cost | Owner-occupied | Renter-occupied |
| Less than $300 | 46 (16.5%) | 0 (0.0%) |
| $300 to $499 | 104 (37.3%) | 0 (0.0%) |
| $500 to $799 | 48 (17.2%) | 6 (12.8%) |
| $800 to $999 | 18 (6.5%) | 7 (14.9%) |
| $1,000 to $1,499 | 30 (10.7%) | 0 (0.0%) |
| $1,500 to $1,999 | 26 (9.3%) | 0 (0.0%) |
| $2,000 to $2,499 | 0 (0.0%) | 0 (0.0%) |
| $2,500 to $2,999 | 0 (0.0%) | 0 (0.0%) |
| $3,000 or more | 7 (2.5%) | 0 (0.0%) |
| Total | 279 (100.0%) | 47 (100.0%) |
Physical Housing Characteristics in Pickensville
Housing Structures in Pickensville
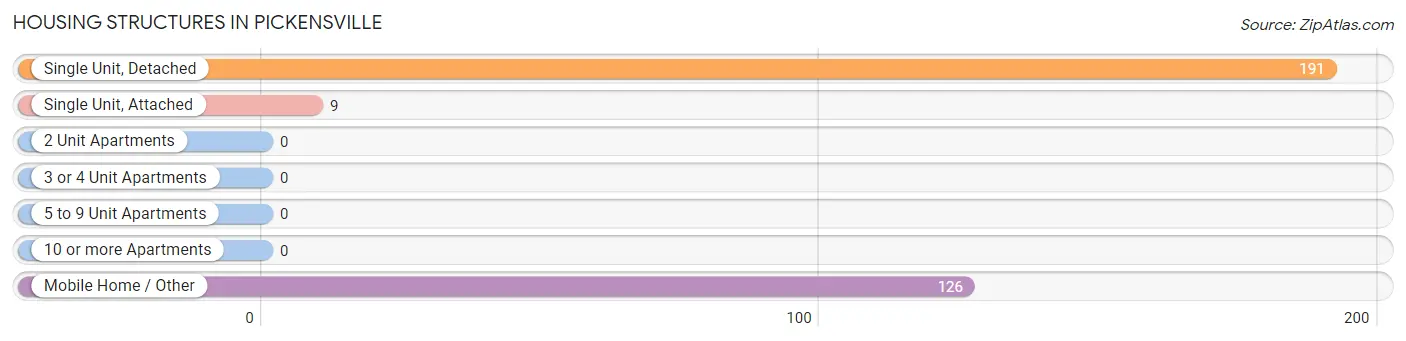
| Structure Type | # Housing Units | % Housing Units |
| Single Unit, Detached | 191 | 58.6% |
| Single Unit, Attached | 9 | 2.8% |
| 2 Unit Apartments | 0 | 0.0% |
| 3 or 4 Unit Apartments | 0 | 0.0% |
| 5 to 9 Unit Apartments | 0 | 0.0% |
| 10 or more Apartments | 0 | 0.0% |
| Mobile Home / Other | 126 | 38.7% |
| Total | 326 | 100.0% |
Housing Structures by Occupancy in Pickensville
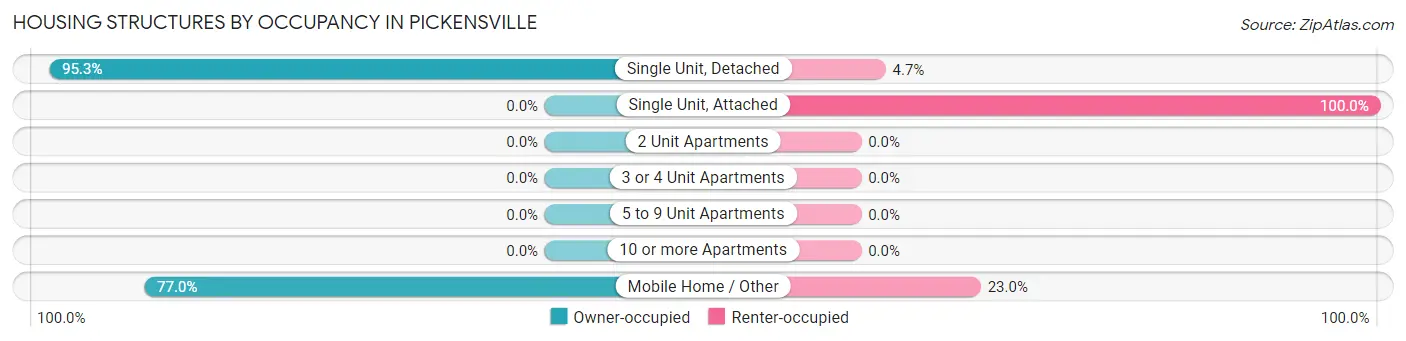
| Structure Type | Owner-occupied | Renter-occupied |
| Single Unit, Detached | 182 (95.3%) | 9 (4.7%) |
| Single Unit, Attached | 0 (0.0%) | 9 (100.0%) |
| 2 Unit Apartments | 0 (0.0%) | 0 (0.0%) |
| 3 or 4 Unit Apartments | 0 (0.0%) | 0 (0.0%) |
| 5 to 9 Unit Apartments | 0 (0.0%) | 0 (0.0%) |
| 10 or more Apartments | 0 (0.0%) | 0 (0.0%) |
| Mobile Home / Other | 97 (77.0%) | 29 (23.0%) |
| Total | 279 (85.6%) | 47 (14.4%) |
Housing Structures by Number of Rooms in Pickensville
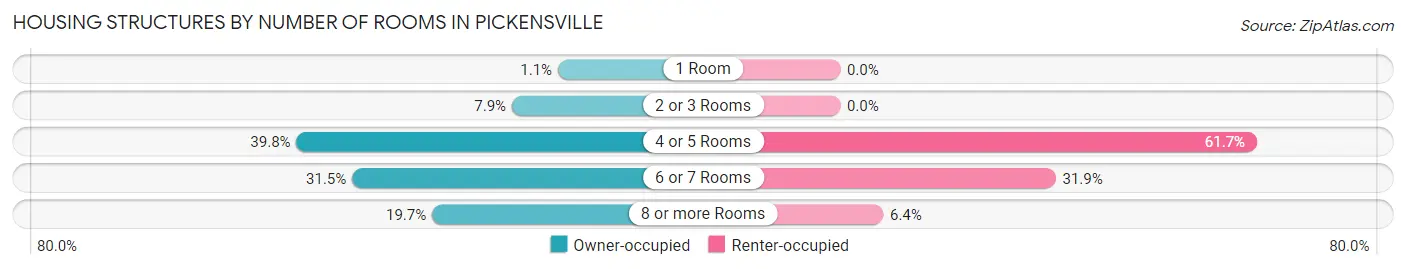
| Number of Rooms | Owner-occupied | Renter-occupied |
| 1 Room | 3 (1.1%) | 0 (0.0%) |
| 2 or 3 Rooms | 22 (7.9%) | 0 (0.0%) |
| 4 or 5 Rooms | 111 (39.8%) | 29 (61.7%) |
| 6 or 7 Rooms | 88 (31.5%) | 15 (31.9%) |
| 8 or more Rooms | 55 (19.7%) | 3 (6.4%) |
| Total | 279 (100.0%) | 47 (100.0%) |
Housing Structure by Heating Type in Pickensville
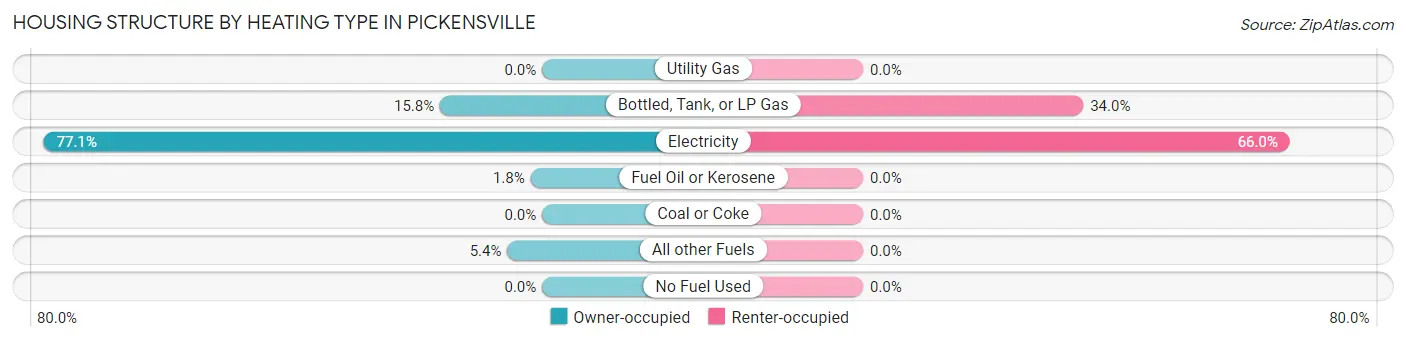
| Heating Type | Owner-occupied | Renter-occupied |
| Utility Gas | 0 (0.0%) | 0 (0.0%) |
| Bottled, Tank, or LP Gas | 44 (15.8%) | 16 (34.0%) |
| Electricity | 215 (77.1%) | 31 (66.0%) |
| Fuel Oil or Kerosene | 5 (1.8%) | 0 (0.0%) |
| Coal or Coke | 0 (0.0%) | 0 (0.0%) |
| All other Fuels | 15 (5.4%) | 0 (0.0%) |
| No Fuel Used | 0 (0.0%) | 0 (0.0%) |
| Total | 279 (100.0%) | 47 (100.0%) |
Household Vehicle Usage in Pickensville
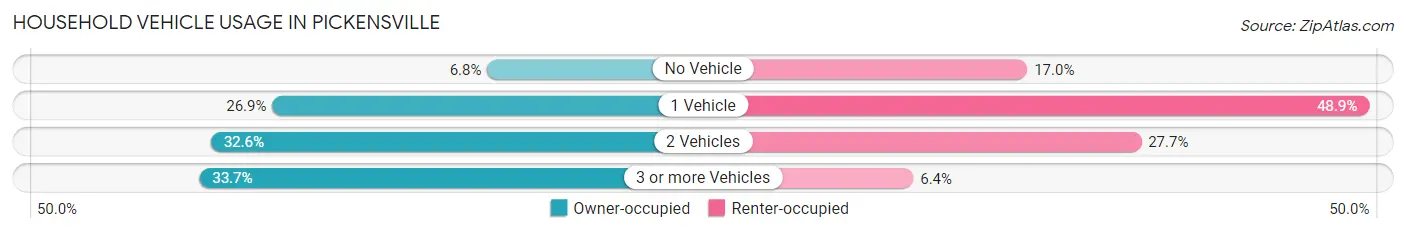
| Vehicles per Household | Owner-occupied | Renter-occupied |
| No Vehicle | 19 (6.8%) | 8 (17.0%) |
| 1 Vehicle | 75 (26.9%) | 23 (48.9%) |
| 2 Vehicles | 91 (32.6%) | 13 (27.7%) |
| 3 or more Vehicles | 94 (33.7%) | 3 (6.4%) |
| Total | 279 (100.0%) | 47 (100.0%) |
Real Estate & Mortgages in Pickensville
Real Estate and Mortgage Overview in Pickensville
| Characteristic | Without Mortgage | With Mortgage |
| Housing Units | 194 | 85 |
| Median Property Value | - | - |
| Median Household Income | $36,667 | $17 |
| Monthly Housing Costs | $369 | $7 |
| Real Estate Taxes | $318 | $20 |
Property Value by Mortgage Status in Pickensville
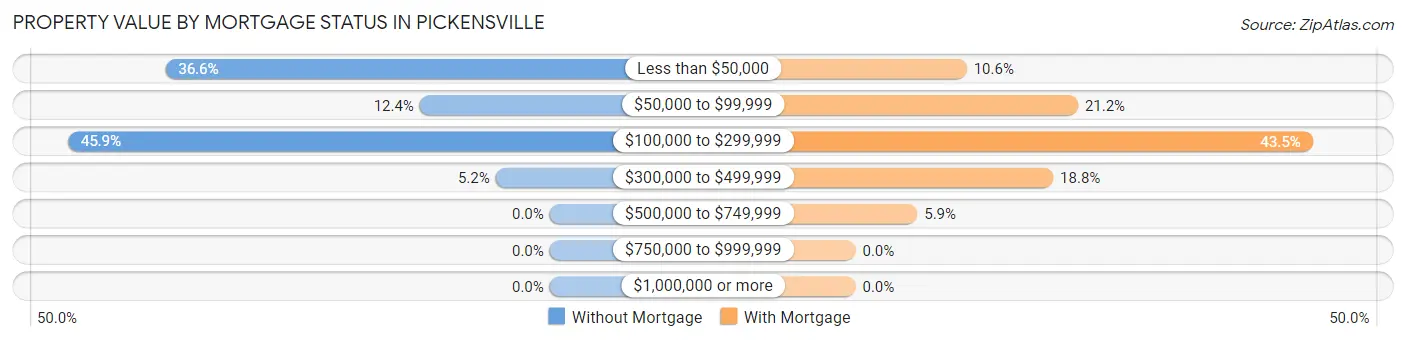
| Property Value | Without Mortgage | With Mortgage |
| Less than $50,000 | 71 (36.6%) | 9 (10.6%) |
| $50,000 to $99,999 | 24 (12.4%) | 18 (21.2%) |
| $100,000 to $299,999 | 89 (45.9%) | 37 (43.5%) |
| $300,000 to $499,999 | 10 (5.1%) | 16 (18.8%) |
| $500,000 to $749,999 | 0 (0.0%) | 5 (5.9%) |
| $750,000 to $999,999 | 0 (0.0%) | 0 (0.0%) |
| $1,000,000 or more | 0 (0.0%) | 0 (0.0%) |
| Total | 194 (100.0%) | 85 (100.0%) |
Household Income by Mortgage Status in Pickensville
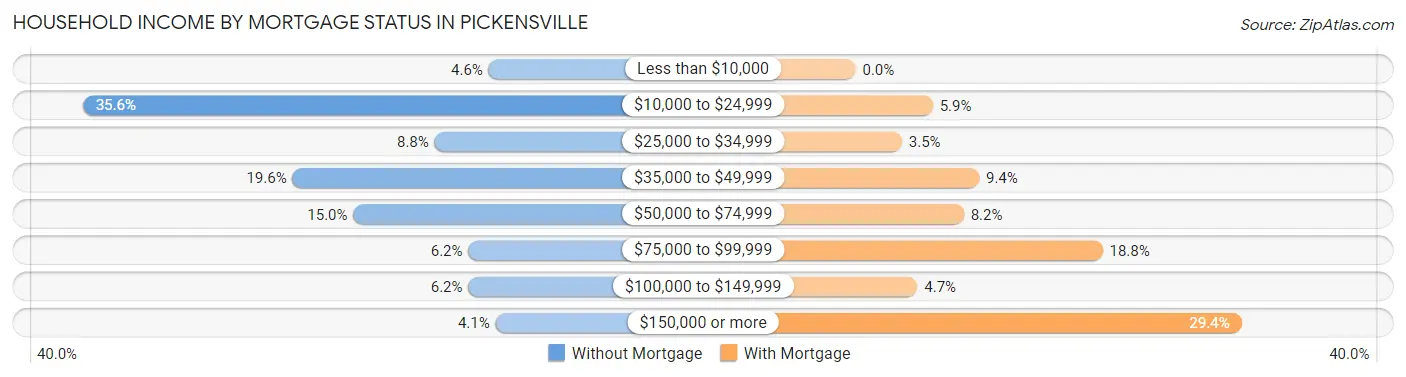
| Household Income | Without Mortgage | With Mortgage |
| Less than $10,000 | 9 (4.6%) | 0 (0.0%) |
| $10,000 to $24,999 | 69 (35.6%) | 5 (5.9%) |
| $25,000 to $34,999 | 17 (8.8%) | 3 (3.5%) |
| $35,000 to $49,999 | 38 (19.6%) | 8 (9.4%) |
| $50,000 to $74,999 | 29 (14.9%) | 7 (8.2%) |
| $75,000 to $99,999 | 12 (6.2%) | 16 (18.8%) |
| $100,000 to $149,999 | 12 (6.2%) | 4 (4.7%) |
| $150,000 or more | 8 (4.1%) | 25 (29.4%) |
| Total | 194 (100.0%) | 85 (100.0%) |
Property Value to Household Income Ratio in Pickensville
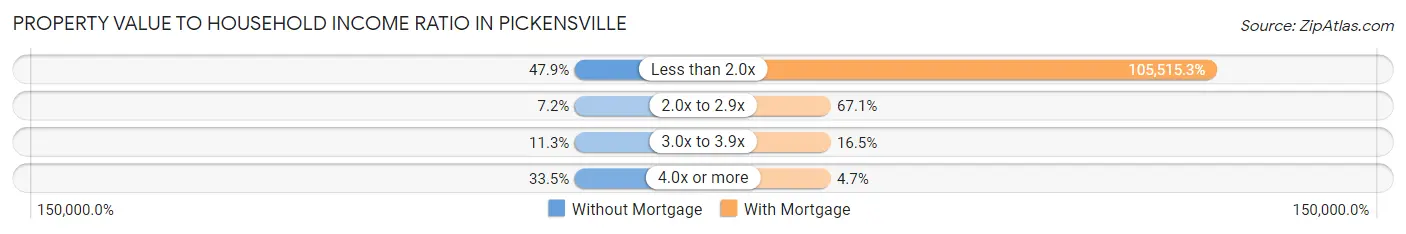
| Value-to-Income Ratio | Without Mortgage | With Mortgage |
| Less than 2.0x | 93 (47.9%) | 89,688 (105,515.3%) |
| 2.0x to 2.9x | 14 (7.2%) | 57 (67.1%) |
| 3.0x to 3.9x | 22 (11.3%) | 14 (16.5%) |
| 4.0x or more | 65 (33.5%) | 4 (4.7%) |
| Total | 194 (100.0%) | 85 (100.0%) |
Real Estate Taxes by Mortgage Status in Pickensville
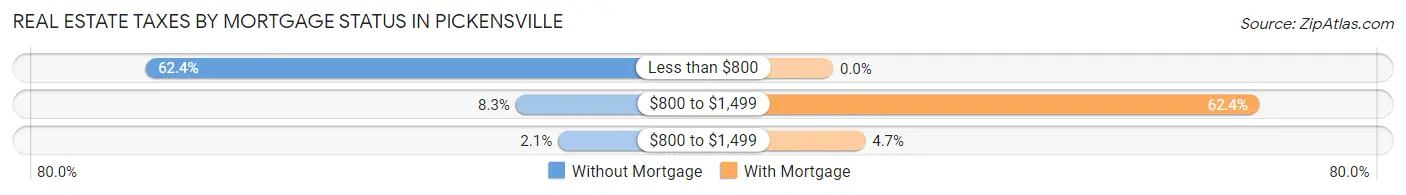
| Property Taxes | Without Mortgage | With Mortgage |
| Less than $800 | 121 (62.4%) | 0 (0.0%) |
| $800 to $1,499 | 16 (8.3%) | 53 (62.4%) |
| $800 to $1,499 | 4 (2.1%) | 4 (4.7%) |
| Total | 194 (100.0%) | 85 (100.0%) |
Health & Disability in Pickensville
Health Insurance Coverage by Age in Pickensville
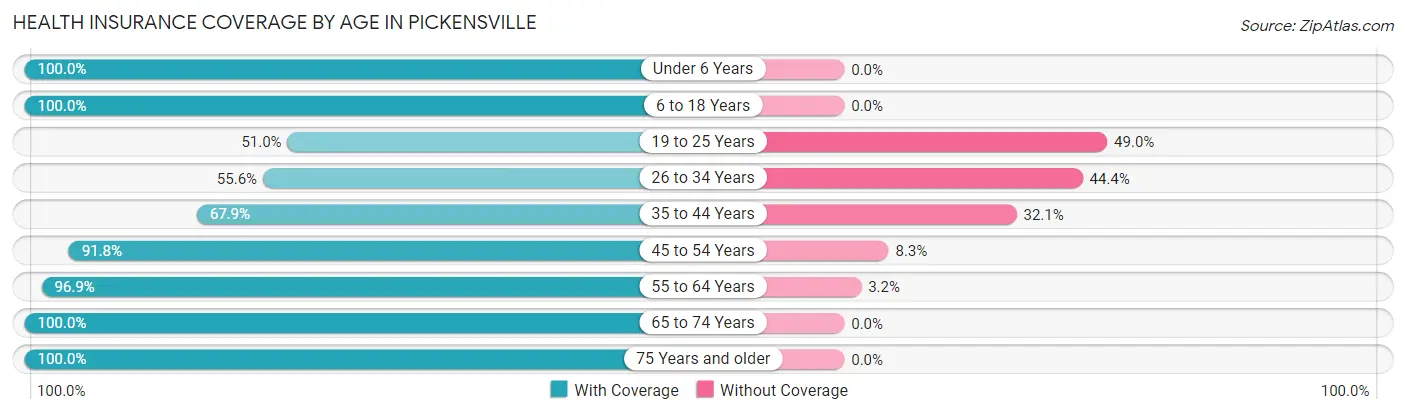
| Age Bracket | With Coverage | Without Coverage |
| Under 6 Years | 12 (100.0%) | 0 (0.0%) |
| 6 to 18 Years | 39 (100.0%) | 0 (0.0%) |
| 19 to 25 Years | 26 (51.0%) | 25 (49.0%) |
| 26 to 34 Years | 45 (55.6%) | 36 (44.4%) |
| 35 to 44 Years | 93 (67.9%) | 44 (32.1%) |
| 45 to 54 Years | 89 (91.7%) | 8 (8.3%) |
| 55 to 64 Years | 123 (96.9%) | 4 (3.2%) |
| 65 to 74 Years | 97 (100.0%) | 0 (0.0%) |
| 75 Years and older | 59 (100.0%) | 0 (0.0%) |
| Total | 583 (83.3%) | 117 (16.7%) |
Health Insurance Coverage by Citizenship Status in Pickensville
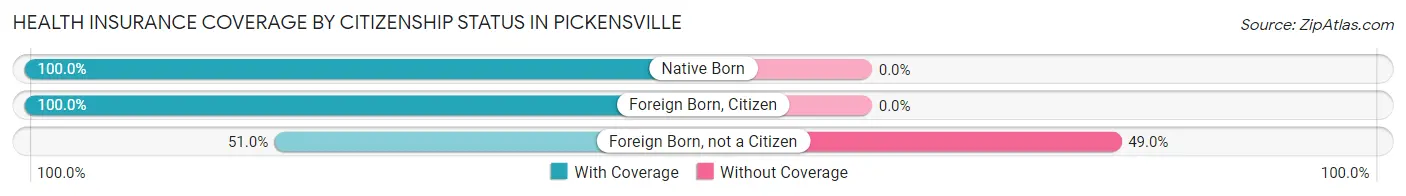
| Citizenship Status | With Coverage | Without Coverage |
| Native Born | 12 (100.0%) | 0 (0.0%) |
| Foreign Born, Citizen | 39 (100.0%) | 0 (0.0%) |
| Foreign Born, not a Citizen | 26 (51.0%) | 25 (49.0%) |
Health Insurance Coverage by Household Income in Pickensville
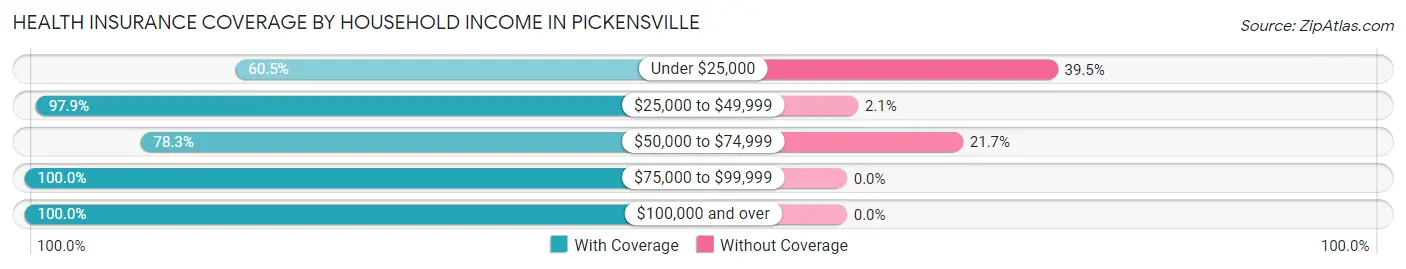
| Household Income | With Coverage | Without Coverage |
| Under $25,000 | 144 (60.5%) | 94 (39.5%) |
| $25,000 to $49,999 | 139 (97.9%) | 3 (2.1%) |
| $50,000 to $74,999 | 72 (78.3%) | 20 (21.7%) |
| $75,000 to $99,999 | 59 (100.0%) | 0 (0.0%) |
| $100,000 and over | 169 (100.0%) | 0 (0.0%) |
Public vs Private Health Insurance Coverage by Age in Pickensville
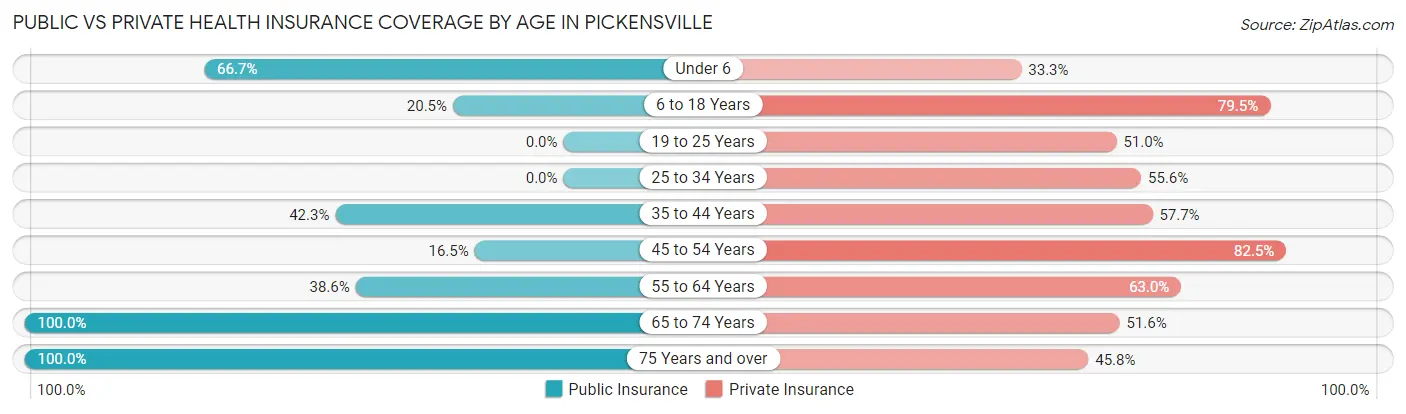
| Age Bracket | Public Insurance | Private Insurance |
| Under 6 | 8 (66.7%) | 4 (33.3%) |
| 6 to 18 Years | 8 (20.5%) | 31 (79.5%) |
| 19 to 25 Years | 0 (0.0%) | 26 (51.0%) |
| 25 to 34 Years | 0 (0.0%) | 45 (55.6%) |
| 35 to 44 Years | 58 (42.3%) | 79 (57.7%) |
| 45 to 54 Years | 16 (16.5%) | 80 (82.5%) |
| 55 to 64 Years | 49 (38.6%) | 80 (63.0%) |
| 65 to 74 Years | 97 (100.0%) | 50 (51.5%) |
| 75 Years and over | 59 (100.0%) | 27 (45.8%) |
| Total | 295 (42.1%) | 422 (60.3%) |
Disability Status by Sex by Age in Pickensville
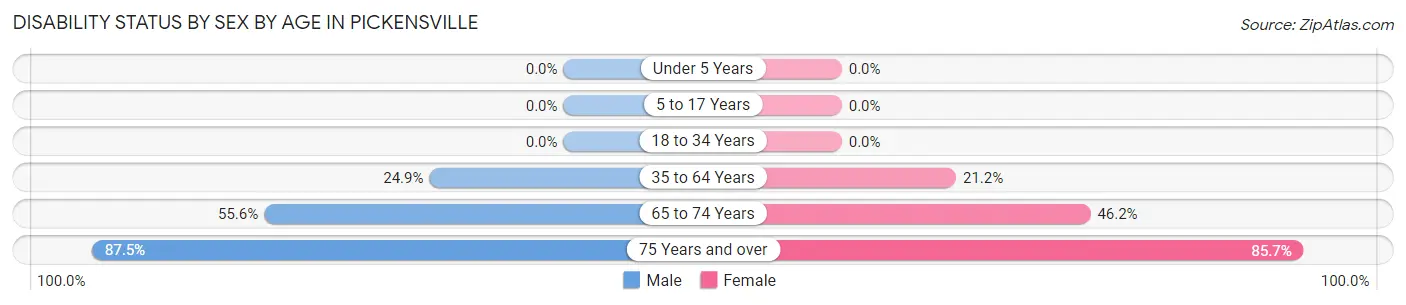
| Age Bracket | Male | Female |
| Under 5 Years | 0 (0.0%) | 0 (0.0%) |
| 5 to 17 Years | 0 (0.0%) | 0 (0.0%) |
| 18 to 34 Years | 0 (0.0%) | 0 (0.0%) |
| 35 to 64 Years | 57 (24.9%) | 28 (21.2%) |
| 65 to 74 Years | 25 (55.6%) | 24 (46.2%) |
| 75 Years and over | 21 (87.5%) | 30 (85.7%) |
Disability Class by Sex by Age in Pickensville
Disability Class: Hearing Difficulty
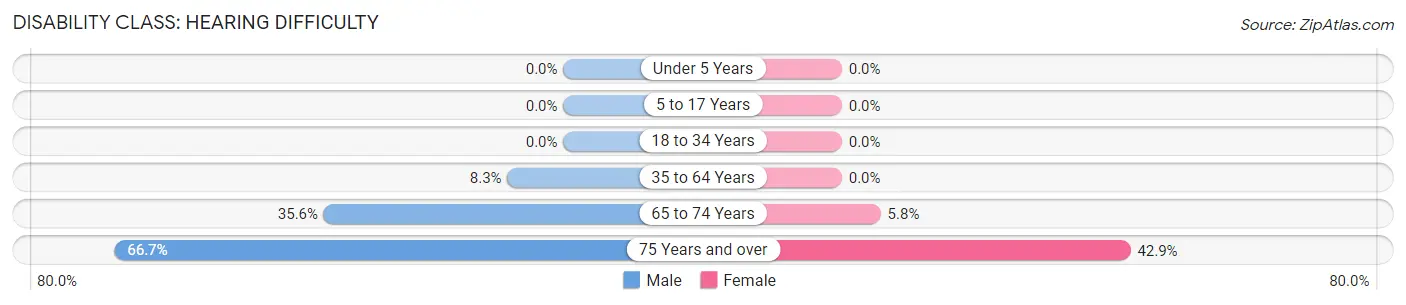
| Age Bracket | Male | Female |
| Under 5 Years | 0 (0.0%) | 0 (0.0%) |
| 5 to 17 Years | 0 (0.0%) | 0 (0.0%) |
| 18 to 34 Years | 0 (0.0%) | 0 (0.0%) |
| 35 to 64 Years | 19 (8.3%) | 0 (0.0%) |
| 65 to 74 Years | 16 (35.6%) | 3 (5.8%) |
| 75 Years and over | 16 (66.7%) | 15 (42.9%) |
Disability Class: Vision Difficulty
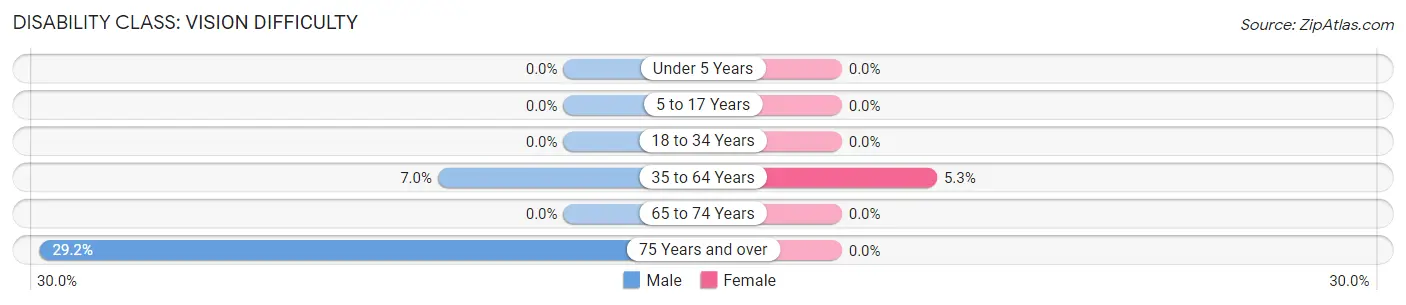
| Age Bracket | Male | Female |
| Under 5 Years | 0 (0.0%) | 0 (0.0%) |
| 5 to 17 Years | 0 (0.0%) | 0 (0.0%) |
| 18 to 34 Years | 0 (0.0%) | 0 (0.0%) |
| 35 to 64 Years | 16 (7.0%) | 7 (5.3%) |
| 65 to 74 Years | 0 (0.0%) | 0 (0.0%) |
| 75 Years and over | 7 (29.2%) | 0 (0.0%) |
Disability Class: Cognitive Difficulty
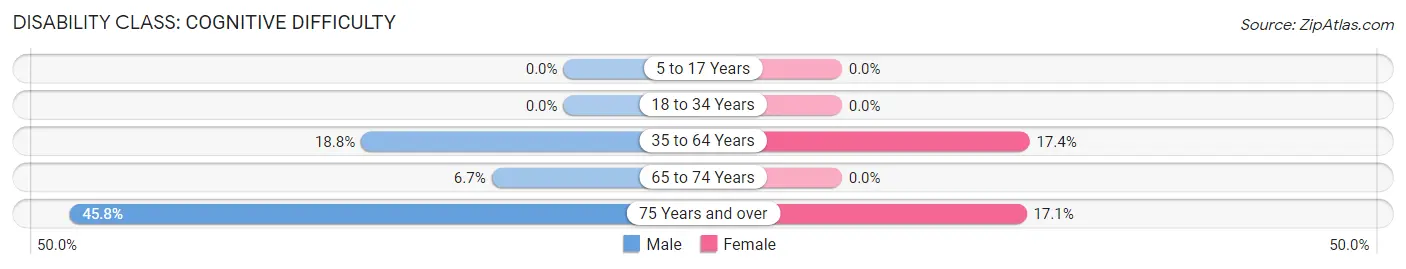
| Age Bracket | Male | Female |
| 5 to 17 Years | 0 (0.0%) | 0 (0.0%) |
| 18 to 34 Years | 0 (0.0%) | 0 (0.0%) |
| 35 to 64 Years | 43 (18.8%) | 23 (17.4%) |
| 65 to 74 Years | 3 (6.7%) | 0 (0.0%) |
| 75 Years and over | 11 (45.8%) | 6 (17.1%) |
Disability Class: Ambulatory Difficulty
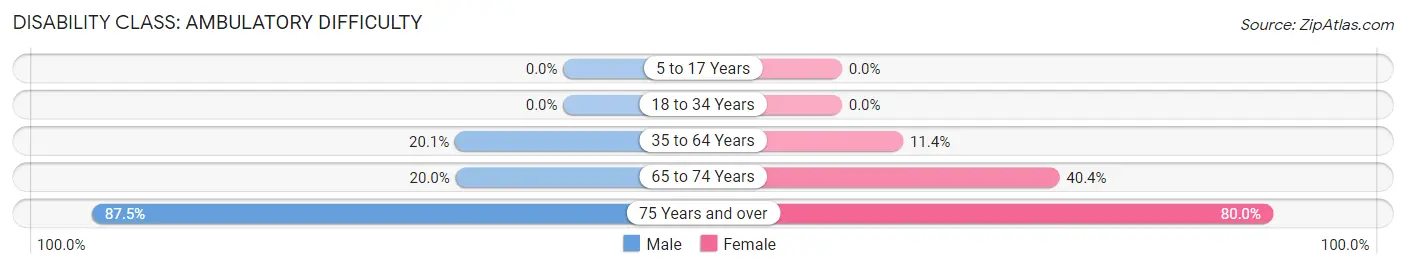
| Age Bracket | Male | Female |
| 5 to 17 Years | 0 (0.0%) | 0 (0.0%) |
| 18 to 34 Years | 0 (0.0%) | 0 (0.0%) |
| 35 to 64 Years | 46 (20.1%) | 15 (11.4%) |
| 65 to 74 Years | 9 (20.0%) | 21 (40.4%) |
| 75 Years and over | 21 (87.5%) | 28 (80.0%) |
Disability Class: Self-Care Difficulty
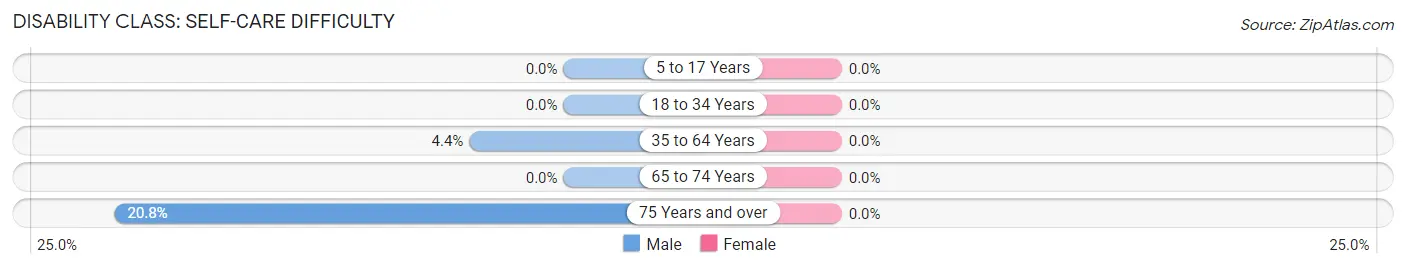
| Age Bracket | Male | Female |
| 5 to 17 Years | 0 (0.0%) | 0 (0.0%) |
| 18 to 34 Years | 0 (0.0%) | 0 (0.0%) |
| 35 to 64 Years | 10 (4.4%) | 0 (0.0%) |
| 65 to 74 Years | 0 (0.0%) | 0 (0.0%) |
| 75 Years and over | 5 (20.8%) | 0 (0.0%) |
Technology Access in Pickensville
Computing Device Access in Pickensville
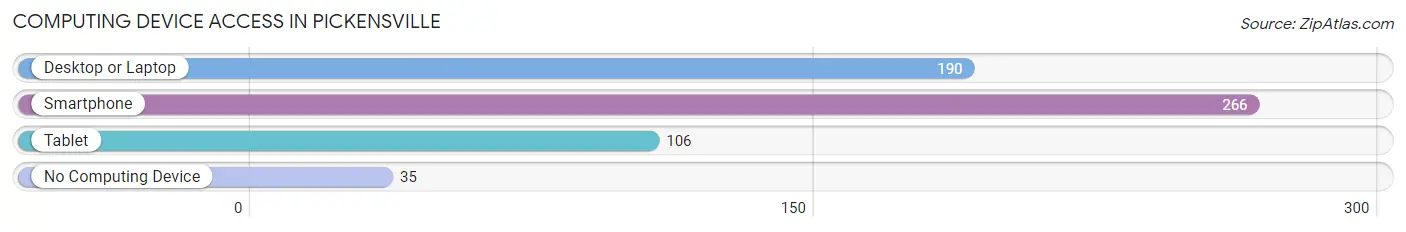
| Device Type | # Households | % Households |
| Desktop or Laptop | 190 | 58.3% |
| Smartphone | 266 | 81.6% |
| Tablet | 106 | 32.5% |
| No Computing Device | 35 | 10.7% |
| Total | 326 | 100.0% |
Internet Access in Pickensville
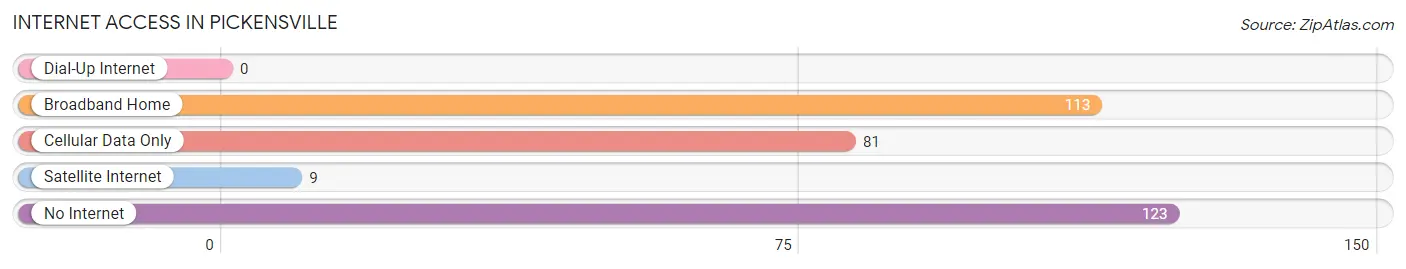
| Internet Type | # Households | % Households |
| Dial-Up Internet | 0 | 0.0% |
| Broadband Home | 113 | 34.7% |
| Cellular Data Only | 81 | 24.8% |
| Satellite Internet | 9 | 2.8% |
| No Internet | 123 | 37.7% |
| Total | 326 | 100.0% |
Pickensville Summary
Pickensville is a small town located in Pickens County, Alabama. It is situated on the banks of the Tombigbee River, approximately 20 miles south of Tuscaloosa. The town was founded in 1820 and named after General Andrew Pickens, a Revolutionary War hero. The population of Pickensville was estimated to be 545 in 2019.
History
Pickensville was founded in 1820 by General Andrew Pickens, a Revolutionary War hero. The town was originally known as Pickensville, but the name was changed to Pickens Court House in 1821. The town was the county seat of Pickens County until 1868, when the county seat was moved to Carrollton.
Pickensville was an important trading center in the early 19th century. The town was home to several stores, a hotel, a post office, and a cotton gin. The town was also home to a number of churches, including the First Baptist Church of Pickensville, which was founded in 1821.
In the late 19th century, Pickensville was a major stop on the Mobile and Ohio Railroad. The railroad brought new economic opportunities to the town, and the population grew to over 1,000 by the early 20th century.
Geography
Pickensville is located in Pickens County, Alabama. The town is situated on the banks of the Tombigbee River, approximately 20 miles south of Tuscaloosa. The town is located in the Black Belt region of Alabama, an area known for its rich soil and agricultural production.
The climate in Pickensville is humid subtropical, with hot, humid summers and mild winters. The average annual temperature is around 68°F (20°C). The average annual precipitation is around 50 inches (127 cm).
Economy
Pickensville’s economy is largely based on agriculture. The town is home to several farms, which produce cotton, soybeans, corn, and other crops. The town is also home to several small businesses, including a grocery store, a hardware store, and a restaurant.
The town is also home to a number of manufacturing companies, including a furniture factory and a woodworking plant. The town is also home to a number of service-based businesses, including a bank, a post office, and a number of medical and dental offices.
Demographics
According to the 2019 U.S. Census, the population of Pickensville was estimated to be 545. The racial makeup of the town was 94.2% White, 4.2% African American, 0.2% Native American, 0.2% Asian, and 1.2% from other races. The median household income was $31,250, and the median home value was $87,500.
Pickensville is a small, rural town with a close-knit community. The town is home to a number of churches, including the First Baptist Church of Pickensville, which was founded in 1821. The town is also home to a number of civic organizations, including the Pickensville Lions Club and the Pickensville Historical Society.
Common Questions
What is the Total Population of Pickensville?
Total Population of Pickensville is 706.
What is the Total Male Population of Pickensville?
Total Male Population of Pickensville is 380.
What is the Total Female Population of Pickensville?
Total Female Population of Pickensville is 326.
What is the Ratio of Males per 100 Females in Pickensville?
There are 116.56 Males per 100 Females in Pickensville.
What is the Ratio of Females per 100 Males in Pickensville?
There are 85.79 Females per 100 Males in Pickensville.
What is the Median Population Age in Pickensville?
Median Population Age in Pickensville is 48.6 Years.
What is the Average Family Size in Pickensville
Average Family Size in Pickensville is 2.6 People.
What is the Average Household Size in Pickensville
Average Household Size in Pickensville is 2.2 People.
What is Per Capita Income in Pickensville?
Per Capita income in Pickensville is $29,239.
What is the Median Family Income in Pickensville?
Median Family Income in Pickensville is $61,615.
What is the Median Household income in Pickensville?
Median Household Income in Pickensville is $45,926.
What is Inequality or Gini Index in Pickensville?
Inequality or Gini Index in Pickensville is 0.43.
How Large is the Labor Force in Pickensville?
There are 312 People in the Labor Forcein in Pickensville.
What is the Percentage of People in the Labor Force in Pickensville?
47.3% of People are in the Labor Force in Pickensville.
What is the Unemployment Rate in Pickensville?
Unemployment Rate in Pickensville is 4.2%.