Zip Codes with the Highest Percentage of Population with a Degree in Liberal Arts and History in Pell City, AL
RELATED REPORTS & OPTIONS
Liberal Arts and History
Pell City
Compare Zip Codes
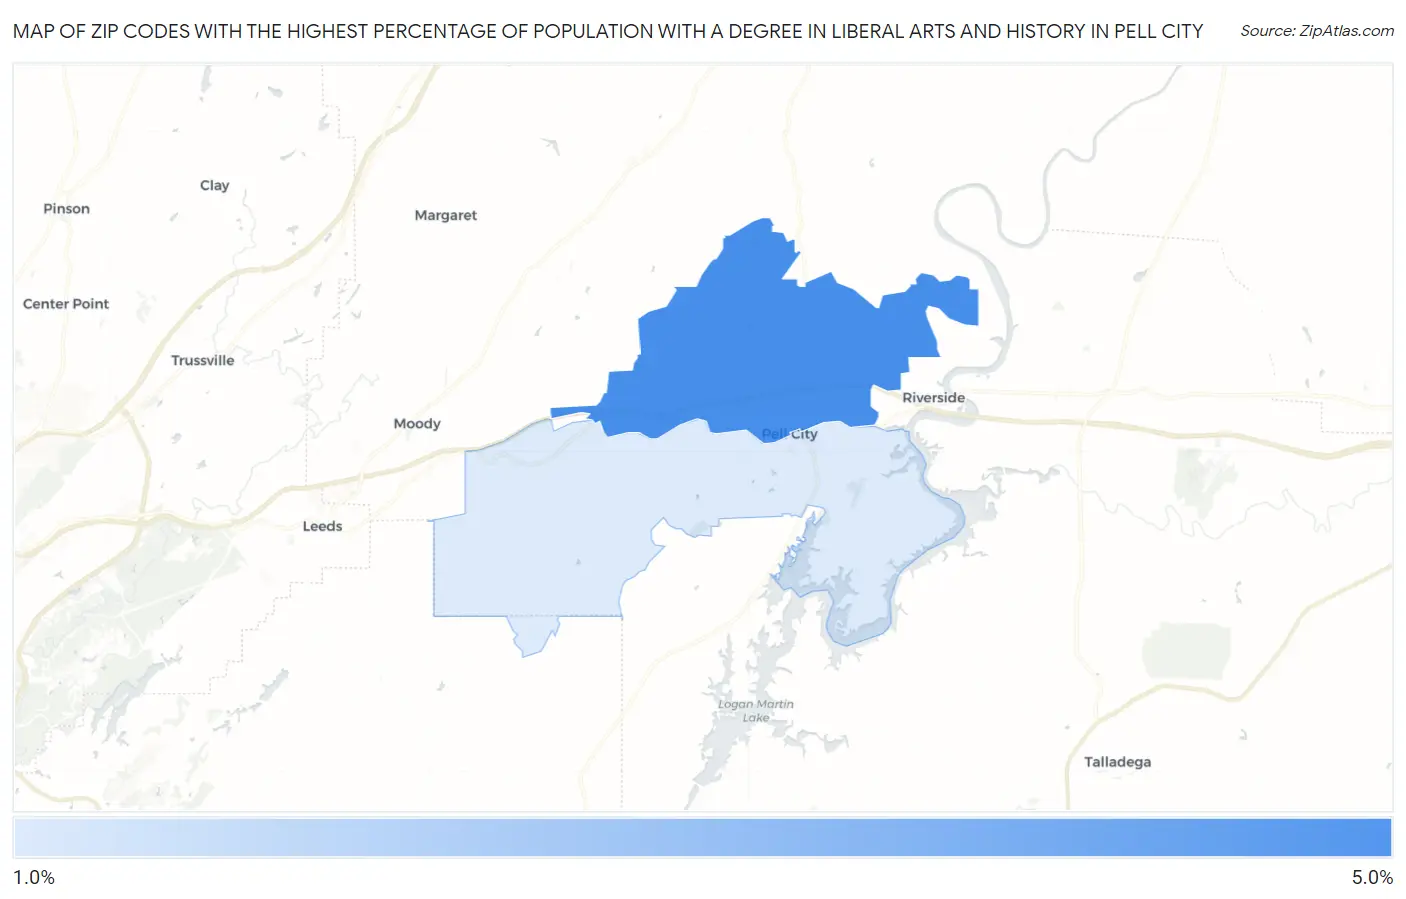
Map of Zip Codes with the Highest Percentage of Population with a Degree in Liberal Arts and History in Pell City
0.0%
5.0%
Zip Codes with the Highest Percentage of Population with a Degree in Liberal Arts and History in Pell City, AL
| Zip Code | % Graduates | vs State | vs National | |
| 1. | 35125 | 4.7% | 4.6%(+0.147)#245 | 4.9%(-0.174)#12,321 |
| 2. | 35128 | 1.9% | 4.6%(-2.64)#405 | 4.9%(-2.96)#21,592 |
1
Common Questions
What are the Top Zip Codes with the Highest Percentage of Population with a Degree in Liberal Arts and History in Pell City, AL?
Top Zip Codes with the Highest Percentage of Population with a Degree in Liberal Arts and History in Pell City, AL are:
What zip code has the Highest Percentage of Population with a Degree in Liberal Arts and History in Pell City, AL?
35125 has the Highest Percentage of Population with a Degree in Liberal Arts and History in Pell City, AL with 4.7%.
What is the Percentage of Population with a Degree in Liberal Arts and History in Pell City, AL?
Percentage of Population with a Degree in Liberal Arts and History in Pell City is 3.3%.
What is the Percentage of Population with a Degree in Liberal Arts and History in Alabama?
Percentage of Population with a Degree in Liberal Arts and History in Alabama is 4.6%.
What is the Percentage of Population with a Degree in Liberal Arts and History in the United States?
Percentage of Population with a Degree in Liberal Arts and History in the United States is 4.9%.