Zip Codes with the Highest Percentage of Population with a Degree in Liberal Arts and History in Albertville, AL
RELATED REPORTS & OPTIONS
Liberal Arts and History
Albertville
Compare Zip Codes
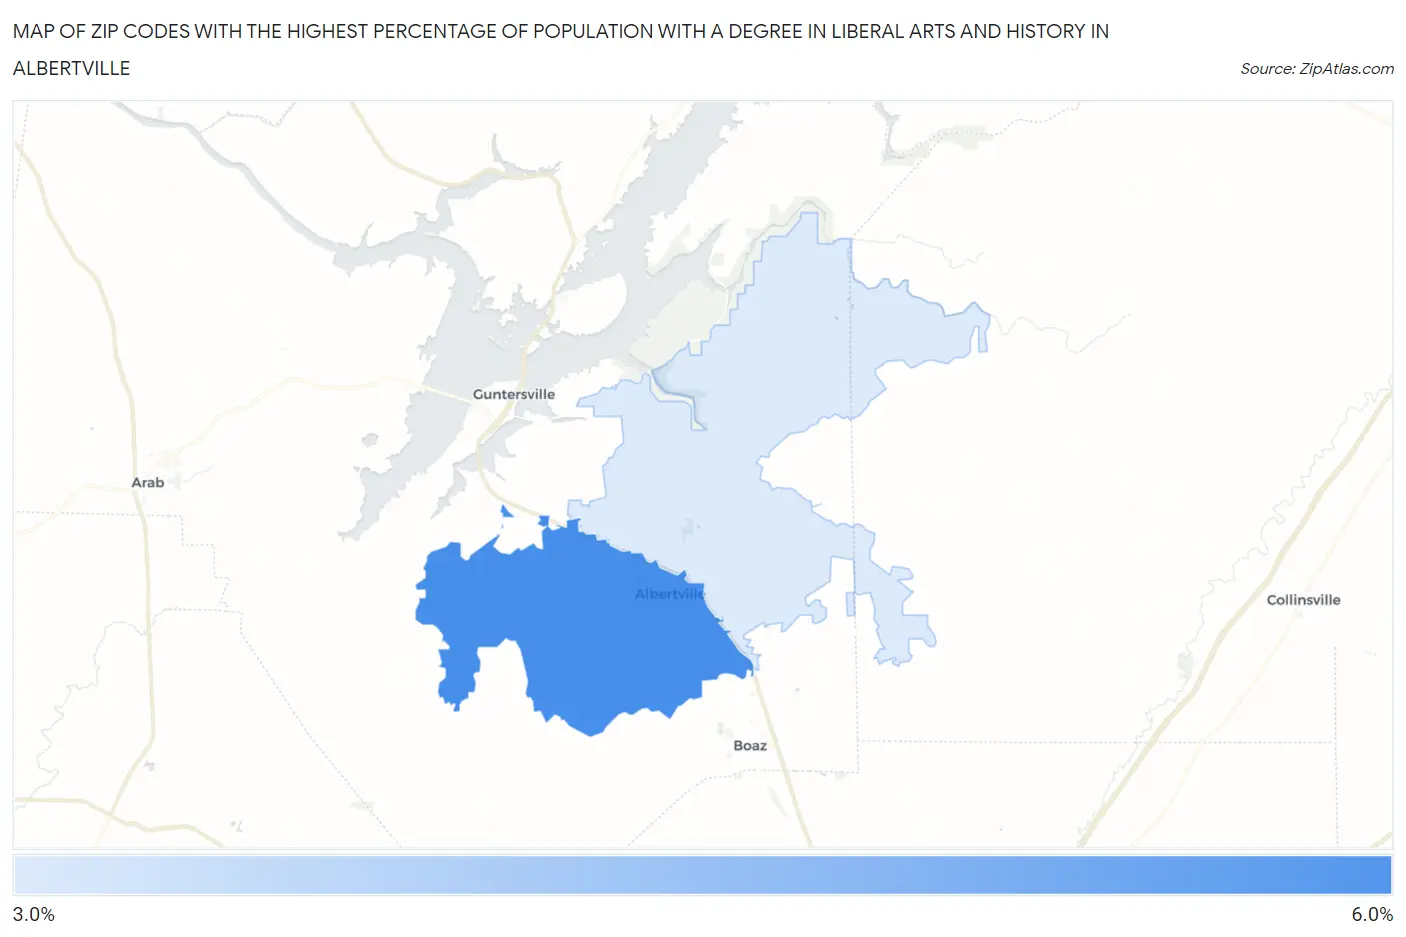
Map of Zip Codes with the Highest Percentage of Population with a Degree in Liberal Arts and History in Albertville
0.0%
6.0%
Zip Codes with the Highest Percentage of Population with a Degree in Liberal Arts and History in Albertville, AL
| Zip Code | % Graduates | vs State | vs National | |
| 1. | 35950 | 5.6% | 4.6%(+1.04)#185 | 4.9%(+0.717)#9,598 |
| 2. | 35951 | 3.8% | 4.6%(-0.791)#298 | 4.9%(-1.11)#15,668 |
1
Common Questions
What are the Top Zip Codes with the Highest Percentage of Population with a Degree in Liberal Arts and History in Albertville, AL?
Top Zip Codes with the Highest Percentage of Population with a Degree in Liberal Arts and History in Albertville, AL are:
What zip code has the Highest Percentage of Population with a Degree in Liberal Arts and History in Albertville, AL?
35950 has the Highest Percentage of Population with a Degree in Liberal Arts and History in Albertville, AL with 5.6%.
What is the Percentage of Population with a Degree in Liberal Arts and History in Albertville, AL?
Percentage of Population with a Degree in Liberal Arts and History in Albertville is 4.3%.
What is the Percentage of Population with a Degree in Liberal Arts and History in Alabama?
Percentage of Population with a Degree in Liberal Arts and History in Alabama is 4.6%.
What is the Percentage of Population with a Degree in Liberal Arts and History in the United States?
Percentage of Population with a Degree in Liberal Arts and History in the United States is 4.9%.