Our Town, AL
Our Town Map
Our Town Overview
738
TOTAL POPULATION
333
MALE POPULATION
405
FEMALE POPULATION
82.22
MALES / 100 FEMALES
121.62
FEMALES / 100 MALES
47.6
MEDIAN AGE
3.1
AVG FAMILY SIZE
2.9
AVG HOUSEHOLD SIZE
$41,789
PER CAPITA INCOME
$85,948
AVG FAMILY INCOME
$86,983
AVG HOUSEHOLD INCOME
40.7%
WAGE / INCOME GAP [ % ]
59.3¢/ $1
WAGE / INCOME GAP [ $ ]
0.38
INEQUALITY / GINI INDEX
471
LABOR FORCE [ PEOPLE ]
75.7%
PERCENT IN LABOR FORCE
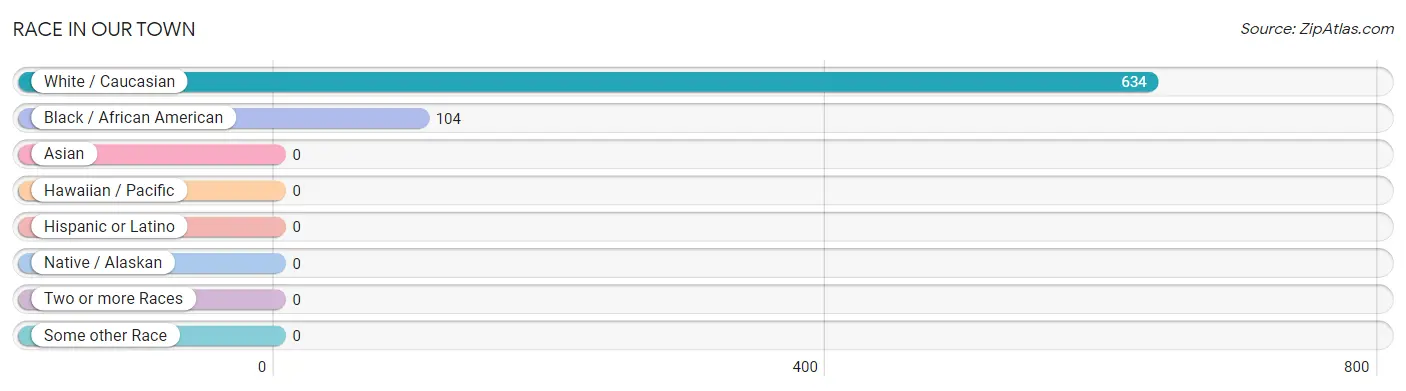
Race in Our Town
The most populous races in Our Town are White / Caucasian (634 | 85.9%), and Black / African American (104 | 14.1%).
| Race | # Population | % Population |
| Asian | 0 | 0.0% |
| Black / African American | 104 | 14.1% |
| Hawaiian / Pacific | 0 | 0.0% |
| Hispanic or Latino | 0 | 0.0% |
| Native / Alaskan | 0 | 0.0% |
| White / Caucasian | 634 | 85.9% |
| Two or more Races | 0 | 0.0% |
| Some other Race | 0 | 0.0% |
| Total | 738 | 100.0% |
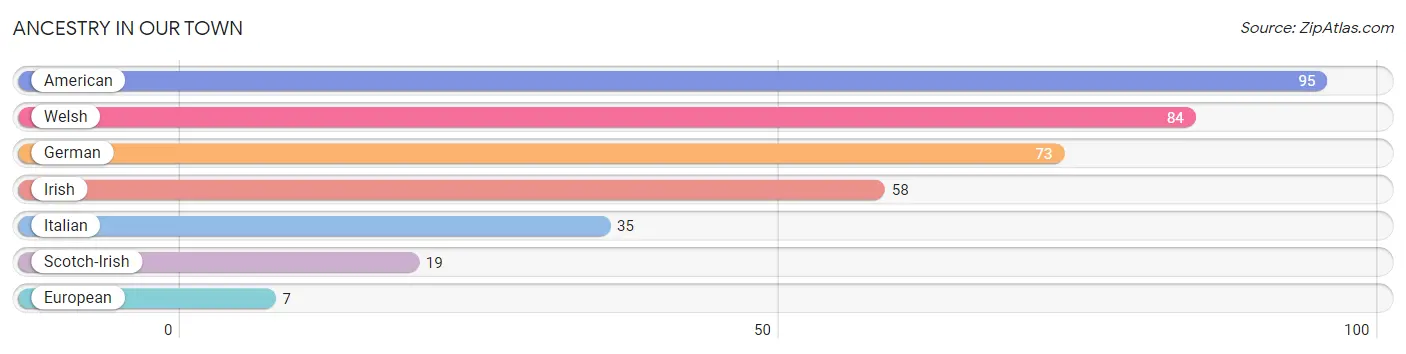
Ancestry in Our Town
The most populous ancestries reported in Our Town are American (95 | 12.9%), Welsh (84 | 11.4%), German (73 | 9.9%), Irish (58 | 7.9%), and Italian (35 | 4.7%), together accounting for 46.7% of all Our Town residents.
| Ancestry | # Population | % Population |
| American | 95 | 12.9% |
| European | 7 | 0.9% |
| German | 73 | 9.9% |
| Irish | 58 | 7.9% |
| Italian | 35 | 4.7% |
| Scotch-Irish | 19 | 2.6% |
| Welsh | 84 | 11.4% | View All 7 Rows |
Immigrants in Our Town

| Immigration Origin | # Population | % Population | View All 0 Rows |
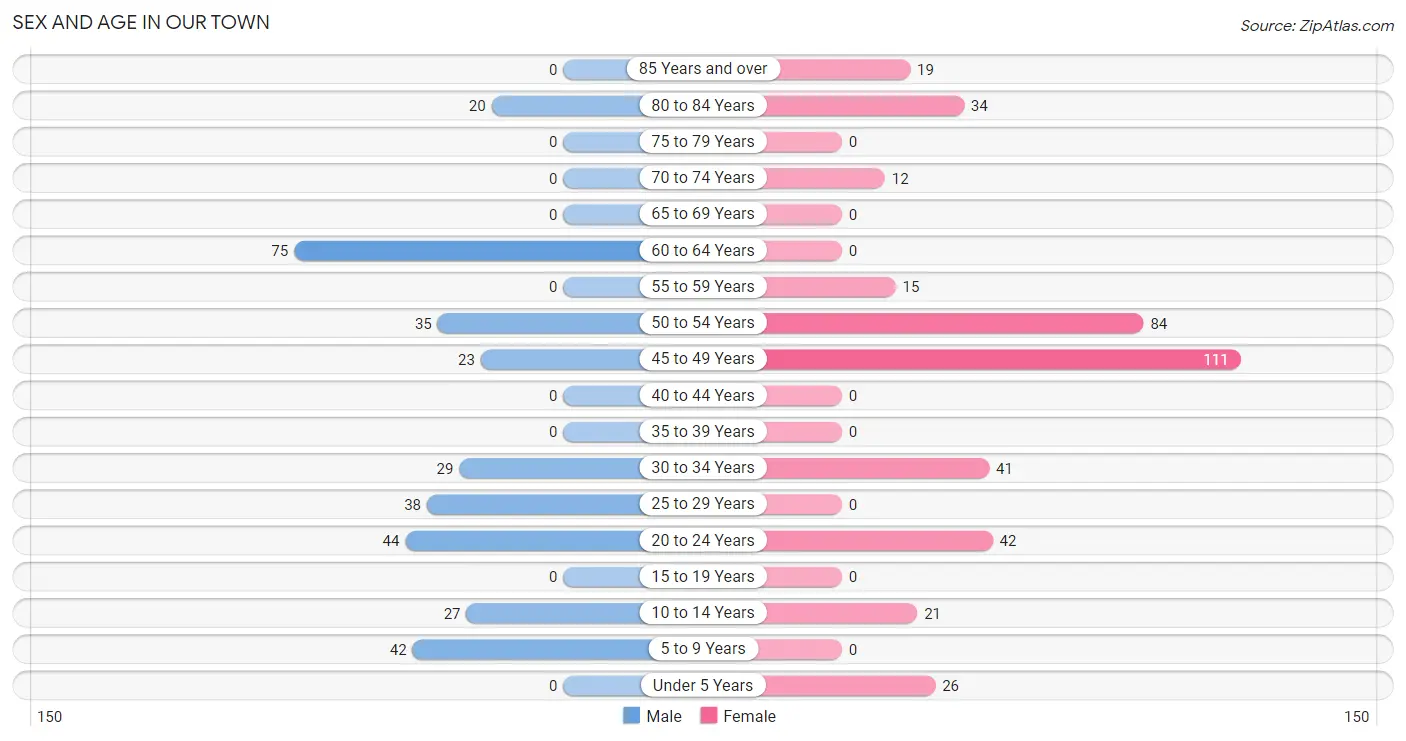
Sex and Age in Our Town
Sex and Age in Our Town
The most populous age groups in Our Town are 60 to 64 Years (75 | 22.5%) for men and 45 to 49 Years (111 | 27.4%) for women.
| Age Bracket | Male | Female |
| Under 5 Years | 0 (0.0%) | 26 (6.4%) |
| 5 to 9 Years | 42 (12.6%) | 0 (0.0%) |
| 10 to 14 Years | 27 (8.1%) | 21 (5.2%) |
| 15 to 19 Years | 0 (0.0%) | 0 (0.0%) |
| 20 to 24 Years | 44 (13.2%) | 42 (10.4%) |
| 25 to 29 Years | 38 (11.4%) | 0 (0.0%) |
| 30 to 34 Years | 29 (8.7%) | 41 (10.1%) |
| 35 to 39 Years | 0 (0.0%) | 0 (0.0%) |
| 40 to 44 Years | 0 (0.0%) | 0 (0.0%) |
| 45 to 49 Years | 23 (6.9%) | 111 (27.4%) |
| 50 to 54 Years | 35 (10.5%) | 84 (20.7%) |
| 55 to 59 Years | 0 (0.0%) | 15 (3.7%) |
| 60 to 64 Years | 75 (22.5%) | 0 (0.0%) |
| 65 to 69 Years | 0 (0.0%) | 0 (0.0%) |
| 70 to 74 Years | 0 (0.0%) | 12 (3.0%) |
| 75 to 79 Years | 0 (0.0%) | 0 (0.0%) |
| 80 to 84 Years | 20 (6.0%) | 34 (8.4%) |
| 85 Years and over | 0 (0.0%) | 19 (4.7%) |
| Total | 333 (100.0%) | 405 (100.0%) |
Families and Households in Our Town
Median Family Size in Our Town
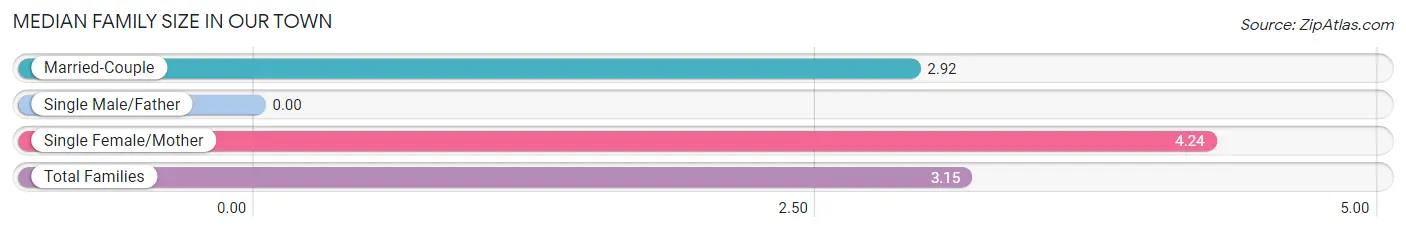
| Family Type | # Families | Family Size |
| Married-Couple | 179 (82.9%) | 2.92 |
| Single Male/Father | 0 (0.0%) | - |
| Single Female/Mother | 37 (17.1%) | 4.24 |
| Total Families | 216 (100.0%) | 3.15 |
Median Household Size in Our Town
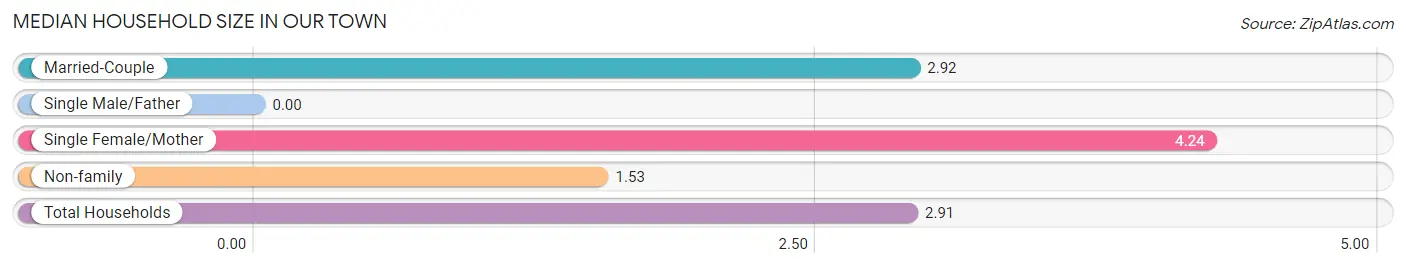
| Household Type | # Households | Household Size |
| Married-Couple | 179 (70.5%) | 2.92 |
| Single Male/Father | 0 (0.0%) | - |
| Single Female/Mother | 37 (14.6%) | 4.24 |
| Non-family | 38 (15.0%) | 1.53 |
| Total Households | 254 (100.0%) | 2.91 |
Household Size by Marriage Status in Our Town
Out of a total of 254 households in Our Town, 216 (85.0%) are family households, while 38 (15.0%) are nonfamily households. The most numerous type of family households are 2-person households, comprising 110, and the most common type of nonfamily households are 1-person households, comprising 19.
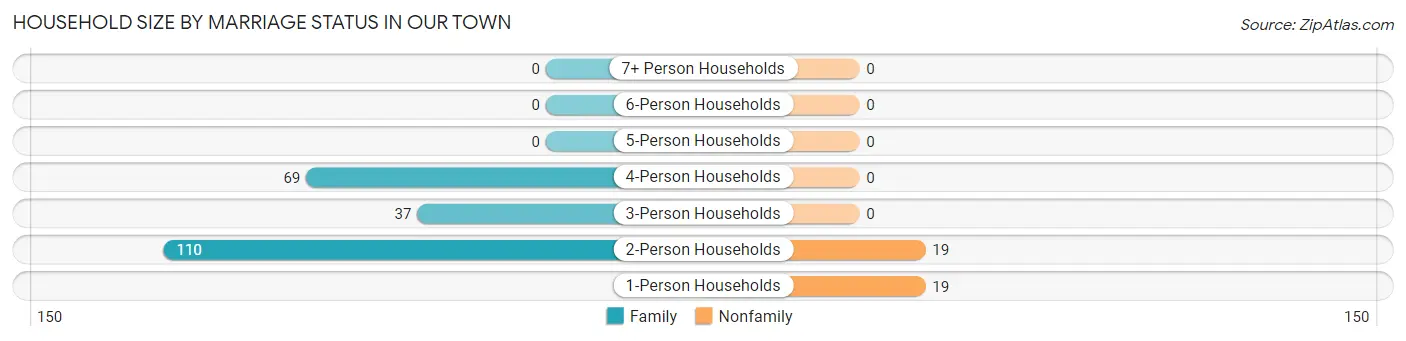
| Household Size | Family Households | Nonfamily Households |
| 1-Person Households | - | 19 (7.5%) |
| 2-Person Households | 110 (43.3%) | 19 (7.5%) |
| 3-Person Households | 37 (14.6%) | 0 (0.0%) |
| 4-Person Households | 69 (27.2%) | 0 (0.0%) |
| 5-Person Households | 0 (0.0%) | 0 (0.0%) |
| 6-Person Households | 0 (0.0%) | 0 (0.0%) |
| 7+ Person Households | 0 (0.0%) | 0 (0.0%) |
| Total | 216 (85.0%) | 38 (15.0%) |
Female Fertility in Our Town
Fertility by Age in Our Town
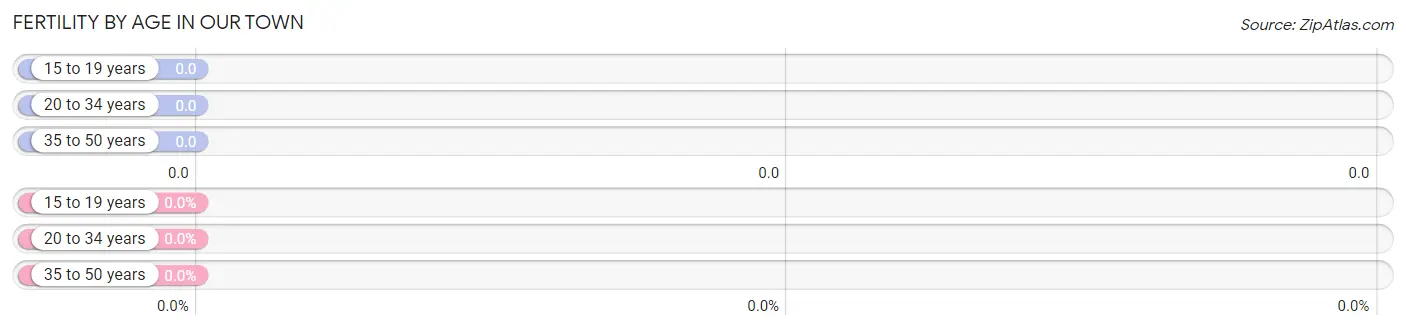
| Age Bracket | Women with Births | Births / 1,000 Women |
| 15 to 19 years | 0 (0.0%) | 0.0 |
| 20 to 34 years | 0 (0.0%) | 0.0 |
| 35 to 50 years | 0 (0.0%) | 0.0 |
| Total | 0 (0.0%) | 0.0 |
Fertility by Age by Marriage Status in Our Town
| Age Bracket | Married | Unmarried |
| 15 to 19 years | 0 (0.0%) | 0 (0.0%) |
| 20 to 34 years | 0 (0.0%) | 0 (0.0%) |
| 35 to 50 years | 0 (0.0%) | 0 (0.0%) |
| Total | 0 (0.0%) | 0 (0.0%) |
Fertility by Education in Our Town
| Educational Attainment | Women with Births | Births / 1,000 Women |
| Less than High School | 0 (0.0%) | 0.0 |
| High School Diploma | 0 (0.0%) | 0.0 |
| College or Associate's Degree | 0 (0.0%) | 0.0 |
| Bachelor's Degree | 0 (0.0%) | 0.0 |
| Graduate Degree | 0 (0.0%) | 0.0 |
| Total | 0 (0.0%) | 0.0 |
Fertility by Education by Marriage Status in Our Town
| Educational Attainment | Married | Unmarried |
| Less than High School | 0 (0.0%) | 0 (0.0%) |
| High School Diploma | 0 (0.0%) | 0 (0.0%) |
| College or Associate's Degree | 0 (0.0%) | 0 (0.0%) |
| Bachelor's Degree | 0 (0.0%) | 0 (0.0%) |
| Graduate Degree | 0 (0.0%) | 0 (0.0%) |
| Total | 0 (0.0%) | 0 (0.0%) |
Income in Our Town
Income Overview in Our Town
Per Capita Income in Our Town is $41,789, while median incomes of families and households are $85,948 and $86,983 respectively.
| Characteristic | Number | Measure |
| Per Capita Income | 738 | $41,789 |
| Median Family Income | 216 | $85,948 |
| Mean Family Income | 216 | $86,725 |
| Median Household Income | 254 | $86,983 |
| Mean Household Income | 254 | $111,628 |
| Income Deficit | 216 | $0 |
| Wage / Income Gap (%) | 738 | 40.66% |
| Wage / Income Gap ($) | 738 | 59.34¢ per $1 |
| Gini / Inequality Index | 738 | 0.38 |
Earnings by Sex in Our Town
Average Earnings in Our Town are $37,401, $53,267 for men and $31,607 for women, a difference of 40.7%.
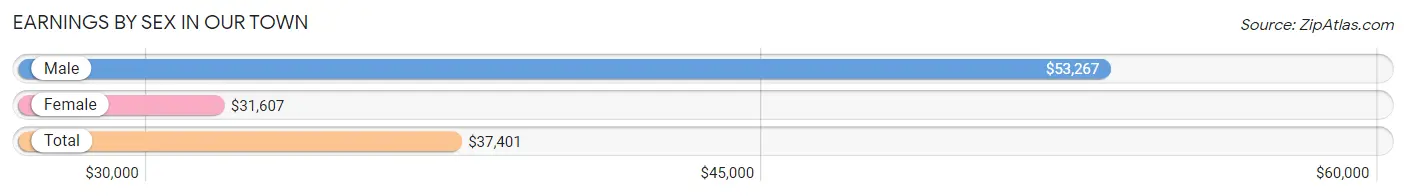
| Sex | Number | Average Earnings |
| Male | 215 (45.7%) | $53,267 |
| Female | 256 (54.3%) | $31,607 |
| Total | 471 (100.0%) | $37,401 |
Earnings by Sex by Income Bracket in Our Town
The most common earnings brackets in Our Town are $50,000 to $54,999 for men (44 | 20.5%) and $45,000 to $49,999 for women (98 | 38.3%).
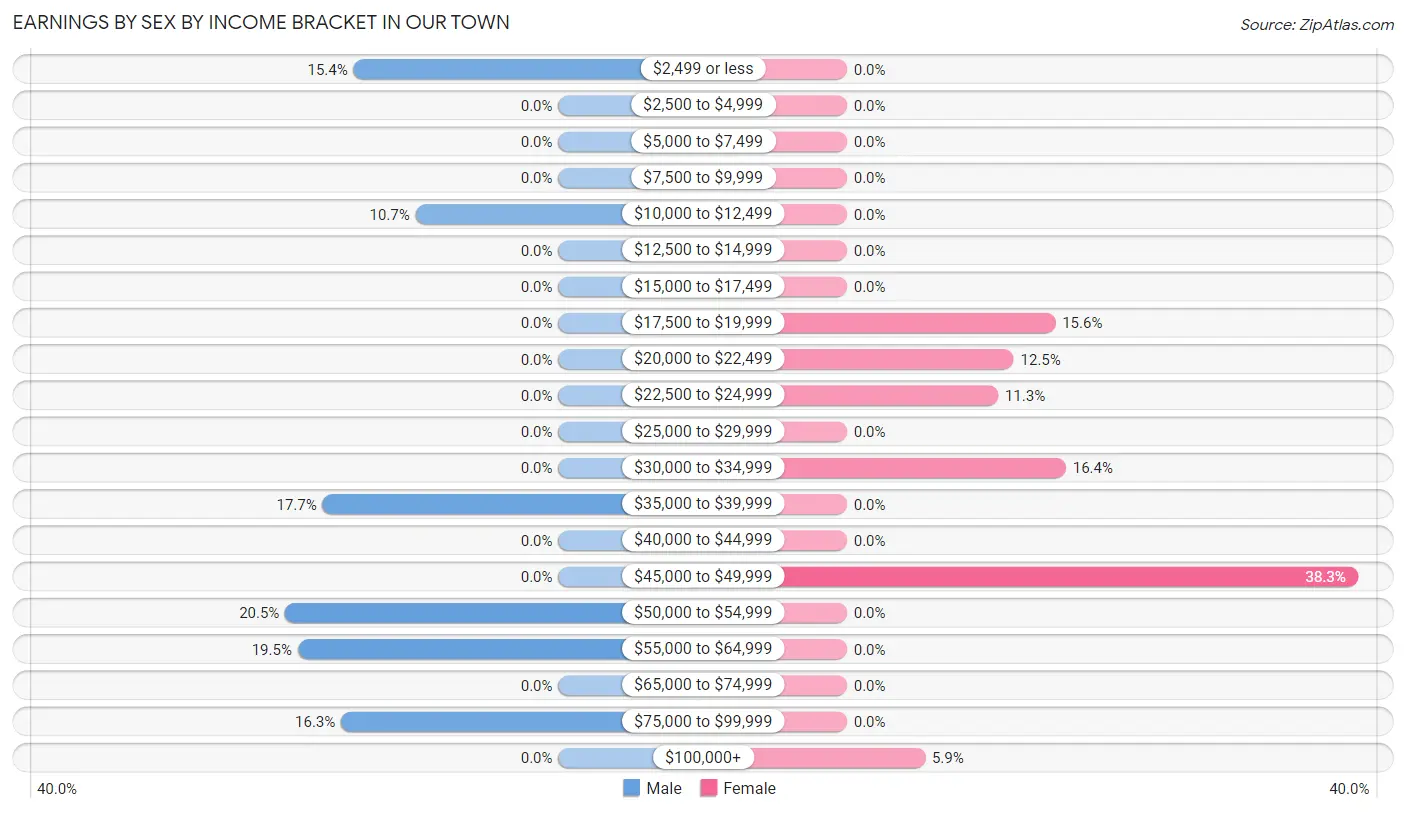
| Income | Male | Female |
| $2,499 or less | 33 (15.3%) | 0 (0.0%) |
| $2,500 to $4,999 | 0 (0.0%) | 0 (0.0%) |
| $5,000 to $7,499 | 0 (0.0%) | 0 (0.0%) |
| $7,500 to $9,999 | 0 (0.0%) | 0 (0.0%) |
| $10,000 to $12,499 | 23 (10.7%) | 0 (0.0%) |
| $12,500 to $14,999 | 0 (0.0%) | 0 (0.0%) |
| $15,000 to $17,499 | 0 (0.0%) | 0 (0.0%) |
| $17,500 to $19,999 | 0 (0.0%) | 40 (15.6%) |
| $20,000 to $22,499 | 0 (0.0%) | 32 (12.5%) |
| $22,500 to $24,999 | 0 (0.0%) | 29 (11.3%) |
| $25,000 to $29,999 | 0 (0.0%) | 0 (0.0%) |
| $30,000 to $34,999 | 0 (0.0%) | 42 (16.4%) |
| $35,000 to $39,999 | 38 (17.7%) | 0 (0.0%) |
| $40,000 to $44,999 | 0 (0.0%) | 0 (0.0%) |
| $45,000 to $49,999 | 0 (0.0%) | 98 (38.3%) |
| $50,000 to $54,999 | 44 (20.5%) | 0 (0.0%) |
| $55,000 to $64,999 | 42 (19.5%) | 0 (0.0%) |
| $65,000 to $74,999 | 0 (0.0%) | 0 (0.0%) |
| $75,000 to $99,999 | 35 (16.3%) | 0 (0.0%) |
| $100,000+ | 0 (0.0%) | 15 (5.9%) |
| Total | 215 (100.0%) | 256 (100.0%) |
Earnings by Sex by Educational Attainment in Our Town
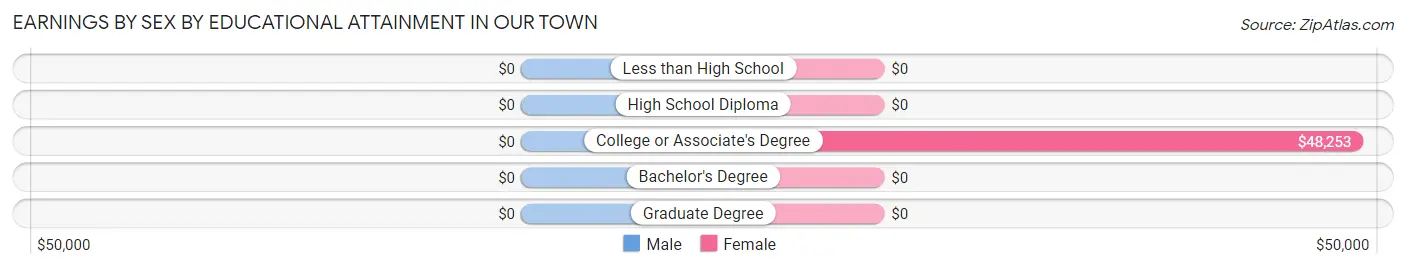
| Educational Attainment | Male Income | Female Income |
| Less than High School | - | - |
| High School Diploma | - | - |
| College or Associate's Degree | - | - |
| Bachelor's Degree | - | - |
| Graduate Degree | - | - |
| Total | - | - |
Family Income in Our Town
Family Income Brackets in Our Town
According to the Our Town family income data, there are 81 families falling into the $50,000 to $74,999 income range, which is the most common income bracket and makes up 37.5% of all families.
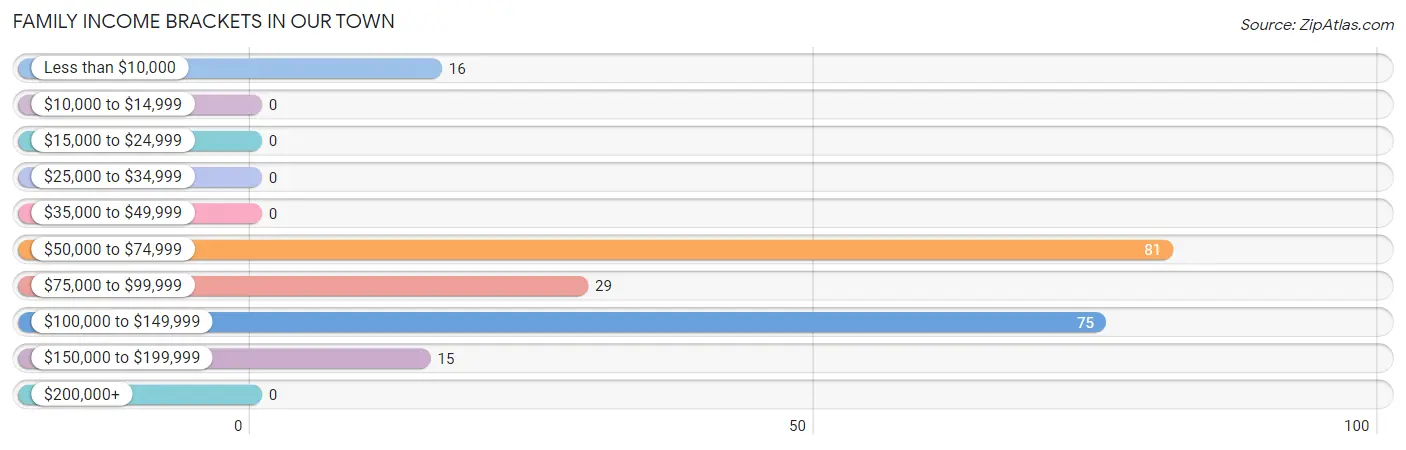
| Income Bracket | # Families | % Families |
| Less than $10,000 | 16 | 7.4% |
| $10,000 to $14,999 | 0 | 0.0% |
| $15,000 to $24,999 | 0 | 0.0% |
| $25,000 to $34,999 | 0 | 0.0% |
| $35,000 to $49,999 | 0 | 0.0% |
| $50,000 to $74,999 | 81 | 37.5% |
| $75,000 to $99,999 | 29 | 13.4% |
| $100,000 to $149,999 | 75 | 34.7% |
| $150,000 to $199,999 | 15 | 6.9% |
| $200,000+ | 0 | 0.0% |
Family Income by Famaliy Size in Our Town
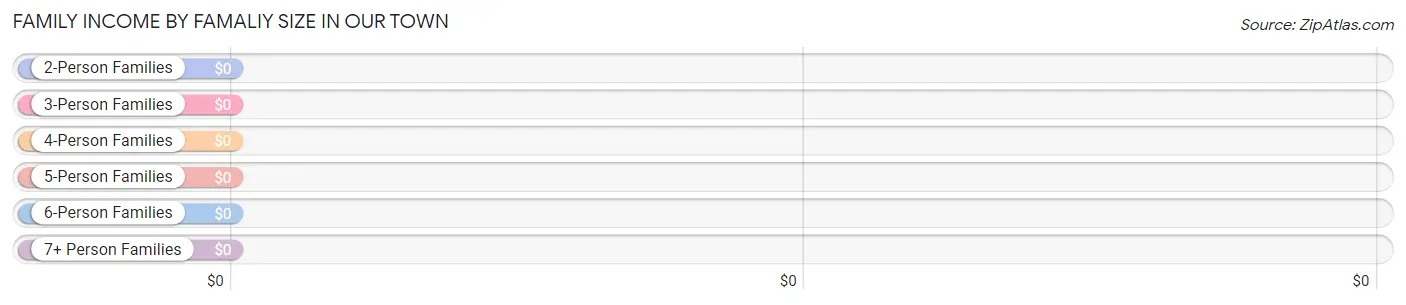
| Income Bracket | # Families | Median Income |
| 2-Person Families | 110 (50.9%) | $0 |
| 3-Person Families | 37 (17.1%) | $0 |
| 4-Person Families | 69 (31.9%) | $0 |
| 5-Person Families | 0 (0.0%) | $0 |
| 6-Person Families | 0 (0.0%) | $0 |
| 7+ Person Families | 0 (0.0%) | $0 |
| Total | 216 (100.0%) | $85,948 |
Family Income by Number of Earners in Our Town
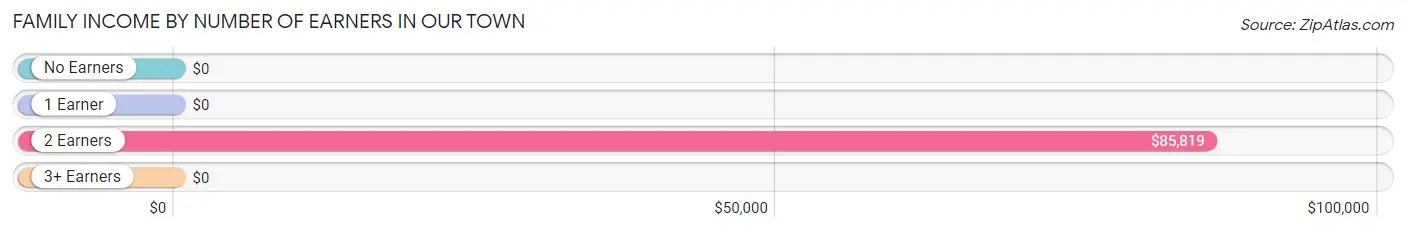
| Number of Earners | # Families | Median Income |
| No Earners | 16 (7.4%) | $0 |
| 1 Earner | 21 (9.7%) | $0 |
| 2 Earners | 139 (64.3%) | $85,819 |
| 3+ Earners | 40 (18.5%) | $0 |
| Total | 216 (100.0%) | $85,948 |
Household Income in Our Town
Household Income Brackets in Our Town
With 94 households falling in the category, the $100,000 to $149,999 income range is the most frequent in Our Town, accounting for 37.0% of all households.
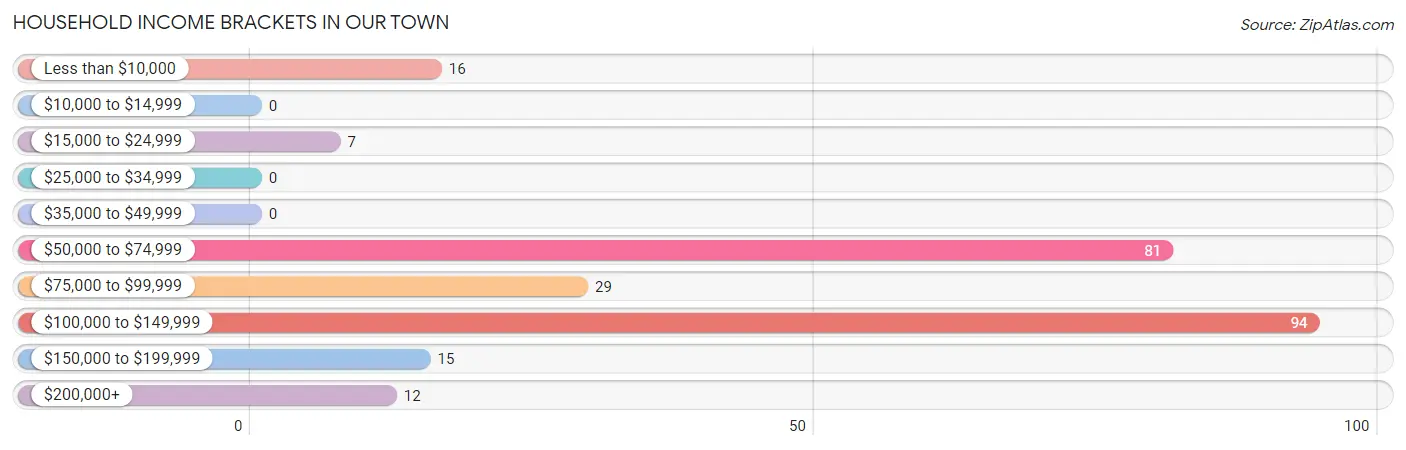
| Income Bracket | # Households | % Households |
| Less than $10,000 | 16 | 6.3% |
| $10,000 to $14,999 | 0 | 0.0% |
| $15,000 to $24,999 | 7 | 2.8% |
| $25,000 to $34,999 | 0 | 0.0% |
| $35,000 to $49,999 | 0 | 0.0% |
| $50,000 to $74,999 | 81 | 31.9% |
| $75,000 to $99,999 | 29 | 11.4% |
| $100,000 to $149,999 | 94 | 37.0% |
| $150,000 to $199,999 | 15 | 5.9% |
| $200,000+ | 12 | 4.7% |
Household Income by Householder Age in Our Town
The median household income in Our Town is $86,983, with the highest median household income of $110,071 found in the 45 to 64 years age bracket for the primary householder. A total of 178 households (70.1%) fall into this category.
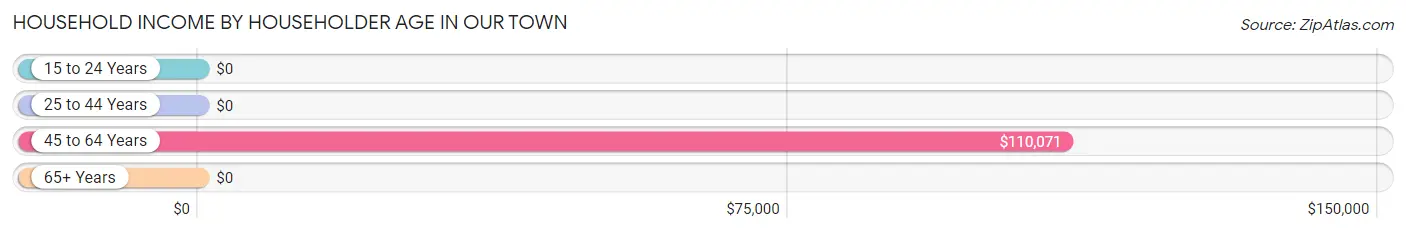
| Income Bracket | # Households | Median Income |
| 15 to 24 Years | 0 (0.0%) | $0 |
| 25 to 44 Years | 45 (17.7%) | $0 |
| 45 to 64 Years | 178 (70.1%) | $110,071 |
| 65+ Years | 31 (12.2%) | $0 |
| Total | 254 (100.0%) | $86,983 |
Poverty in Our Town
Income Below Poverty by Sex and Age in Our Town
With 8.1% poverty level for males and 9.1% for females among the residents of Our Town, 6 to 11 year old males and 6 to 11 year old females are the most vulnerable to poverty, with 27 males (39.1%) and 21 females (100.0%) in their respective age groups living below the poverty level.
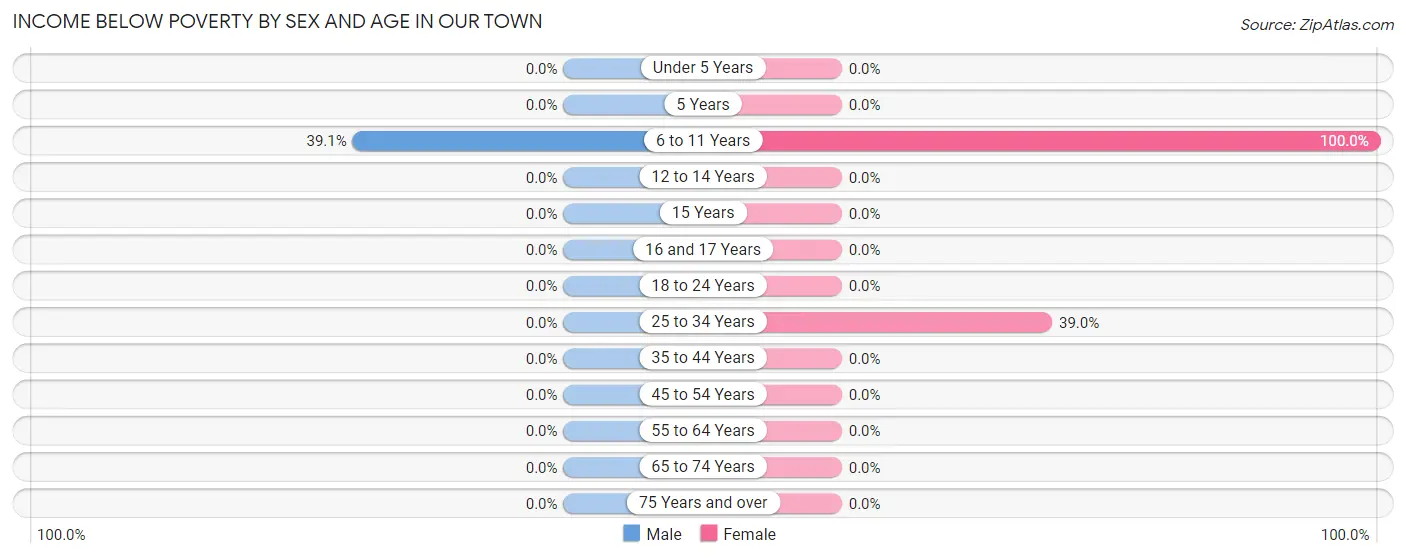
| Age Bracket | Male | Female |
| Under 5 Years | 0 (0.0%) | 0 (0.0%) |
| 5 Years | 0 (0.0%) | 0 (0.0%) |
| 6 to 11 Years | 27 (39.1%) | 21 (100.0%) |
| 12 to 14 Years | 0 (0.0%) | 0 (0.0%) |
| 15 Years | 0 (0.0%) | 0 (0.0%) |
| 16 and 17 Years | 0 (0.0%) | 0 (0.0%) |
| 18 to 24 Years | 0 (0.0%) | 0 (0.0%) |
| 25 to 34 Years | 0 (0.0%) | 16 (39.0%) |
| 35 to 44 Years | 0 (0.0%) | 0 (0.0%) |
| 45 to 54 Years | 0 (0.0%) | 0 (0.0%) |
| 55 to 64 Years | 0 (0.0%) | 0 (0.0%) |
| 65 to 74 Years | 0 (0.0%) | 0 (0.0%) |
| 75 Years and over | 0 (0.0%) | 0 (0.0%) |
| Total | 27 (8.1%) | 37 (9.1%) |
Income Above Poverty by Sex and Age in Our Town
According to the poverty statistics in Our Town, males aged 18 to 24 years and females aged under 5 years are the age groups that are most secure financially, with 100.0% of males and 100.0% of females in these age groups living above the poverty line.
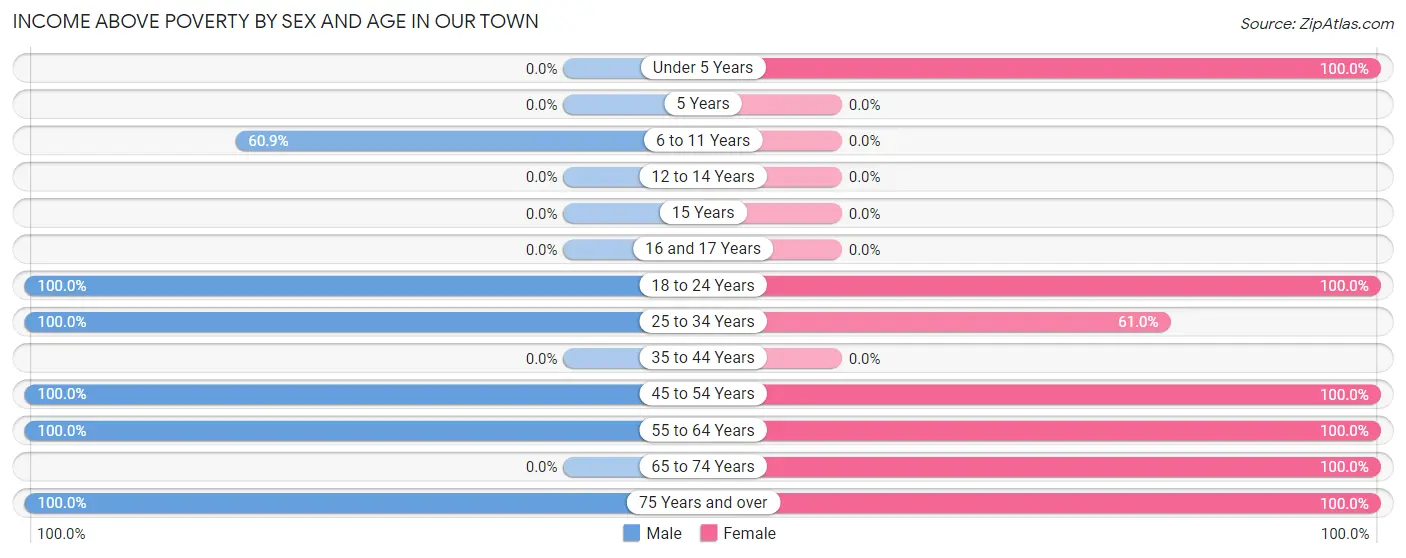
| Age Bracket | Male | Female |
| Under 5 Years | 0 (0.0%) | 26 (100.0%) |
| 5 Years | 0 (0.0%) | 0 (0.0%) |
| 6 to 11 Years | 42 (60.9%) | 0 (0.0%) |
| 12 to 14 Years | 0 (0.0%) | 0 (0.0%) |
| 15 Years | 0 (0.0%) | 0 (0.0%) |
| 16 and 17 Years | 0 (0.0%) | 0 (0.0%) |
| 18 to 24 Years | 44 (100.0%) | 42 (100.0%) |
| 25 to 34 Years | 67 (100.0%) | 25 (61.0%) |
| 35 to 44 Years | 0 (0.0%) | 0 (0.0%) |
| 45 to 54 Years | 58 (100.0%) | 195 (100.0%) |
| 55 to 64 Years | 75 (100.0%) | 15 (100.0%) |
| 65 to 74 Years | 0 (0.0%) | 12 (100.0%) |
| 75 Years and over | 20 (100.0%) | 53 (100.0%) |
| Total | 306 (91.9%) | 368 (90.9%) |
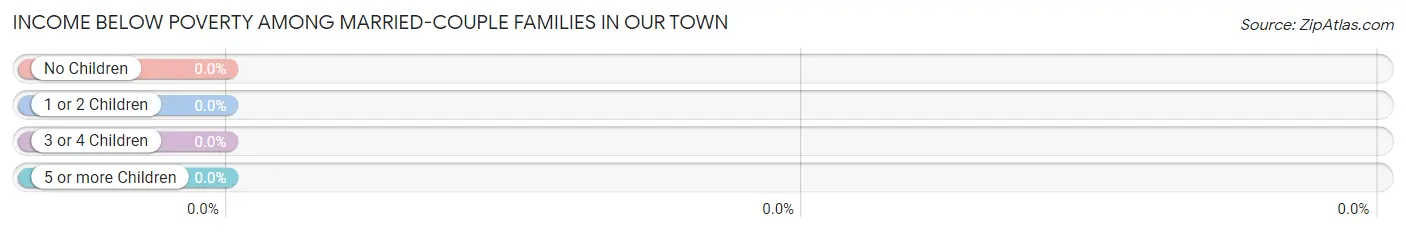
Income Below Poverty Among Married-Couple Families in Our Town
| Children | Above Poverty | Below Poverty |
| No Children | 150 (100.0%) | 0 (0.0%) |
| 1 or 2 Children | 29 (100.0%) | 0 (0.0%) |
| 3 or 4 Children | 0 (0.0%) | 0 (0.0%) |
| 5 or more Children | 0 (0.0%) | 0 (0.0%) |
| Total | 179 (100.0%) | 0 (0.0%) |
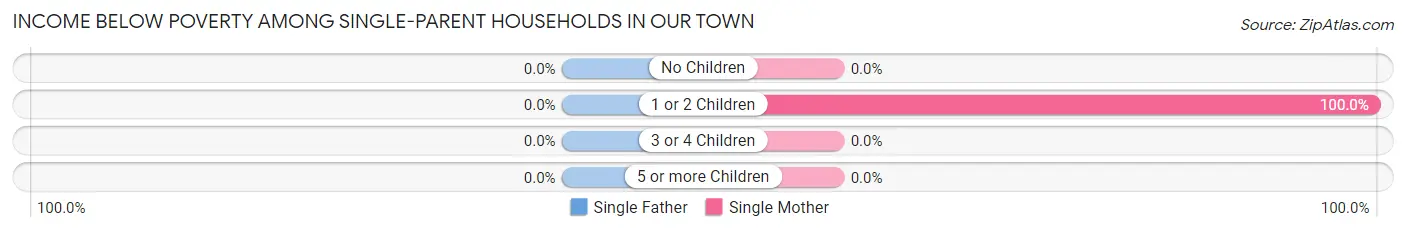
Income Below Poverty Among Single-Parent Households in Our Town
| Children | Single Father | Single Mother |
| No Children | 0 (0.0%) | 0 (0.0%) |
| 1 or 2 Children | 0 (0.0%) | 16 (100.0%) |
| 3 or 4 Children | 0 (0.0%) | 0 (0.0%) |
| 5 or more Children | 0 (0.0%) | 0 (0.0%) |
| Total | 0 (0.0%) | 16 (43.2%) |
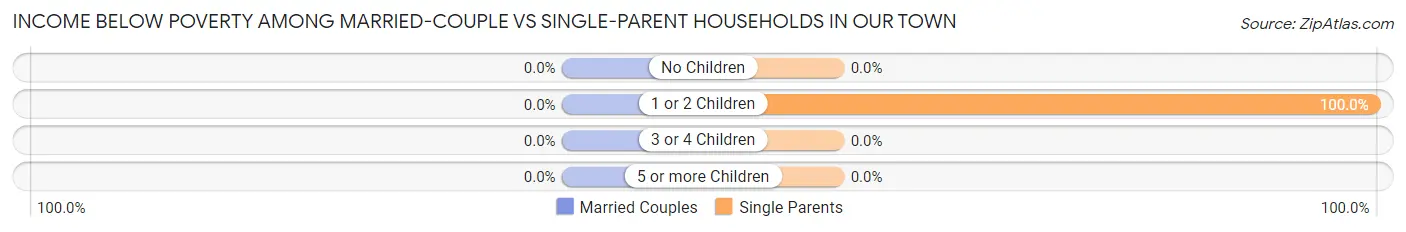
Income Below Poverty Among Married-Couple vs Single-Parent Households in Our Town
| Children | Married-Couple Families | Single-Parent Households |
| No Children | 0 (0.0%) | 0 (0.0%) |
| 1 or 2 Children | 0 (0.0%) | 16 (100.0%) |
| 3 or 4 Children | 0 (0.0%) | 0 (0.0%) |
| 5 or more Children | 0 (0.0%) | 0 (0.0%) |
| Total | 0 (0.0%) | 16 (43.2%) |
Employment Characteristics in Our Town
Employment by Class of Employer in Our Town
Among the 471 employed individuals in Our Town, private company employees (372 | 79.0%), not-for-profit organizations (49 | 10.4%), and local government employees (27 | 5.7%) make up the most common classes of employment.
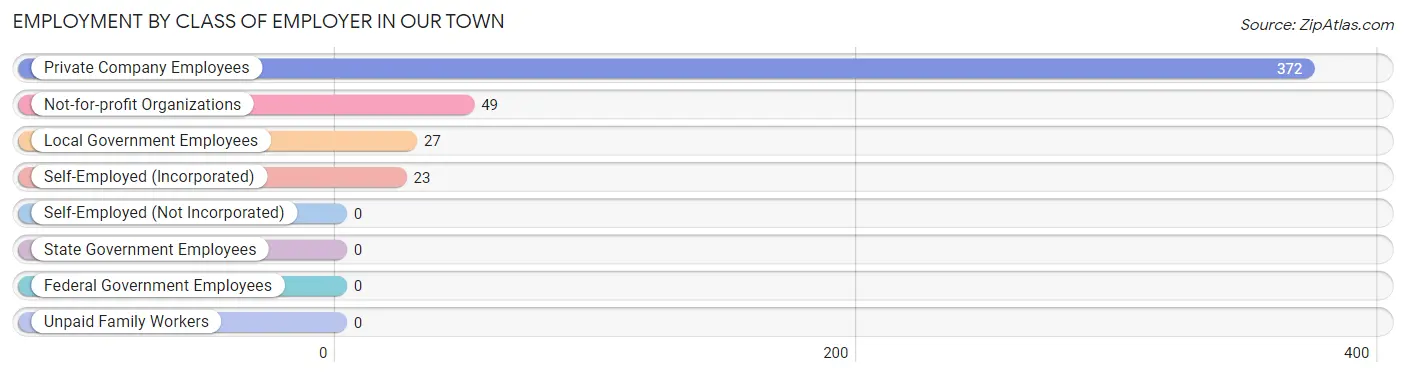
| Employer Class | # Employees | % Employees |
| Private Company Employees | 372 | 79.0% |
| Self-Employed (Incorporated) | 23 | 4.9% |
| Self-Employed (Not Incorporated) | 0 | 0.0% |
| Not-for-profit Organizations | 49 | 10.4% |
| Local Government Employees | 27 | 5.7% |
| State Government Employees | 0 | 0.0% |
| Federal Government Employees | 0 | 0.0% |
| Unpaid Family Workers | 0 | 0.0% |
| Total | 471 | 100.0% |
Employment Status by Age in Our Town
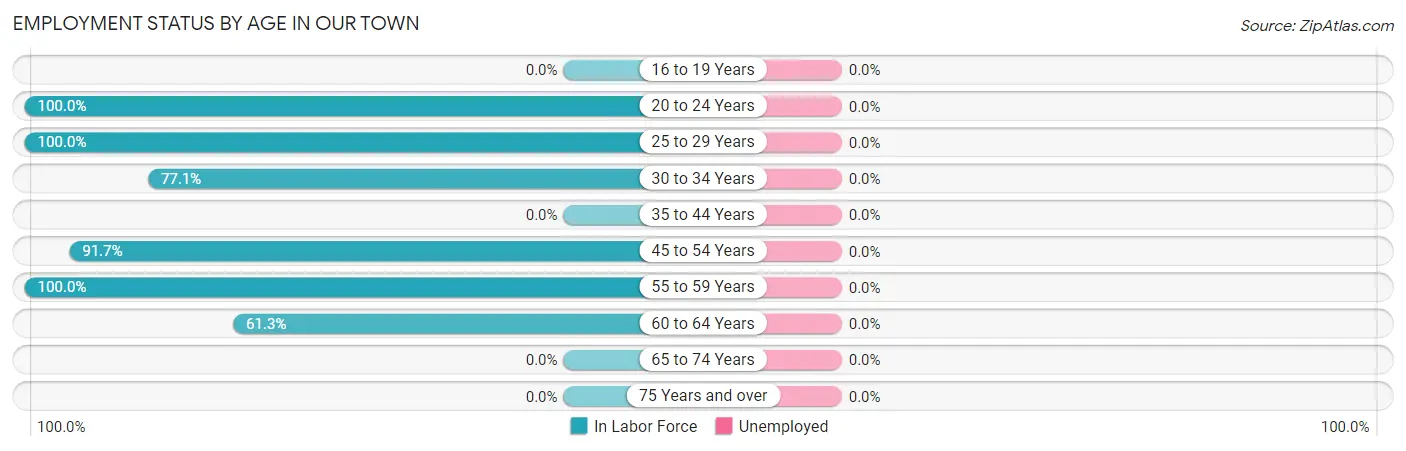
| Age Bracket | In Labor Force | Unemployed |
| 16 to 19 Years | 0 (0.0%) | 0 (0.0%) |
| 20 to 24 Years | 86 (100.0%) | 0 (0.0%) |
| 25 to 29 Years | 38 (100.0%) | 0 (0.0%) |
| 30 to 34 Years | 54 (77.1%) | 0 (0.0%) |
| 35 to 44 Years | 0 (0.0%) | 0 (0.0%) |
| 45 to 54 Years | 232 (91.7%) | 0 (0.0%) |
| 55 to 59 Years | 15 (100.0%) | 0 (0.0%) |
| 60 to 64 Years | 46 (61.3%) | 0 (0.0%) |
| 65 to 74 Years | 0 (0.0%) | 0 (0.0%) |
| 75 Years and over | 0 (0.0%) | 0 (0.0%) |
| Total | 471 (75.7%) | 0 (0.0%) |
Employment Status by Educational Attainment in Our Town
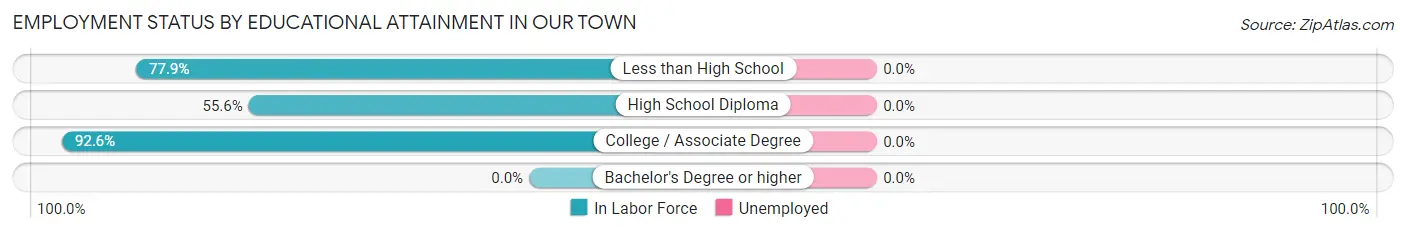
| Educational Attainment | In Labor Force | Unemployed |
| Less than High School | 102 (77.9%) | 0 (0.0%) |
| High School Diploma | 20 (55.6%) | 0 (0.0%) |
| College / Associate Degree | 263 (92.6%) | 0 (0.0%) |
| Bachelor's Degree or higher | 0 (0.0%) | 0 (0.0%) |
| Total | 385 (85.4%) | 0 (0.0%) |
Employment Occupations by Sex in Our Town
Management, Business, Science and Arts Occupations
The most common Management, Business, Science and Arts occupations in Our Town are Business & Financial (27 | 5.7%), Management (23 | 4.9%), Health Diagnosing & Treating (15 | 3.2%), and Health Technologists (15 | 3.2%).
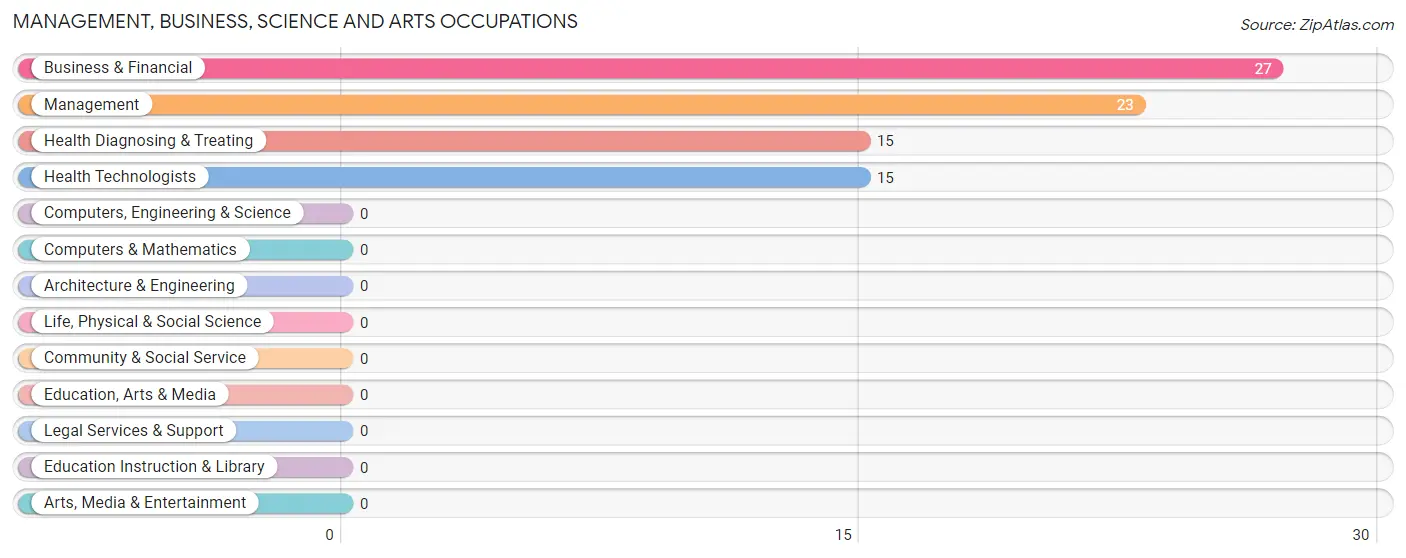
Management, Business, Science and Arts Occupations by Sex
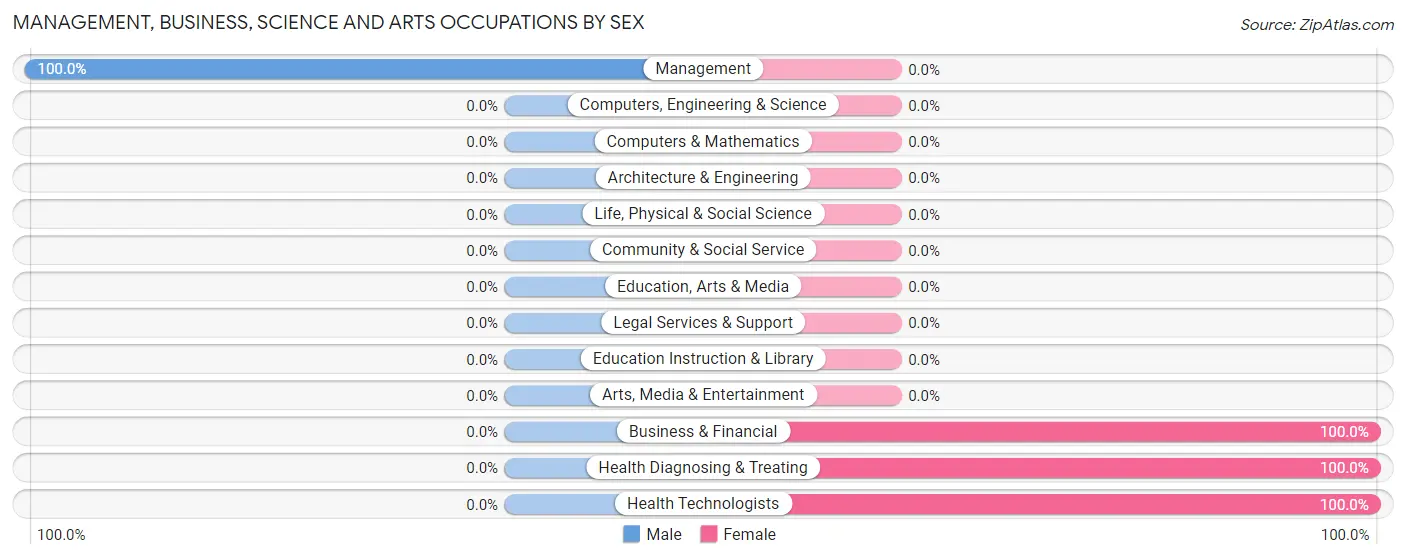
| Occupation | Male | Female |
| Management | 23 (100.0%) | 0 (0.0%) |
| Business & Financial | 0 (0.0%) | 27 (100.0%) |
| Computers, Engineering & Science | 0 (0.0%) | 0 (0.0%) |
| Computers & Mathematics | 0 (0.0%) | 0 (0.0%) |
| Architecture & Engineering | 0 (0.0%) | 0 (0.0%) |
| Life, Physical & Social Science | 0 (0.0%) | 0 (0.0%) |
| Community & Social Service | 0 (0.0%) | 0 (0.0%) |
| Education, Arts & Media | 0 (0.0%) | 0 (0.0%) |
| Legal Services & Support | 0 (0.0%) | 0 (0.0%) |
| Education Instruction & Library | 0 (0.0%) | 0 (0.0%) |
| Arts, Media & Entertainment | 0 (0.0%) | 0 (0.0%) |
| Health Diagnosing & Treating | 0 (0.0%) | 15 (100.0%) |
| Health Technologists | 0 (0.0%) | 15 (100.0%) |
| Total (Category) | 23 (35.4%) | 42 (64.6%) |
| Total (Overall) | 215 (45.7%) | 256 (54.3%) |
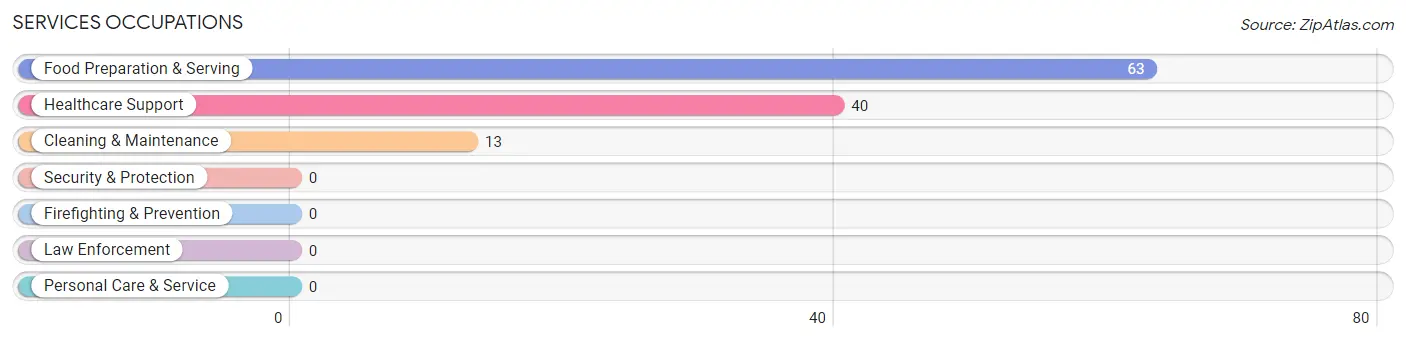
Services Occupations
The most common Services occupations in Our Town are Food Preparation & Serving (63 | 13.4%), Healthcare Support (40 | 8.5%), and Cleaning & Maintenance (13 | 2.8%).
Services Occupations by Sex
Within the Services occupations in Our Town, the most male-oriented occupations are Cleaning & Maintenance (100.0%), and Food Preparation & Serving (60.3%), while the most female-oriented occupations are Healthcare Support (100.0%), and Food Preparation & Serving (39.7%).
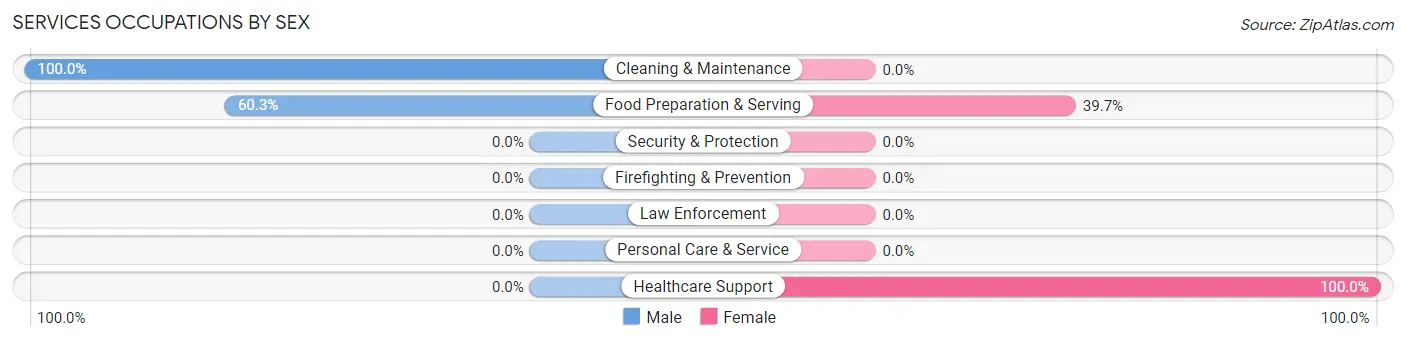
| Occupation | Male | Female |
| Healthcare Support | 0 (0.0%) | 40 (100.0%) |
| Security & Protection | 0 (0.0%) | 0 (0.0%) |
| Firefighting & Prevention | 0 (0.0%) | 0 (0.0%) |
| Law Enforcement | 0 (0.0%) | 0 (0.0%) |
| Food Preparation & Serving | 38 (60.3%) | 25 (39.7%) |
| Cleaning & Maintenance | 13 (100.0%) | 0 (0.0%) |
| Personal Care & Service | 0 (0.0%) | 0 (0.0%) |
| Total (Category) | 51 (44.0%) | 65 (56.0%) |
| Total (Overall) | 215 (45.7%) | 256 (54.3%) |
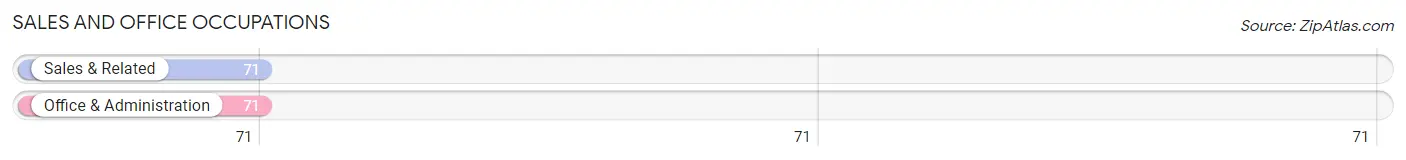
Sales and Office Occupations
The most common Sales and Office occupations in Our Town are Sales & Related (71 | 15.1%), and Office & Administration (71 | 15.1%).
Sales and Office Occupations by Sex
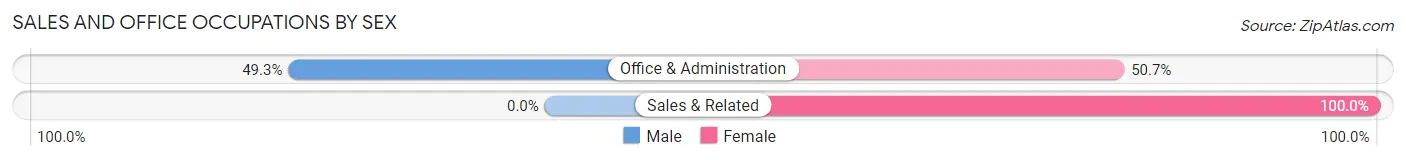
| Occupation | Male | Female |
| Sales & Related | 0 (0.0%) | 71 (100.0%) |
| Office & Administration | 35 (49.3%) | 36 (50.7%) |
| Total (Category) | 35 (24.6%) | 107 (75.3%) |
| Total (Overall) | 215 (45.7%) | 256 (54.3%) |
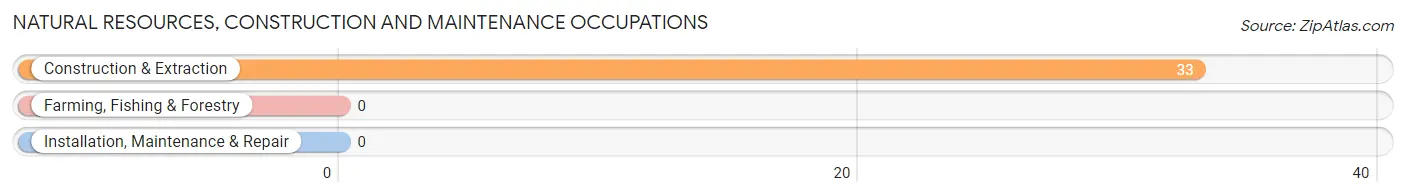
Natural Resources, Construction and Maintenance Occupations
The most common Natural Resources, Construction and Maintenance occupations in Our Town are , and Construction & Extraction (33 | 7.0%).
Natural Resources, Construction and Maintenance Occupations by Sex
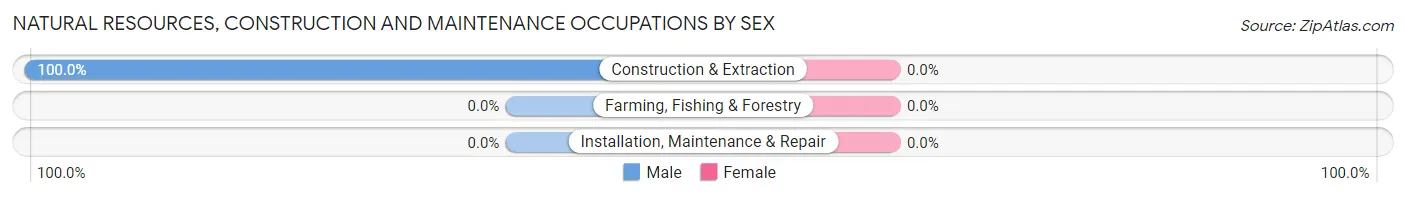
| Occupation | Male | Female |
| Farming, Fishing & Forestry | 0 (0.0%) | 0 (0.0%) |
| Construction & Extraction | 33 (100.0%) | 0 (0.0%) |
| Installation, Maintenance & Repair | 0 (0.0%) | 0 (0.0%) |
| Total (Category) | 33 (100.0%) | 0 (0.0%) |
| Total (Overall) | 215 (45.7%) | 256 (54.3%) |
Production, Transportation and Moving Occupations
The most common Production, Transportation and Moving occupations in Our Town are , and Production (115 | 24.4%).
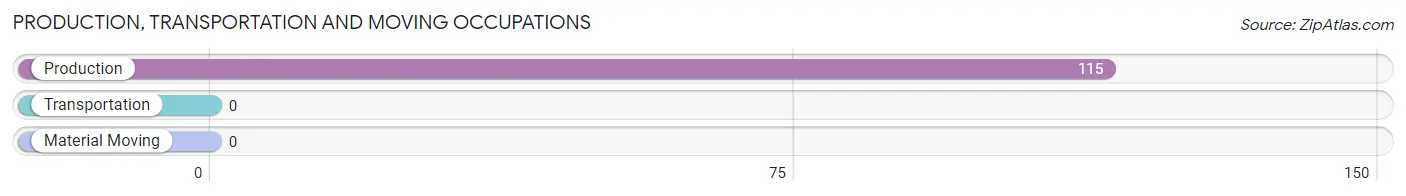
Production, Transportation and Moving Occupations by Sex
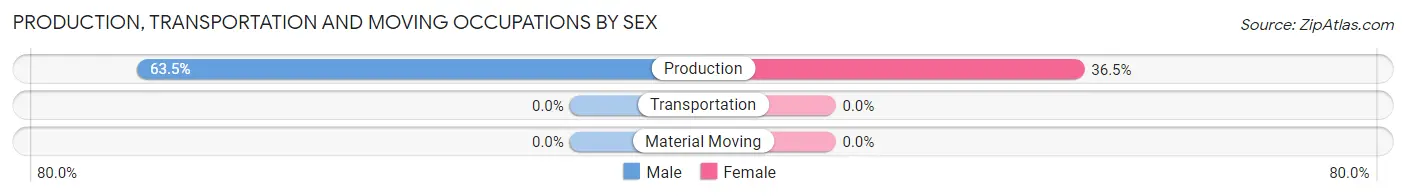
| Occupation | Male | Female |
| Production | 73 (63.5%) | 42 (36.5%) |
| Transportation | 0 (0.0%) | 0 (0.0%) |
| Material Moving | 0 (0.0%) | 0 (0.0%) |
| Total (Category) | 73 (63.5%) | 42 (36.5%) |
| Total (Overall) | 215 (45.7%) | 256 (54.3%) |
Employment Industries by Sex in Our Town
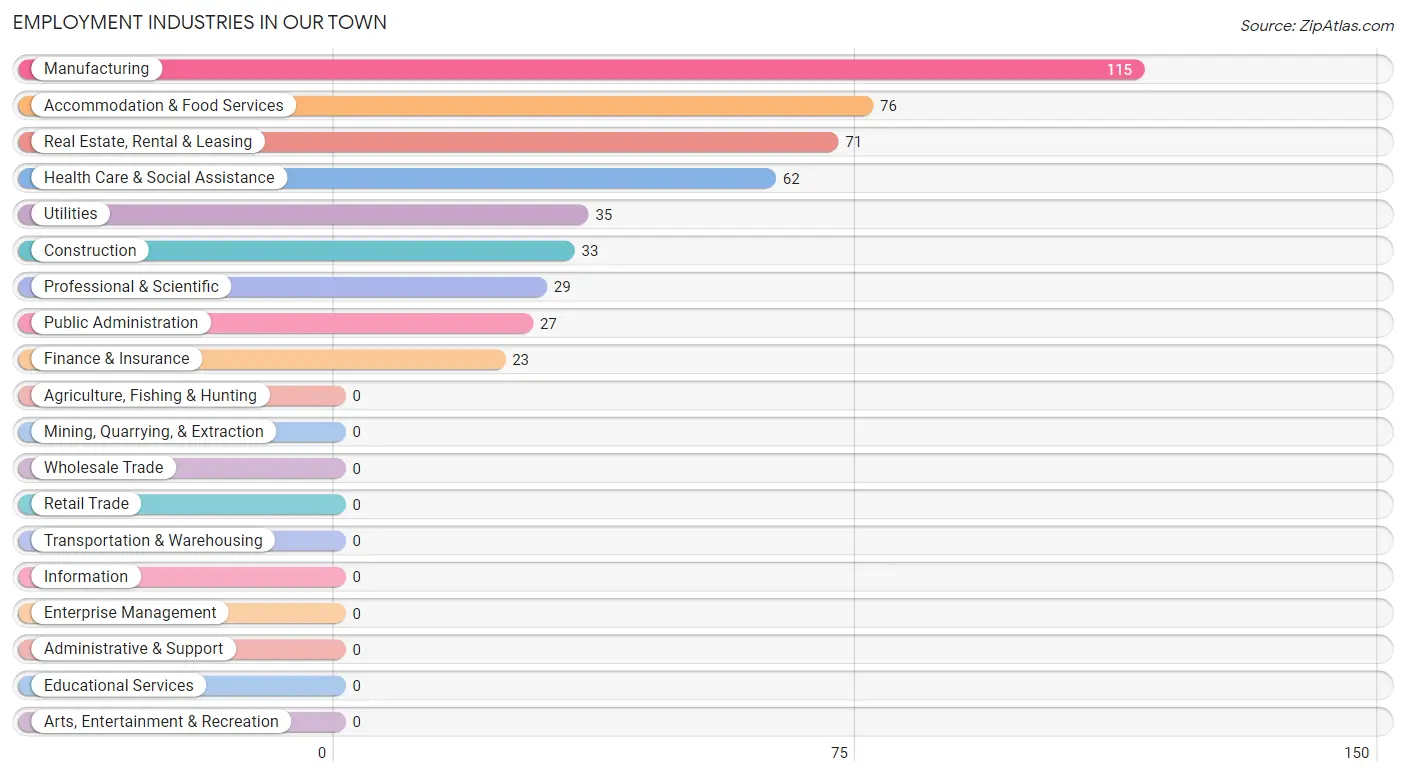
Employment Industries in Our Town
The major employment industries in Our Town include Manufacturing (115 | 24.4%), Accommodation & Food Services (76 | 16.1%), Real Estate, Rental & Leasing (71 | 15.1%), Health Care & Social Assistance (62 | 13.2%), and Utilities (35 | 7.4%).
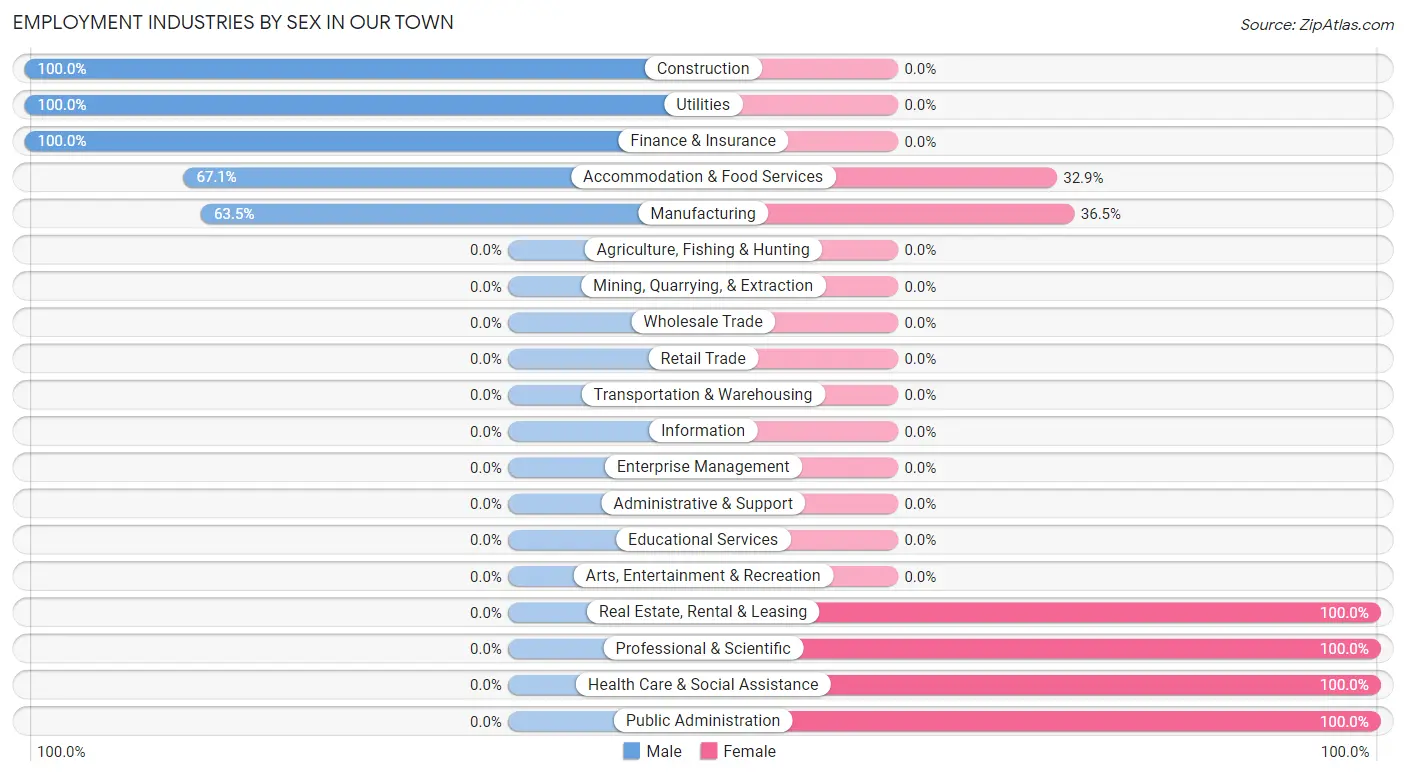
Employment Industries by Sex in Our Town
The Our Town industries that see more men than women are Construction (100.0%), Utilities (100.0%), and Finance & Insurance (100.0%), whereas the industries that tend to have a higher number of women are Real Estate, Rental & Leasing (100.0%), Professional & Scientific (100.0%), and Health Care & Social Assistance (100.0%).
| Industry | Male | Female |
| Agriculture, Fishing & Hunting | 0 (0.0%) | 0 (0.0%) |
| Mining, Quarrying, & Extraction | 0 (0.0%) | 0 (0.0%) |
| Construction | 33 (100.0%) | 0 (0.0%) |
| Manufacturing | 73 (63.5%) | 42 (36.5%) |
| Wholesale Trade | 0 (0.0%) | 0 (0.0%) |
| Retail Trade | 0 (0.0%) | 0 (0.0%) |
| Transportation & Warehousing | 0 (0.0%) | 0 (0.0%) |
| Utilities | 35 (100.0%) | 0 (0.0%) |
| Information | 0 (0.0%) | 0 (0.0%) |
| Finance & Insurance | 23 (100.0%) | 0 (0.0%) |
| Real Estate, Rental & Leasing | 0 (0.0%) | 71 (100.0%) |
| Professional & Scientific | 0 (0.0%) | 29 (100.0%) |
| Enterprise Management | 0 (0.0%) | 0 (0.0%) |
| Administrative & Support | 0 (0.0%) | 0 (0.0%) |
| Educational Services | 0 (0.0%) | 0 (0.0%) |
| Health Care & Social Assistance | 0 (0.0%) | 62 (100.0%) |
| Arts, Entertainment & Recreation | 0 (0.0%) | 0 (0.0%) |
| Accommodation & Food Services | 51 (67.1%) | 25 (32.9%) |
| Public Administration | 0 (0.0%) | 27 (100.0%) |
| Total | 215 (45.7%) | 256 (54.3%) |
Education in Our Town
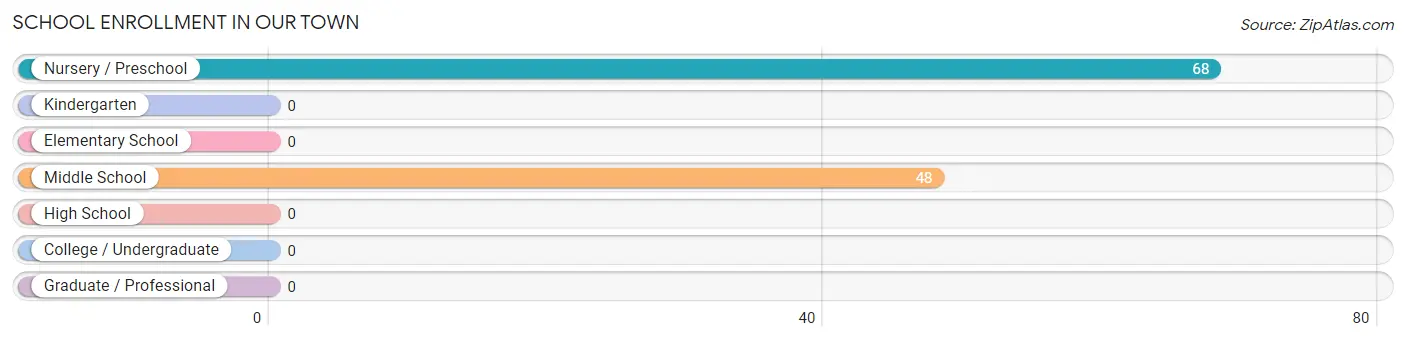
School Enrollment in Our Town
The most common levels of schooling among the 116 students in Our Town are nursery / preschool (68 | 58.6%), and middle school (48 | 41.4%).
| School Level | # Students | % Students |
| Nursery / Preschool | 68 | 58.6% |
| Kindergarten | 0 | 0.0% |
| Elementary School | 0 | 0.0% |
| Middle School | 48 | 41.4% |
| High School | 0 | 0.0% |
| College / Undergraduate | 0 | 0.0% |
| Graduate / Professional | 0 | 0.0% |
| Total | 116 | 100.0% |
School Enrollment by Age by Funding Source in Our Town
Out of a total of 116 students who are enrolled in schools in Our Town, 26 (22.4%) attend a private institution, while the remaining 90 (77.6%) are enrolled in public schools. The age group of 3 to 4 year olds has the highest likelihood of being enrolled in private schools, with 26 (100.0% in the age bracket) enrolled. Conversely, the age group of 5 to 9 year old has the lowest likelihood of being enrolled in a private school, with 42 (100.0% in the age bracket) attending a public institution.
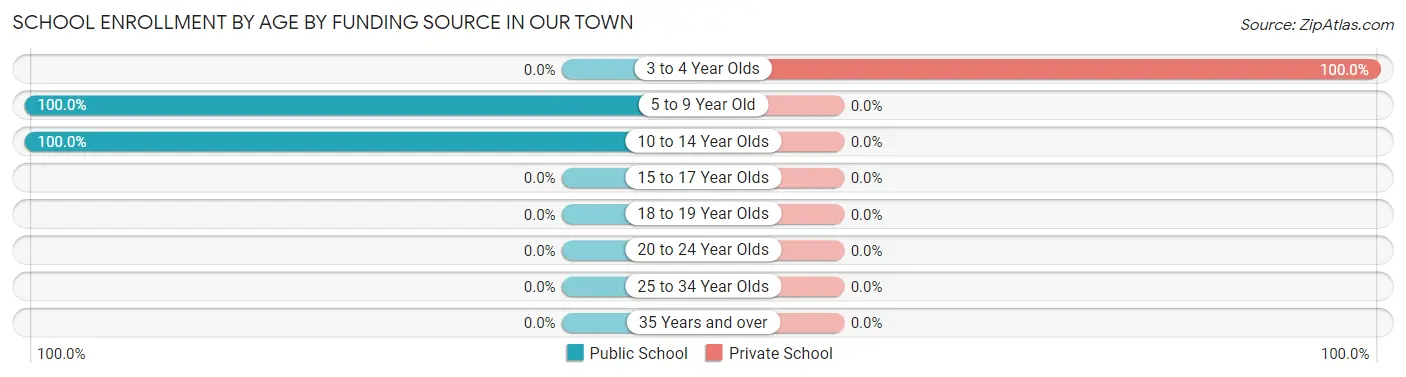
| Age Bracket | Public School | Private School |
| 3 to 4 Year Olds | 0 (0.0%) | 26 (100.0%) |
| 5 to 9 Year Old | 42 (100.0%) | 0 (0.0%) |
| 10 to 14 Year Olds | 48 (100.0%) | 0 (0.0%) |
| 15 to 17 Year Olds | 0 (0.0%) | 0 (0.0%) |
| 18 to 19 Year Olds | 0 (0.0%) | 0 (0.0%) |
| 20 to 24 Year Olds | 0 (0.0%) | 0 (0.0%) |
| 25 to 34 Year Olds | 0 (0.0%) | 0 (0.0%) |
| 35 Years and over | 0 (0.0%) | 0 (0.0%) |
| Total | 90 (77.6%) | 26 (22.4%) |
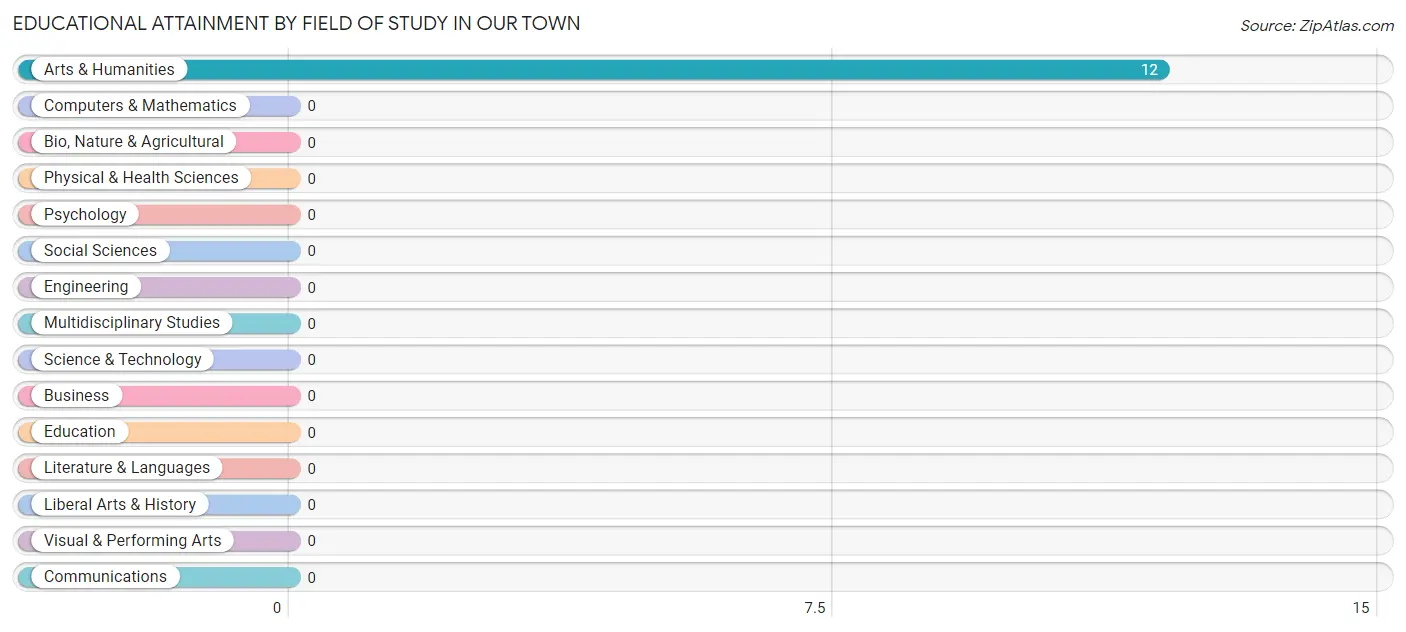
Educational Attainment by Field of Study in Our Town
, and arts & humanities (12 | 100.0%) are the most common fields of study among 12 individuals in Our Town who have obtained a bachelor's degree or higher.
| Field of Study | # Graduates | % Graduates |
| Computers & Mathematics | 0 | 0.0% |
| Bio, Nature & Agricultural | 0 | 0.0% |
| Physical & Health Sciences | 0 | 0.0% |
| Psychology | 0 | 0.0% |
| Social Sciences | 0 | 0.0% |
| Engineering | 0 | 0.0% |
| Multidisciplinary Studies | 0 | 0.0% |
| Science & Technology | 0 | 0.0% |
| Business | 0 | 0.0% |
| Education | 0 | 0.0% |
| Literature & Languages | 0 | 0.0% |
| Liberal Arts & History | 0 | 0.0% |
| Visual & Performing Arts | 0 | 0.0% |
| Communications | 0 | 0.0% |
| Arts & Humanities | 12 | 100.0% |
| Total | 12 | 100.0% |
Transportation & Commute in Our Town
Vehicle Availability by Sex in Our Town
The most prevalent vehicle ownership categories in Our Town are males with 3 vehicles (142, accounting for 66.0%) and females with 3 vehicles (220, making up 55.5%).
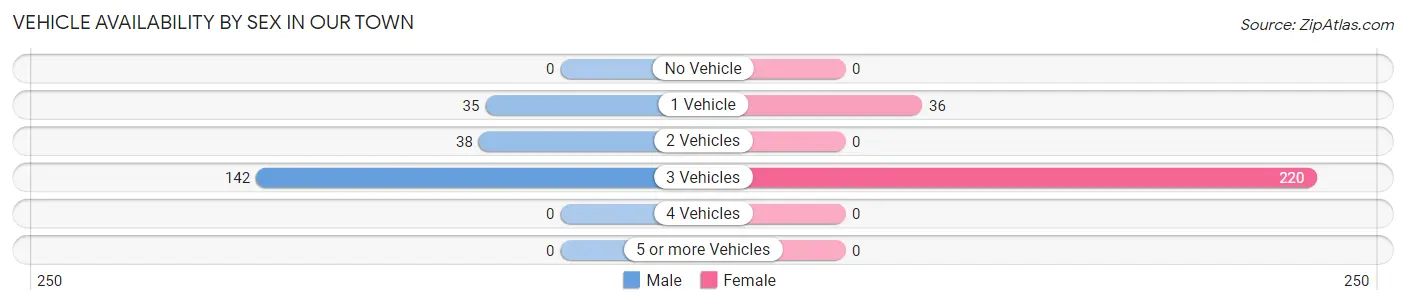
| Vehicles Available | Male | Female |
| No Vehicle | 0 (0.0%) | 0 (0.0%) |
| 1 Vehicle | 35 (16.3%) | 36 (14.1%) |
| 2 Vehicles | 38 (17.7%) | 0 (0.0%) |
| 3 Vehicles | 142 (66.0%) | 220 (85.9%) |
| 4 Vehicles | 0 (0.0%) | 0 (0.0%) |
| 5 or more Vehicles | 0 (0.0%) | 0 (0.0%) |
| Total | 215 (100.0%) | 256 (100.0%) |
Commute Time in Our Town
The most frequently occuring commute durations in Our Town are 10 to 14 minutes (110 commuters, 23.4%), 20 to 24 minutes (109 commuters, 23.1%), and 60 to 89 minutes (71 commuters, 15.1%).
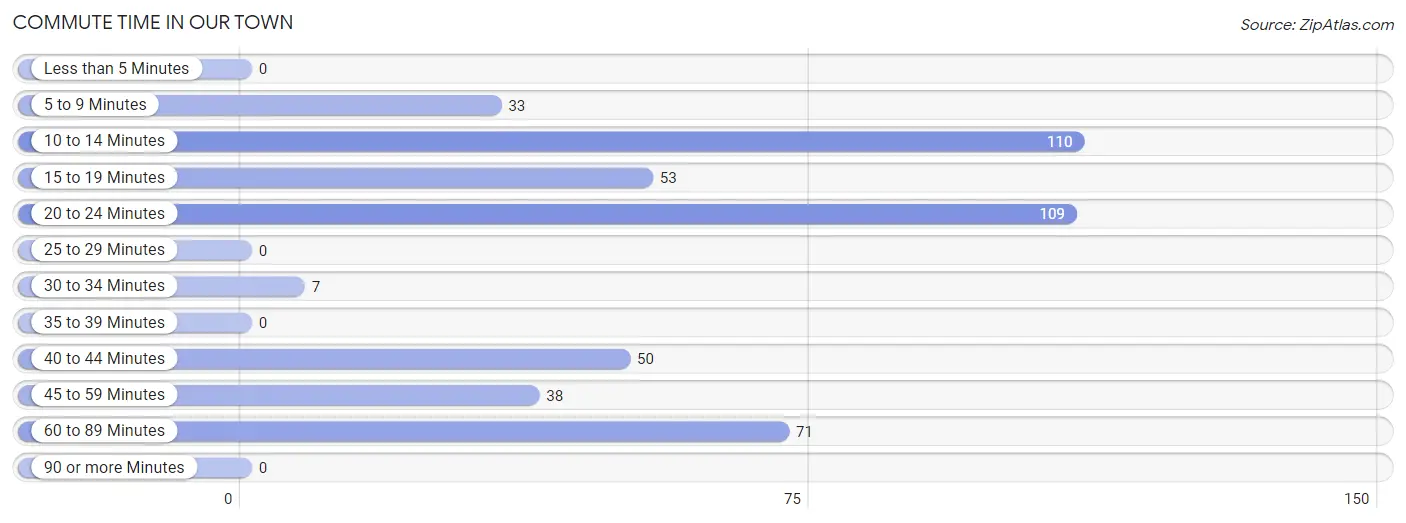
| Commute Time | # Commuters | % Commuters |
| Less than 5 Minutes | 0 | 0.0% |
| 5 to 9 Minutes | 33 | 7.0% |
| 10 to 14 Minutes | 110 | 23.4% |
| 15 to 19 Minutes | 53 | 11.3% |
| 20 to 24 Minutes | 109 | 23.1% |
| 25 to 29 Minutes | 0 | 0.0% |
| 30 to 34 Minutes | 7 | 1.5% |
| 35 to 39 Minutes | 0 | 0.0% |
| 40 to 44 Minutes | 50 | 10.6% |
| 45 to 59 Minutes | 38 | 8.1% |
| 60 to 89 Minutes | 71 | 15.1% |
| 90 or more Minutes | 0 | 0.0% |
Commute Time by Sex in Our Town
The most common commute times in Our Town are 20 to 24 minutes (67 commuters, 31.2%) for males and 10 to 14 minutes (81 commuters, 31.6%) for females.
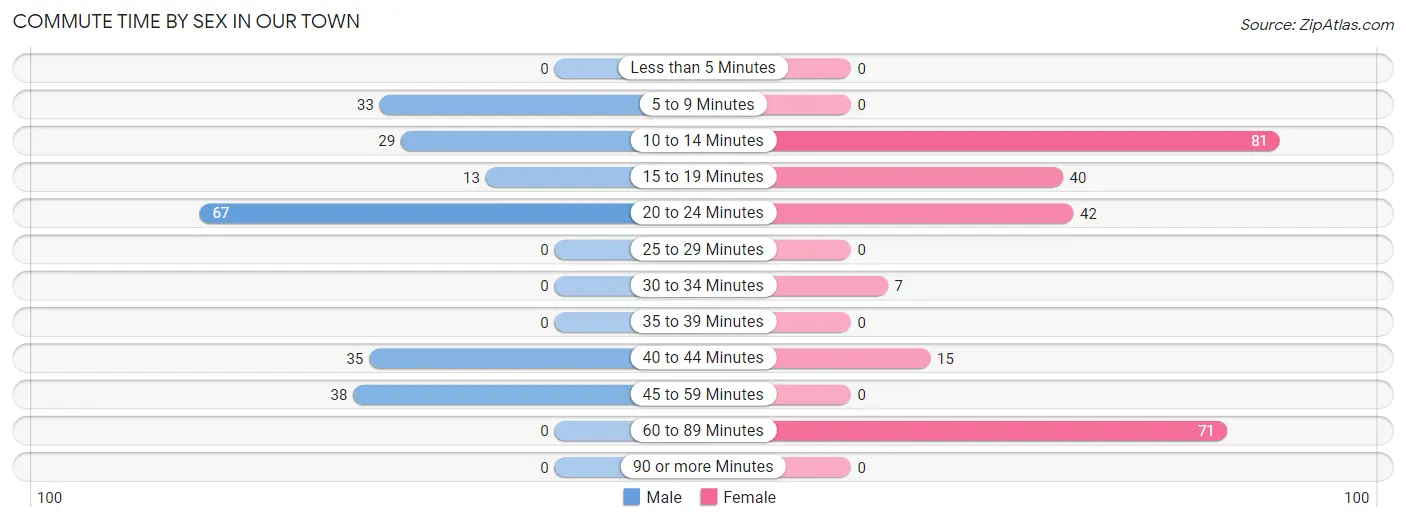
| Commute Time | Male | Female |
| Less than 5 Minutes | 0 (0.0%) | 0 (0.0%) |
| 5 to 9 Minutes | 33 (15.3%) | 0 (0.0%) |
| 10 to 14 Minutes | 29 (13.5%) | 81 (31.6%) |
| 15 to 19 Minutes | 13 (6.0%) | 40 (15.6%) |
| 20 to 24 Minutes | 67 (31.2%) | 42 (16.4%) |
| 25 to 29 Minutes | 0 (0.0%) | 0 (0.0%) |
| 30 to 34 Minutes | 0 (0.0%) | 7 (2.7%) |
| 35 to 39 Minutes | 0 (0.0%) | 0 (0.0%) |
| 40 to 44 Minutes | 35 (16.3%) | 15 (5.9%) |
| 45 to 59 Minutes | 38 (17.7%) | 0 (0.0%) |
| 60 to 89 Minutes | 0 (0.0%) | 71 (27.7%) |
| 90 or more Minutes | 0 (0.0%) | 0 (0.0%) |
Time of Departure to Work by Sex in Our Town
The most frequent times of departure to work in Our Town are 4:00 PM to 11:59 PM (44, 20.5%) for males and 12:00 AM to 4:59 AM (71, 27.7%) for females.
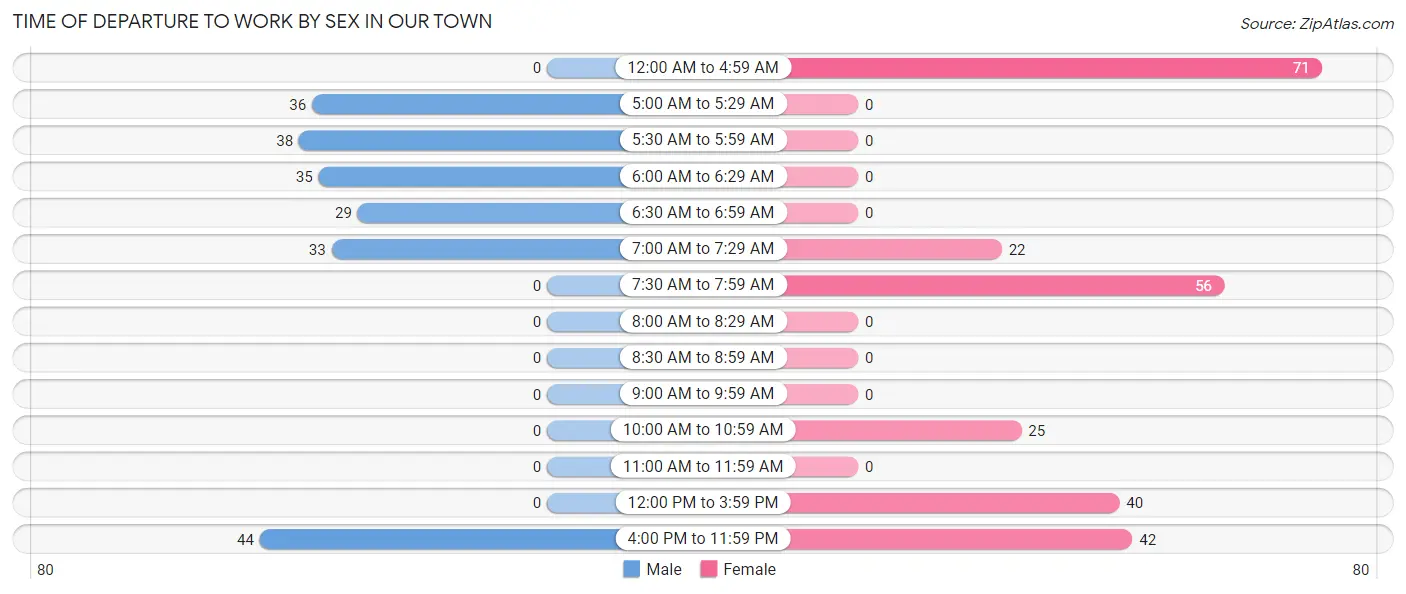
| Time of Departure | Male | Female |
| 12:00 AM to 4:59 AM | 0 (0.0%) | 71 (27.7%) |
| 5:00 AM to 5:29 AM | 36 (16.7%) | 0 (0.0%) |
| 5:30 AM to 5:59 AM | 38 (17.7%) | 0 (0.0%) |
| 6:00 AM to 6:29 AM | 35 (16.3%) | 0 (0.0%) |
| 6:30 AM to 6:59 AM | 29 (13.5%) | 0 (0.0%) |
| 7:00 AM to 7:29 AM | 33 (15.3%) | 22 (8.6%) |
| 7:30 AM to 7:59 AM | 0 (0.0%) | 56 (21.9%) |
| 8:00 AM to 8:29 AM | 0 (0.0%) | 0 (0.0%) |
| 8:30 AM to 8:59 AM | 0 (0.0%) | 0 (0.0%) |
| 9:00 AM to 9:59 AM | 0 (0.0%) | 0 (0.0%) |
| 10:00 AM to 10:59 AM | 0 (0.0%) | 25 (9.8%) |
| 11:00 AM to 11:59 AM | 0 (0.0%) | 0 (0.0%) |
| 12:00 PM to 3:59 PM | 0 (0.0%) | 40 (15.6%) |
| 4:00 PM to 11:59 PM | 44 (20.5%) | 42 (16.4%) |
| Total | 215 (100.0%) | 256 (100.0%) |
Housing Occupancy in Our Town
Occupancy by Ownership in Our Town
Of the total 254 dwellings in Our Town, owner-occupied units account for 192 (75.6%), while renter-occupied units make up 62 (24.4%).
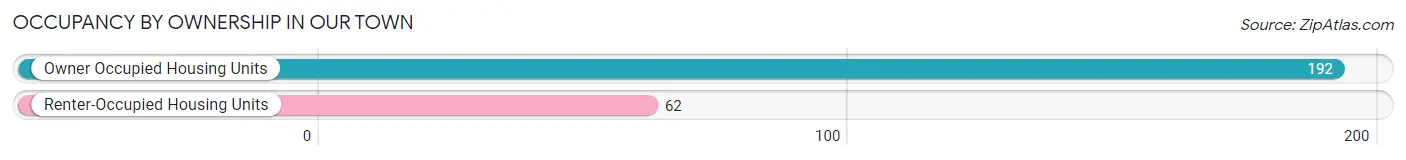
| Occupancy | # Housing Units | % Housing Units |
| Owner Occupied Housing Units | 192 | 75.6% |
| Renter-Occupied Housing Units | 62 | 24.4% |
| Total Occupied Housing Units | 254 | 100.0% |
Occupancy by Household Size in Our Town
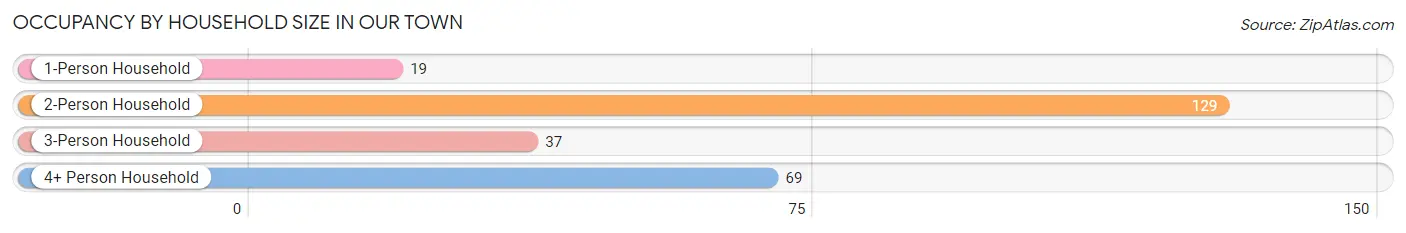
| Household Size | # Housing Units | % Housing Units |
| 1-Person Household | 19 | 7.5% |
| 2-Person Household | 129 | 50.8% |
| 3-Person Household | 37 | 14.6% |
| 4+ Person Household | 69 | 27.2% |
| Total Housing Units | 254 | 100.0% |
Occupancy by Ownership by Household Size in Our Town
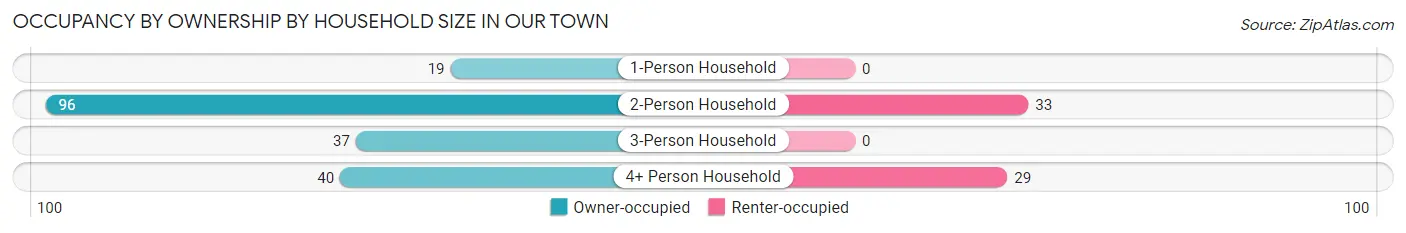
| Household Size | Owner-occupied | Renter-occupied |
| 1-Person Household | 19 (100.0%) | 0 (0.0%) |
| 2-Person Household | 96 (74.4%) | 33 (25.6%) |
| 3-Person Household | 37 (100.0%) | 0 (0.0%) |
| 4+ Person Household | 40 (58.0%) | 29 (42.0%) |
| Total Housing Units | 192 (75.6%) | 62 (24.4%) |
Occupancy by Educational Attainment in Our Town
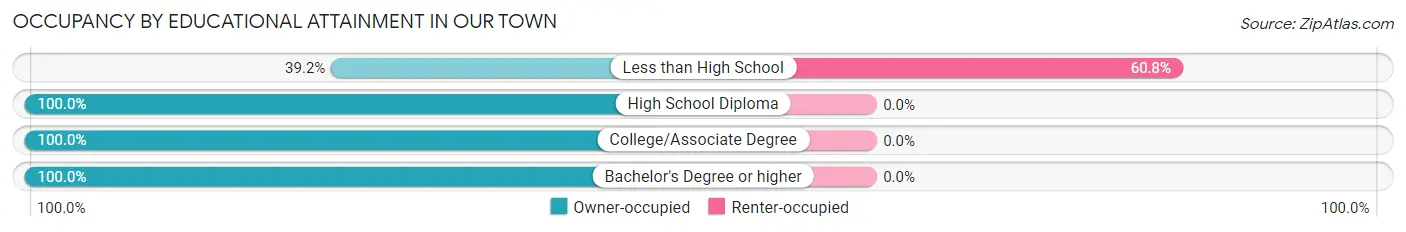
| Household Size | Owner-occupied | Renter-occupied |
| Less than High School | 40 (39.2%) | 62 (60.8%) |
| High School Diploma | 23 (100.0%) | 0 (0.0%) |
| College/Associate Degree | 117 (100.0%) | 0 (0.0%) |
| Bachelor's Degree or higher | 12 (100.0%) | 0 (0.0%) |
Occupancy by Age of Householder in Our Town
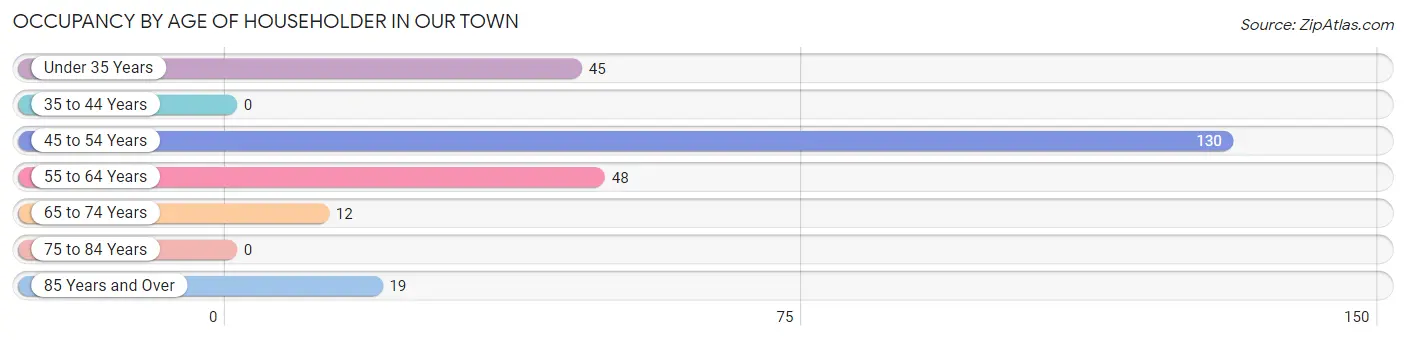
| Age Bracket | # Households | % Households |
| Under 35 Years | 45 | 17.7% |
| 35 to 44 Years | 0 | 0.0% |
| 45 to 54 Years | 130 | 51.2% |
| 55 to 64 Years | 48 | 18.9% |
| 65 to 74 Years | 12 | 4.7% |
| 75 to 84 Years | 0 | 0.0% |
| 85 Years and Over | 19 | 7.5% |
| Total | 254 | 100.0% |
Housing Finances in Our Town
Median Income by Occupancy in Our Town
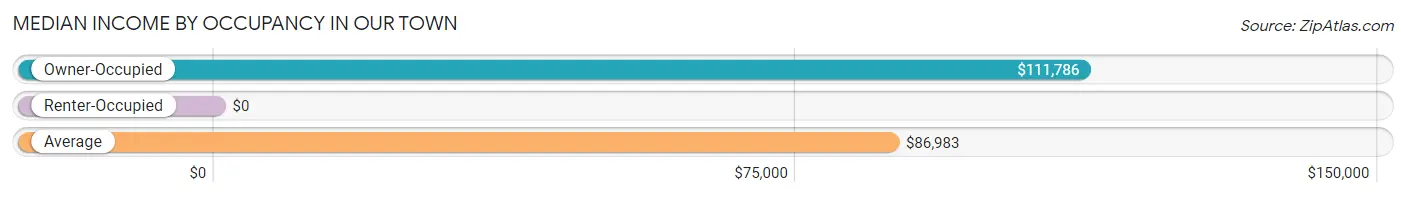
| Occupancy Type | # Households | Median Income |
| Owner-Occupied | 192 (75.6%) | $111,786 |
| Renter-Occupied | 62 (24.4%) | $0 |
| Average | 254 (100.0%) | $86,983 |
Occupancy by Householder Income Bracket in Our Town
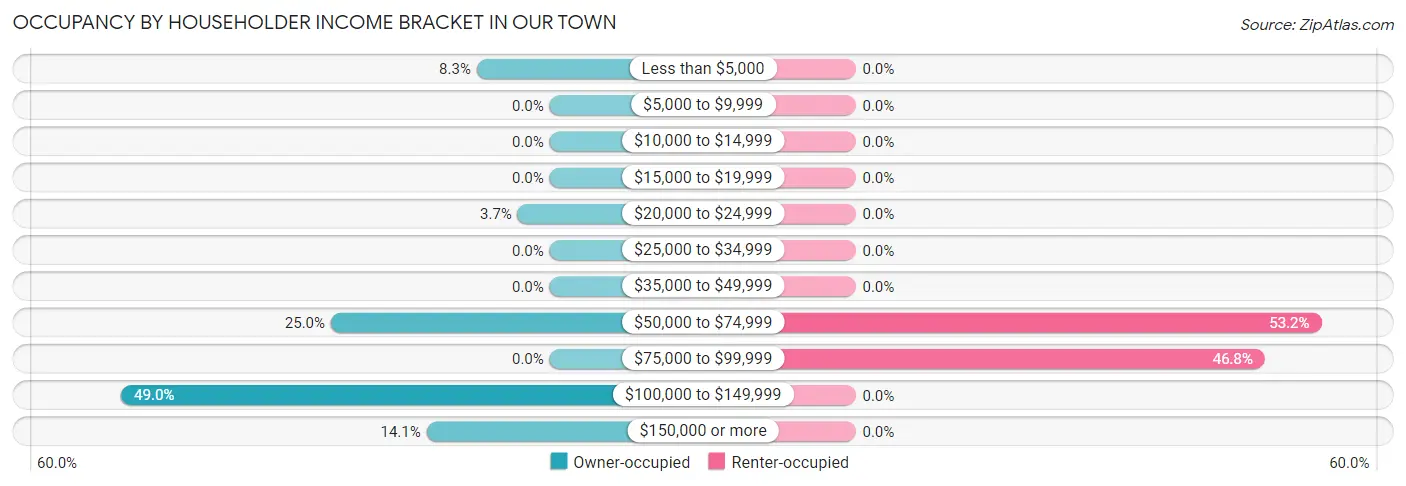
| Income Bracket | Owner-occupied | Renter-occupied |
| Less than $5,000 | 16 (8.3%) | 0 (0.0%) |
| $5,000 to $9,999 | 0 (0.0%) | 0 (0.0%) |
| $10,000 to $14,999 | 0 (0.0%) | 0 (0.0%) |
| $15,000 to $19,999 | 0 (0.0%) | 0 (0.0%) |
| $20,000 to $24,999 | 7 (3.6%) | 0 (0.0%) |
| $25,000 to $34,999 | 0 (0.0%) | 0 (0.0%) |
| $35,000 to $49,999 | 0 (0.0%) | 0 (0.0%) |
| $50,000 to $74,999 | 48 (25.0%) | 33 (53.2%) |
| $75,000 to $99,999 | 0 (0.0%) | 29 (46.8%) |
| $100,000 to $149,999 | 94 (49.0%) | 0 (0.0%) |
| $150,000 or more | 27 (14.1%) | 0 (0.0%) |
| Total | 192 (100.0%) | 62 (100.0%) |
Monthly Housing Cost Tiers in Our Town
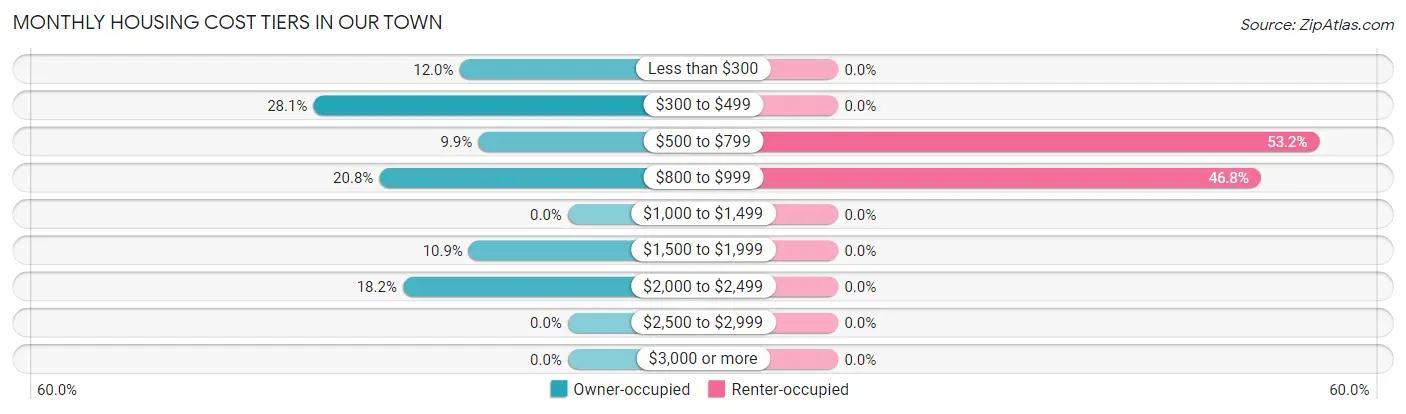
| Monthly Cost | Owner-occupied | Renter-occupied |
| Less than $300 | 23 (12.0%) | 0 (0.0%) |
| $300 to $499 | 54 (28.1%) | 0 (0.0%) |
| $500 to $799 | 19 (9.9%) | 33 (53.2%) |
| $800 to $999 | 40 (20.8%) | 29 (46.8%) |
| $1,000 to $1,499 | 0 (0.0%) | 0 (0.0%) |
| $1,500 to $1,999 | 21 (10.9%) | 0 (0.0%) |
| $2,000 to $2,499 | 35 (18.2%) | 0 (0.0%) |
| $2,500 to $2,999 | 0 (0.0%) | 0 (0.0%) |
| $3,000 or more | 0 (0.0%) | 0 (0.0%) |
| Total | 192 (100.0%) | 62 (100.0%) |
Physical Housing Characteristics in Our Town
Housing Structures in Our Town
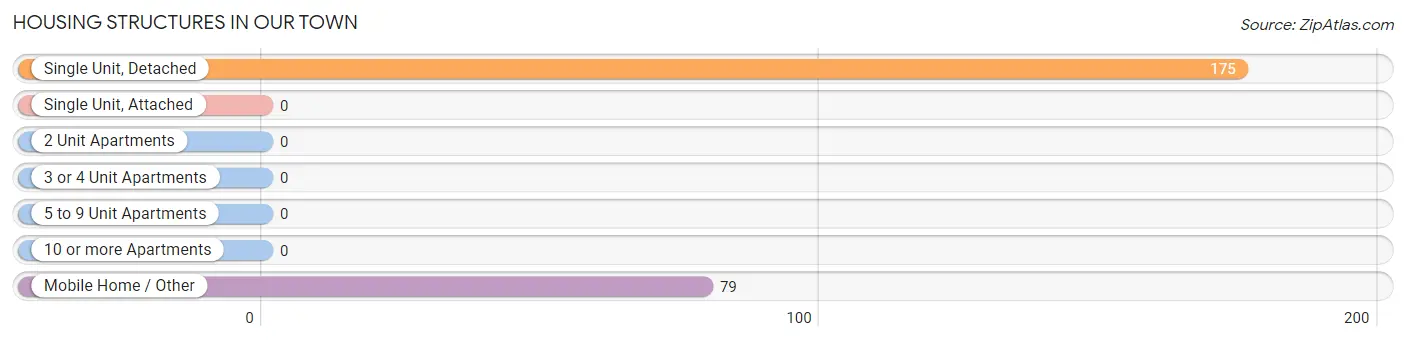
| Structure Type | # Housing Units | % Housing Units |
| Single Unit, Detached | 175 | 68.9% |
| Single Unit, Attached | 0 | 0.0% |
| 2 Unit Apartments | 0 | 0.0% |
| 3 or 4 Unit Apartments | 0 | 0.0% |
| 5 to 9 Unit Apartments | 0 | 0.0% |
| 10 or more Apartments | 0 | 0.0% |
| Mobile Home / Other | 79 | 31.1% |
| Total | 254 | 100.0% |
Housing Structures by Occupancy in Our Town
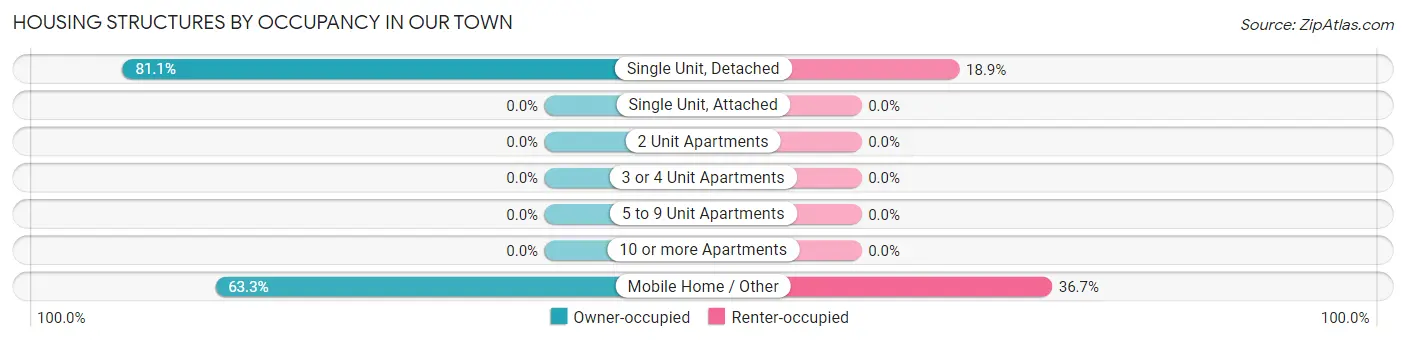
| Structure Type | Owner-occupied | Renter-occupied |
| Single Unit, Detached | 142 (81.1%) | 33 (18.9%) |
| Single Unit, Attached | 0 (0.0%) | 0 (0.0%) |
| 2 Unit Apartments | 0 (0.0%) | 0 (0.0%) |
| 3 or 4 Unit Apartments | 0 (0.0%) | 0 (0.0%) |
| 5 to 9 Unit Apartments | 0 (0.0%) | 0 (0.0%) |
| 10 or more Apartments | 0 (0.0%) | 0 (0.0%) |
| Mobile Home / Other | 50 (63.3%) | 29 (36.7%) |
| Total | 192 (75.6%) | 62 (24.4%) |
Housing Structures by Number of Rooms in Our Town
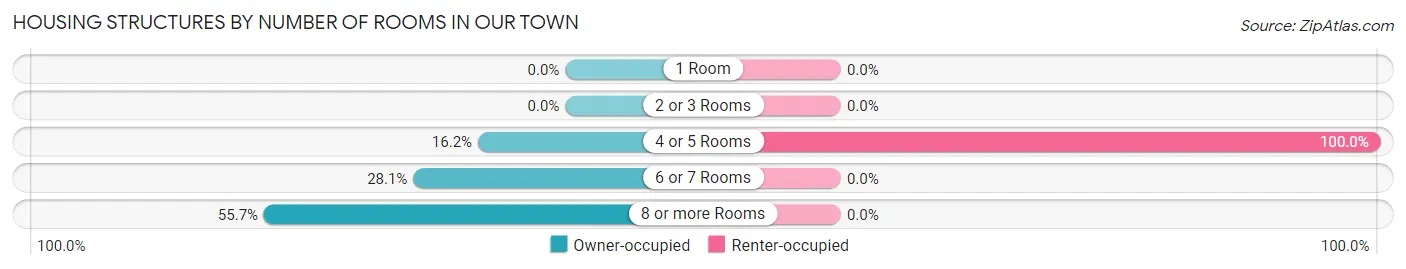
| Number of Rooms | Owner-occupied | Renter-occupied |
| 1 Room | 0 (0.0%) | 0 (0.0%) |
| 2 or 3 Rooms | 0 (0.0%) | 0 (0.0%) |
| 4 or 5 Rooms | 31 (16.2%) | 62 (100.0%) |
| 6 or 7 Rooms | 54 (28.1%) | 0 (0.0%) |
| 8 or more Rooms | 107 (55.7%) | 0 (0.0%) |
| Total | 192 (100.0%) | 62 (100.0%) |
Housing Structure by Heating Type in Our Town
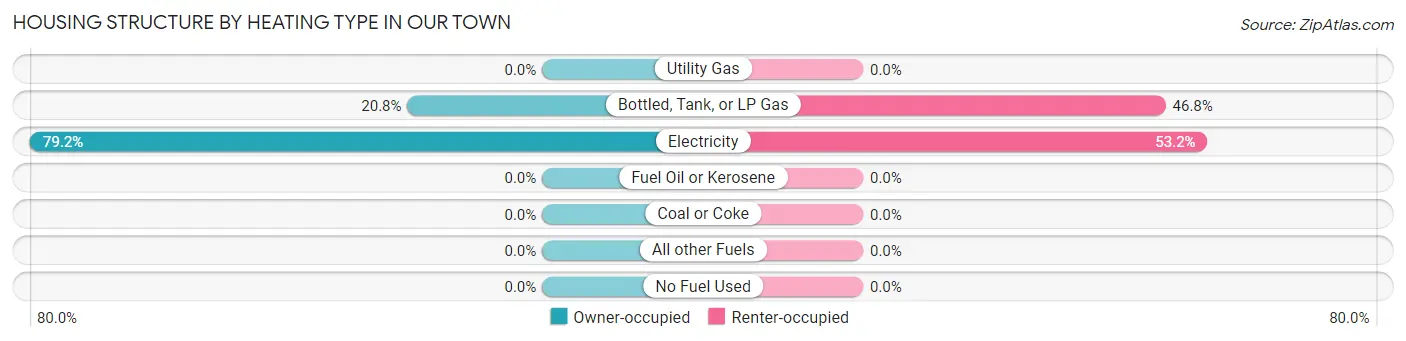
| Heating Type | Owner-occupied | Renter-occupied |
| Utility Gas | 0 (0.0%) | 0 (0.0%) |
| Bottled, Tank, or LP Gas | 40 (20.8%) | 29 (46.8%) |
| Electricity | 152 (79.2%) | 33 (53.2%) |
| Fuel Oil or Kerosene | 0 (0.0%) | 0 (0.0%) |
| Coal or Coke | 0 (0.0%) | 0 (0.0%) |
| All other Fuels | 0 (0.0%) | 0 (0.0%) |
| No Fuel Used | 0 (0.0%) | 0 (0.0%) |
| Total | 192 (100.0%) | 62 (100.0%) |
Household Vehicle Usage in Our Town
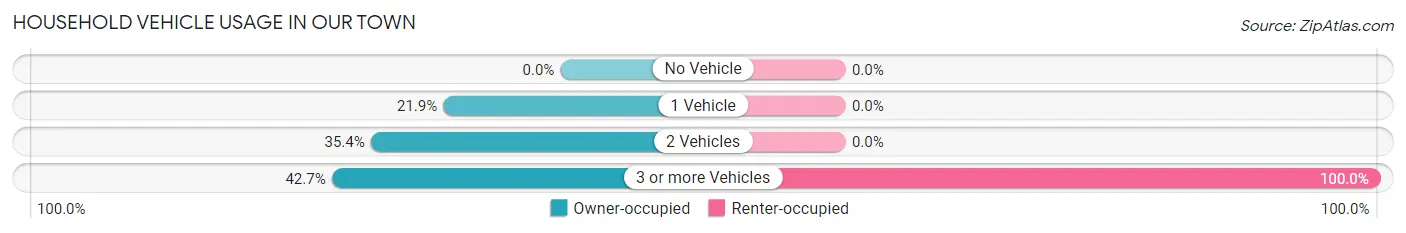
| Vehicles per Household | Owner-occupied | Renter-occupied |
| No Vehicle | 0 (0.0%) | 0 (0.0%) |
| 1 Vehicle | 42 (21.9%) | 0 (0.0%) |
| 2 Vehicles | 68 (35.4%) | 0 (0.0%) |
| 3 or more Vehicles | 82 (42.7%) | 62 (100.0%) |
| Total | 192 (100.0%) | 62 (100.0%) |
Real Estate & Mortgages in Our Town
Real Estate and Mortgage Overview in Our Town
| Characteristic | Without Mortgage | With Mortgage |
| Housing Units | 96 | 96 |
| Median Property Value | - | - |
| Median Household Income | - | - |
| Monthly Housing Costs | $346 | $0 |
| Real Estate Taxes | - | - |
Property Value by Mortgage Status in Our Town
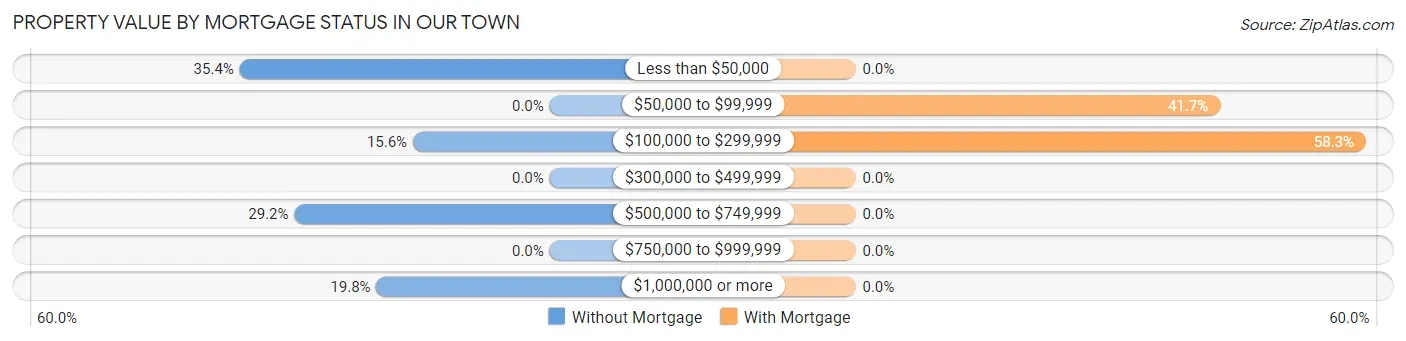
| Property Value | Without Mortgage | With Mortgage |
| Less than $50,000 | 34 (35.4%) | 0 (0.0%) |
| $50,000 to $99,999 | 0 (0.0%) | 40 (41.7%) |
| $100,000 to $299,999 | 15 (15.6%) | 56 (58.3%) |
| $300,000 to $499,999 | 0 (0.0%) | 0 (0.0%) |
| $500,000 to $749,999 | 28 (29.2%) | 0 (0.0%) |
| $750,000 to $999,999 | 0 (0.0%) | 0 (0.0%) |
| $1,000,000 or more | 19 (19.8%) | 0 (0.0%) |
| Total | 96 (100.0%) | 96 (100.0%) |
Household Income by Mortgage Status in Our Town
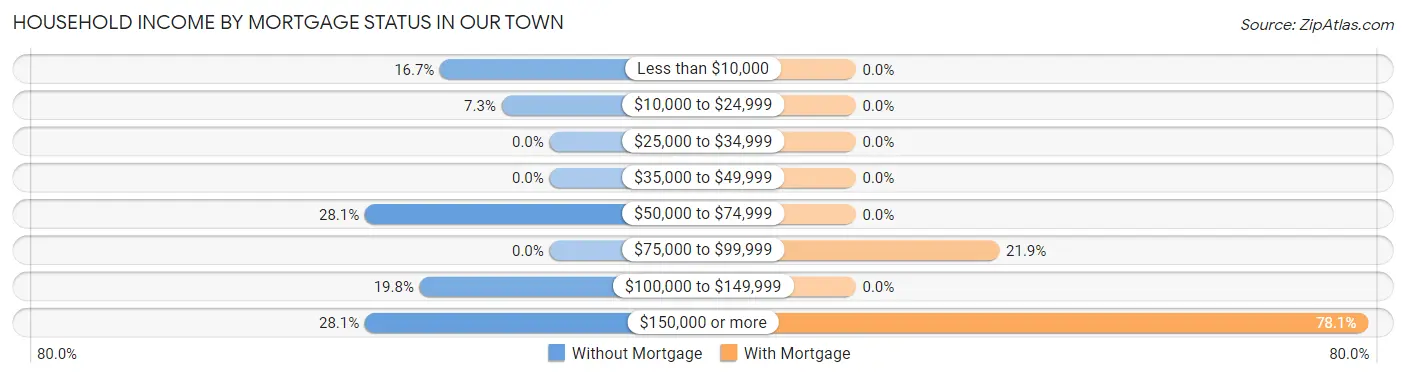
| Household Income | Without Mortgage | With Mortgage |
| Less than $10,000 | 16 (16.7%) | 0 (0.0%) |
| $10,000 to $24,999 | 7 (7.3%) | 0 (0.0%) |
| $25,000 to $34,999 | 0 (0.0%) | 0 (0.0%) |
| $35,000 to $49,999 | 0 (0.0%) | 0 (0.0%) |
| $50,000 to $74,999 | 27 (28.1%) | 0 (0.0%) |
| $75,000 to $99,999 | 0 (0.0%) | 21 (21.9%) |
| $100,000 to $149,999 | 19 (19.8%) | 0 (0.0%) |
| $150,000 or more | 27 (28.1%) | 75 (78.1%) |
| Total | 96 (100.0%) | 96 (100.0%) |
Property Value to Household Income Ratio in Our Town
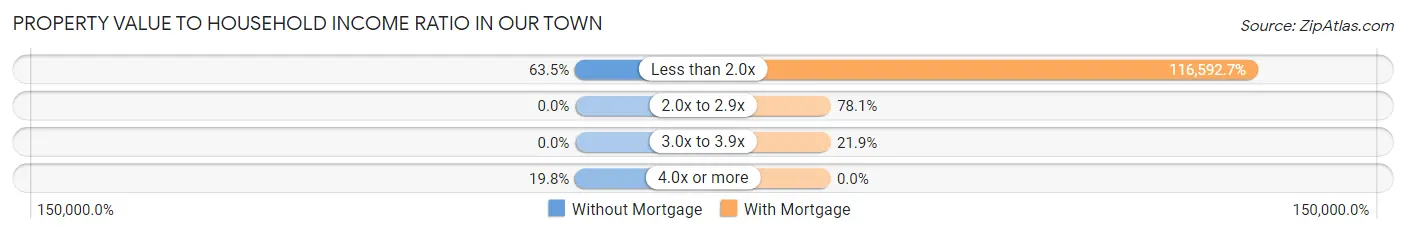
| Value-to-Income Ratio | Without Mortgage | With Mortgage |
| Less than 2.0x | 61 (63.5%) | 111,929 (116,592.7%) |
| 2.0x to 2.9x | 0 (0.0%) | 75 (78.1%) |
| 3.0x to 3.9x | 0 (0.0%) | 21 (21.9%) |
| 4.0x or more | 19 (19.8%) | 0 (0.0%) |
| Total | 96 (100.0%) | 96 (100.0%) |
Real Estate Taxes by Mortgage Status in Our Town
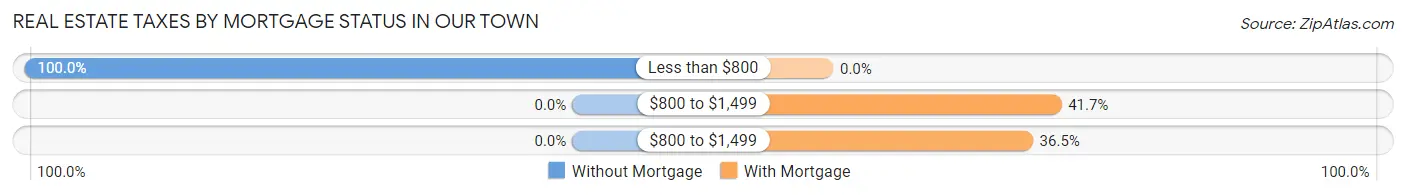
| Property Taxes | Without Mortgage | With Mortgage |
| Less than $800 | 96 (100.0%) | 0 (0.0%) |
| $800 to $1,499 | 0 (0.0%) | 40 (41.7%) |
| $800 to $1,499 | 0 (0.0%) | 35 (36.5%) |
| Total | 96 (100.0%) | 96 (100.0%) |
Health & Disability in Our Town
Health Insurance Coverage by Age in Our Town
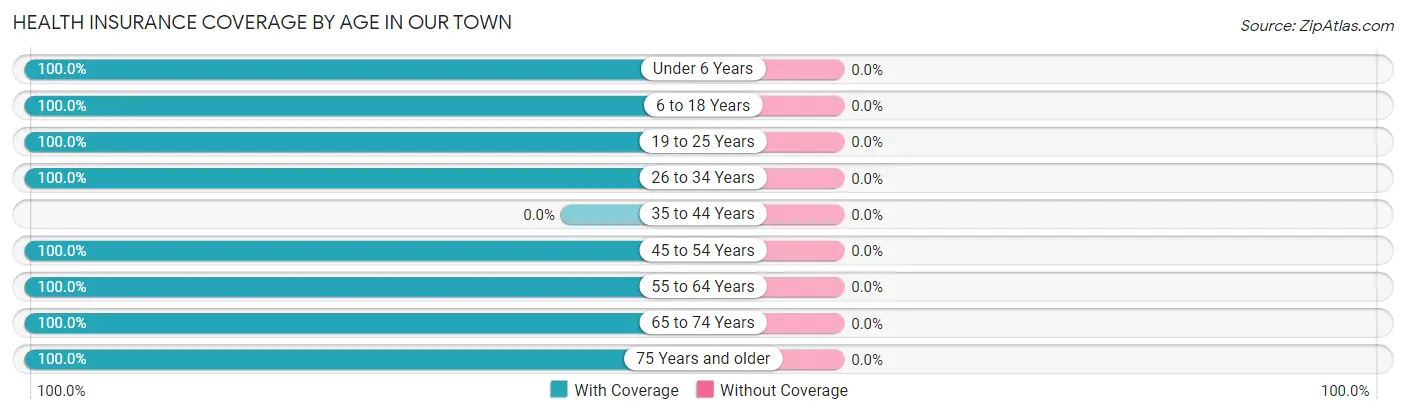
| Age Bracket | With Coverage | Without Coverage |
| Under 6 Years | 26 (100.0%) | 0 (0.0%) |
| 6 to 18 Years | 90 (100.0%) | 0 (0.0%) |
| 19 to 25 Years | 86 (100.0%) | 0 (0.0%) |
| 26 to 34 Years | 108 (100.0%) | 0 (0.0%) |
| 35 to 44 Years | 0 (0.0%) | 0 (0.0%) |
| 45 to 54 Years | 253 (100.0%) | 0 (0.0%) |
| 55 to 64 Years | 90 (100.0%) | 0 (0.0%) |
| 65 to 74 Years | 12 (100.0%) | 0 (0.0%) |
| 75 Years and older | 73 (100.0%) | 0 (0.0%) |
| Total | 738 (100.0%) | 0 (0.0%) |
Health Insurance Coverage by Citizenship Status in Our Town
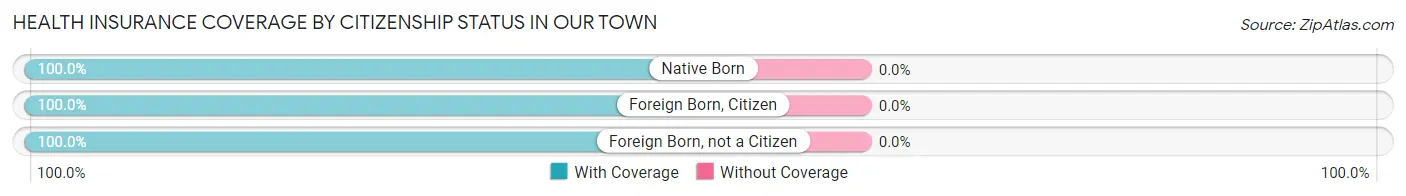
| Citizenship Status | With Coverage | Without Coverage |
| Native Born | 26 (100.0%) | 0 (0.0%) |
| Foreign Born, Citizen | 90 (100.0%) | 0 (0.0%) |
| Foreign Born, not a Citizen | 86 (100.0%) | 0 (0.0%) |
Health Insurance Coverage by Household Income in Our Town
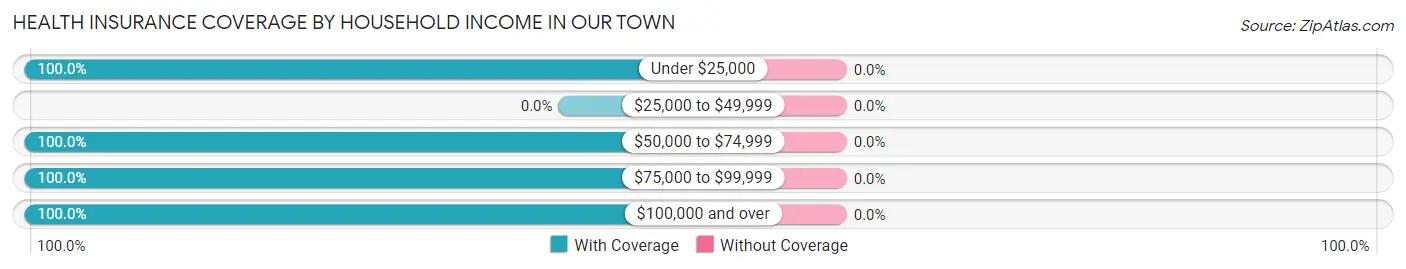
| Household Income | With Coverage | Without Coverage |
| Under $25,000 | 71 (100.0%) | 0 (0.0%) |
| $25,000 to $49,999 | 0 (0.0%) | 0 (0.0%) |
| $50,000 to $74,999 | 247 (100.0%) | 0 (0.0%) |
| $75,000 to $99,999 | 122 (100.0%) | 0 (0.0%) |
| $100,000 and over | 298 (100.0%) | 0 (0.0%) |
Public vs Private Health Insurance Coverage by Age in Our Town
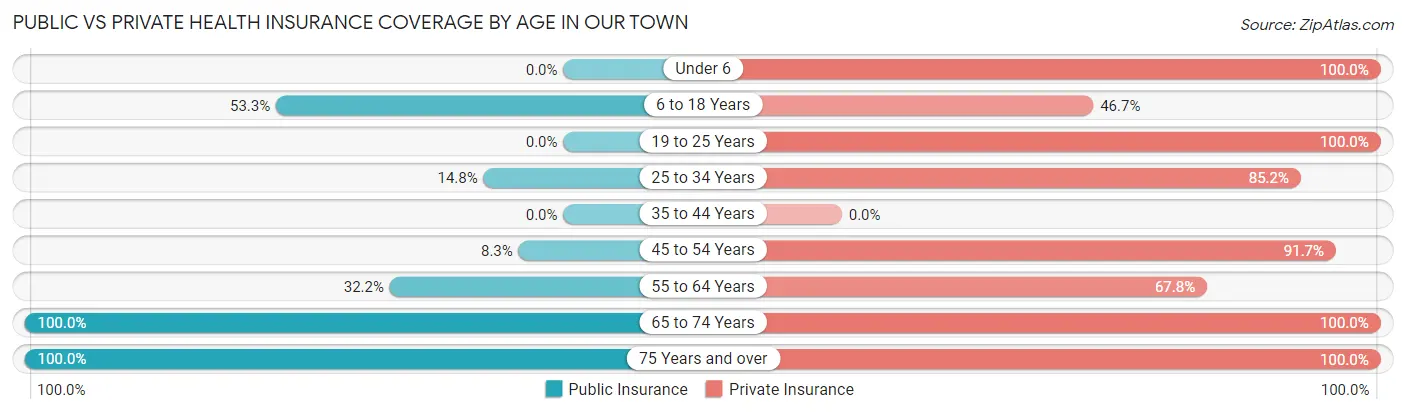
| Age Bracket | Public Insurance | Private Insurance |
| Under 6 | 0 (0.0%) | 26 (100.0%) |
| 6 to 18 Years | 48 (53.3%) | 42 (46.7%) |
| 19 to 25 Years | 0 (0.0%) | 86 (100.0%) |
| 25 to 34 Years | 16 (14.8%) | 92 (85.2%) |
| 35 to 44 Years | 0 (0.0%) | 0 (0.0%) |
| 45 to 54 Years | 21 (8.3%) | 232 (91.7%) |
| 55 to 64 Years | 29 (32.2%) | 61 (67.8%) |
| 65 to 74 Years | 12 (100.0%) | 12 (100.0%) |
| 75 Years and over | 73 (100.0%) | 73 (100.0%) |
| Total | 199 (27.0%) | 624 (84.6%) |
Disability Status by Sex by Age in Our Town
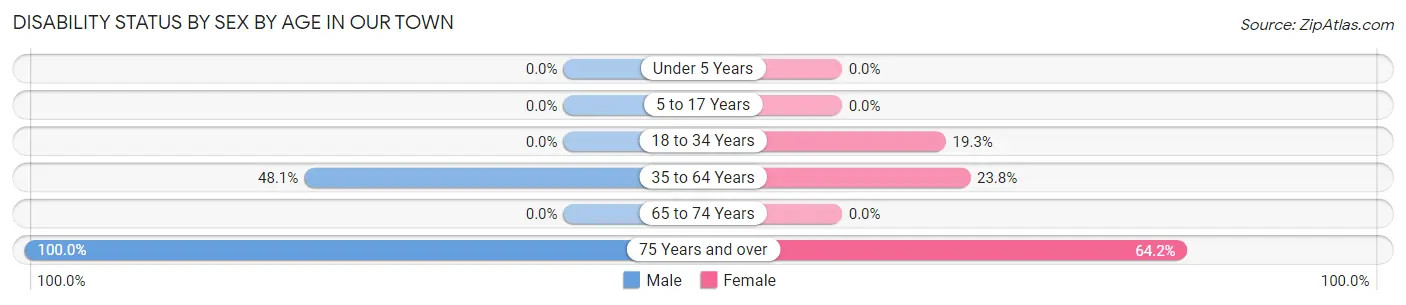
| Age Bracket | Male | Female |
| Under 5 Years | 0 (0.0%) | 0 (0.0%) |
| 5 to 17 Years | 0 (0.0%) | 0 (0.0%) |
| 18 to 34 Years | 0 (0.0%) | 16 (19.3%) |
| 35 to 64 Years | 64 (48.1%) | 50 (23.8%) |
| 65 to 74 Years | 0 (0.0%) | 0 (0.0%) |
| 75 Years and over | 20 (100.0%) | 34 (64.1%) |
Disability Class by Sex by Age in Our Town
Disability Class: Hearing Difficulty
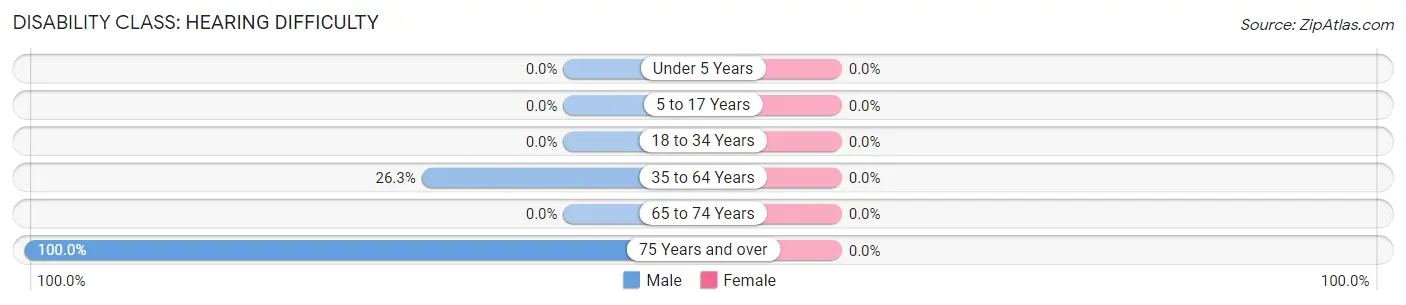
| Age Bracket | Male | Female |
| Under 5 Years | 0 (0.0%) | 0 (0.0%) |
| 5 to 17 Years | 0 (0.0%) | 0 (0.0%) |
| 18 to 34 Years | 0 (0.0%) | 0 (0.0%) |
| 35 to 64 Years | 35 (26.3%) | 0 (0.0%) |
| 65 to 74 Years | 0 (0.0%) | 0 (0.0%) |
| 75 Years and over | 20 (100.0%) | 0 (0.0%) |
Disability Class: Vision Difficulty
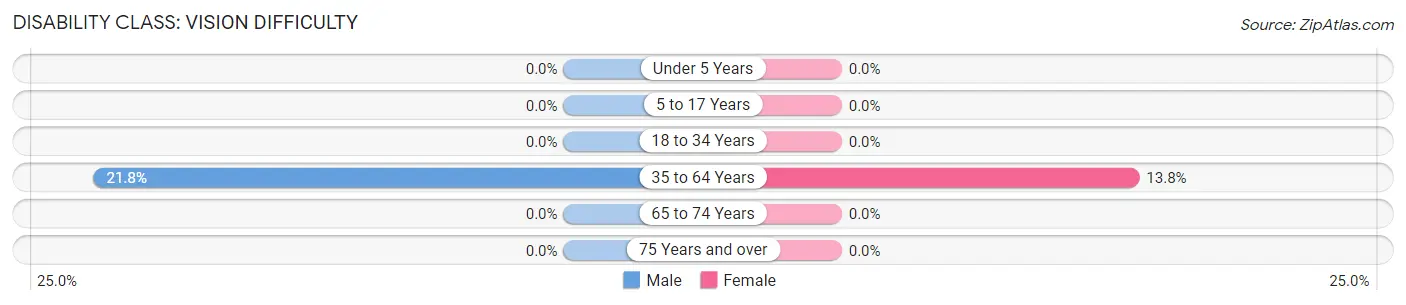
| Age Bracket | Male | Female |
| Under 5 Years | 0 (0.0%) | 0 (0.0%) |
| 5 to 17 Years | 0 (0.0%) | 0 (0.0%) |
| 18 to 34 Years | 0 (0.0%) | 0 (0.0%) |
| 35 to 64 Years | 29 (21.8%) | 29 (13.8%) |
| 65 to 74 Years | 0 (0.0%) | 0 (0.0%) |
| 75 Years and over | 0 (0.0%) | 0 (0.0%) |
Disability Class: Cognitive Difficulty
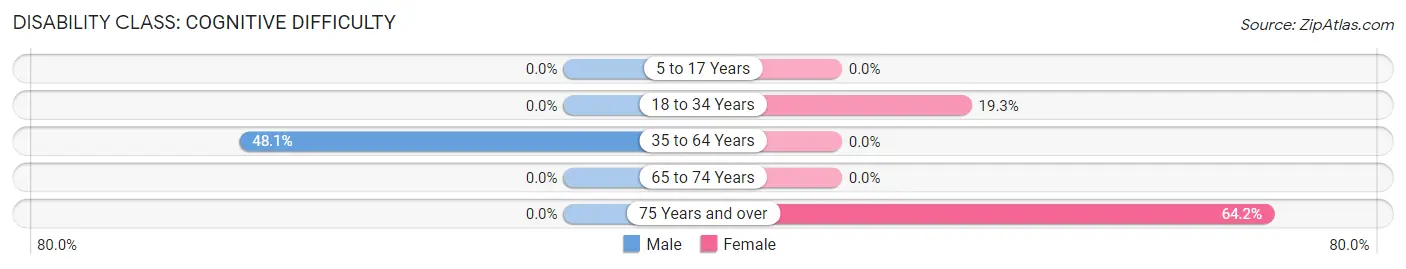
| Age Bracket | Male | Female |
| 5 to 17 Years | 0 (0.0%) | 0 (0.0%) |
| 18 to 34 Years | 0 (0.0%) | 16 (19.3%) |
| 35 to 64 Years | 64 (48.1%) | 0 (0.0%) |
| 65 to 74 Years | 0 (0.0%) | 0 (0.0%) |
| 75 Years and over | 0 (0.0%) | 34 (64.1%) |
Disability Class: Ambulatory Difficulty
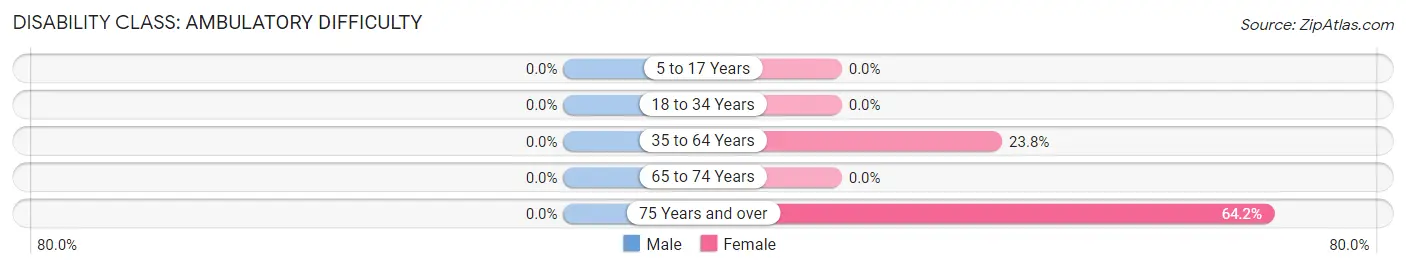
| Age Bracket | Male | Female |
| 5 to 17 Years | 0 (0.0%) | 0 (0.0%) |
| 18 to 34 Years | 0 (0.0%) | 0 (0.0%) |
| 35 to 64 Years | 0 (0.0%) | 50 (23.8%) |
| 65 to 74 Years | 0 (0.0%) | 0 (0.0%) |
| 75 Years and over | 0 (0.0%) | 34 (64.1%) |
Disability Class: Self-Care Difficulty
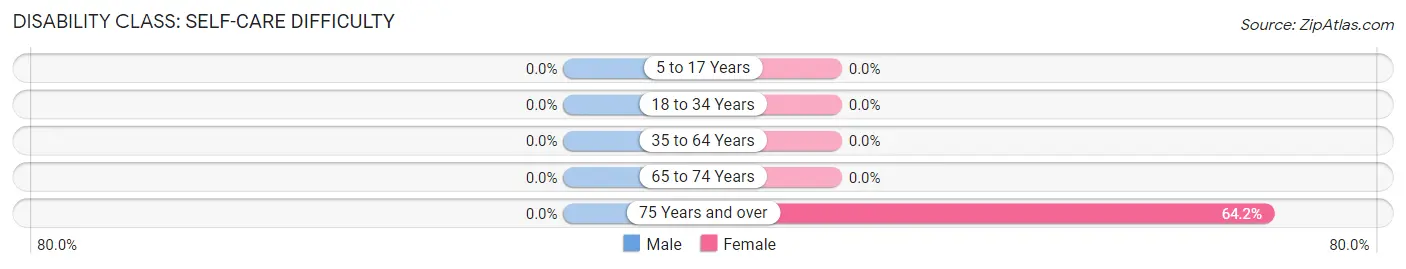
| Age Bracket | Male | Female |
| 5 to 17 Years | 0 (0.0%) | 0 (0.0%) |
| 18 to 34 Years | 0 (0.0%) | 0 (0.0%) |
| 35 to 64 Years | 0 (0.0%) | 0 (0.0%) |
| 65 to 74 Years | 0 (0.0%) | 0 (0.0%) |
| 75 Years and over | 0 (0.0%) | 34 (64.1%) |
Technology Access in Our Town
Computing Device Access in Our Town
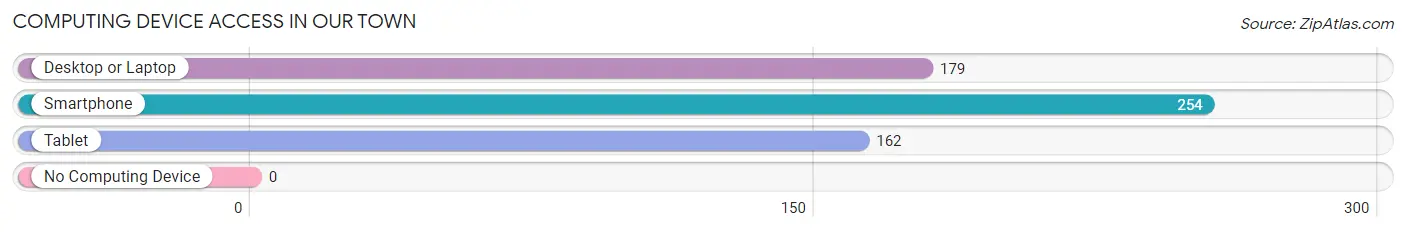
| Device Type | # Households | % Households |
| Desktop or Laptop | 179 | 70.5% |
| Smartphone | 254 | 100.0% |
| Tablet | 162 | 63.8% |
| No Computing Device | 0 | 0.0% |
| Total | 254 | 100.0% |
Internet Access in Our Town
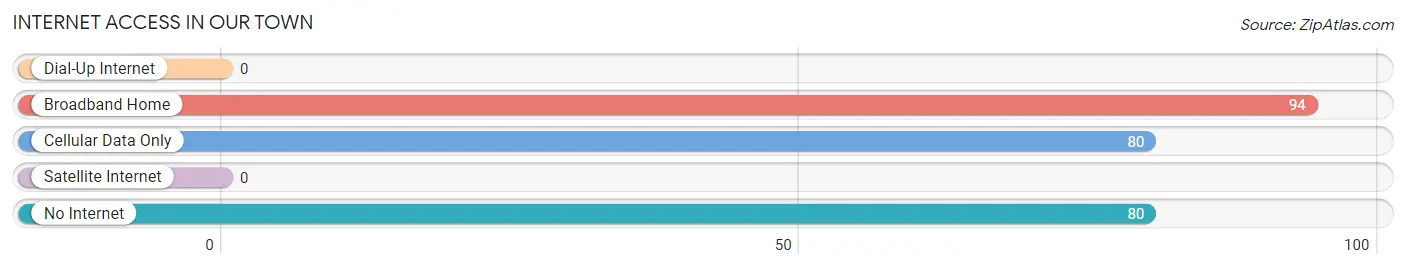
| Internet Type | # Households | % Households |
| Dial-Up Internet | 0 | 0.0% |
| Broadband Home | 94 | 37.0% |
| Cellular Data Only | 80 | 31.5% |
| Satellite Internet | 0 | 0.0% |
| No Internet | 80 | 31.5% |
| Total | 254 | 100.0% |
Our Town Summary
Our Town, AL is a small town located in the southeastern corner of the state of Alabama. It is situated in the foothills of the Appalachian Mountains and is surrounded by lush forests and rolling hills. The town has a population of approximately 2,000 people and is known for its rural charm and friendly atmosphere.
Geography
Our Town, AL is located in the foothills of the Appalachian Mountains, which provide a beautiful backdrop to the town. The town is situated on the banks of the Little River, which is a tributary of the larger Tennessee River. The town is surrounded by lush forests and rolling hills, which provide a picturesque setting for the town. The town is located approximately 30 miles from the nearest major city, Birmingham, AL.
Economy
Our Town, AL is a small, rural town with a population of approximately 2,000 people. The town’s economy is largely based on agriculture and forestry. The town is home to several small farms, which produce a variety of crops such as corn, soybeans, and cotton. The town also has several small lumber mills, which produce lumber for the local market. In addition, the town is home to several small businesses, such as restaurants, stores, and other services.
Demographics
Our Town, AL is a predominantly white town, with approximately 90% of the population being white. The remaining 10% of the population is made up of African Americans, Hispanics, and other ethnicities. The town has a median household income of approximately $35,000, which is slightly lower than the state average. The town has a low unemployment rate, with only 4.5% of the population being unemployed.
History
Our Town, AL was founded in the early 1800s by settlers from the nearby town of Huntsville, AL. The town was originally known as “Little River”, but was later renamed to Our Town, AL. The town was a small farming community for many years, but began to grow in the late 1800s when the railroad was built through the town. The town continued to grow throughout the 20th century, and today is a small, rural town with a population of approximately 2,000 people.
Conclusion
Our Town, AL is a small, rural town located in the foothills of the Appalachian Mountains. The town has a population of approximately 2,000 people and is known for its rural charm and friendly atmosphere. The town’s economy is largely based on agriculture and forestry, and the town is home to several small businesses. The town is predominantly white, with a median household income of approximately $35,000 and a low unemployment rate. Our Town, AL has a rich history and is a great place to live and work.
Common Questions
What is the Total Population of Our Town?
Total Population of Our Town is 738.
What is the Total Male Population of Our Town?
Total Male Population of Our Town is 333.
What is the Total Female Population of Our Town?
Total Female Population of Our Town is 405.
What is the Ratio of Males per 100 Females in Our Town?
There are 82.22 Males per 100 Females in Our Town.
What is the Ratio of Females per 100 Males in Our Town?
There are 121.62 Females per 100 Males in Our Town.
What is the Median Population Age in Our Town?
Median Population Age in Our Town is 47.6 Years.
What is the Average Family Size in Our Town
Average Family Size in Our Town is 3.1 People.
What is the Average Household Size in Our Town
Average Household Size in Our Town is 2.9 People.
What is Per Capita Income in Our Town?
Per Capita income in Our Town is $41,789.
What is the Median Family Income in Our Town?
Median Family Income in Our Town is $85,948.
What is the Median Household income in Our Town?
Median Household Income in Our Town is $86,983.
What is Income or Wage Gap in Our Town?
Income or Wage Gap in Our Town is 40.7%.
Women in Our Town earn 59.3 cents for every dollar earned by a man.
What is Inequality or Gini Index in Our Town?
Inequality or Gini Index in Our Town is 0.38.
How Large is the Labor Force in Our Town?
There are 471 People in the Labor Forcein in Our Town.
What is the Percentage of People in the Labor Force in Our Town?
75.7% of People are in the Labor Force in Our Town.