Oak Grove, AL
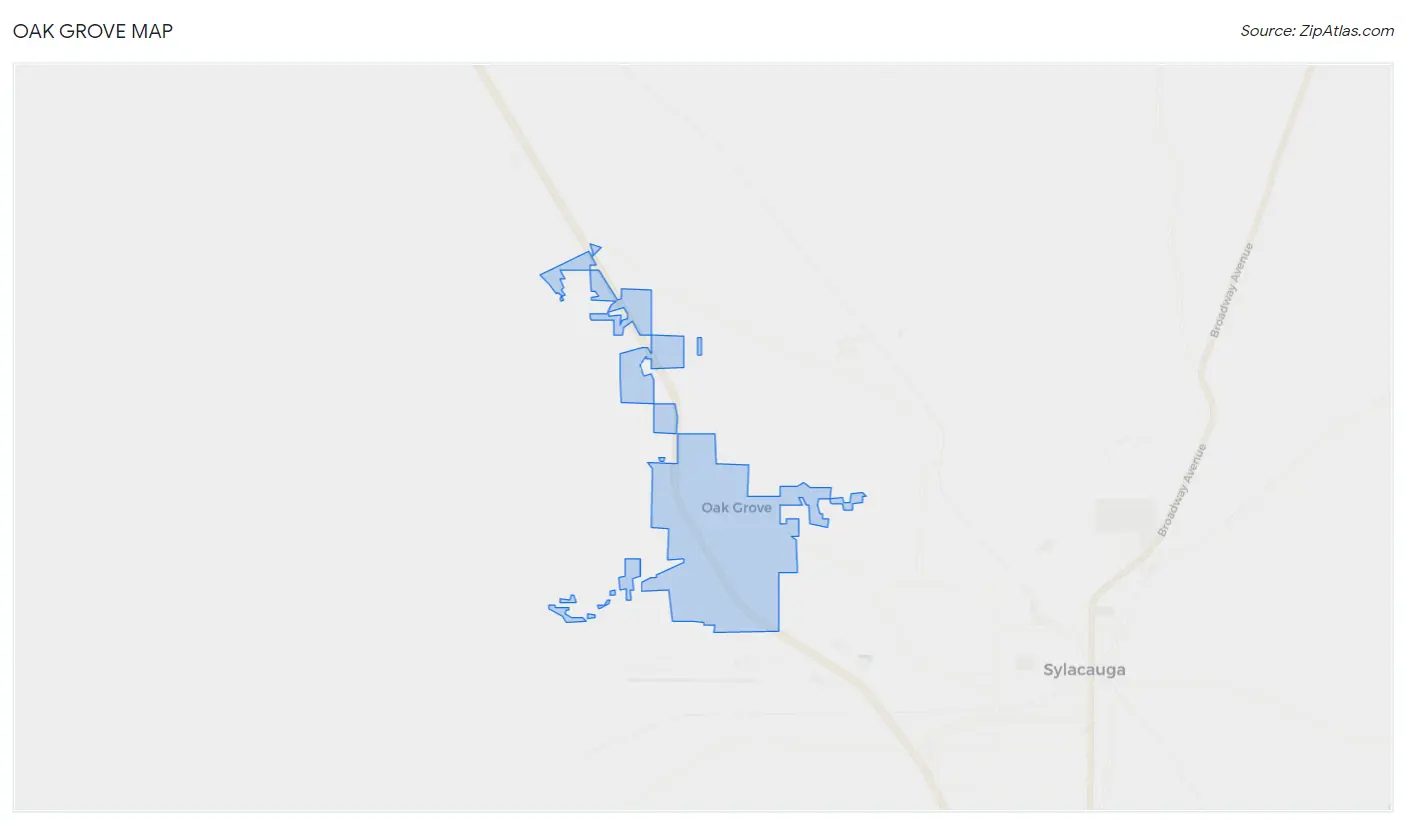
Oak Grove Map
Oak Grove Overview
930
TOTAL POPULATION
465
MALE POPULATION
465
FEMALE POPULATION
100.00
MALES / 100 FEMALES
100.00
FEMALES / 100 MALES
50.6
MEDIAN AGE
2.8
AVG FAMILY SIZE
2.5
AVG HOUSEHOLD SIZE
$27,801
PER CAPITA INCOME
$56,296
AVG FAMILY INCOME
$56,311
AVG HOUSEHOLD INCOME
0.3%
WAGE / INCOME GAP [ % ]
99.7¢/ $1
WAGE / INCOME GAP [ $ ]
0.32
INEQUALITY / GINI INDEX
436
LABOR FORCE [ PEOPLE ]
54.3%
PERCENT IN LABOR FORCE
4.6%
UNEMPLOYMENT RATE
Oak Grove Area Codes
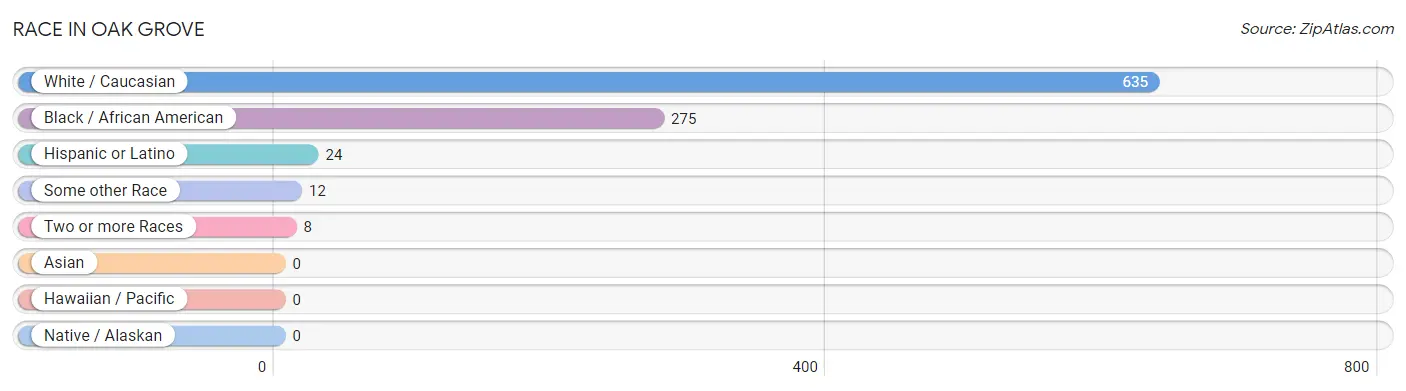
Race in Oak Grove
The most populous races in Oak Grove are White / Caucasian (635 | 68.3%), Black / African American (275 | 29.6%), and Hispanic or Latino (24 | 2.6%).
| Race | # Population | % Population |
| Asian | 0 | 0.0% |
| Black / African American | 275 | 29.6% |
| Hawaiian / Pacific | 0 | 0.0% |
| Hispanic or Latino | 24 | 2.6% |
| Native / Alaskan | 0 | 0.0% |
| White / Caucasian | 635 | 68.3% |
| Two or more Races | 8 | 0.9% |
| Some other Race | 12 | 1.3% |
| Total | 930 | 100.0% |
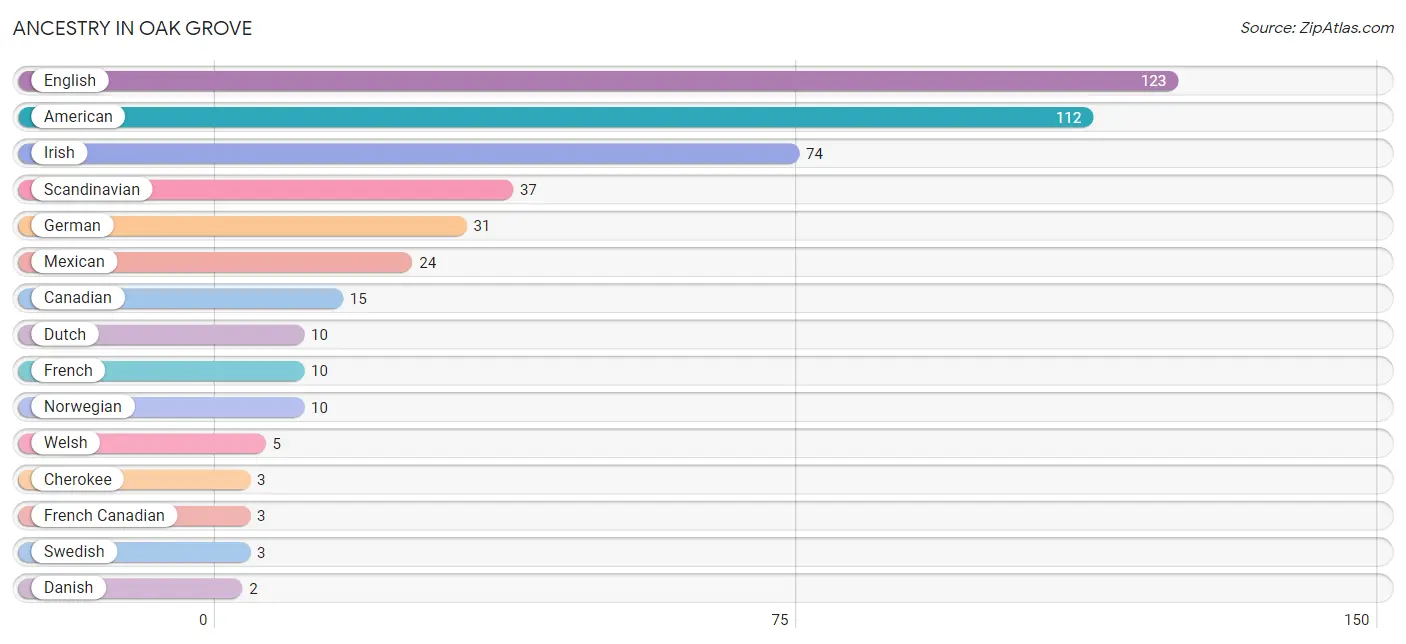
Ancestry in Oak Grove
The most populous ancestries reported in Oak Grove are English (123 | 13.2%), American (112 | 12.0%), Irish (74 | 8.0%), Scandinavian (37 | 4.0%), and German (31 | 3.3%), together accounting for 40.5% of all Oak Grove residents.
| Ancestry | # Population | % Population |
| American | 112 | 12.0% |
| Canadian | 15 | 1.6% |
| Cherokee | 3 | 0.3% |
| Creek | 1 | 0.1% |
| Danish | 2 | 0.2% |
| Dutch | 10 | 1.1% |
| English | 123 | 13.2% |
| French | 10 | 1.1% |
| French Canadian | 3 | 0.3% |
| German | 31 | 3.3% |
| Irish | 74 | 8.0% |
| Mexican | 24 | 2.6% |
| Norwegian | 10 | 1.1% |
| Polish | 2 | 0.2% |
| Scandinavian | 37 | 4.0% |
| Swedish | 3 | 0.3% |
| Welsh | 5 | 0.5% | View All 17 Rows |
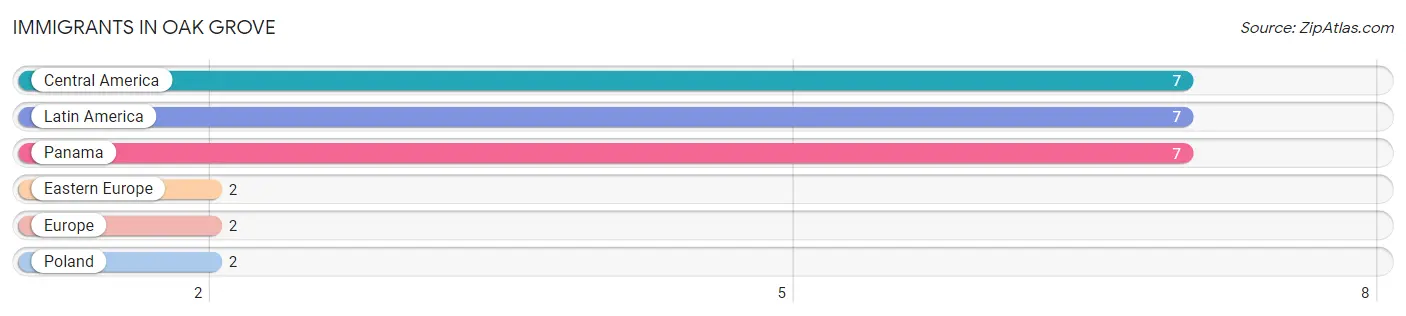
Immigrants in Oak Grove
The most numerous immigrant groups reported in Oak Grove came from Central America (7 | 0.7%), Latin America (7 | 0.7%), Panama (7 | 0.7%), Eastern Europe (2 | 0.2%), and Europe (2 | 0.2%), together accounting for 2.7% of all Oak Grove residents.
| Immigration Origin | # Population | % Population |
| Central America | 7 | 0.7% |
| Eastern Europe | 2 | 0.2% |
| Europe | 2 | 0.2% |
| Latin America | 7 | 0.7% |
| Panama | 7 | 0.7% |
| Poland | 2 | 0.2% | View All 6 Rows |
Sex and Age in Oak Grove
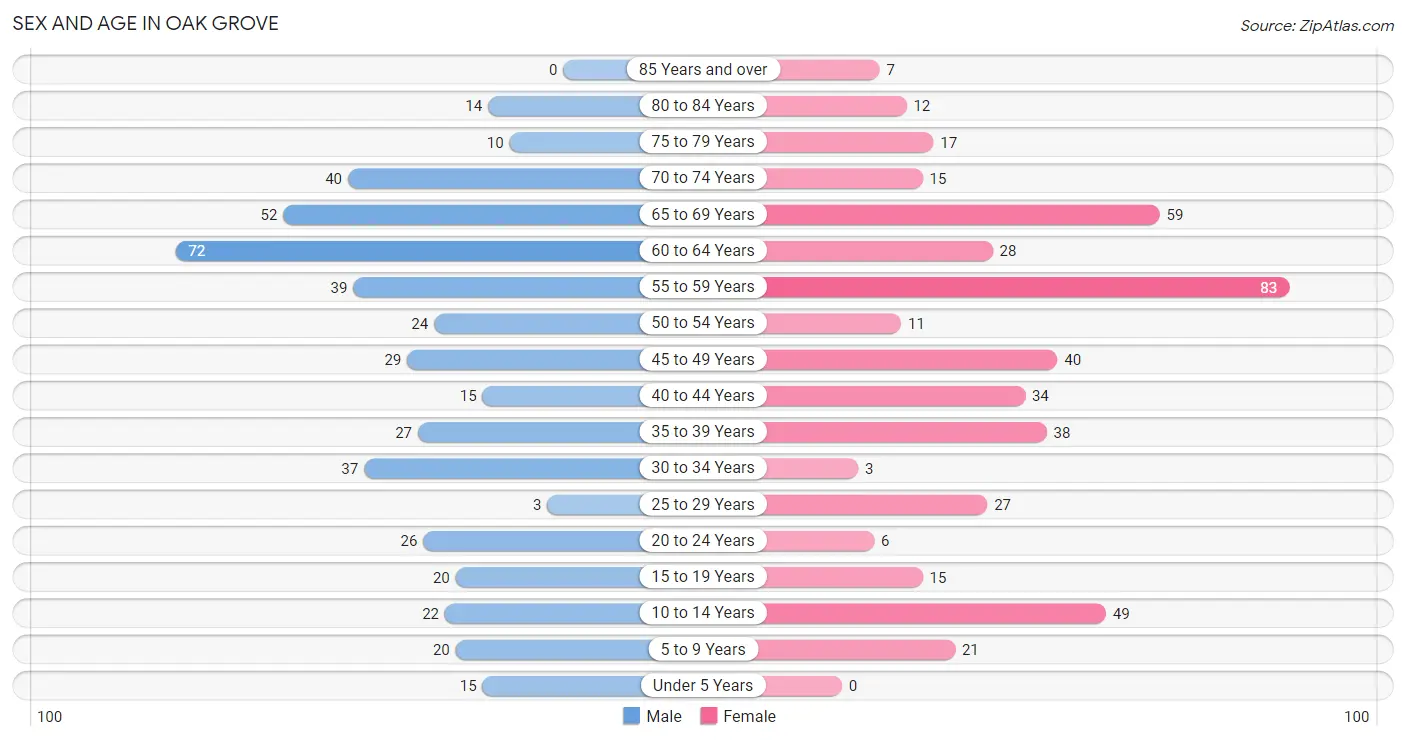
Sex and Age in Oak Grove
The most populous age groups in Oak Grove are 60 to 64 Years (72 | 15.5%) for men and 55 to 59 Years (83 | 17.8%) for women.
| Age Bracket | Male | Female |
| Under 5 Years | 15 (3.2%) | 0 (0.0%) |
| 5 to 9 Years | 20 (4.3%) | 21 (4.5%) |
| 10 to 14 Years | 22 (4.7%) | 49 (10.5%) |
| 15 to 19 Years | 20 (4.3%) | 15 (3.2%) |
| 20 to 24 Years | 26 (5.6%) | 6 (1.3%) |
| 25 to 29 Years | 3 (0.6%) | 27 (5.8%) |
| 30 to 34 Years | 37 (8.0%) | 3 (0.6%) |
| 35 to 39 Years | 27 (5.8%) | 38 (8.2%) |
| 40 to 44 Years | 15 (3.2%) | 34 (7.3%) |
| 45 to 49 Years | 29 (6.2%) | 40 (8.6%) |
| 50 to 54 Years | 24 (5.2%) | 11 (2.4%) |
| 55 to 59 Years | 39 (8.4%) | 83 (17.8%) |
| 60 to 64 Years | 72 (15.5%) | 28 (6.0%) |
| 65 to 69 Years | 52 (11.2%) | 59 (12.7%) |
| 70 to 74 Years | 40 (8.6%) | 15 (3.2%) |
| 75 to 79 Years | 10 (2.1%) | 17 (3.7%) |
| 80 to 84 Years | 14 (3.0%) | 12 (2.6%) |
| 85 Years and over | 0 (0.0%) | 7 (1.5%) |
| Total | 465 (100.0%) | 465 (100.0%) |
Families and Households in Oak Grove
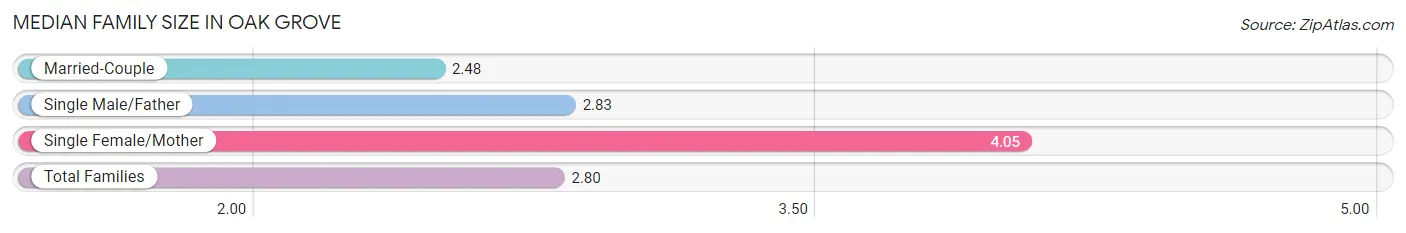
Median Family Size in Oak Grove
The median family size in Oak Grove is 2.80 persons per family, with single female/mother families (56 | 19.2%) accounting for the largest median family size of 4.05 persons per family. On the other hand, married-couple families (217 | 74.6%) represent the smallest median family size with 2.48 persons per family.
| Family Type | # Families | Family Size |
| Married-Couple | 217 (74.6%) | 2.48 |
| Single Male/Father | 18 (6.2%) | 2.83 |
| Single Female/Mother | 56 (19.2%) | 4.05 |
| Total Families | 291 (100.0%) | 2.80 |
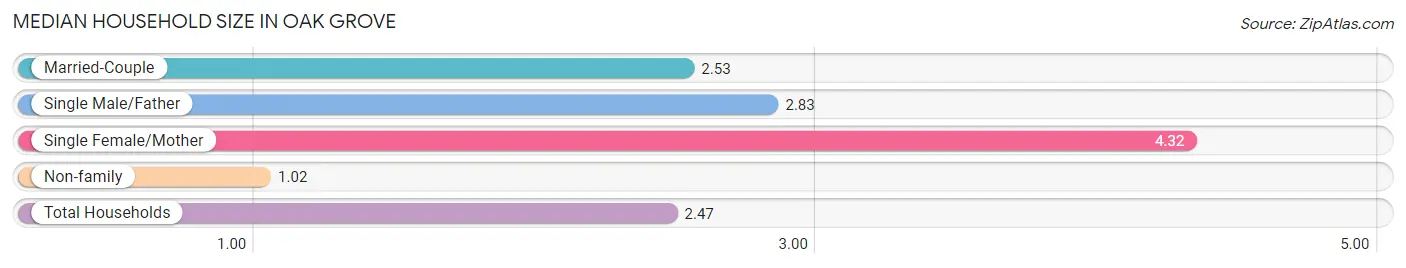
Median Household Size in Oak Grove
The median household size in Oak Grove is 2.47 persons per household, with single female/mother households (56 | 14.9%) accounting for the largest median household size of 4.32 persons per household. non-family households (85 | 22.6%) represent the smallest median household size with 1.02 persons per household.
| Household Type | # Households | Household Size |
| Married-Couple | 217 (57.7%) | 2.53 |
| Single Male/Father | 18 (4.8%) | 2.83 |
| Single Female/Mother | 56 (14.9%) | 4.32 |
| Non-family | 85 (22.6%) | 1.02 |
| Total Households | 376 (100.0%) | 2.47 |
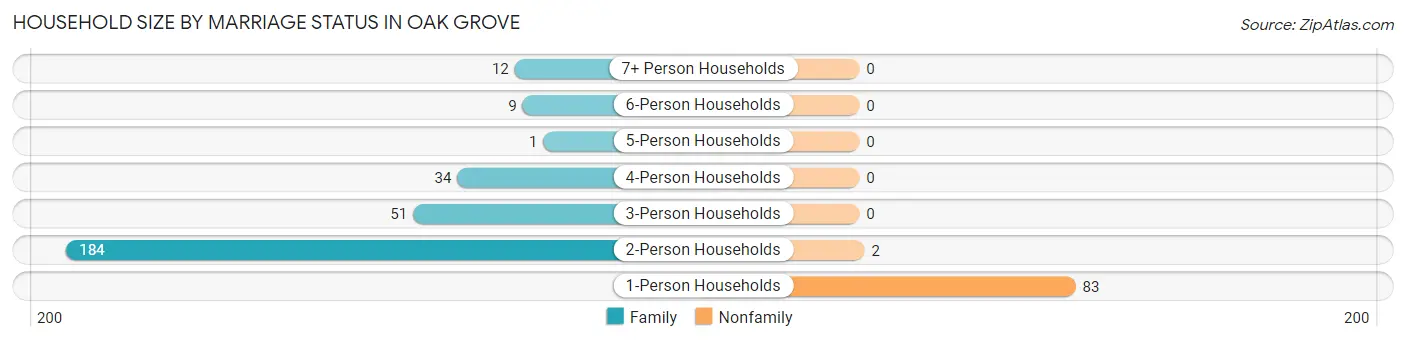
Household Size by Marriage Status in Oak Grove
Out of a total of 376 households in Oak Grove, 291 (77.4%) are family households, while 85 (22.6%) are nonfamily households. The most numerous type of family households are 2-person households, comprising 184, and the most common type of nonfamily households are 1-person households, comprising 83.
| Household Size | Family Households | Nonfamily Households |
| 1-Person Households | - | 83 (22.1%) |
| 2-Person Households | 184 (48.9%) | 2 (0.5%) |
| 3-Person Households | 51 (13.6%) | 0 (0.0%) |
| 4-Person Households | 34 (9.0%) | 0 (0.0%) |
| 5-Person Households | 1 (0.3%) | 0 (0.0%) |
| 6-Person Households | 9 (2.4%) | 0 (0.0%) |
| 7+ Person Households | 12 (3.2%) | 0 (0.0%) |
| Total | 291 (77.4%) | 85 (22.6%) |
Female Fertility in Oak Grove
Fertility by Age in Oak Grove
Average fertility rate in Oak Grove is 12.0 births per 1,000 women. Women in the age bracket of 20 to 34 years have the highest fertility rate with 56.0 births per 1,000 women. Women in the age bracket of 20 to 34 years acount for 100.0% of all women with births.
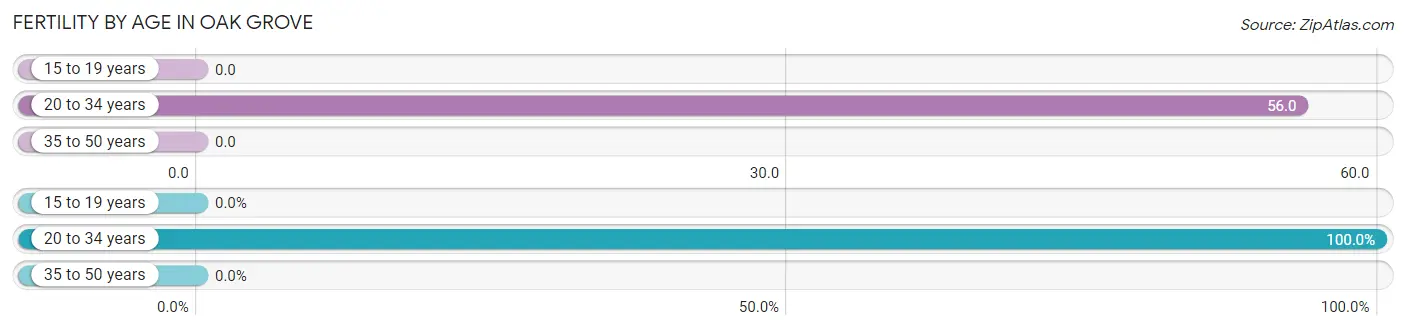
| Age Bracket | Women with Births | Births / 1,000 Women |
| 15 to 19 years | 0 (0.0%) | 0.0 |
| 20 to 34 years | 2 (100.0%) | 56.0 |
| 35 to 50 years | 0 (0.0%) | 0.0 |
| Total | 2 (100.0%) | 12.0 |
Fertility by Age by Marriage Status in Oak Grove
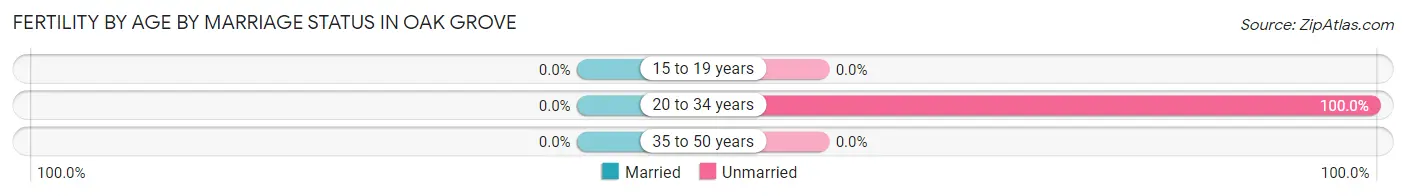
| Age Bracket | Married | Unmarried |
| 15 to 19 years | 0 (0.0%) | 0 (0.0%) |
| 20 to 34 years | 0 (0.0%) | 2 (100.0%) |
| 35 to 50 years | 0 (0.0%) | 0 (0.0%) |
| Total | 0 (0.0%) | 2 (100.0%) |
Fertility by Education in Oak Grove
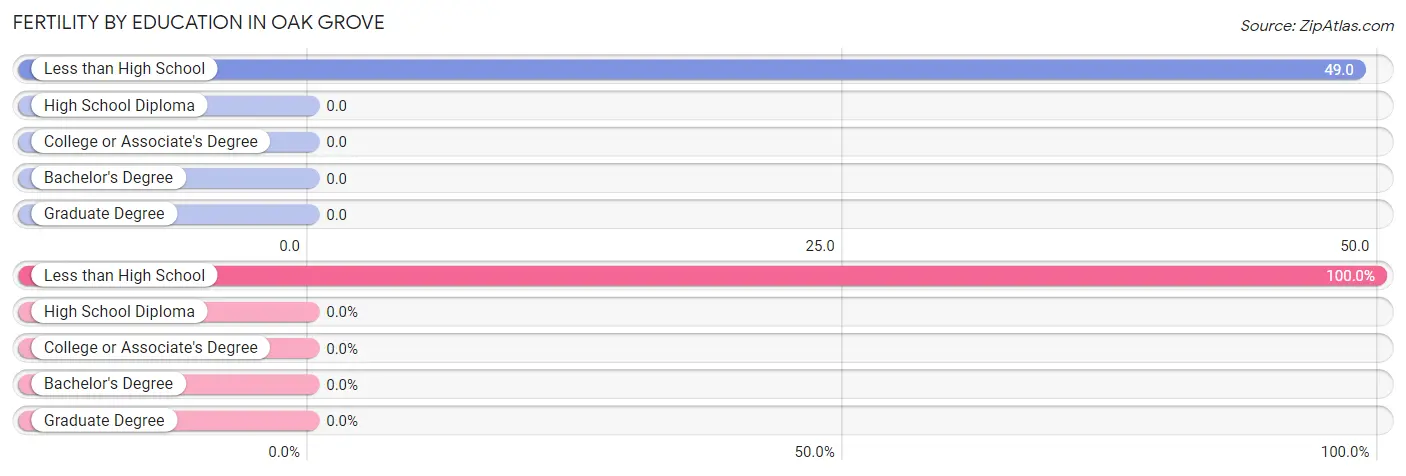
| Educational Attainment | Women with Births | Births / 1,000 Women |
| Less than High School | 2 (100.0%) | 49.0 |
| High School Diploma | 0 (0.0%) | 0.0 |
| College or Associate's Degree | 0 (0.0%) | 0.0 |
| Bachelor's Degree | 0 (0.0%) | 0.0 |
| Graduate Degree | 0 (0.0%) | 0.0 |
| Total | 2 (100.0%) | 12.0 |
Fertility by Education by Marriage Status in Oak Grove
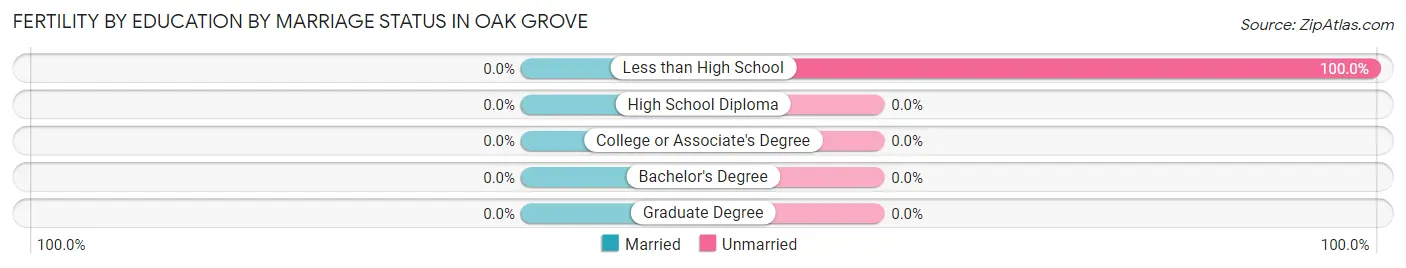
| Educational Attainment | Married | Unmarried |
| Less than High School | 0 (0.0%) | 2 (100.0%) |
| High School Diploma | 0 (0.0%) | 0 (0.0%) |
| College or Associate's Degree | 0 (0.0%) | 0 (0.0%) |
| Bachelor's Degree | 0 (0.0%) | 0 (0.0%) |
| Graduate Degree | 0 (0.0%) | 0 (0.0%) |
| Total | 0 (0.0%) | 2 (100.0%) |
Income in Oak Grove
Income Overview in Oak Grove
Per Capita Income in Oak Grove is $27,801, while median incomes of families and households are $56,296 and $56,311 respectively.
| Characteristic | Number | Measure |
| Per Capita Income | 930 | $27,801 |
| Median Family Income | 291 | $56,296 |
| Mean Family Income | 291 | $65,476 |
| Median Household Income | 376 | $56,311 |
| Mean Household Income | 376 | $65,047 |
| Income Deficit | 291 | $0 |
| Wage / Income Gap (%) | 930 | 0.31% |
| Wage / Income Gap ($) | 930 | 99.69¢ per $1 |
| Gini / Inequality Index | 930 | 0.32 |
Earnings by Sex in Oak Grove
Average Earnings in Oak Grove are $26,414, $26,458 for men and $26,375 for women, a difference of 0.3%.
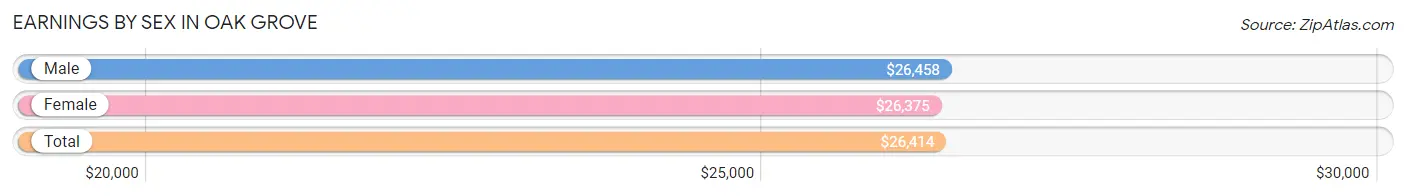
| Sex | Number | Average Earnings |
| Male | 259 (58.2%) | $26,458 |
| Female | 186 (41.8%) | $26,375 |
| Total | 445 (100.0%) | $26,414 |
Earnings by Sex by Income Bracket in Oak Grove
The most common earnings brackets in Oak Grove are $25,000 to $29,999 for men (72 | 27.8%) and $55,000 to $64,999 for women (26 | 14.0%).
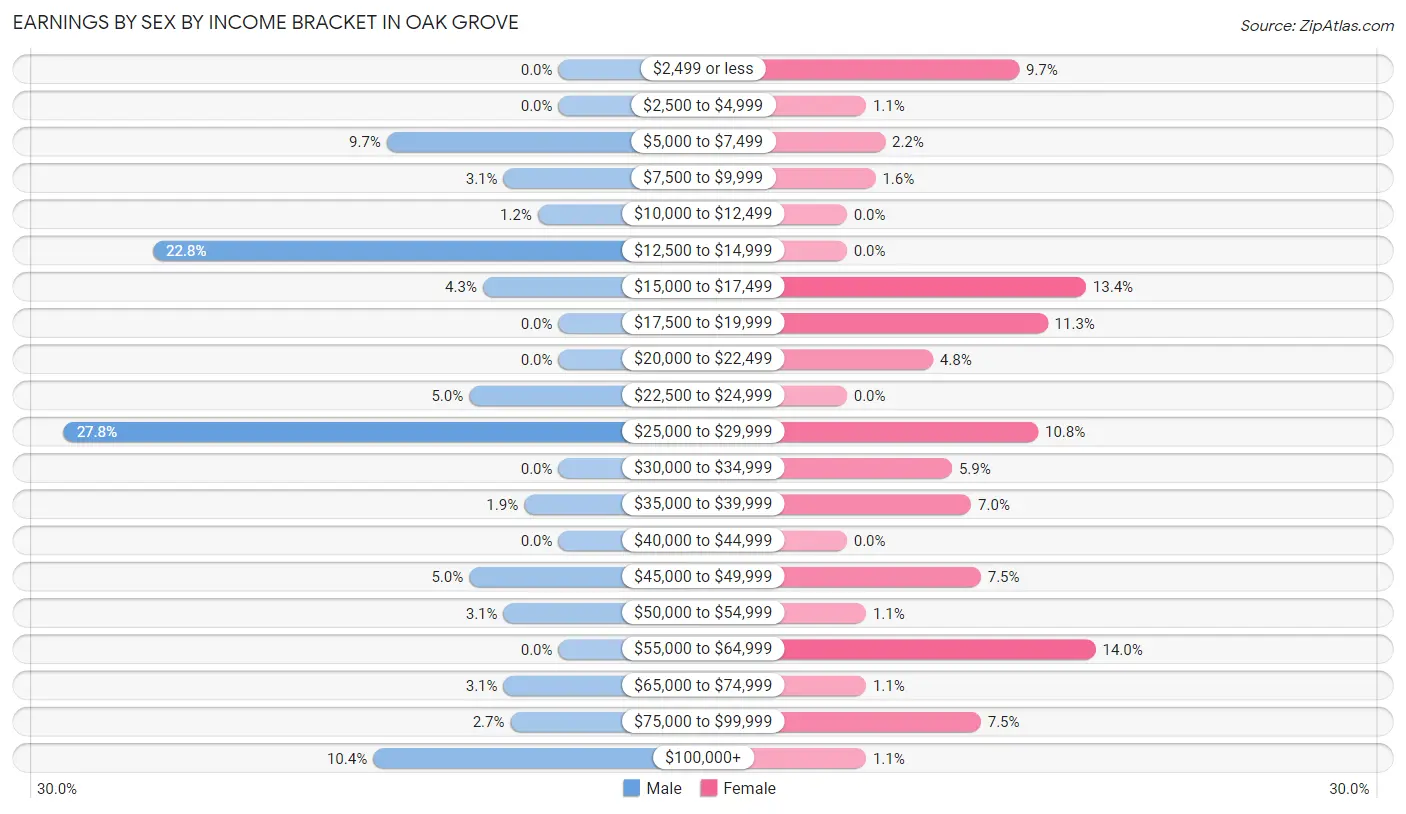
| Income | Male | Female |
| $2,499 or less | 0 (0.0%) | 18 (9.7%) |
| $2,500 to $4,999 | 0 (0.0%) | 2 (1.1%) |
| $5,000 to $7,499 | 25 (9.7%) | 4 (2.1%) |
| $7,500 to $9,999 | 8 (3.1%) | 3 (1.6%) |
| $10,000 to $12,499 | 3 (1.2%) | 0 (0.0%) |
| $12,500 to $14,999 | 59 (22.8%) | 0 (0.0%) |
| $15,000 to $17,499 | 11 (4.3%) | 25 (13.4%) |
| $17,500 to $19,999 | 0 (0.0%) | 21 (11.3%) |
| $20,000 to $22,499 | 0 (0.0%) | 9 (4.8%) |
| $22,500 to $24,999 | 13 (5.0%) | 0 (0.0%) |
| $25,000 to $29,999 | 72 (27.8%) | 20 (10.7%) |
| $30,000 to $34,999 | 0 (0.0%) | 11 (5.9%) |
| $35,000 to $39,999 | 5 (1.9%) | 13 (7.0%) |
| $40,000 to $44,999 | 0 (0.0%) | 0 (0.0%) |
| $45,000 to $49,999 | 13 (5.0%) | 14 (7.5%) |
| $50,000 to $54,999 | 8 (3.1%) | 2 (1.1%) |
| $55,000 to $64,999 | 0 (0.0%) | 26 (14.0%) |
| $65,000 to $74,999 | 8 (3.1%) | 2 (1.1%) |
| $75,000 to $99,999 | 7 (2.7%) | 14 (7.5%) |
| $100,000+ | 27 (10.4%) | 2 (1.1%) |
| Total | 259 (100.0%) | 186 (100.0%) |
Earnings by Sex by Educational Attainment in Oak Grove
Average earnings in Oak Grove are $27,917 for men and $26,750 for women, a difference of 4.2%. Men with an educational attainment of college or associate's degree enjoy the highest average annual earnings of $38,250, while those with college or associate's degree education earn the least with $38,250. Women with an educational attainment of bachelor's degree earn the most with the average annual earnings of $46,696, while those with high school diploma education have the smallest earnings of $21,389.
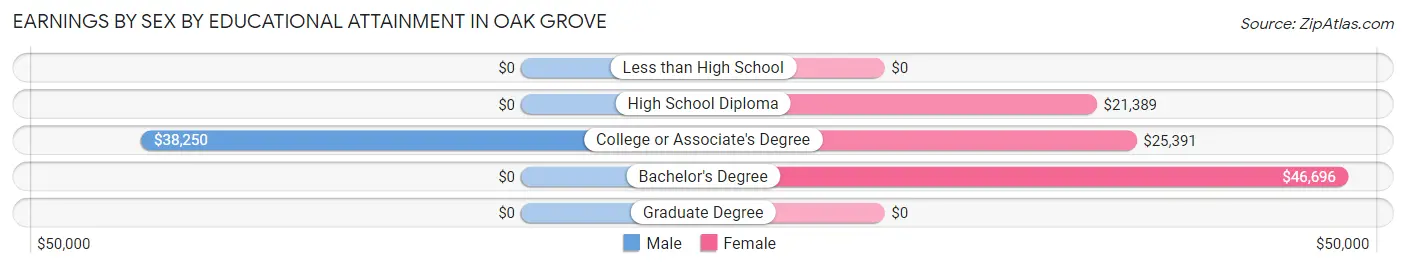
| Educational Attainment | Male Income | Female Income |
| Less than High School | - | - |
| High School Diploma | - | - |
| College or Associate's Degree | $38,250 | $25,391 |
| Bachelor's Degree | - | - |
| Graduate Degree | - | - |
| Total | $27,917 | $26,750 |
Family Income in Oak Grove
Family Income Brackets in Oak Grove
According to the Oak Grove family income data, there are 115 families falling into the $50,000 to $74,999 income range, which is the most common income bracket and makes up 39.5% of all families.
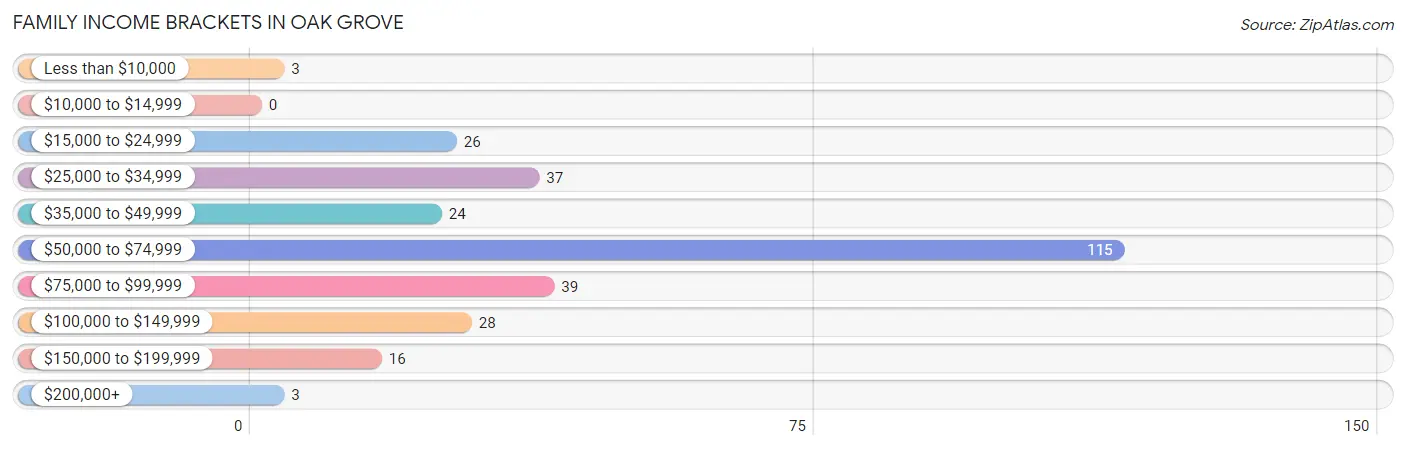
| Income Bracket | # Families | % Families |
| Less than $10,000 | 3 | 1.0% |
| $10,000 to $14,999 | 0 | 0.0% |
| $15,000 to $24,999 | 26 | 8.9% |
| $25,000 to $34,999 | 37 | 12.7% |
| $35,000 to $49,999 | 24 | 8.2% |
| $50,000 to $74,999 | 115 | 39.5% |
| $75,000 to $99,999 | 39 | 13.4% |
| $100,000 to $149,999 | 28 | 9.6% |
| $150,000 to $199,999 | 16 | 5.5% |
| $200,000+ | 3 | 1.0% |
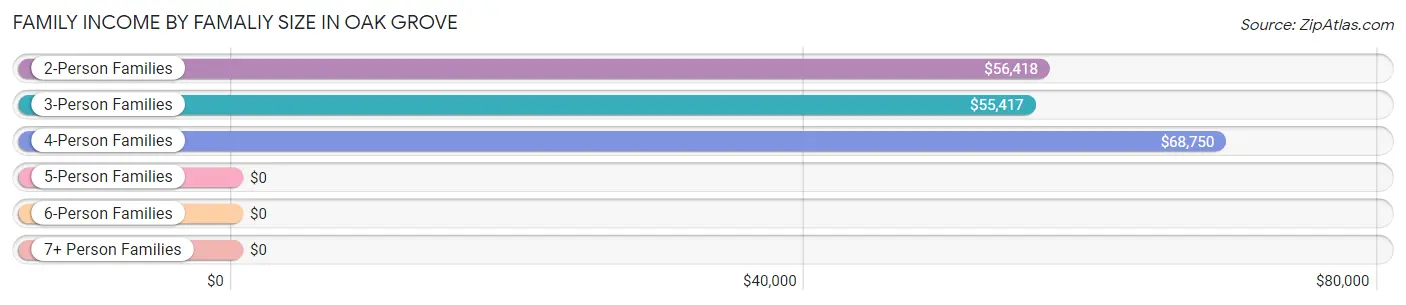
Family Income by Famaliy Size in Oak Grove
4-person families (28 | 9.6%) account for the highest median family income in Oak Grove with $68,750 per family, while 2-person families (184 | 63.2%) have the highest median income of $28,209 per family member.
| Income Bracket | # Families | Median Income |
| 2-Person Families | 184 (63.2%) | $56,418 |
| 3-Person Families | 57 (19.6%) | $55,417 |
| 4-Person Families | 28 (9.6%) | $68,750 |
| 5-Person Families | 1 (0.3%) | $0 |
| 6-Person Families | 21 (7.2%) | $0 |
| 7+ Person Families | 0 (0.0%) | $0 |
| Total | 291 (100.0%) | $56,296 |
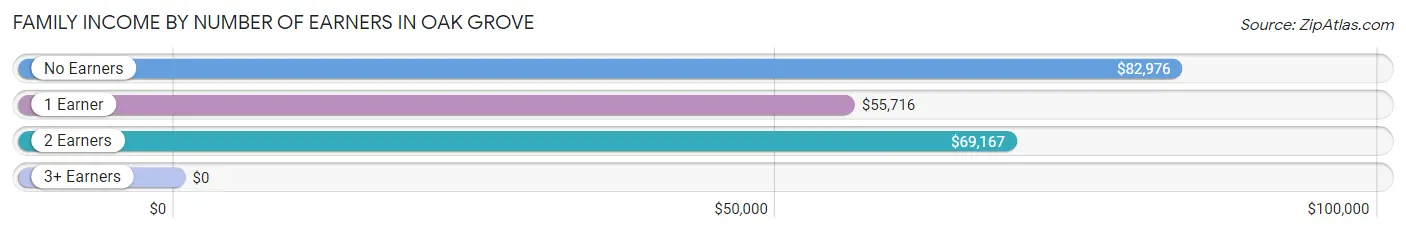
Family Income by Number of Earners in Oak Grove
| Number of Earners | # Families | Median Income |
| No Earners | 68 (23.4%) | $82,976 |
| 1 Earner | 137 (47.1%) | $55,716 |
| 2 Earners | 62 (21.3%) | $69,167 |
| 3+ Earners | 24 (8.3%) | $0 |
| Total | 291 (100.0%) | $56,296 |
Household Income in Oak Grove
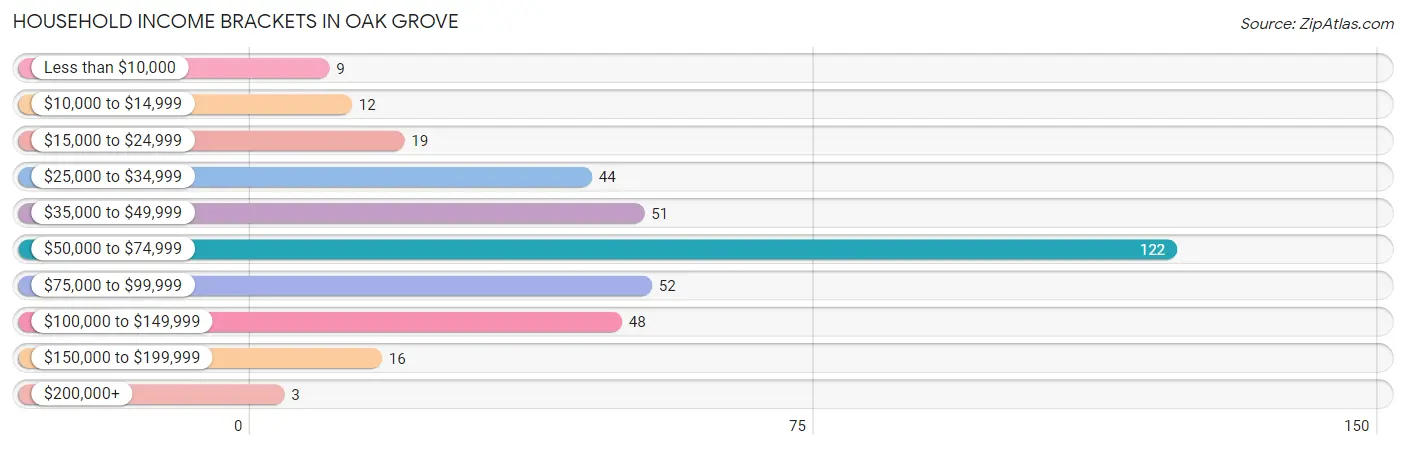
Household Income Brackets in Oak Grove
With 122 households falling in the category, the $50,000 to $74,999 income range is the most frequent in Oak Grove, accounting for 32.5% of all households. In contrast, only 3 households (0.8%) fall into the $200,000+ income bracket, making it the least populous group.
| Income Bracket | # Households | % Households |
| Less than $10,000 | 9 | 2.4% |
| $10,000 to $14,999 | 12 | 3.2% |
| $15,000 to $24,999 | 19 | 5.1% |
| $25,000 to $34,999 | 44 | 11.7% |
| $35,000 to $49,999 | 51 | 13.6% |
| $50,000 to $74,999 | 122 | 32.4% |
| $75,000 to $99,999 | 52 | 13.8% |
| $100,000 to $149,999 | 48 | 12.8% |
| $150,000 to $199,999 | 16 | 4.3% |
| $200,000+ | 3 | 0.8% |
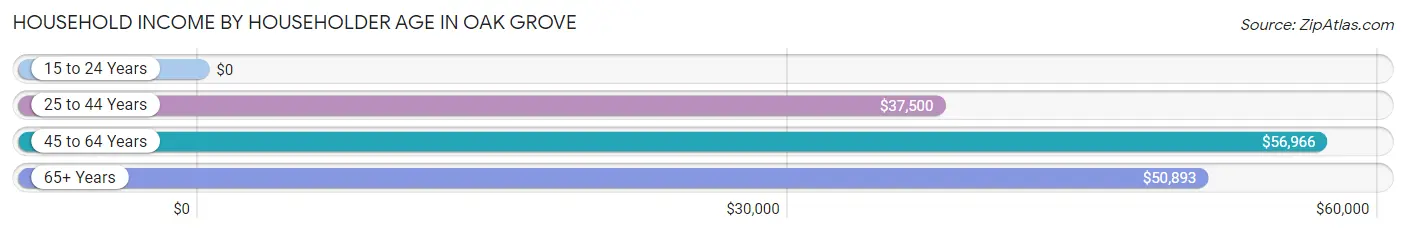
Household Income by Householder Age in Oak Grove
The median household income in Oak Grove is $56,311, with the highest median household income of $56,966 found in the 45 to 64 years age bracket for the primary householder. A total of 205 households (54.5%) fall into this category.
| Income Bracket | # Households | Median Income |
| 15 to 24 Years | 0 (0.0%) | $0 |
| 25 to 44 Years | 34 (9.0%) | $37,500 |
| 45 to 64 Years | 205 (54.5%) | $56,966 |
| 65+ Years | 137 (36.4%) | $50,893 |
| Total | 376 (100.0%) | $56,311 |
Poverty in Oak Grove
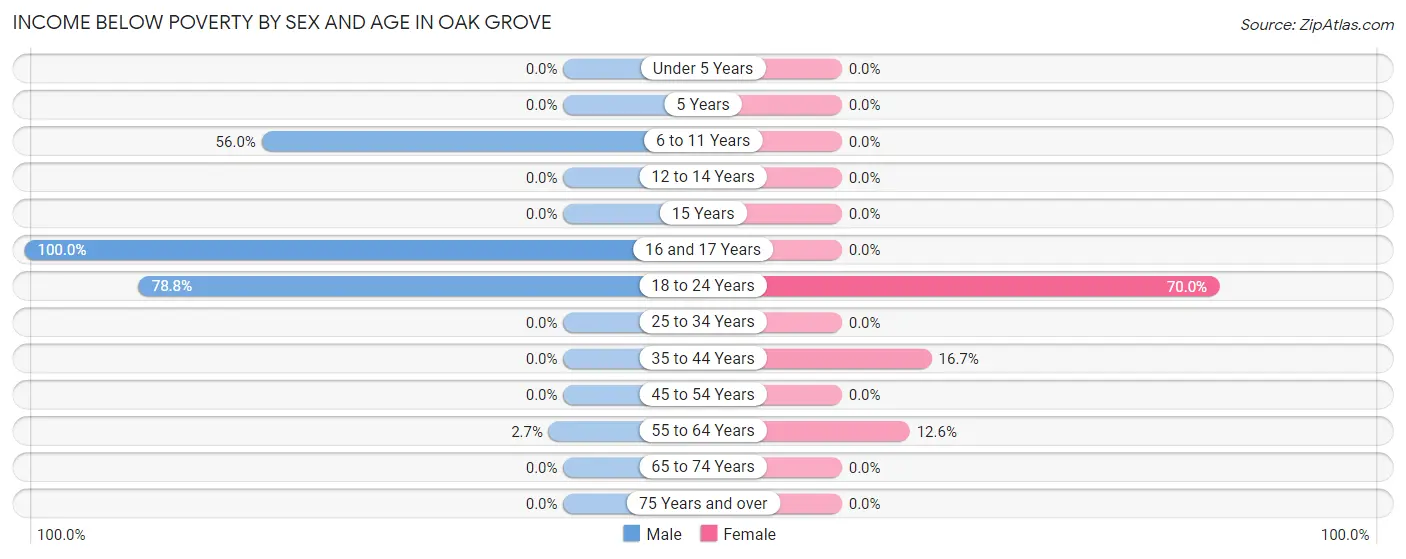
Income Below Poverty by Sex and Age in Oak Grove
With 12.0% poverty level for males and 8.6% for females among the residents of Oak Grove, 16 and 17 year old males and 18 to 24 year old females are the most vulnerable to poverty, with 13 males (100.0%) and 14 females (70.0%) in their respective age groups living below the poverty level.
| Age Bracket | Male | Female |
| Under 5 Years | 0 (0.0%) | 0 (0.0%) |
| 5 Years | 0 (0.0%) | 0 (0.0%) |
| 6 to 11 Years | 14 (56.0%) | 0 (0.0%) |
| 12 to 14 Years | 0 (0.0%) | 0 (0.0%) |
| 15 Years | 0 (0.0%) | 0 (0.0%) |
| 16 and 17 Years | 13 (100.0%) | 0 (0.0%) |
| 18 to 24 Years | 26 (78.8%) | 14 (70.0%) |
| 25 to 34 Years | 0 (0.0%) | 0 (0.0%) |
| 35 to 44 Years | 0 (0.0%) | 12 (16.7%) |
| 45 to 54 Years | 0 (0.0%) | 0 (0.0%) |
| 55 to 64 Years | 3 (2.7%) | 14 (12.6%) |
| 65 to 74 Years | 0 (0.0%) | 0 (0.0%) |
| 75 Years and over | 0 (0.0%) | 0 (0.0%) |
| Total | 56 (12.0%) | 40 (8.6%) |
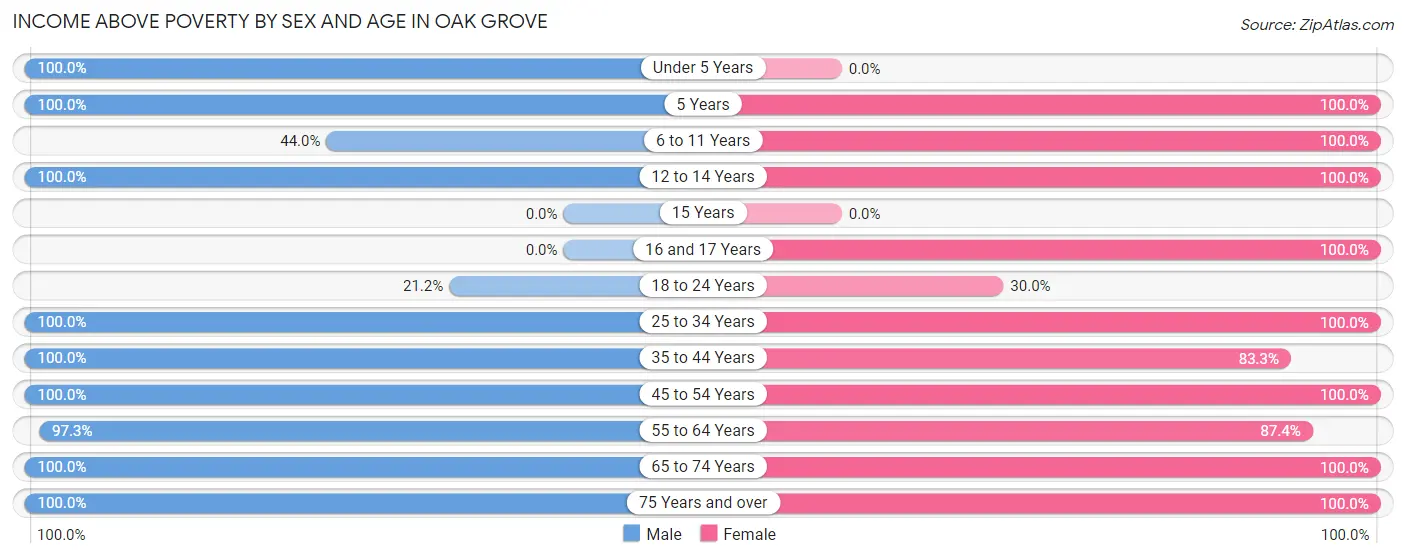
Income Above Poverty by Sex and Age in Oak Grove
According to the poverty statistics in Oak Grove, males aged under 5 years and females aged 5 years are the age groups that are most secure financially, with 100.0% of males and 100.0% of females in these age groups living above the poverty line.
| Age Bracket | Male | Female |
| Under 5 Years | 15 (100.0%) | 0 (0.0%) |
| 5 Years | 9 (100.0%) | 2 (100.0%) |
| 6 to 11 Years | 11 (44.0%) | 51 (100.0%) |
| 12 to 14 Years | 8 (100.0%) | 17 (100.0%) |
| 15 Years | 0 (0.0%) | 0 (0.0%) |
| 16 and 17 Years | 0 (0.0%) | 1 (100.0%) |
| 18 to 24 Years | 7 (21.2%) | 6 (30.0%) |
| 25 to 34 Years | 40 (100.0%) | 30 (100.0%) |
| 35 to 44 Years | 42 (100.0%) | 60 (83.3%) |
| 45 to 54 Years | 53 (100.0%) | 51 (100.0%) |
| 55 to 64 Years | 108 (97.3%) | 97 (87.4%) |
| 65 to 74 Years | 92 (100.0%) | 74 (100.0%) |
| 75 Years and over | 24 (100.0%) | 36 (100.0%) |
| Total | 409 (88.0%) | 425 (91.4%) |
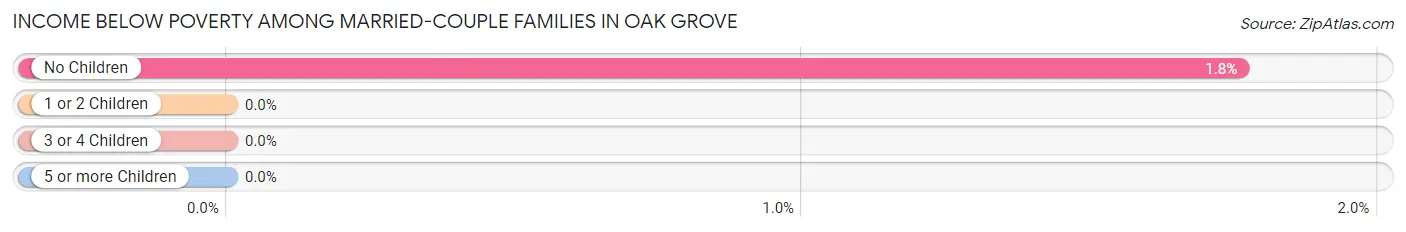
Income Below Poverty Among Married-Couple Families in Oak Grove
The poverty statistics for married-couple families in Oak Grove show that 1.4% or 3 of the total 217 families live below the poverty line. Families with no children have the highest poverty rate of 1.8%, comprising of 3 families. On the other hand, families with 1 or 2 children have the lowest poverty rate of 0.0%, which includes 0 families.
| Children | Above Poverty | Below Poverty |
| No Children | 167 (98.2%) | 3 (1.8%) |
| 1 or 2 Children | 47 (100.0%) | 0 (0.0%) |
| 3 or 4 Children | 0 (0.0%) | 0 (0.0%) |
| 5 or more Children | 0 (0.0%) | 0 (0.0%) |
| Total | 214 (98.6%) | 3 (1.4%) |
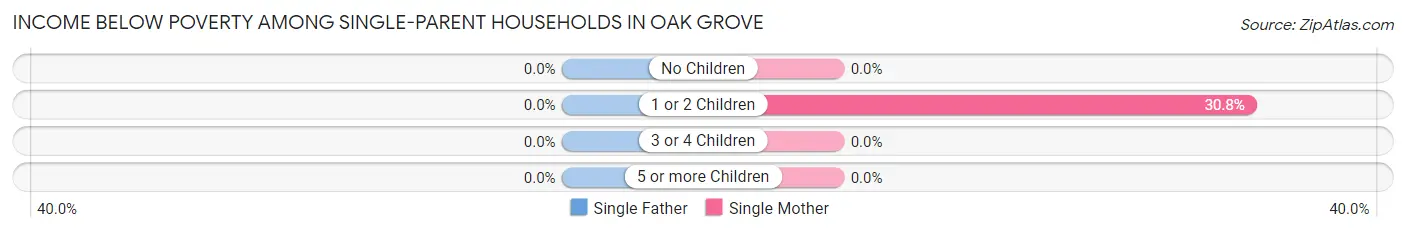
Income Below Poverty Among Single-Parent Households in Oak Grove
| Children | Single Father | Single Mother |
| No Children | 0 (0.0%) | 0 (0.0%) |
| 1 or 2 Children | 0 (0.0%) | 12 (30.8%) |
| 3 or 4 Children | 0 (0.0%) | 0 (0.0%) |
| 5 or more Children | 0 (0.0%) | 0 (0.0%) |
| Total | 0 (0.0%) | 12 (21.4%) |
Income Below Poverty Among Married-Couple vs Single-Parent Households in Oak Grove
The poverty data for Oak Grove shows that 3 of the married-couple family households (1.4%) and 12 of the single-parent households (16.2%) are living below the poverty level. Within the married-couple family households, those with no children have the highest poverty rate, with 3 households (1.8%) falling below the poverty line. Among the single-parent households, those with 1 or 2 children have the highest poverty rate, with 12 household (25.5%) living below poverty.
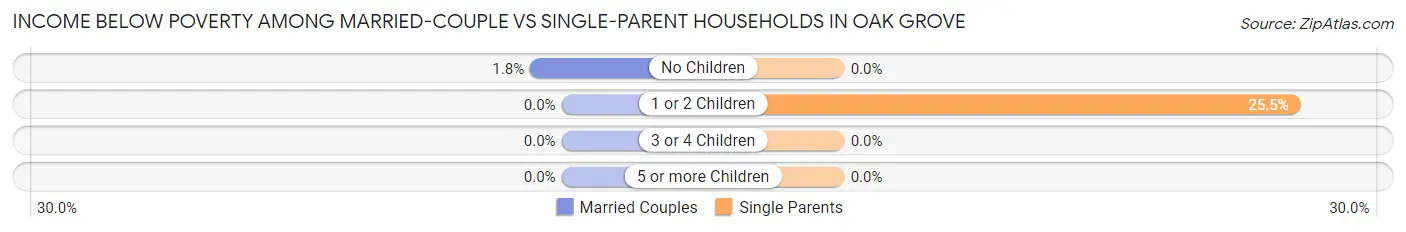
| Children | Married-Couple Families | Single-Parent Households |
| No Children | 3 (1.8%) | 0 (0.0%) |
| 1 or 2 Children | 0 (0.0%) | 12 (25.5%) |
| 3 or 4 Children | 0 (0.0%) | 0 (0.0%) |
| 5 or more Children | 0 (0.0%) | 0 (0.0%) |
| Total | 3 (1.4%) | 12 (16.2%) |
Employment Characteristics in Oak Grove
Employment by Class of Employer in Oak Grove
Among the 402 employed individuals in Oak Grove, private company employees (174 | 43.3%), state government employees (138 | 34.3%), and self-employed (not incorporated) (41 | 10.2%) make up the most common classes of employment.
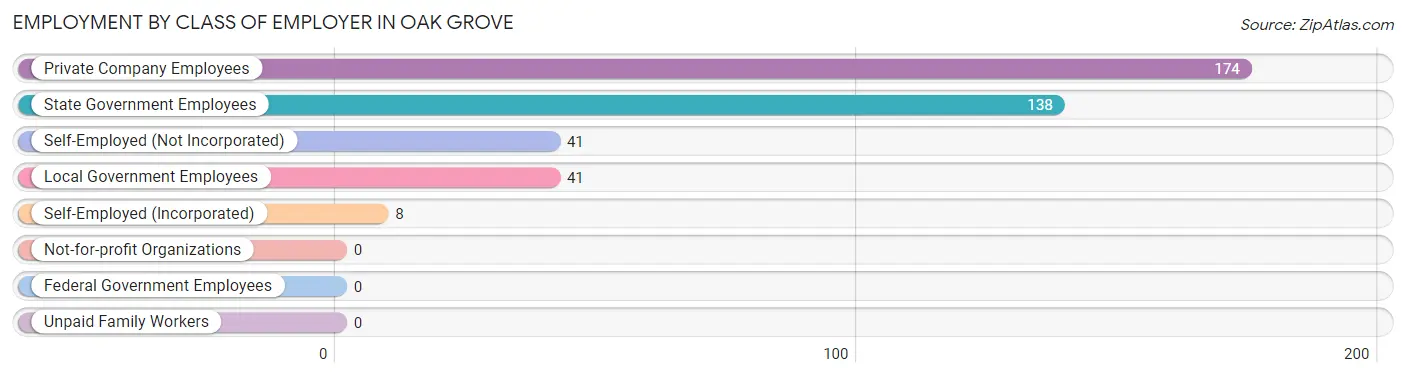
| Employer Class | # Employees | % Employees |
| Private Company Employees | 174 | 43.3% |
| Self-Employed (Incorporated) | 8 | 2.0% |
| Self-Employed (Not Incorporated) | 41 | 10.2% |
| Not-for-profit Organizations | 0 | 0.0% |
| Local Government Employees | 41 | 10.2% |
| State Government Employees | 138 | 34.3% |
| Federal Government Employees | 0 | 0.0% |
| Unpaid Family Workers | 0 | 0.0% |
| Total | 402 | 100.0% |
Employment Status by Age in Oak Grove
According to the labor force statistics for Oak Grove, out of the total population over 16 years of age (803), 54.3% or 436 individuals are in the labor force, with 4.6% or 20 of them unemployed. The age group with the highest labor force participation rate is 20 to 24 years, with 100.0% or 32 individuals in the labor force. Within the labor force, the 30 to 34 years age range has the highest percentage of unemployed individuals, with 46.7% or 7 of them being unemployed.
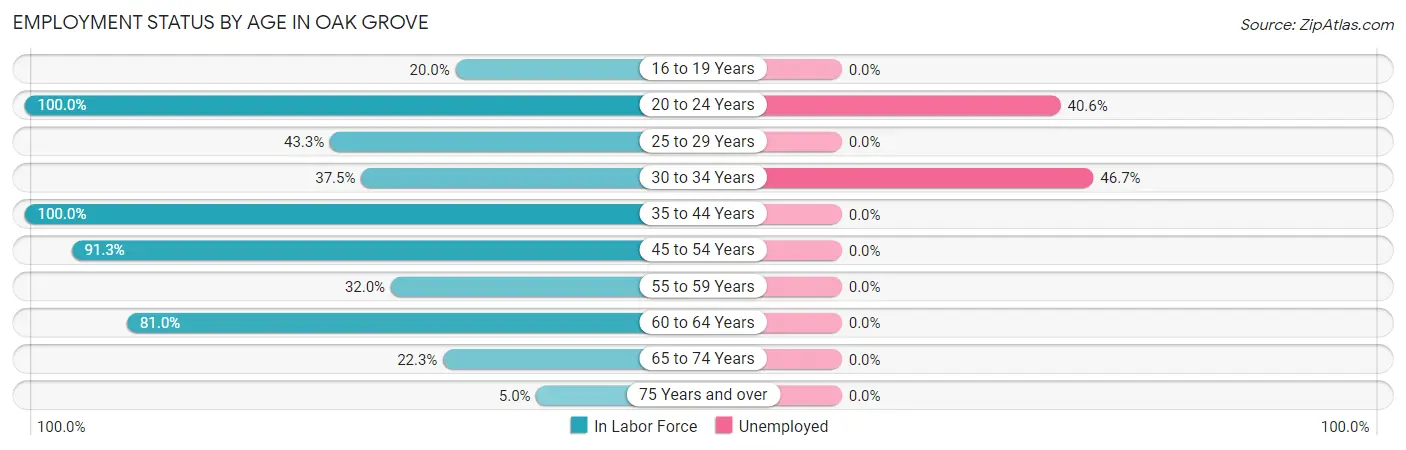
| Age Bracket | In Labor Force | Unemployed |
| 16 to 19 Years | 7 (20.0%) | 0 (0.0%) |
| 20 to 24 Years | 32 (100.0%) | 13 (40.6%) |
| 25 to 29 Years | 13 (43.3%) | 0 (0.0%) |
| 30 to 34 Years | 15 (37.5%) | 7 (46.7%) |
| 35 to 44 Years | 114 (100.0%) | 0 (0.0%) |
| 45 to 54 Years | 95 (91.3%) | 0 (0.0%) |
| 55 to 59 Years | 39 (32.0%) | 0 (0.0%) |
| 60 to 64 Years | 81 (81.0%) | 0 (0.0%) |
| 65 to 74 Years | 37 (22.3%) | 0 (0.0%) |
| 75 Years and over | 3 (5.0%) | 0 (0.0%) |
| Total | 436 (54.3%) | 20 (4.6%) |
Employment Status by Educational Attainment in Oak Grove
According to labor force statistics for Oak Grove, 70.0% of individuals (357) out of the total population between 25 and 64 years of age (510) are in the labor force, with 2.0% or 7 of them being unemployed. The group with the highest labor force participation rate are those with the educational attainment of bachelor's degree or higher, with 88.7% or 94 individuals in the labor force. Within the labor force, individuals with college / associate degree education have the highest percentage of unemployment, with 5.0% or 7 of them being unemployed.
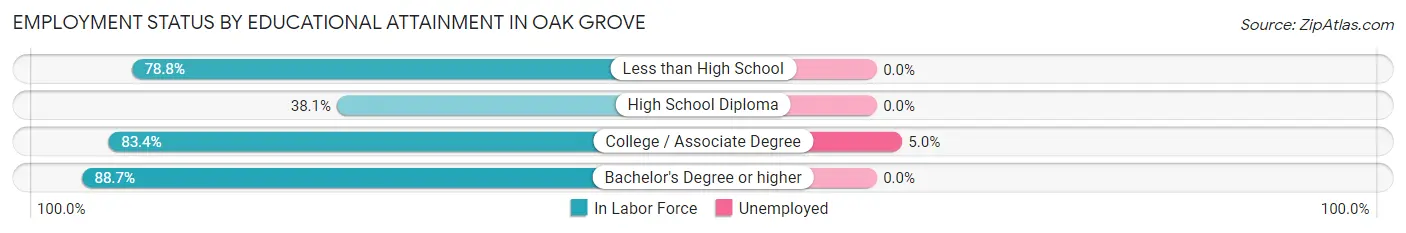
| Educational Attainment | In Labor Force | Unemployed |
| Less than High School | 63 (78.8%) | 0 (0.0%) |
| High School Diploma | 59 (38.1%) | 0 (0.0%) |
| College / Associate Degree | 141 (83.4%) | 8 (5.0%) |
| Bachelor's Degree or higher | 94 (88.7%) | 0 (0.0%) |
| Total | 357 (70.0%) | 10 (2.0%) |
Employment Occupations by Sex in Oak Grove
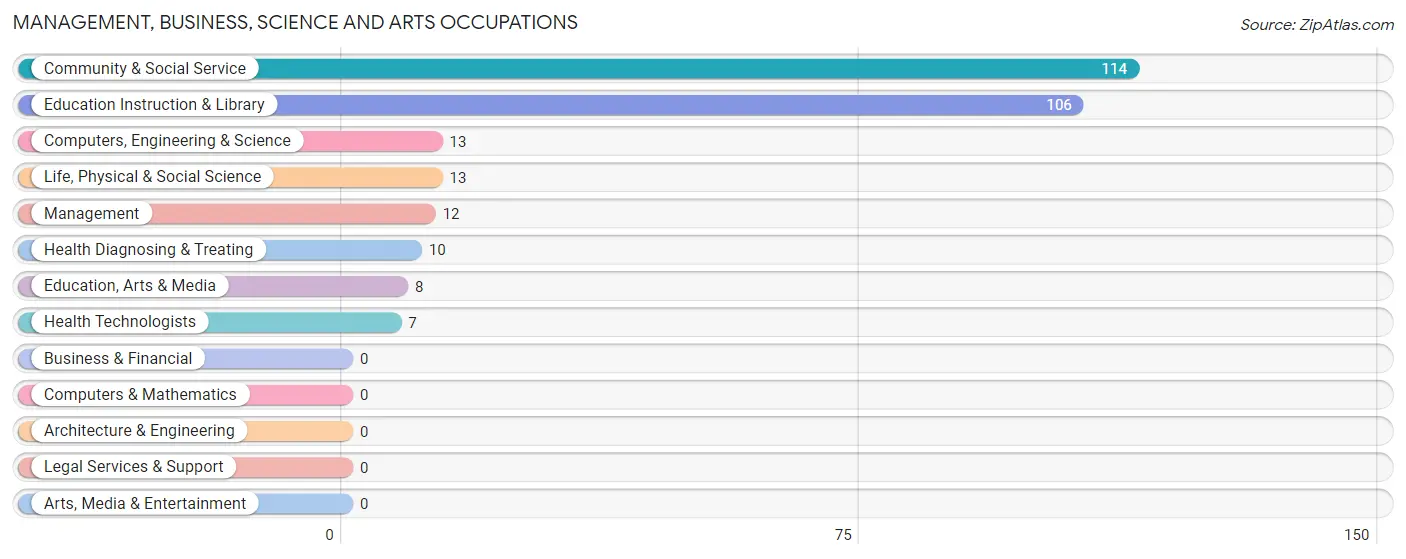
Management, Business, Science and Arts Occupations
The most common Management, Business, Science and Arts occupations in Oak Grove are Community & Social Service (114 | 27.4%), Education Instruction & Library (106 | 25.5%), Computers, Engineering & Science (13 | 3.1%), Life, Physical & Social Science (13 | 3.1%), and Management (12 | 2.9%).
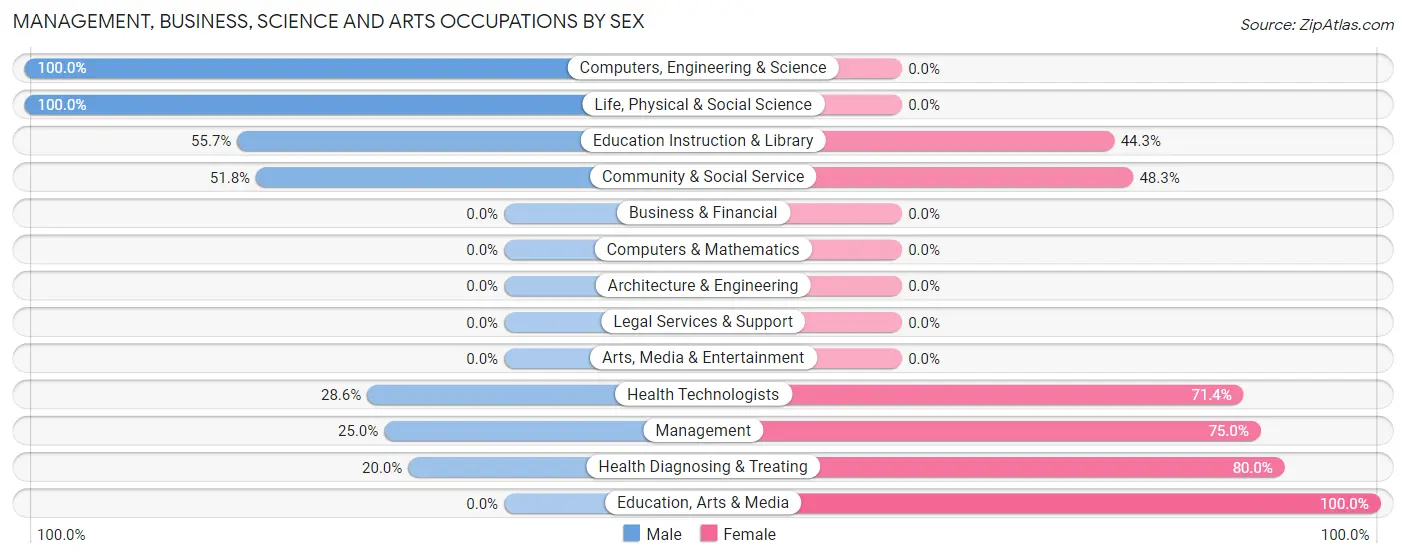
Management, Business, Science and Arts Occupations by Sex
Within the Management, Business, Science and Arts occupations in Oak Grove, the most male-oriented occupations are Computers, Engineering & Science (100.0%), Life, Physical & Social Science (100.0%), and Education Instruction & Library (55.7%), while the most female-oriented occupations are Education, Arts & Media (100.0%), Health Diagnosing & Treating (80.0%), and Management (75.0%).
| Occupation | Male | Female |
| Management | 3 (25.0%) | 9 (75.0%) |
| Business & Financial | 0 (0.0%) | 0 (0.0%) |
| Computers, Engineering & Science | 13 (100.0%) | 0 (0.0%) |
| Computers & Mathematics | 0 (0.0%) | 0 (0.0%) |
| Architecture & Engineering | 0 (0.0%) | 0 (0.0%) |
| Life, Physical & Social Science | 13 (100.0%) | 0 (0.0%) |
| Community & Social Service | 59 (51.7%) | 55 (48.2%) |
| Education, Arts & Media | 0 (0.0%) | 8 (100.0%) |
| Legal Services & Support | 0 (0.0%) | 0 (0.0%) |
| Education Instruction & Library | 59 (55.7%) | 47 (44.3%) |
| Arts, Media & Entertainment | 0 (0.0%) | 0 (0.0%) |
| Health Diagnosing & Treating | 2 (20.0%) | 8 (80.0%) |
| Health Technologists | 2 (28.6%) | 5 (71.4%) |
| Total (Category) | 77 (51.7%) | 72 (48.3%) |
| Total (Overall) | 236 (56.7%) | 180 (43.3%) |
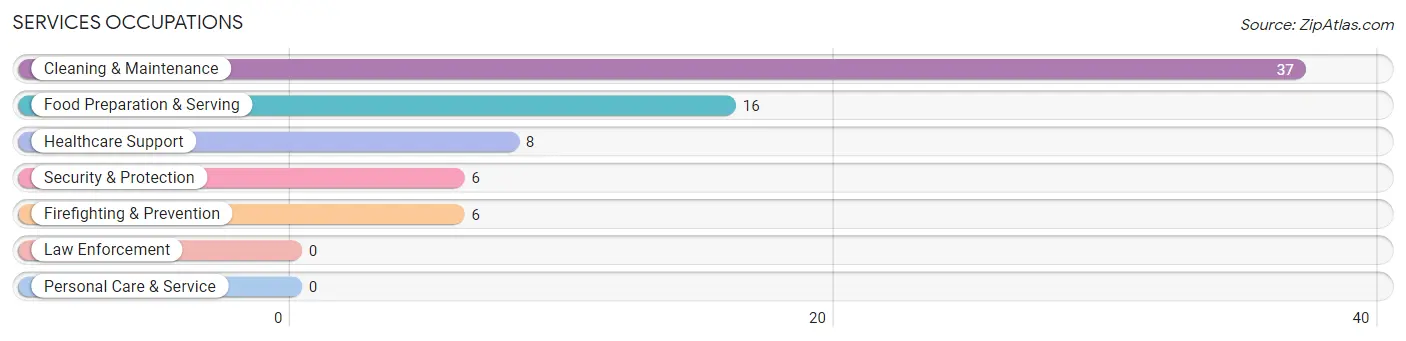
Services Occupations
The most common Services occupations in Oak Grove are Cleaning & Maintenance (37 | 8.9%), Food Preparation & Serving (16 | 3.8%), Healthcare Support (8 | 1.9%), Security & Protection (6 | 1.4%), and Firefighting & Prevention (6 | 1.4%).
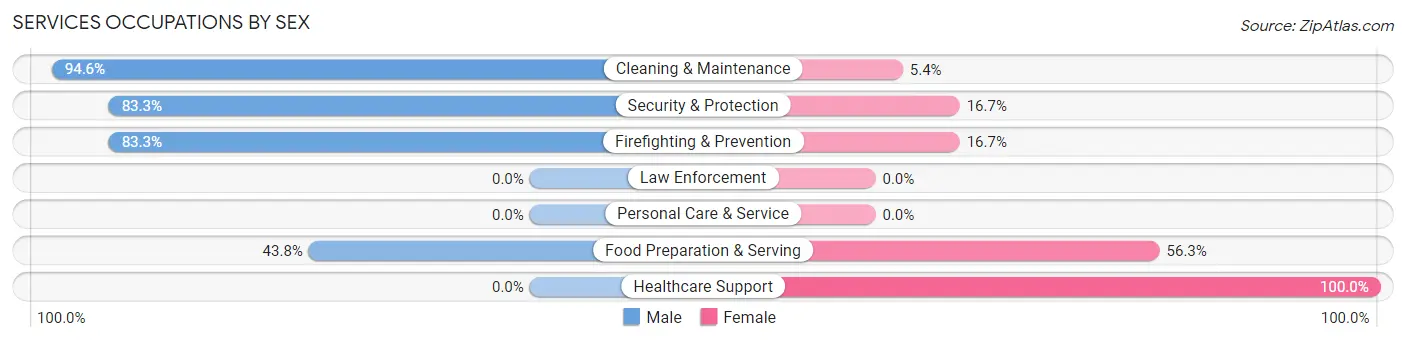
Services Occupations by Sex
Within the Services occupations in Oak Grove, the most male-oriented occupations are Cleaning & Maintenance (94.6%), Security & Protection (83.3%), and Firefighting & Prevention (83.3%), while the most female-oriented occupations are Healthcare Support (100.0%), Food Preparation & Serving (56.2%), and Security & Protection (16.7%).
| Occupation | Male | Female |
| Healthcare Support | 0 (0.0%) | 8 (100.0%) |
| Security & Protection | 5 (83.3%) | 1 (16.7%) |
| Firefighting & Prevention | 5 (83.3%) | 1 (16.7%) |
| Law Enforcement | 0 (0.0%) | 0 (0.0%) |
| Food Preparation & Serving | 7 (43.8%) | 9 (56.2%) |
| Cleaning & Maintenance | 35 (94.6%) | 2 (5.4%) |
| Personal Care & Service | 0 (0.0%) | 0 (0.0%) |
| Total (Category) | 47 (70.2%) | 20 (29.8%) |
| Total (Overall) | 236 (56.7%) | 180 (43.3%) |
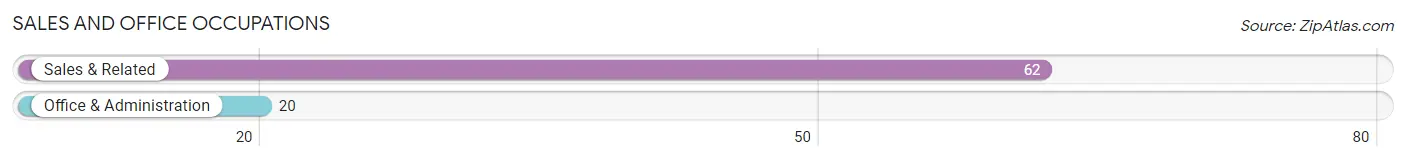
Sales and Office Occupations
The most common Sales and Office occupations in Oak Grove are Sales & Related (62 | 14.9%), and Office & Administration (20 | 4.8%).
Sales and Office Occupations by Sex

| Occupation | Male | Female |
| Sales & Related | 35 (56.5%) | 27 (43.5%) |
| Office & Administration | 0 (0.0%) | 20 (100.0%) |
| Total (Category) | 35 (42.7%) | 47 (57.3%) |
| Total (Overall) | 236 (56.7%) | 180 (43.3%) |
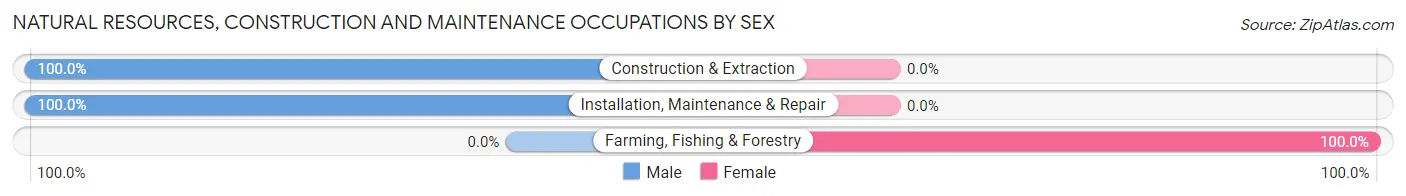
Natural Resources, Construction and Maintenance Occupations
The most common Natural Resources, Construction and Maintenance occupations in Oak Grove are Installation, Maintenance & Repair (27 | 6.5%), Construction & Extraction (12 | 2.9%), and Farming, Fishing & Forestry (4 | 1.0%).

Natural Resources, Construction and Maintenance Occupations by Sex
| Occupation | Male | Female |
| Farming, Fishing & Forestry | 0 (0.0%) | 4 (100.0%) |
| Construction & Extraction | 12 (100.0%) | 0 (0.0%) |
| Installation, Maintenance & Repair | 27 (100.0%) | 0 (0.0%) |
| Total (Category) | 39 (90.7%) | 4 (9.3%) |
| Total (Overall) | 236 (56.7%) | 180 (43.3%) |
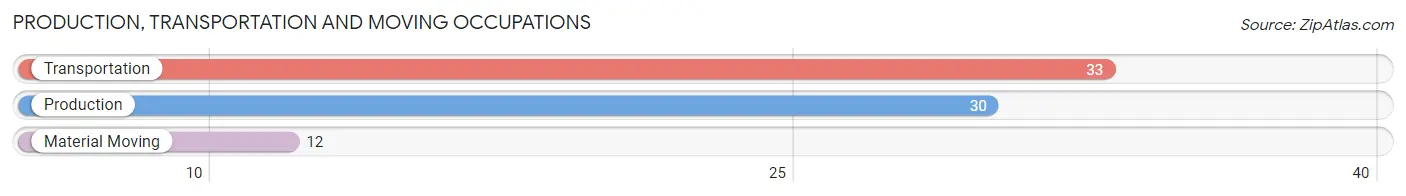
Production, Transportation and Moving Occupations
The most common Production, Transportation and Moving occupations in Oak Grove are Transportation (33 | 7.9%), Production (30 | 7.2%), and Material Moving (12 | 2.9%).
Production, Transportation and Moving Occupations by Sex

| Occupation | Male | Female |
| Production | 15 (50.0%) | 15 (50.0%) |
| Transportation | 20 (60.6%) | 13 (39.4%) |
| Material Moving | 3 (25.0%) | 9 (75.0%) |
| Total (Category) | 38 (50.7%) | 37 (49.3%) |
| Total (Overall) | 236 (56.7%) | 180 (43.3%) |
Employment Industries by Sex in Oak Grove
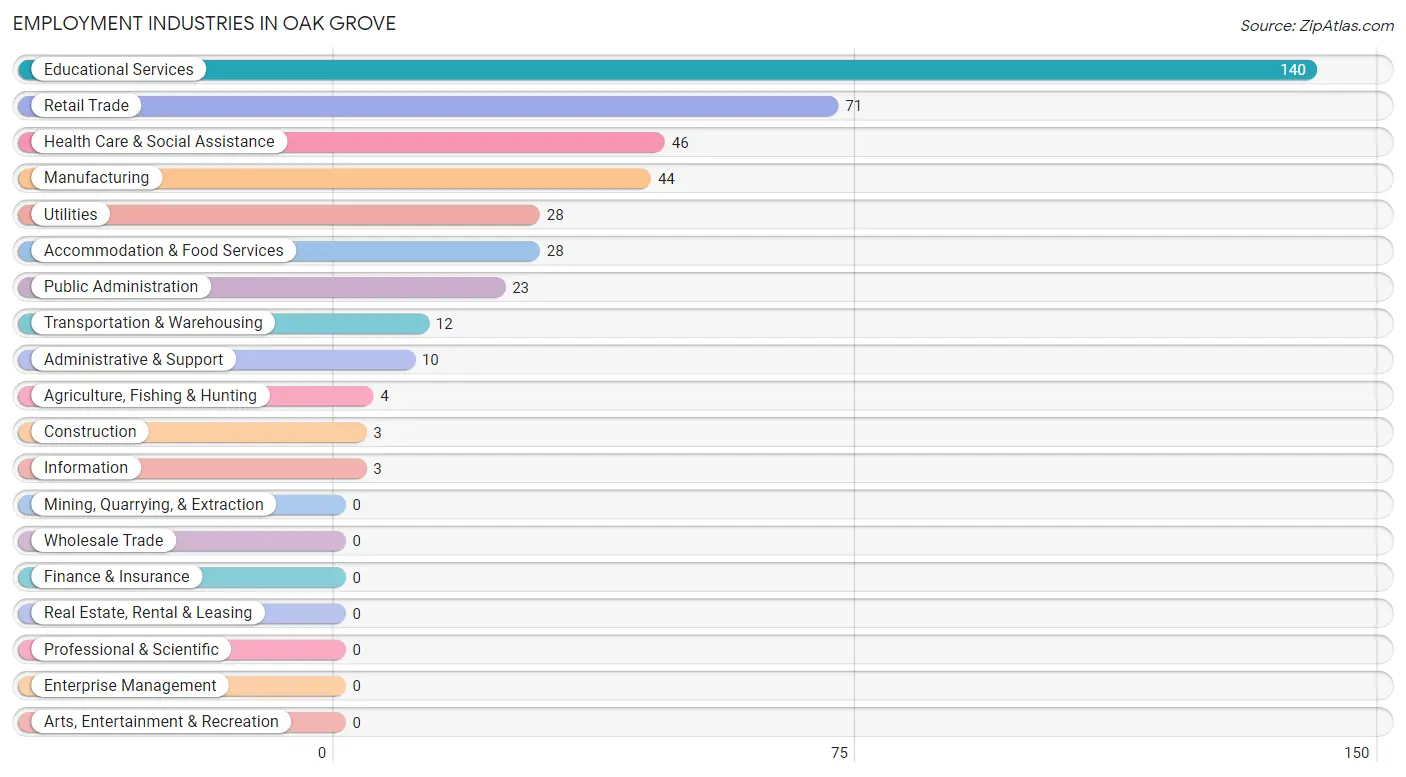
Employment Industries in Oak Grove
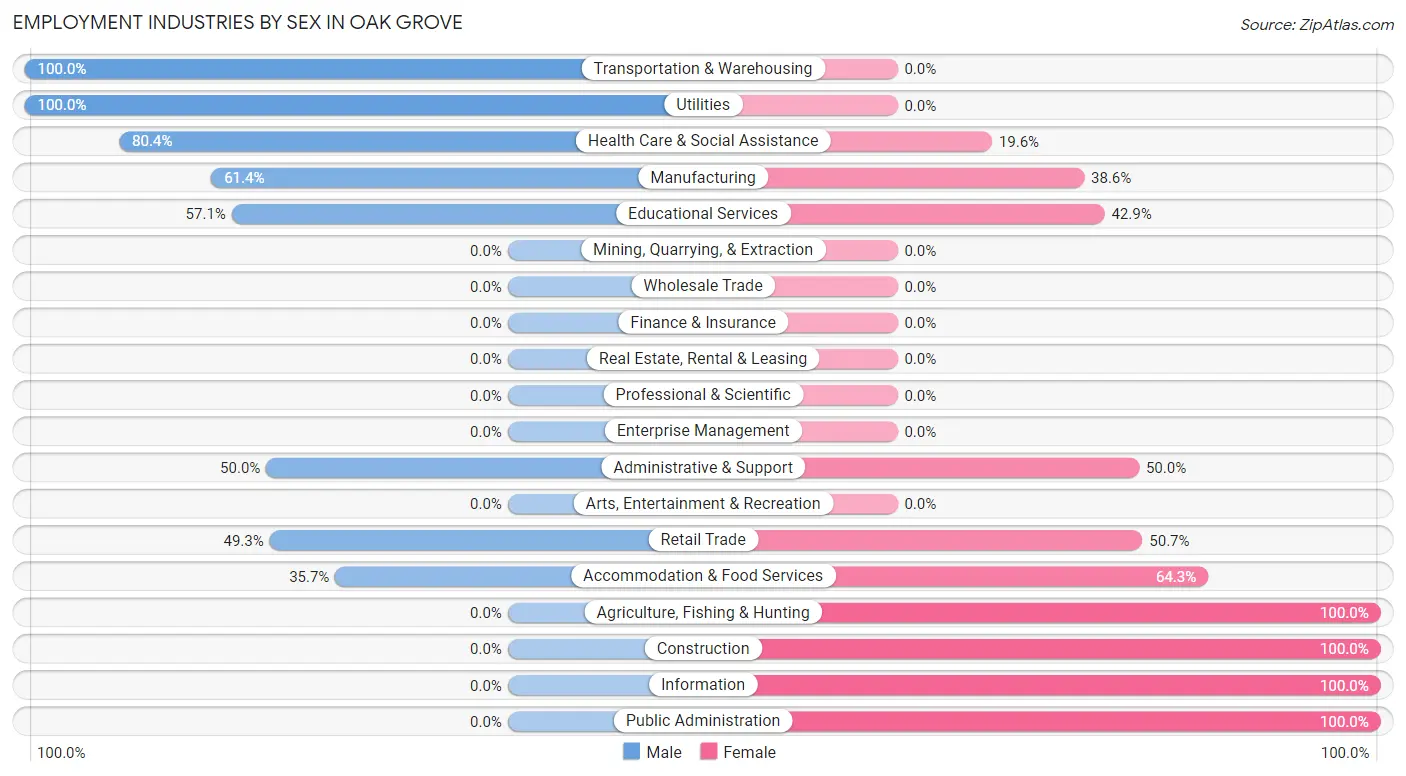
The major employment industries in Oak Grove include Educational Services (140 | 33.7%), Retail Trade (71 | 17.1%), Health Care & Social Assistance (46 | 11.1%), Manufacturing (44 | 10.6%), and Utilities (28 | 6.7%).
Employment Industries by Sex in Oak Grove
The Oak Grove industries that see more men than women are Transportation & Warehousing (100.0%), Utilities (100.0%), and Health Care & Social Assistance (80.4%), whereas the industries that tend to have a higher number of women are Agriculture, Fishing & Hunting (100.0%), Construction (100.0%), and Information (100.0%).
| Industry | Male | Female |
| Agriculture, Fishing & Hunting | 0 (0.0%) | 4 (100.0%) |
| Mining, Quarrying, & Extraction | 0 (0.0%) | 0 (0.0%) |
| Construction | 0 (0.0%) | 3 (100.0%) |
| Manufacturing | 27 (61.4%) | 17 (38.6%) |
| Wholesale Trade | 0 (0.0%) | 0 (0.0%) |
| Retail Trade | 35 (49.3%) | 36 (50.7%) |
| Transportation & Warehousing | 12 (100.0%) | 0 (0.0%) |
| Utilities | 28 (100.0%) | 0 (0.0%) |
| Information | 0 (0.0%) | 3 (100.0%) |
| Finance & Insurance | 0 (0.0%) | 0 (0.0%) |
| Real Estate, Rental & Leasing | 0 (0.0%) | 0 (0.0%) |
| Professional & Scientific | 0 (0.0%) | 0 (0.0%) |
| Enterprise Management | 0 (0.0%) | 0 (0.0%) |
| Administrative & Support | 5 (50.0%) | 5 (50.0%) |
| Educational Services | 80 (57.1%) | 60 (42.9%) |
| Health Care & Social Assistance | 37 (80.4%) | 9 (19.6%) |
| Arts, Entertainment & Recreation | 0 (0.0%) | 0 (0.0%) |
| Accommodation & Food Services | 10 (35.7%) | 18 (64.3%) |
| Public Administration | 0 (0.0%) | 23 (100.0%) |
| Total | 236 (56.7%) | 180 (43.3%) |
Education in Oak Grove
School Enrollment in Oak Grove
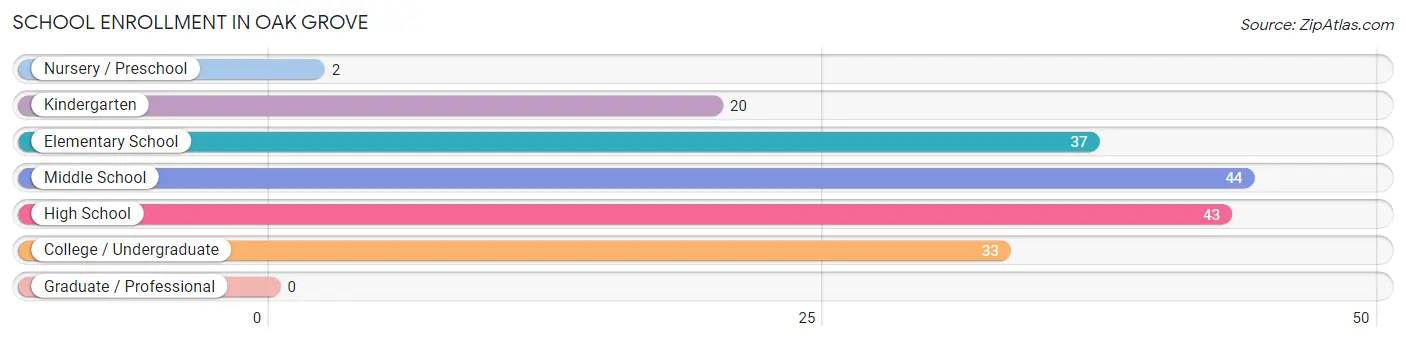
The most common levels of schooling among the 179 students in Oak Grove are middle school (44 | 24.6%), high school (43 | 24.0%), and elementary school (37 | 20.7%).
| School Level | # Students | % Students |
| Nursery / Preschool | 2 | 1.1% |
| Kindergarten | 20 | 11.2% |
| Elementary School | 37 | 20.7% |
| Middle School | 44 | 24.6% |
| High School | 43 | 24.0% |
| College / Undergraduate | 33 | 18.4% |
| Graduate / Professional | 0 | 0.0% |
| Total | 179 | 100.0% |
School Enrollment by Age by Funding Source in Oak Grove
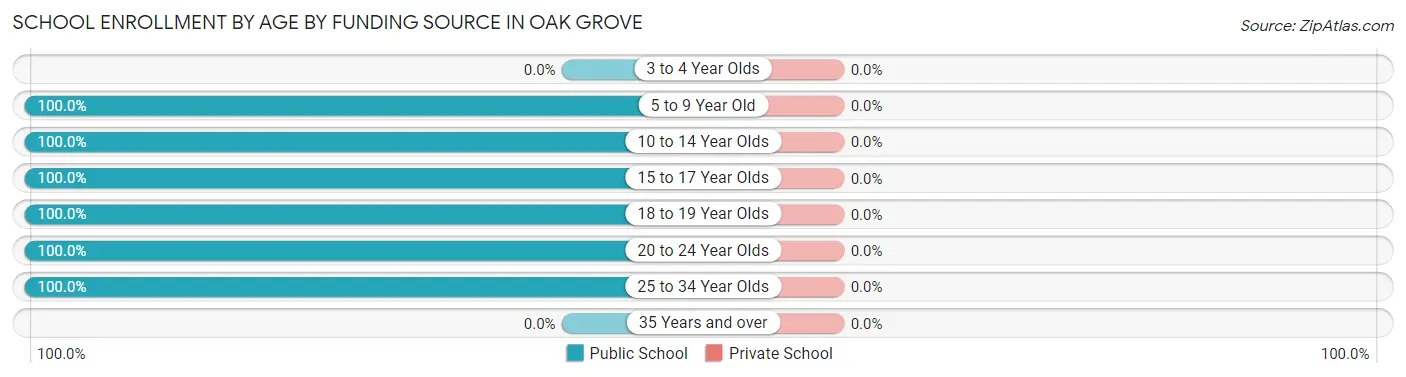
| Age Bracket | Public School | Private School |
| 3 to 4 Year Olds | 0 (0.0%) | 0 (0.0%) |
| 5 to 9 Year Old | 41 (100.0%) | 0 (0.0%) |
| 10 to 14 Year Olds | 70 (100.0%) | 0 (0.0%) |
| 15 to 17 Year Olds | 14 (100.0%) | 0 (0.0%) |
| 18 to 19 Year Olds | 21 (100.0%) | 0 (0.0%) |
| 20 to 24 Year Olds | 30 (100.0%) | 0 (0.0%) |
| 25 to 34 Year Olds | 3 (100.0%) | 0 (0.0%) |
| 35 Years and over | 0 (0.0%) | 0 (0.0%) |
| Total | 179 (100.0%) | 0 (0.0%) |
Educational Attainment by Field of Study in Oak Grove
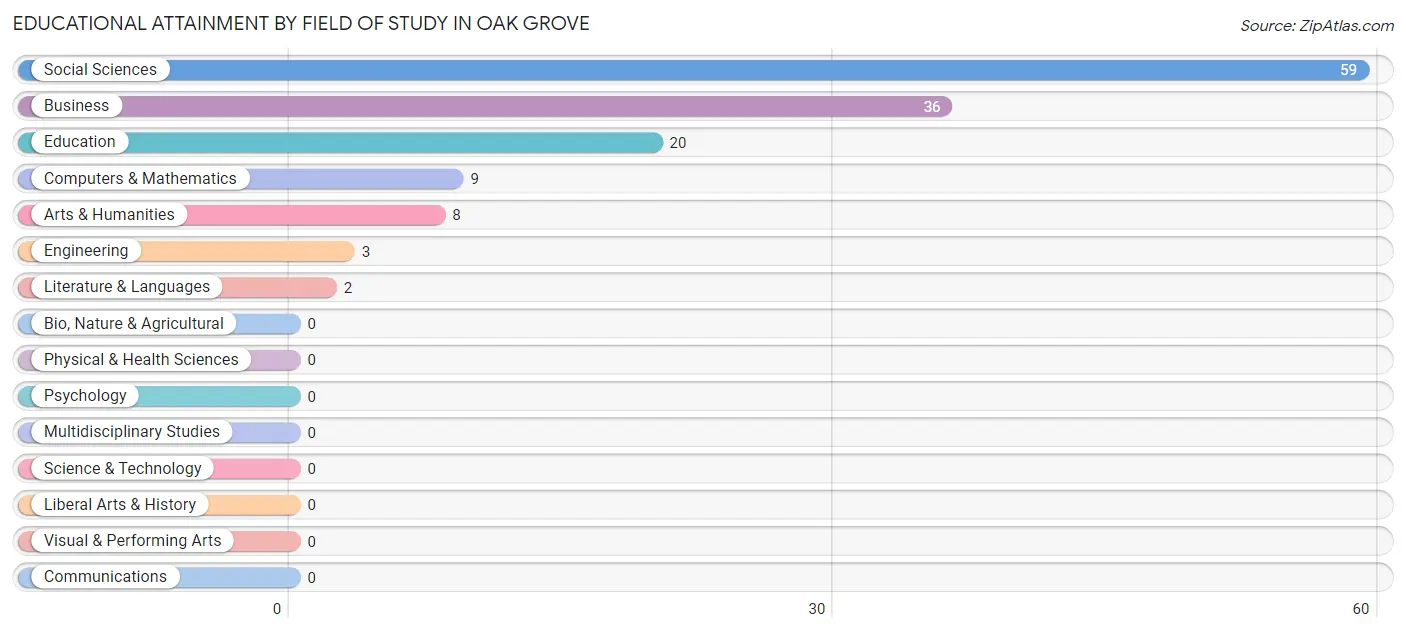
Social sciences (59 | 43.1%), business (36 | 26.3%), education (20 | 14.6%), computers & mathematics (9 | 6.6%), and arts & humanities (8 | 5.8%) are the most common fields of study among 137 individuals in Oak Grove who have obtained a bachelor's degree or higher.
| Field of Study | # Graduates | % Graduates |
| Computers & Mathematics | 9 | 6.6% |
| Bio, Nature & Agricultural | 0 | 0.0% |
| Physical & Health Sciences | 0 | 0.0% |
| Psychology | 0 | 0.0% |
| Social Sciences | 59 | 43.1% |
| Engineering | 3 | 2.2% |
| Multidisciplinary Studies | 0 | 0.0% |
| Science & Technology | 0 | 0.0% |
| Business | 36 | 26.3% |
| Education | 20 | 14.6% |
| Literature & Languages | 2 | 1.5% |
| Liberal Arts & History | 0 | 0.0% |
| Visual & Performing Arts | 0 | 0.0% |
| Communications | 0 | 0.0% |
| Arts & Humanities | 8 | 5.8% |
| Total | 137 | 100.0% |
Transportation & Commute in Oak Grove
Vehicle Availability by Sex in Oak Grove
The most prevalent vehicle ownership categories in Oak Grove are males with 3 vehicles (78, accounting for 33.1%) and females with 3 vehicles (23, making up 47.0%).
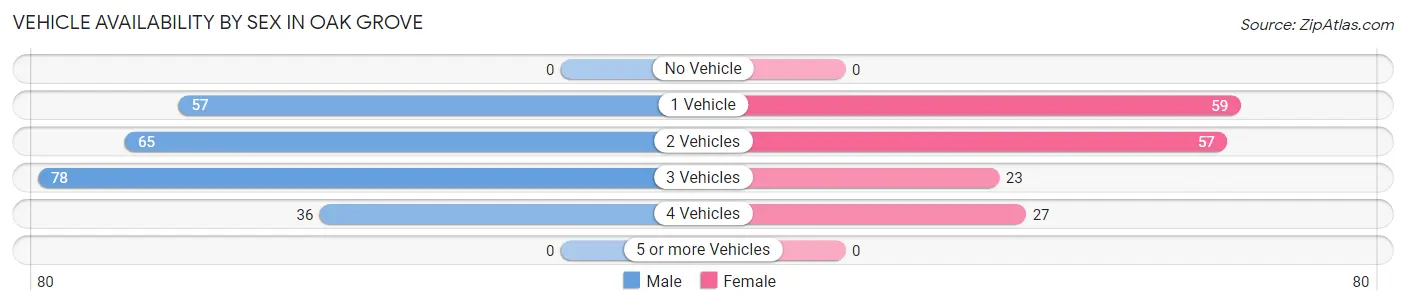
| Vehicles Available | Male | Female |
| No Vehicle | 0 (0.0%) | 0 (0.0%) |
| 1 Vehicle | 57 (24.1%) | 59 (35.5%) |
| 2 Vehicles | 65 (27.5%) | 57 (34.3%) |
| 3 Vehicles | 78 (33.1%) | 23 (13.9%) |
| 4 Vehicles | 36 (15.2%) | 27 (16.3%) |
| 5 or more Vehicles | 0 (0.0%) | 0 (0.0%) |
| Total | 236 (100.0%) | 166 (100.0%) |
Commute Time in Oak Grove
The most frequently occuring commute durations in Oak Grove are 15 to 19 minutes (116 commuters, 28.9%), 10 to 14 minutes (111 commuters, 27.6%), and 5 to 9 minutes (67 commuters, 16.7%).
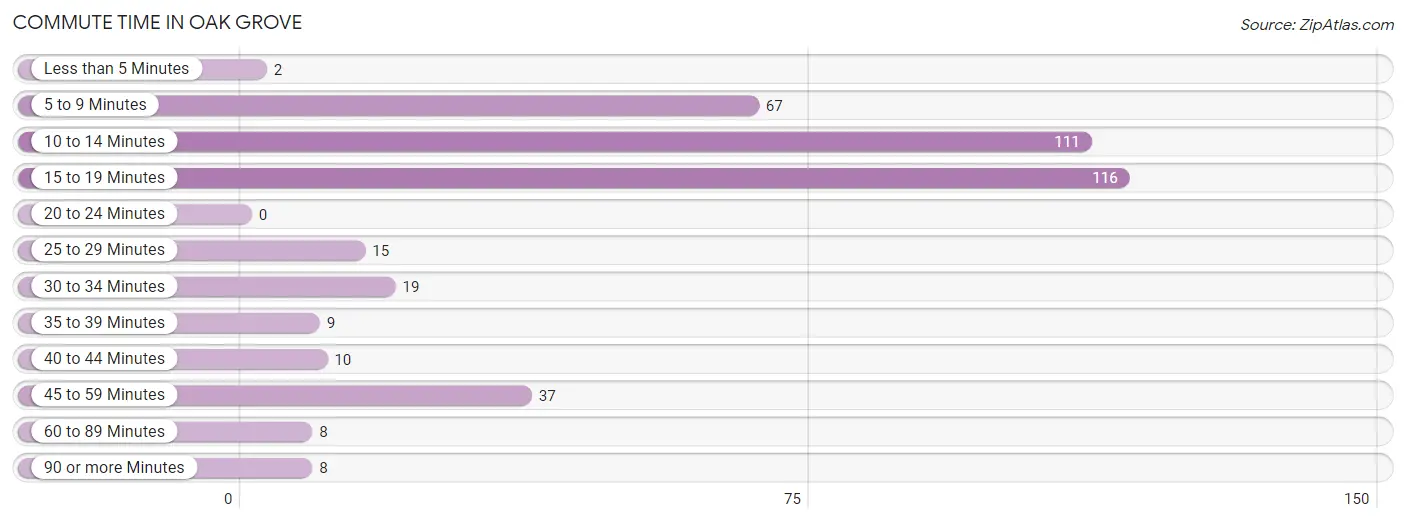
| Commute Time | # Commuters | % Commuters |
| Less than 5 Minutes | 2 | 0.5% |
| 5 to 9 Minutes | 67 | 16.7% |
| 10 to 14 Minutes | 111 | 27.6% |
| 15 to 19 Minutes | 116 | 28.9% |
| 20 to 24 Minutes | 0 | 0.0% |
| 25 to 29 Minutes | 15 | 3.7% |
| 30 to 34 Minutes | 19 | 4.7% |
| 35 to 39 Minutes | 9 | 2.2% |
| 40 to 44 Minutes | 10 | 2.5% |
| 45 to 59 Minutes | 37 | 9.2% |
| 60 to 89 Minutes | 8 | 2.0% |
| 90 or more Minutes | 8 | 2.0% |
Commute Time by Sex in Oak Grove
The most common commute times in Oak Grove are 10 to 14 minutes (96 commuters, 40.7%) for males and 5 to 9 minutes (43 commuters, 25.9%) for females.
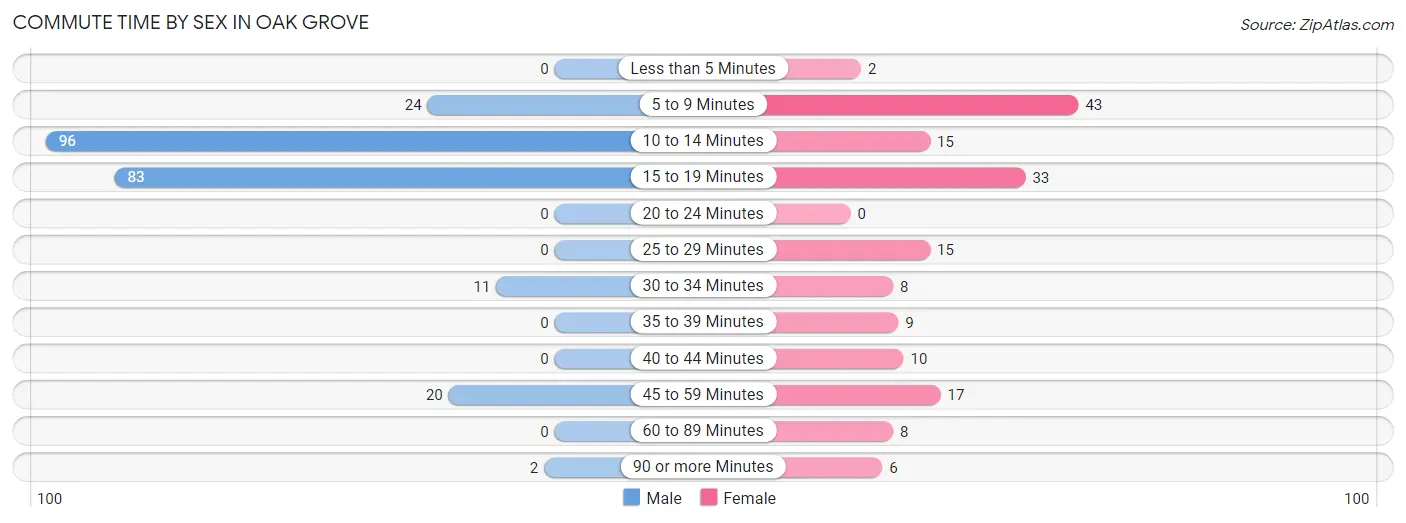
| Commute Time | Male | Female |
| Less than 5 Minutes | 0 (0.0%) | 2 (1.2%) |
| 5 to 9 Minutes | 24 (10.2%) | 43 (25.9%) |
| 10 to 14 Minutes | 96 (40.7%) | 15 (9.0%) |
| 15 to 19 Minutes | 83 (35.2%) | 33 (19.9%) |
| 20 to 24 Minutes | 0 (0.0%) | 0 (0.0%) |
| 25 to 29 Minutes | 0 (0.0%) | 15 (9.0%) |
| 30 to 34 Minutes | 11 (4.7%) | 8 (4.8%) |
| 35 to 39 Minutes | 0 (0.0%) | 9 (5.4%) |
| 40 to 44 Minutes | 0 (0.0%) | 10 (6.0%) |
| 45 to 59 Minutes | 20 (8.5%) | 17 (10.2%) |
| 60 to 89 Minutes | 0 (0.0%) | 8 (4.8%) |
| 90 or more Minutes | 2 (0.9%) | 6 (3.6%) |
Time of Departure to Work by Sex in Oak Grove
The most frequent times of departure to work in Oak Grove are 6:00 AM to 6:29 AM (104, 44.1%) for males and 7:30 AM to 7:59 AM (28, 16.9%) for females.
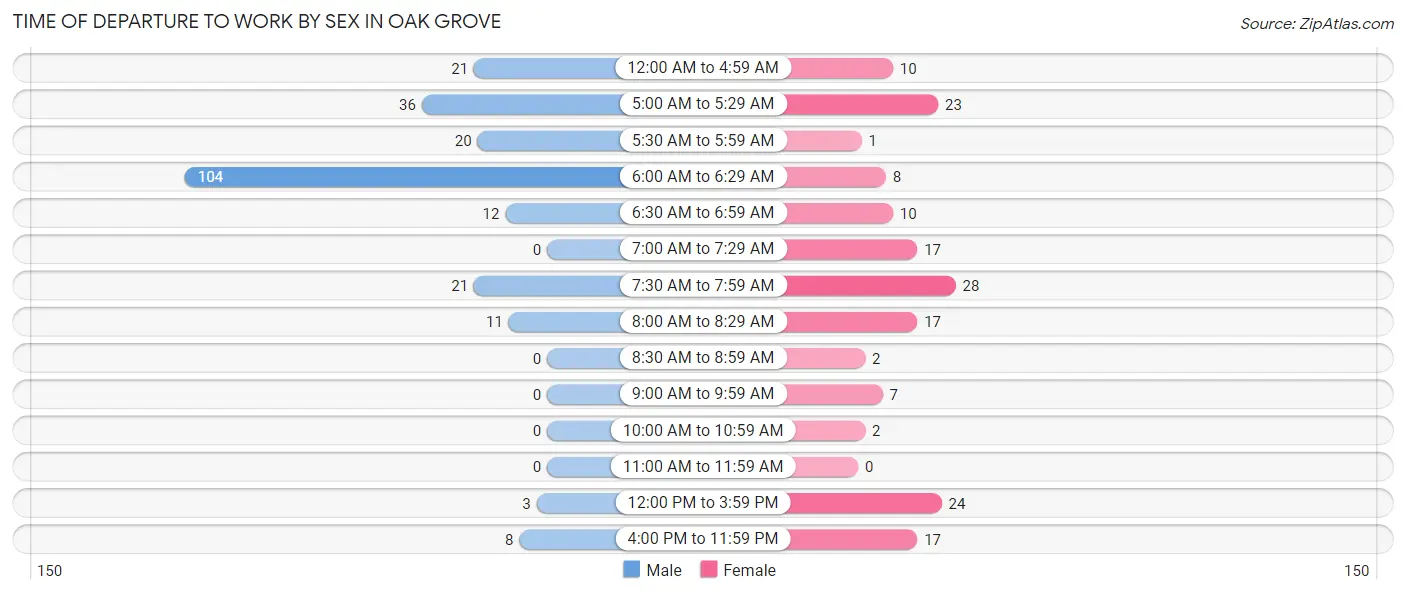
| Time of Departure | Male | Female |
| 12:00 AM to 4:59 AM | 21 (8.9%) | 10 (6.0%) |
| 5:00 AM to 5:29 AM | 36 (15.2%) | 23 (13.9%) |
| 5:30 AM to 5:59 AM | 20 (8.5%) | 1 (0.6%) |
| 6:00 AM to 6:29 AM | 104 (44.1%) | 8 (4.8%) |
| 6:30 AM to 6:59 AM | 12 (5.1%) | 10 (6.0%) |
| 7:00 AM to 7:29 AM | 0 (0.0%) | 17 (10.2%) |
| 7:30 AM to 7:59 AM | 21 (8.9%) | 28 (16.9%) |
| 8:00 AM to 8:29 AM | 11 (4.7%) | 17 (10.2%) |
| 8:30 AM to 8:59 AM | 0 (0.0%) | 2 (1.2%) |
| 9:00 AM to 9:59 AM | 0 (0.0%) | 7 (4.2%) |
| 10:00 AM to 10:59 AM | 0 (0.0%) | 2 (1.2%) |
| 11:00 AM to 11:59 AM | 0 (0.0%) | 0 (0.0%) |
| 12:00 PM to 3:59 PM | 3 (1.3%) | 24 (14.5%) |
| 4:00 PM to 11:59 PM | 8 (3.4%) | 17 (10.2%) |
| Total | 236 (100.0%) | 166 (100.0%) |
Housing Occupancy in Oak Grove
Occupancy by Ownership in Oak Grove
Of the total 376 dwellings in Oak Grove, owner-occupied units account for 310 (82.5%), while renter-occupied units make up 66 (17.5%).
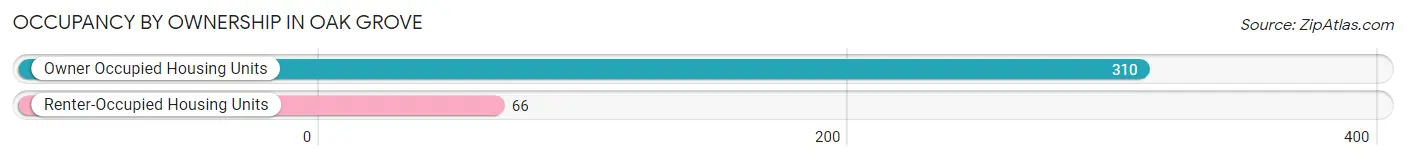
| Occupancy | # Housing Units | % Housing Units |
| Owner Occupied Housing Units | 310 | 82.5% |
| Renter-Occupied Housing Units | 66 | 17.5% |
| Total Occupied Housing Units | 376 | 100.0% |
Occupancy by Household Size in Oak Grove
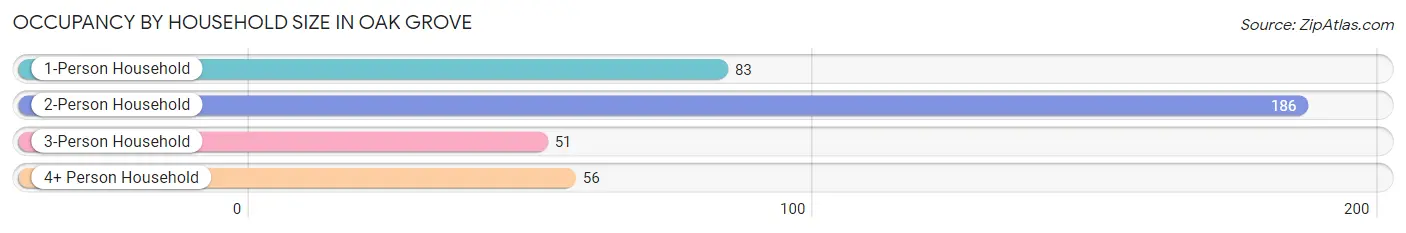
| Household Size | # Housing Units | % Housing Units |
| 1-Person Household | 83 | 22.1% |
| 2-Person Household | 186 | 49.5% |
| 3-Person Household | 51 | 13.6% |
| 4+ Person Household | 56 | 14.9% |
| Total Housing Units | 376 | 100.0% |
Occupancy by Ownership by Household Size in Oak Grove
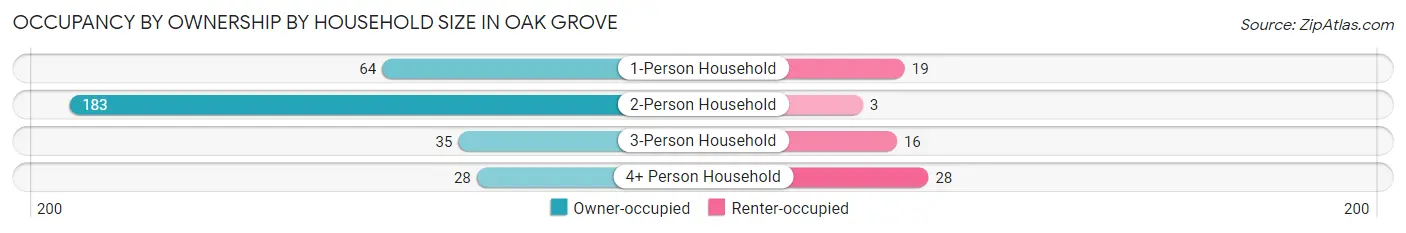
| Household Size | Owner-occupied | Renter-occupied |
| 1-Person Household | 64 (77.1%) | 19 (22.9%) |
| 2-Person Household | 183 (98.4%) | 3 (1.6%) |
| 3-Person Household | 35 (68.6%) | 16 (31.4%) |
| 4+ Person Household | 28 (50.0%) | 28 (50.0%) |
| Total Housing Units | 310 (82.5%) | 66 (17.5%) |
Occupancy by Educational Attainment in Oak Grove
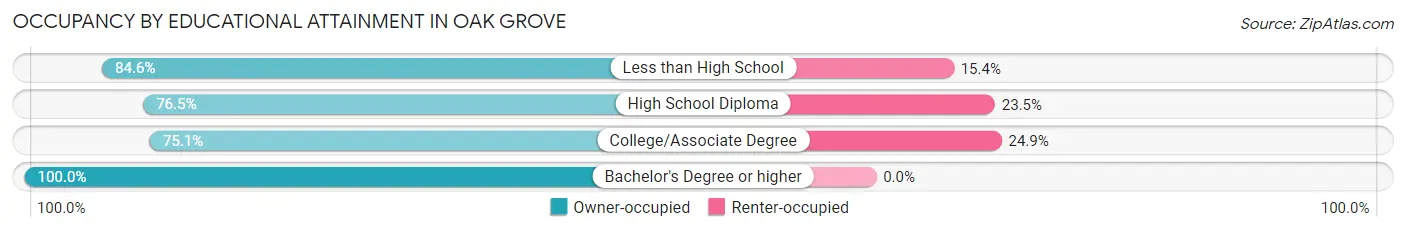
| Household Size | Owner-occupied | Renter-occupied |
| Less than High School | 33 (84.6%) | 6 (15.4%) |
| High School Diploma | 52 (76.5%) | 16 (23.5%) |
| College/Associate Degree | 133 (75.1%) | 44 (24.9%) |
| Bachelor's Degree or higher | 92 (100.0%) | 0 (0.0%) |
Occupancy by Age of Householder in Oak Grove
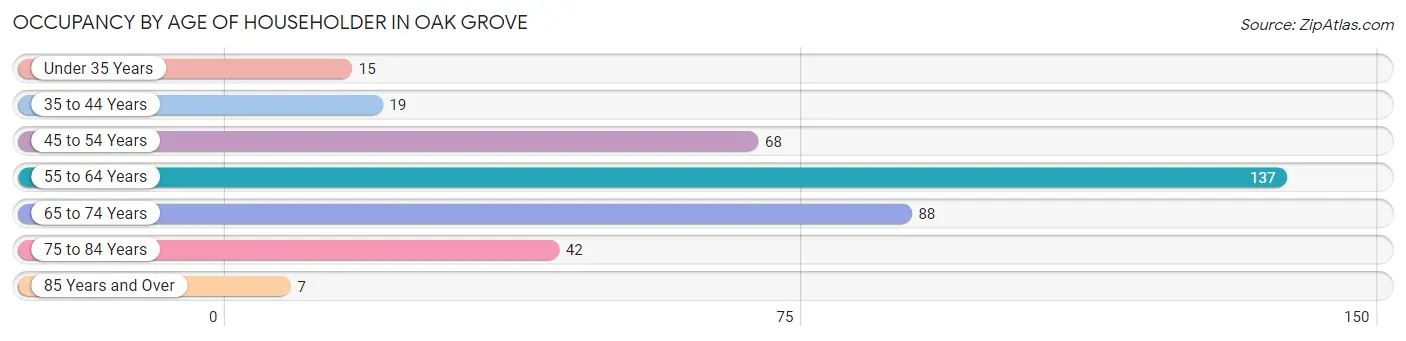
| Age Bracket | # Households | % Households |
| Under 35 Years | 15 | 4.0% |
| 35 to 44 Years | 19 | 5.1% |
| 45 to 54 Years | 68 | 18.1% |
| 55 to 64 Years | 137 | 36.4% |
| 65 to 74 Years | 88 | 23.4% |
| 75 to 84 Years | 42 | 11.2% |
| 85 Years and Over | 7 | 1.9% |
| Total | 376 | 100.0% |
Housing Finances in Oak Grove
Median Income by Occupancy in Oak Grove
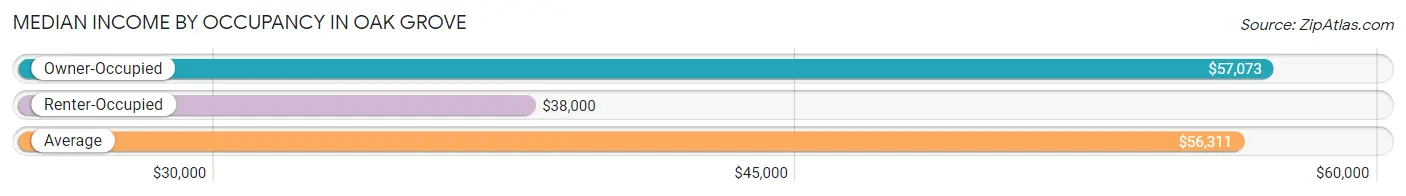
| Occupancy Type | # Households | Median Income |
| Owner-Occupied | 310 (82.5%) | $57,073 |
| Renter-Occupied | 66 (17.5%) | $38,000 |
| Average | 376 (100.0%) | $56,311 |
Occupancy by Householder Income Bracket in Oak Grove
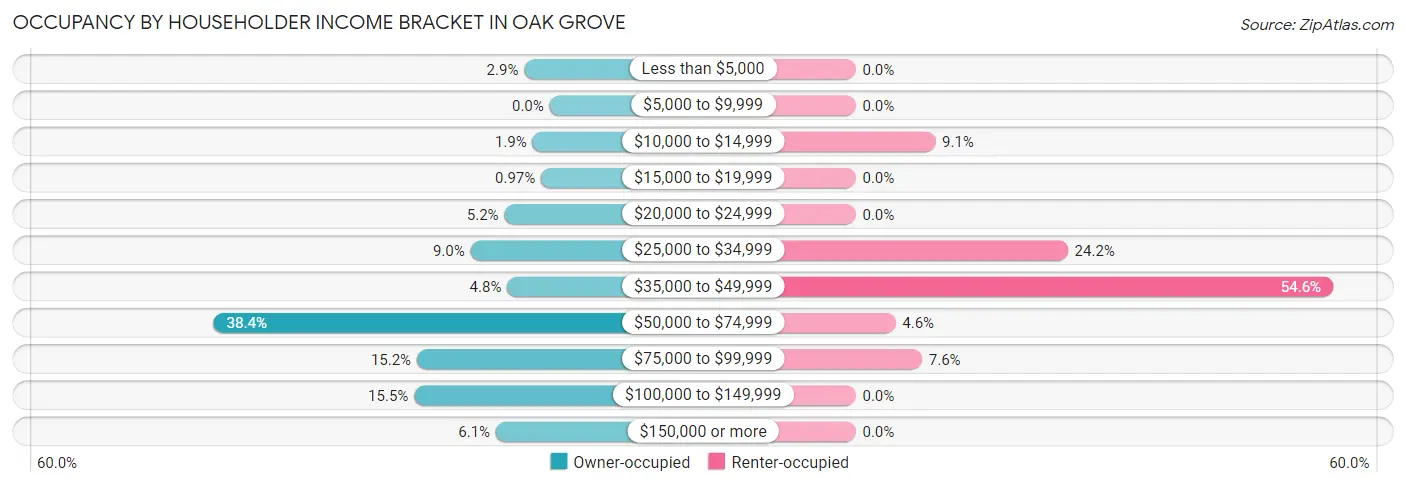
| Income Bracket | Owner-occupied | Renter-occupied |
| Less than $5,000 | 9 (2.9%) | 0 (0.0%) |
| $5,000 to $9,999 | 0 (0.0%) | 0 (0.0%) |
| $10,000 to $14,999 | 6 (1.9%) | 6 (9.1%) |
| $15,000 to $19,999 | 3 (1.0%) | 0 (0.0%) |
| $20,000 to $24,999 | 16 (5.2%) | 0 (0.0%) |
| $25,000 to $34,999 | 28 (9.0%) | 16 (24.2%) |
| $35,000 to $49,999 | 15 (4.8%) | 36 (54.5%) |
| $50,000 to $74,999 | 119 (38.4%) | 3 (4.5%) |
| $75,000 to $99,999 | 47 (15.2%) | 5 (7.6%) |
| $100,000 to $149,999 | 48 (15.5%) | 0 (0.0%) |
| $150,000 or more | 19 (6.1%) | 0 (0.0%) |
| Total | 310 (100.0%) | 66 (100.0%) |
Monthly Housing Cost Tiers in Oak Grove
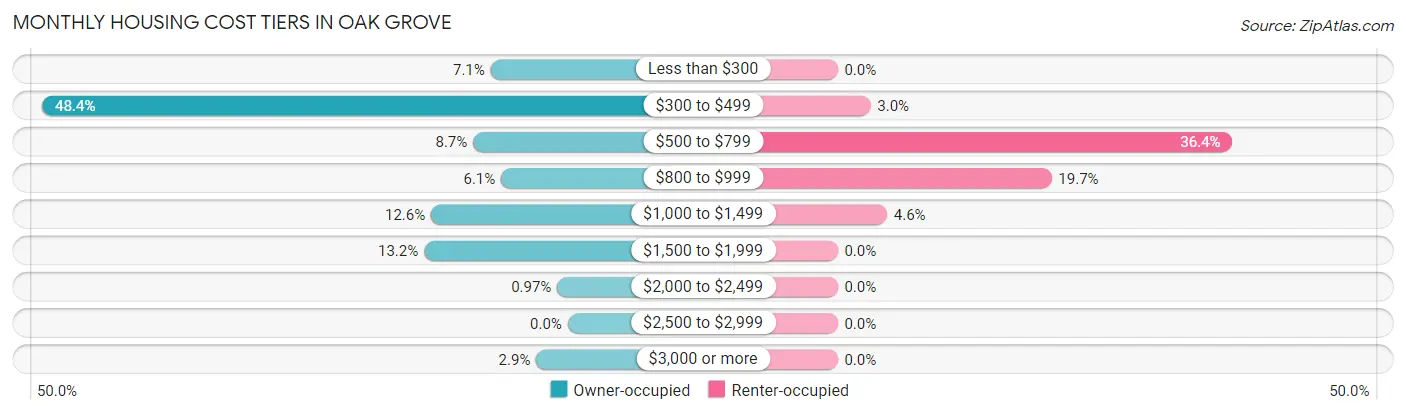
| Monthly Cost | Owner-occupied | Renter-occupied |
| Less than $300 | 22 (7.1%) | 0 (0.0%) |
| $300 to $499 | 150 (48.4%) | 2 (3.0%) |
| $500 to $799 | 27 (8.7%) | 24 (36.4%) |
| $800 to $999 | 19 (6.1%) | 13 (19.7%) |
| $1,000 to $1,499 | 39 (12.6%) | 3 (4.5%) |
| $1,500 to $1,999 | 41 (13.2%) | 0 (0.0%) |
| $2,000 to $2,499 | 3 (1.0%) | 0 (0.0%) |
| $2,500 to $2,999 | 0 (0.0%) | 0 (0.0%) |
| $3,000 or more | 9 (2.9%) | 0 (0.0%) |
| Total | 310 (100.0%) | 66 (100.0%) |
Physical Housing Characteristics in Oak Grove
Housing Structures in Oak Grove
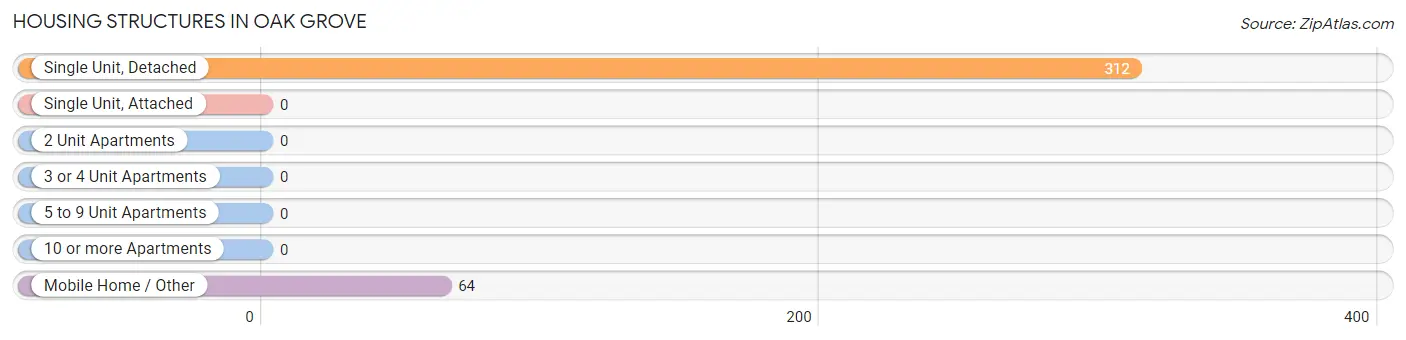
| Structure Type | # Housing Units | % Housing Units |
| Single Unit, Detached | 312 | 83.0% |
| Single Unit, Attached | 0 | 0.0% |
| 2 Unit Apartments | 0 | 0.0% |
| 3 or 4 Unit Apartments | 0 | 0.0% |
| 5 to 9 Unit Apartments | 0 | 0.0% |
| 10 or more Apartments | 0 | 0.0% |
| Mobile Home / Other | 64 | 17.0% |
| Total | 376 | 100.0% |
Housing Structures by Occupancy in Oak Grove
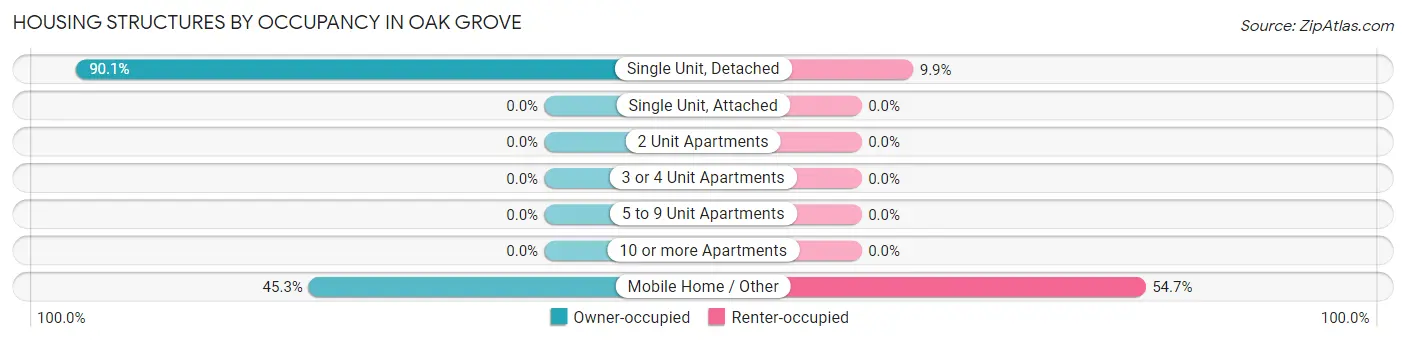
| Structure Type | Owner-occupied | Renter-occupied |
| Single Unit, Detached | 281 (90.1%) | 31 (9.9%) |
| Single Unit, Attached | 0 (0.0%) | 0 (0.0%) |
| 2 Unit Apartments | 0 (0.0%) | 0 (0.0%) |
| 3 or 4 Unit Apartments | 0 (0.0%) | 0 (0.0%) |
| 5 to 9 Unit Apartments | 0 (0.0%) | 0 (0.0%) |
| 10 or more Apartments | 0 (0.0%) | 0 (0.0%) |
| Mobile Home / Other | 29 (45.3%) | 35 (54.7%) |
| Total | 310 (82.5%) | 66 (17.5%) |
Housing Structures by Number of Rooms in Oak Grove
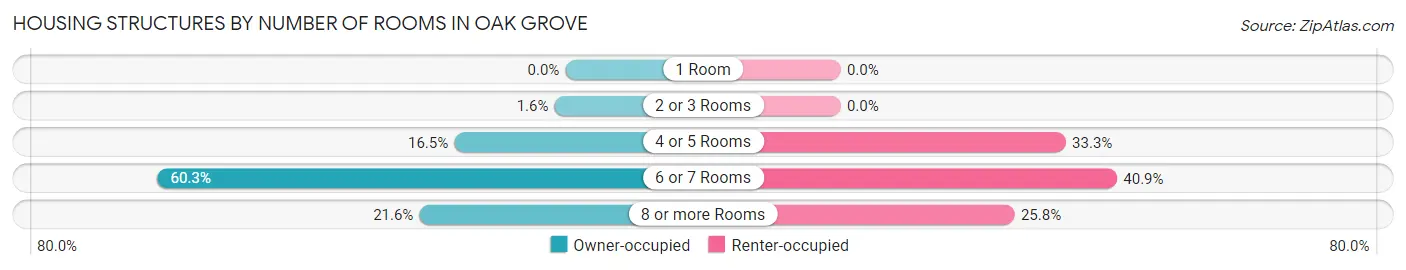
| Number of Rooms | Owner-occupied | Renter-occupied |
| 1 Room | 0 (0.0%) | 0 (0.0%) |
| 2 or 3 Rooms | 5 (1.6%) | 0 (0.0%) |
| 4 or 5 Rooms | 51 (16.5%) | 22 (33.3%) |
| 6 or 7 Rooms | 187 (60.3%) | 27 (40.9%) |
| 8 or more Rooms | 67 (21.6%) | 17 (25.8%) |
| Total | 310 (100.0%) | 66 (100.0%) |
Housing Structure by Heating Type in Oak Grove
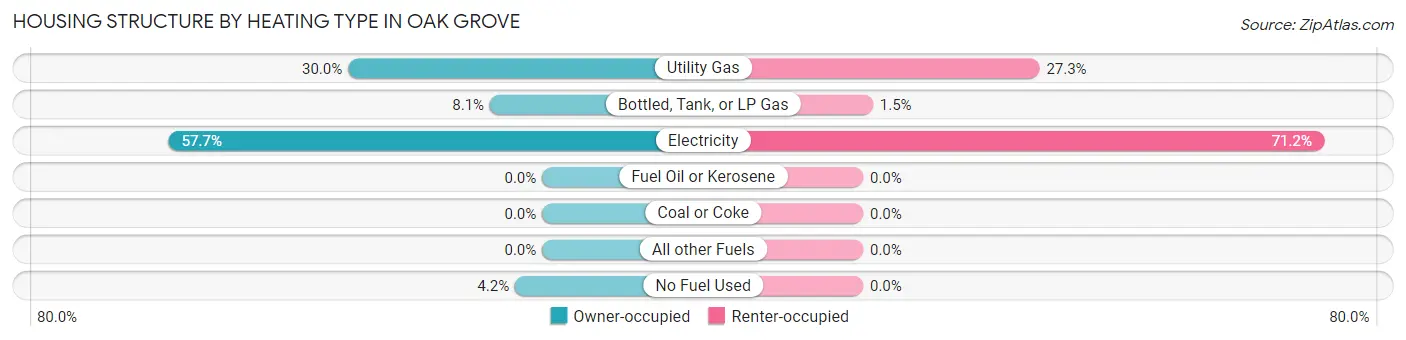
| Heating Type | Owner-occupied | Renter-occupied |
| Utility Gas | 93 (30.0%) | 18 (27.3%) |
| Bottled, Tank, or LP Gas | 25 (8.1%) | 1 (1.5%) |
| Electricity | 179 (57.7%) | 47 (71.2%) |
| Fuel Oil or Kerosene | 0 (0.0%) | 0 (0.0%) |
| Coal or Coke | 0 (0.0%) | 0 (0.0%) |
| All other Fuels | 0 (0.0%) | 0 (0.0%) |
| No Fuel Used | 13 (4.2%) | 0 (0.0%) |
| Total | 310 (100.0%) | 66 (100.0%) |
Household Vehicle Usage in Oak Grove
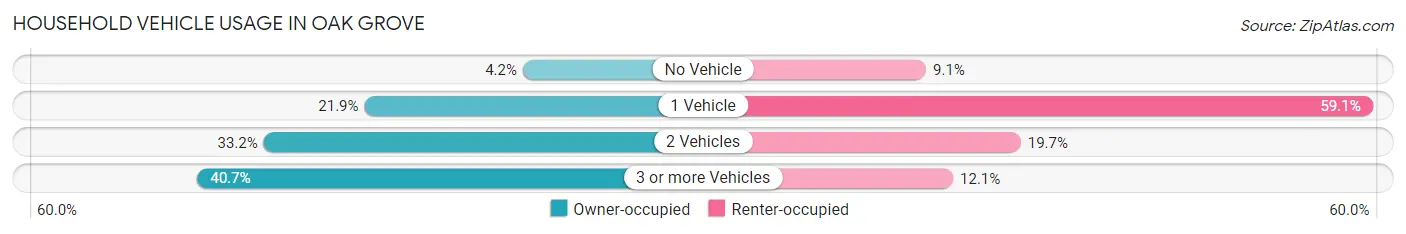
| Vehicles per Household | Owner-occupied | Renter-occupied |
| No Vehicle | 13 (4.2%) | 6 (9.1%) |
| 1 Vehicle | 68 (21.9%) | 39 (59.1%) |
| 2 Vehicles | 103 (33.2%) | 13 (19.7%) |
| 3 or more Vehicles | 126 (40.6%) | 8 (12.1%) |
| Total | 310 (100.0%) | 66 (100.0%) |
Real Estate & Mortgages in Oak Grove
Real Estate and Mortgage Overview in Oak Grove
| Characteristic | Without Mortgage | With Mortgage |
| Housing Units | 191 | 119 |
| Median Property Value | $98,400 | $170,200 |
| Median Household Income | $56,758 | $12 |
| Monthly Housing Costs | $375 | $9 |
| Real Estate Taxes | $466 | $15 |
Property Value by Mortgage Status in Oak Grove
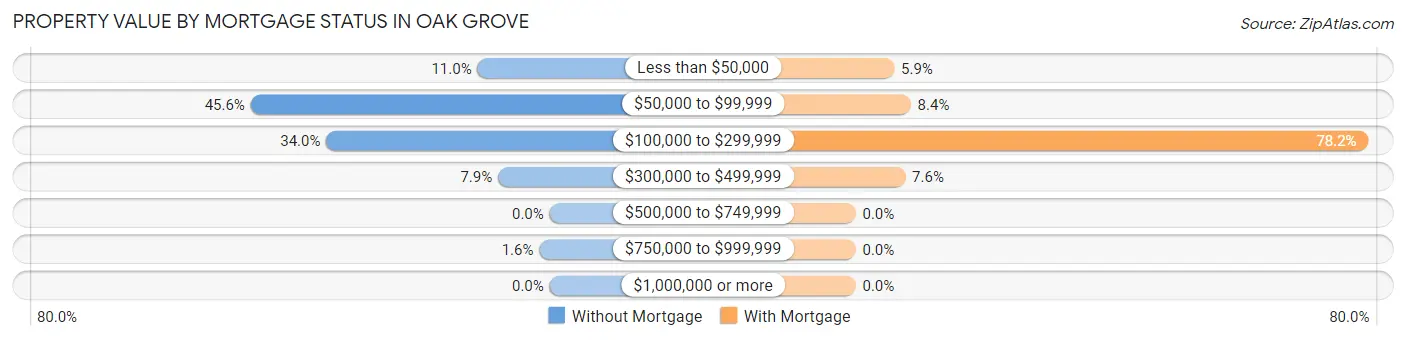
| Property Value | Without Mortgage | With Mortgage |
| Less than $50,000 | 21 (11.0%) | 7 (5.9%) |
| $50,000 to $99,999 | 87 (45.6%) | 10 (8.4%) |
| $100,000 to $299,999 | 65 (34.0%) | 93 (78.1%) |
| $300,000 to $499,999 | 15 (7.9%) | 9 (7.6%) |
| $500,000 to $749,999 | 0 (0.0%) | 0 (0.0%) |
| $750,000 to $999,999 | 3 (1.6%) | 0 (0.0%) |
| $1,000,000 or more | 0 (0.0%) | 0 (0.0%) |
| Total | 191 (100.0%) | 119 (100.0%) |
Household Income by Mortgage Status in Oak Grove
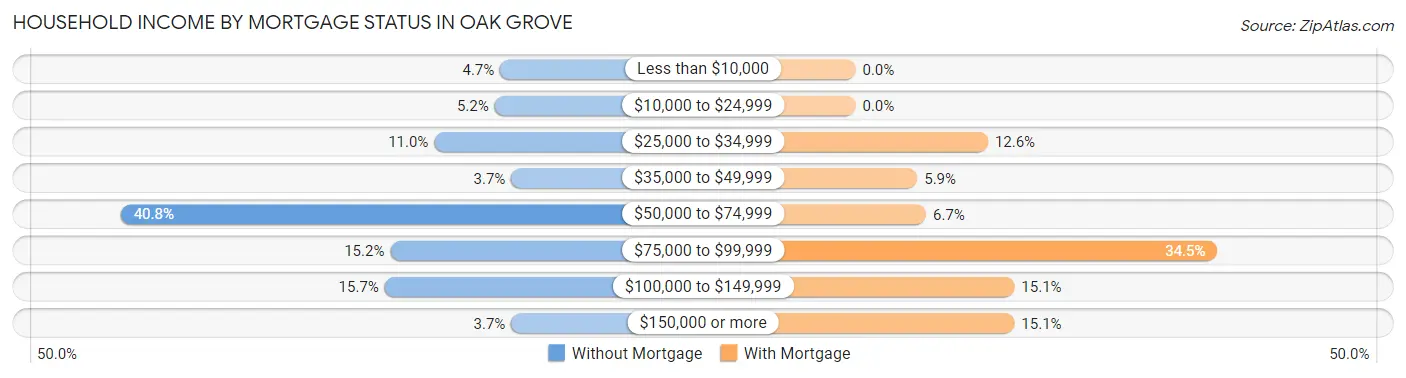
| Household Income | Without Mortgage | With Mortgage |
| Less than $10,000 | 9 (4.7%) | 0 (0.0%) |
| $10,000 to $24,999 | 10 (5.2%) | 0 (0.0%) |
| $25,000 to $34,999 | 21 (11.0%) | 15 (12.6%) |
| $35,000 to $49,999 | 7 (3.7%) | 7 (5.9%) |
| $50,000 to $74,999 | 78 (40.8%) | 8 (6.7%) |
| $75,000 to $99,999 | 29 (15.2%) | 41 (34.4%) |
| $100,000 to $149,999 | 30 (15.7%) | 18 (15.1%) |
| $150,000 or more | 7 (3.7%) | 18 (15.1%) |
| Total | 191 (100.0%) | 119 (100.0%) |
Property Value to Household Income Ratio in Oak Grove
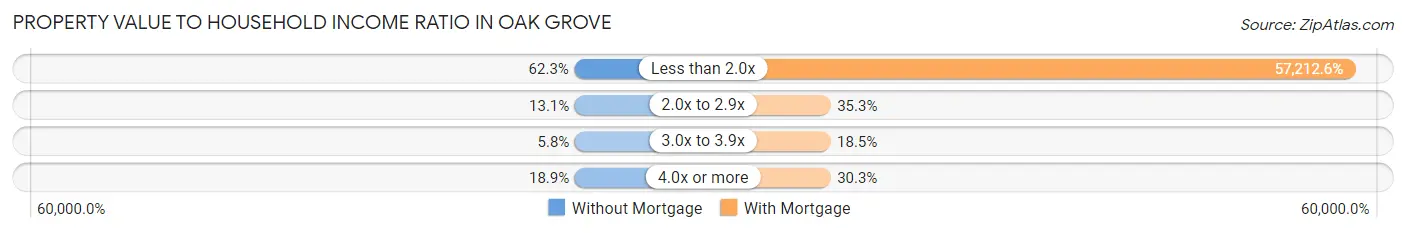
| Value-to-Income Ratio | Without Mortgage | With Mortgage |
| Less than 2.0x | 119 (62.3%) | 68,083 (57,212.6%) |
| 2.0x to 2.9x | 25 (13.1%) | 42 (35.3%) |
| 3.0x to 3.9x | 11 (5.8%) | 22 (18.5%) |
| 4.0x or more | 36 (18.9%) | 36 (30.2%) |
| Total | 191 (100.0%) | 119 (100.0%) |
Real Estate Taxes by Mortgage Status in Oak Grove
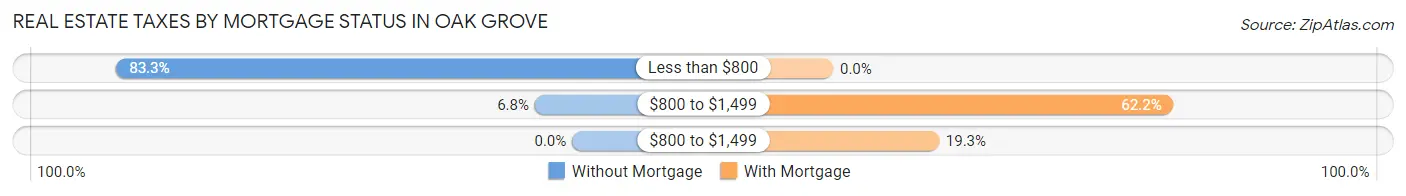
| Property Taxes | Without Mortgage | With Mortgage |
| Less than $800 | 159 (83.3%) | 0 (0.0%) |
| $800 to $1,499 | 13 (6.8%) | 74 (62.2%) |
| $800 to $1,499 | 0 (0.0%) | 23 (19.3%) |
| Total | 191 (100.0%) | 119 (100.0%) |
Health & Disability in Oak Grove
Health Insurance Coverage by Age in Oak Grove
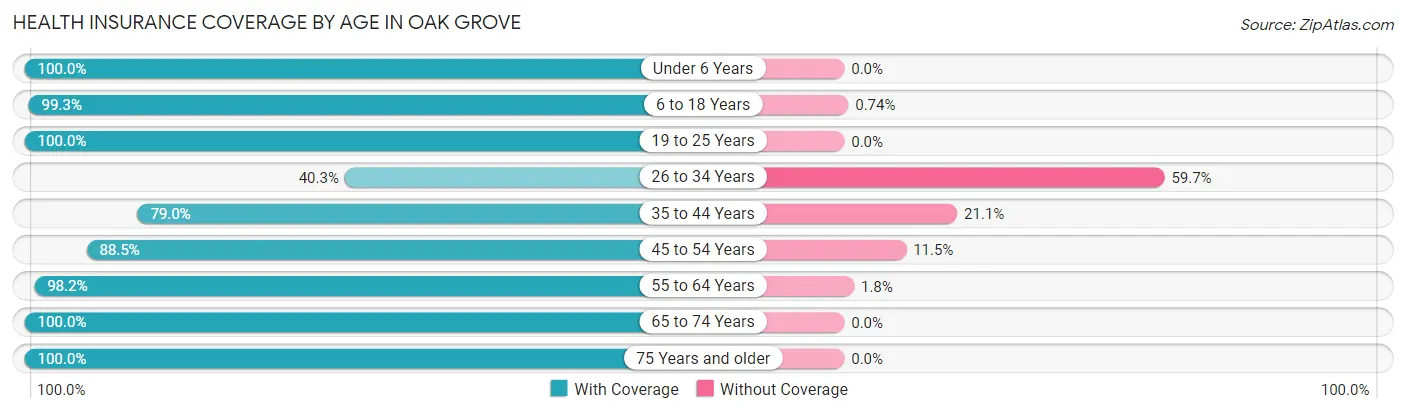
| Age Bracket | With Coverage | Without Coverage |
| Under 6 Years | 26 (100.0%) | 0 (0.0%) |
| 6 to 18 Years | 135 (99.3%) | 1 (0.7%) |
| 19 to 25 Years | 35 (100.0%) | 0 (0.0%) |
| 26 to 34 Years | 27 (40.3%) | 40 (59.7%) |
| 35 to 44 Years | 90 (78.9%) | 24 (21.0%) |
| 45 to 54 Years | 92 (88.5%) | 12 (11.5%) |
| 55 to 64 Years | 218 (98.2%) | 4 (1.8%) |
| 65 to 74 Years | 166 (100.0%) | 0 (0.0%) |
| 75 Years and older | 60 (100.0%) | 0 (0.0%) |
| Total | 849 (91.3%) | 81 (8.7%) |
Health Insurance Coverage by Citizenship Status in Oak Grove

| Citizenship Status | With Coverage | Without Coverage |
| Native Born | 26 (100.0%) | 0 (0.0%) |
| Foreign Born, Citizen | 135 (99.3%) | 1 (0.7%) |
| Foreign Born, not a Citizen | 35 (100.0%) | 0 (0.0%) |
Health Insurance Coverage by Household Income in Oak Grove
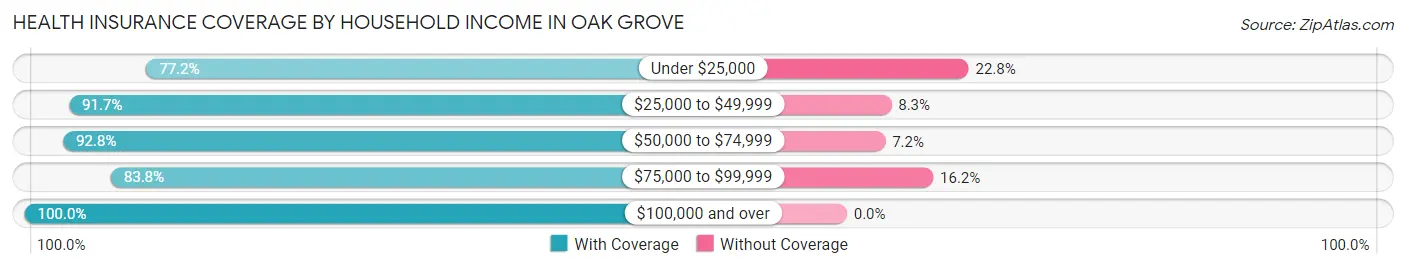
| Household Income | With Coverage | Without Coverage |
| Under $25,000 | 44 (77.2%) | 13 (22.8%) |
| $25,000 to $49,999 | 253 (91.7%) | 23 (8.3%) |
| $50,000 to $74,999 | 232 (92.8%) | 18 (7.2%) |
| $75,000 to $99,999 | 140 (83.8%) | 27 (16.2%) |
| $100,000 and over | 180 (100.0%) | 0 (0.0%) |
Public vs Private Health Insurance Coverage by Age in Oak Grove
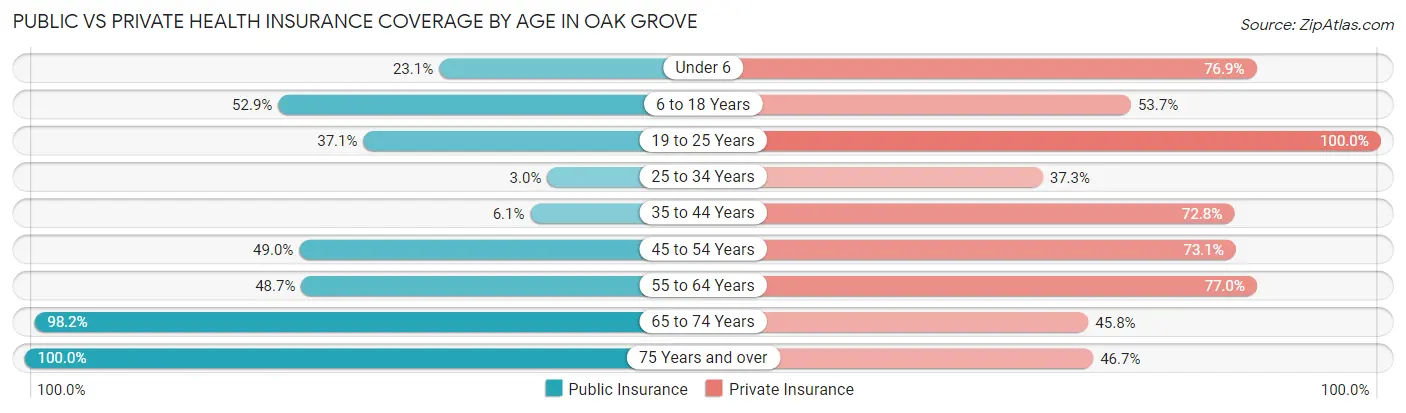
| Age Bracket | Public Insurance | Private Insurance |
| Under 6 | 6 (23.1%) | 20 (76.9%) |
| 6 to 18 Years | 72 (52.9%) | 73 (53.7%) |
| 19 to 25 Years | 13 (37.1%) | 35 (100.0%) |
| 25 to 34 Years | 2 (3.0%) | 25 (37.3%) |
| 35 to 44 Years | 7 (6.1%) | 83 (72.8%) |
| 45 to 54 Years | 51 (49.0%) | 76 (73.1%) |
| 55 to 64 Years | 108 (48.6%) | 171 (77.0%) |
| 65 to 74 Years | 163 (98.2%) | 76 (45.8%) |
| 75 Years and over | 60 (100.0%) | 28 (46.7%) |
| Total | 482 (51.8%) | 587 (63.1%) |
Disability Status by Sex by Age in Oak Grove
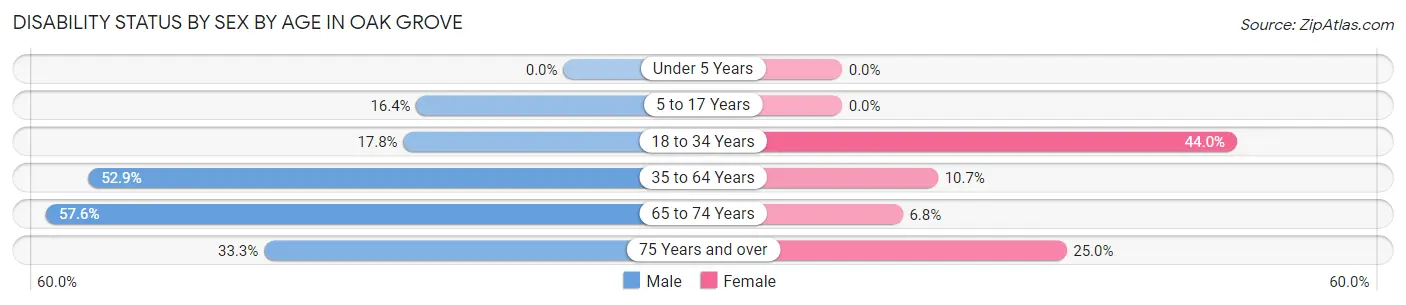
| Age Bracket | Male | Female |
| Under 5 Years | 0 (0.0%) | 0 (0.0%) |
| 5 to 17 Years | 9 (16.4%) | 0 (0.0%) |
| 18 to 34 Years | 13 (17.8%) | 22 (44.0%) |
| 35 to 64 Years | 109 (52.9%) | 25 (10.7%) |
| 65 to 74 Years | 53 (57.6%) | 5 (6.8%) |
| 75 Years and over | 8 (33.3%) | 9 (25.0%) |
Disability Class by Sex by Age in Oak Grove
Disability Class: Hearing Difficulty
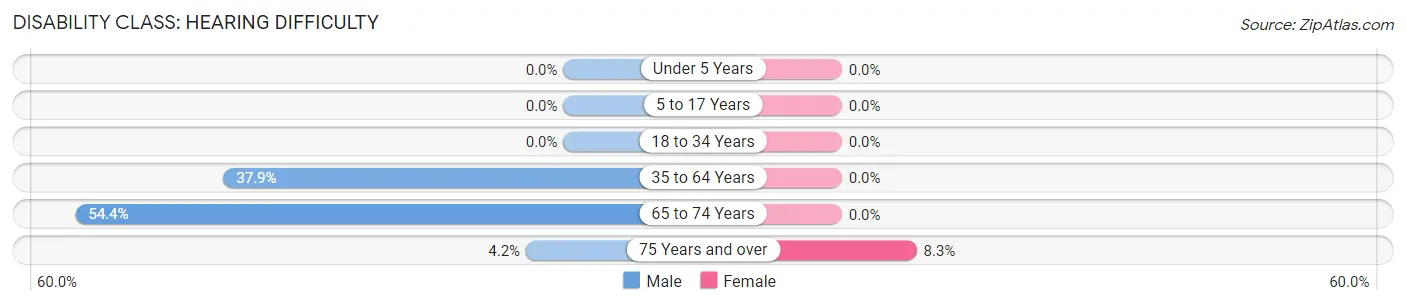
| Age Bracket | Male | Female |
| Under 5 Years | 0 (0.0%) | 0 (0.0%) |
| 5 to 17 Years | 0 (0.0%) | 0 (0.0%) |
| 18 to 34 Years | 0 (0.0%) | 0 (0.0%) |
| 35 to 64 Years | 78 (37.9%) | 0 (0.0%) |
| 65 to 74 Years | 50 (54.3%) | 0 (0.0%) |
| 75 Years and over | 1 (4.2%) | 3 (8.3%) |
Disability Class: Vision Difficulty
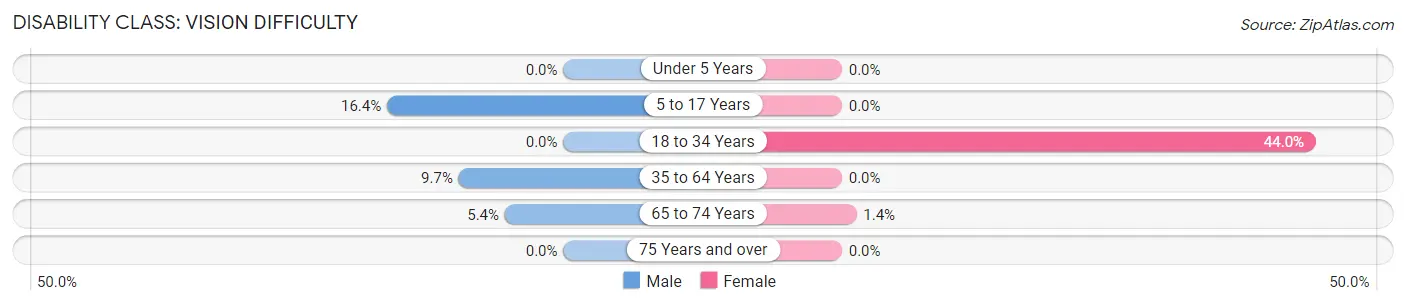
| Age Bracket | Male | Female |
| Under 5 Years | 0 (0.0%) | 0 (0.0%) |
| 5 to 17 Years | 9 (16.4%) | 0 (0.0%) |
| 18 to 34 Years | 0 (0.0%) | 22 (44.0%) |
| 35 to 64 Years | 20 (9.7%) | 0 (0.0%) |
| 65 to 74 Years | 5 (5.4%) | 1 (1.3%) |
| 75 Years and over | 0 (0.0%) | 0 (0.0%) |
Disability Class: Cognitive Difficulty
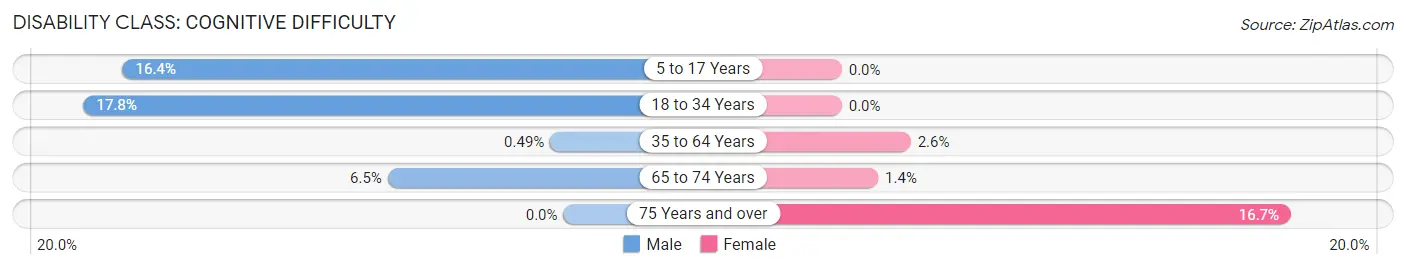
| Age Bracket | Male | Female |
| 5 to 17 Years | 9 (16.4%) | 0 (0.0%) |
| 18 to 34 Years | 13 (17.8%) | 0 (0.0%) |
| 35 to 64 Years | 1 (0.5%) | 6 (2.6%) |
| 65 to 74 Years | 6 (6.5%) | 1 (1.3%) |
| 75 Years and over | 0 (0.0%) | 6 (16.7%) |
Disability Class: Ambulatory Difficulty
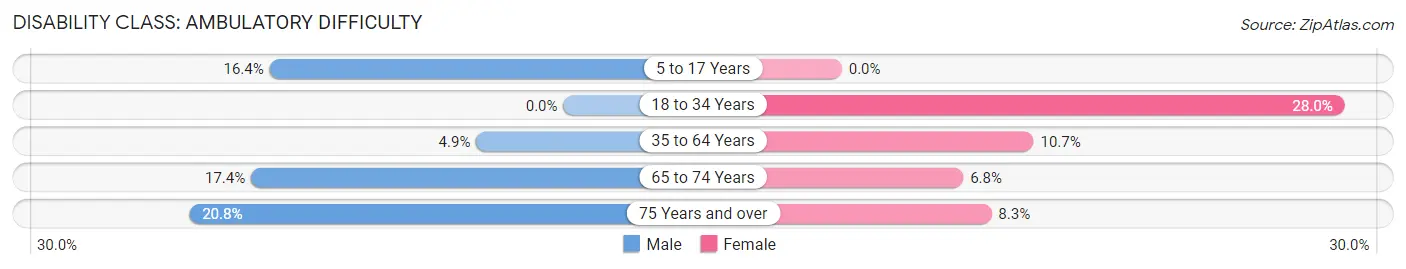
| Age Bracket | Male | Female |
| 5 to 17 Years | 9 (16.4%) | 0 (0.0%) |
| 18 to 34 Years | 0 (0.0%) | 14 (28.0%) |
| 35 to 64 Years | 10 (4.9%) | 25 (10.7%) |
| 65 to 74 Years | 16 (17.4%) | 5 (6.8%) |
| 75 Years and over | 5 (20.8%) | 3 (8.3%) |
Disability Class: Self-Care Difficulty
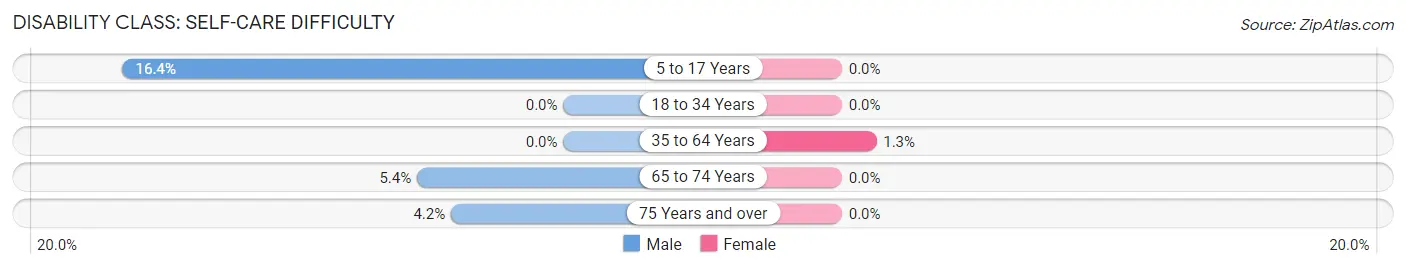
| Age Bracket | Male | Female |
| 5 to 17 Years | 9 (16.4%) | 0 (0.0%) |
| 18 to 34 Years | 0 (0.0%) | 0 (0.0%) |
| 35 to 64 Years | 0 (0.0%) | 3 (1.3%) |
| 65 to 74 Years | 5 (5.4%) | 0 (0.0%) |
| 75 Years and over | 1 (4.2%) | 0 (0.0%) |
Technology Access in Oak Grove
Computing Device Access in Oak Grove
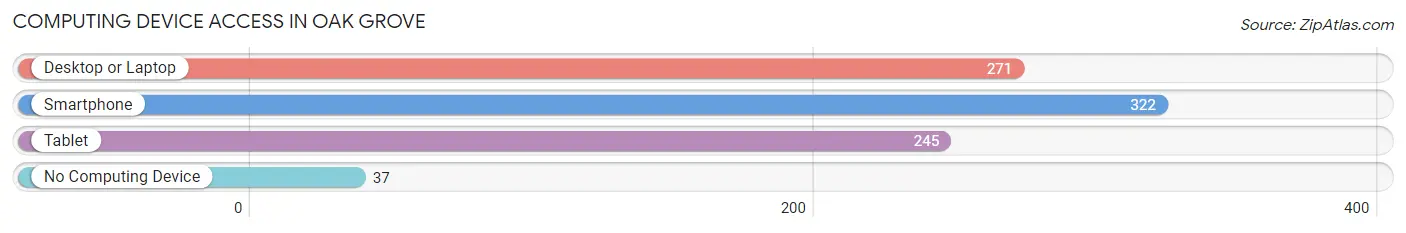
| Device Type | # Households | % Households |
| Desktop or Laptop | 271 | 72.1% |
| Smartphone | 322 | 85.6% |
| Tablet | 245 | 65.2% |
| No Computing Device | 37 | 9.8% |
| Total | 376 | 100.0% |
Internet Access in Oak Grove
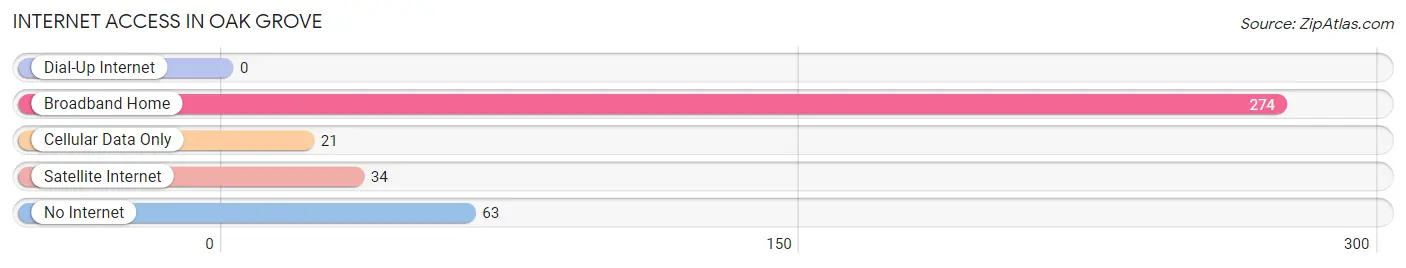
| Internet Type | # Households | % Households |
| Dial-Up Internet | 0 | 0.0% |
| Broadband Home | 274 | 72.9% |
| Cellular Data Only | 21 | 5.6% |
| Satellite Internet | 34 | 9.0% |
| No Internet | 63 | 16.8% |
| Total | 376 | 100.0% |
Oak Grove Summary
Oak Grove is a small unincorporated community located in the northwest corner of Jefferson County, Alabama. It is situated on the banks of the Black Warrior River, approximately 20 miles northwest of Birmingham. The community is home to a population of approximately 1,000 people, and is part of the Birmingham-Hoover Metropolitan Statistical Area.
History
Oak Grove was first settled in the early 1800s by settlers from the Carolinas and Virginia. The community was originally known as “Oak Grove Crossroads” due to its location at the intersection of two major roads. The first post office was established in 1845, and the community was officially incorporated in 1887.
In the late 1800s, Oak Grove was a thriving agricultural community, with cotton, corn, and other crops being grown in the area. The community also had a number of small businesses, including a general store, a blacksmith shop, and a grist mill.
In the early 1900s, Oak Grove began to experience a period of growth and development. The community was connected to the outside world by the Birmingham and Northwestern Railroad, which ran through the area. This allowed for the shipment of goods and services to and from the community.
In the mid-1900s, Oak Grove experienced a period of decline. The railroad was abandoned, and the community’s businesses began to close. The population began to decline as well, and by the 1970s, the population had dropped to just over 500 people.
Geography
Oak Grove is located in the northwest corner of Jefferson County, Alabama. It is situated on the banks of the Black Warrior River, approximately 20 miles northwest of Birmingham. The community is located in the foothills of the Appalachian Mountains, and is surrounded by rolling hills and forests.
The climate in Oak Grove is humid subtropical, with hot, humid summers and mild winters. The average annual temperature is around 65 degrees Fahrenheit, and the average annual precipitation is around 50 inches.
Economy
Oak Grove’s economy is largely based on agriculture. The community is home to a number of small farms, which produce a variety of crops, including cotton, corn, soybeans, and wheat. The community also has a number of small businesses, including a general store, a blacksmith shop, and a grist mill.
Demographics
As of the 2010 census, Oak Grove had a population of 1,000 people. The racial makeup of the community was 97.2% White, 0.7% African American, 0.3% Native American, 0.2% Asian, and 1.6% from other races. The median household income was $37,500, and the median family income was $41,250. The per capita income was $17,500.
Conclusion
Oak Grove is a small unincorporated community located in the northwest corner of Jefferson County, Alabama. It is situated on the banks of the Black Warrior River, approximately 20 miles northwest of Birmingham. The community is home to a population of approximately 1,000 people, and is part of the Birmingham-Hoover Metropolitan Statistical Area. The economy of Oak Grove is largely based on agriculture, and the community is home to a number of small farms and businesses. The racial makeup of the community is predominantly White, with a small percentage of African American, Native American, and Asian residents.
Common Questions
What is the Total Population of Oak Grove?
Total Population of Oak Grove is 930.
What is the Total Male Population of Oak Grove?
Total Male Population of Oak Grove is 465.
What is the Total Female Population of Oak Grove?
Total Female Population of Oak Grove is 465.
What is the Ratio of Males per 100 Females in Oak Grove?
There are 100.00 Males per 100 Females in Oak Grove.
What is the Ratio of Females per 100 Males in Oak Grove?
There are 100.00 Females per 100 Males in Oak Grove.
What is the Median Population Age in Oak Grove?
Median Population Age in Oak Grove is 50.6 Years.
What is the Average Family Size in Oak Grove
Average Family Size in Oak Grove is 2.8 People.
What is the Average Household Size in Oak Grove
Average Household Size in Oak Grove is 2.5 People.
What is Per Capita Income in Oak Grove?
Per Capita income in Oak Grove is $27,801.
What is the Median Family Income in Oak Grove?
Median Family Income in Oak Grove is $56,296.
What is the Median Household income in Oak Grove?
Median Household Income in Oak Grove is $56,311.
What is Income or Wage Gap in Oak Grove?
Income or Wage Gap in Oak Grove is 0.3%.
Women in Oak Grove earn 99.7 cents for every dollar earned by a man.
What is Inequality or Gini Index in Oak Grove?
Inequality or Gini Index in Oak Grove is 0.32.
How Large is the Labor Force in Oak Grove?
There are 436 People in the Labor Forcein in Oak Grove.
What is the Percentage of People in the Labor Force in Oak Grove?
54.3% of People are in the Labor Force in Oak Grove.
What is the Unemployment Rate in Oak Grove?
Unemployment Rate in Oak Grove is 4.6%.